Postnatal maturation of somatostatin-expressing inhibitory cells in the somatosensory cortex of GIN mice
- Department of Neurobiology, University of Pittsburgh School of Medicine, Pittsburgh, PA, USA
Postnatal inhibitory neuron development affects mammalian brain function, and failure of this maturation process may underlie pathological conditions such as epilepsy, schizophrenia, and depression. Furthermore, understanding how physiological properties of inhibitory neurons change throughout development is critical to understanding the role(s) these cells play in cortical processing. One subset of inhibitory neurons that may be affected during postnatal development is somatostatin-expressing (SOM) cells. A subset of these cells is labeled with green-fluorescent protein (GFP) in a line of mice known as the GFP-positive inhibitory neurons (GIN) line. Here, we studied how intrinsic electrophysiological properties of these cells changed in the somatosensory cortex of GIN mice between postnatal ages P11 and P32+. GIN cells were targeted for whole-cell current-clamp recordings and ranges of positive and negative current steps were presented to each cell. The results showed that as the neocortical circuitry matured during this critical time period multiple intrinsic and firing properties of GIN inhibitory neurons, as well as those of excitatory (regular-spiking [RS]) cells, were altered. Furthermore, these changes were such that the output of GIN cells, but not RS cells, increased over this developmental period. We quantified changes in excitability by examining the input–output relationship of both GIN and RS cells. We found that the firing frequency of GIN cells increased with age, while the rheobase current remained constant across development. This created a multiplicative increase in the input–output relationship of the GIN cells, leading to increases in gain with age. The input–output relationship of the RS cells, on the other hand, showed primarily a subtractive shift with age, but no substantial change in gain. These results suggest that as the neocortex matures, inhibition coming from GIN cells may become more influential in the circuit and play a greater role in the modulation of neocortical activity.
Introduction
The second and third postnatal weeks are a period of massive developmental change within the rodent neocortex. This is the time of sensory onset for multiple sensory modalities, including the visual, auditory, and somatosensory systems (Welker, 1964; Ehret, 1976; Hensch, 2005). This time window represents a “critical period” for the brain, as the organization of neural circuitry that develops within this time remains relatively fixed throughout adulthood. Diseases such as schizophrenia, which do not appear until late adolescence in humans, are thought to be a manifestation of pathological alterations in developmental processes, potentially in inhibitory neurons (Lewis et al., 2005). Understanding the development of cortical circuits during this period is therefore an important component to understanding both normal and pathological cortical function.
Maturation of inhibitory circuitry is of particular importance for shaping cortical activity during postnatal development (Hensch, 2005). Investigation of inhibitory interneuron development in multiple cortical areas reveals that during the second to third postnatal weeks, inhibitory cells undergo changes in their physiological, molecular, and anatomical characteristics and do not reach maturation until the third week of postnatal development or later (Goldberg et al., 2011; Lazarus and Huang, 2011; Oswald and Reyes, 2011). In mice and rats, the animals first begin actively using their whiskers around postnatal day 14, signaling the onset of active sensory processing within the somatosensory system (Welker, 1964; Mosconi et al., 2010). During the first few weeks of postnatal development, inhibition onto pyramidal neurons in somatosensory cortex increases in amplitude and frequency (Kobayashi et al., 2008), and alterations in sensory experience, such as whisker removal, cause substantial disruptions to the intrinsic and synaptic properties of inhibitory interneurons (Jiao et al., 2006, 2011; Daw et al., 2007; Lee et al., 2007; Chittajallu and Isaac, 2010).
Understanding maturation of inhibitory circuits is important for determining how neurons control synaptic integration and communication within and amongst cortical areas during development. Most studies investigating how development of inhibitory neurons affects cortical circuitry have focused on one type of inhibitory neuron, known as the fast-spiking (FS) or parvalbumin-expressing (PV) cells. These cells represent a major subtype of inhibitory neurons, but only constitute approximately half of inhibitory neurons as a whole (Markram et al., 2004). A second major class of inhibitory neurons is the somatostatin-expressing (SOM) inhibitory cells. However, the developmental trajectory of SOM cells in the somatosensory system is largely unknown. One recent study found that the intrinsic properties of SOM cells in the visual cortex change during the third postnatal week and suggested SOM cells may be involved in ocular dominance plasticity (Lazarus and Huang, 2011).
The role of SOM inhibitory cells in the neocortex has yet to be fully understood. Because the properties of these cells differ significantly from other inhibitory cells, such as PV cells, it is thought that they could play a unique role in neocortical processing. In contrast to PV cells, which target the perisomatic regions of their downstream cells, SOM cells primarily target the dendrites of pyramidal neurons. They may, therefore, be important for regulating and modulating incoming synaptic inputs. Recent in vivo recordings from superficial SOM cells in mouse somatosensory cortex have found that activity in SOM cells is suppressed during both passive whisker deflection and during active whisking states (Gentet et al., 2012). This loss of dendritic inhibition may function to allow excitatory inputs on the distal dendrites to summate and propagate to the soma more effectively. This may be particularly relevant during awake states when activity in the dendrites is enhanced (Murayama and Larkum, 2009). Activation of SOM cells has also been shown to effectively prevent pyramidal neurons from producing “bursts” of action potentials that are generated in the apical dendrite through active dendritic currents (Larkum et al., 1999; Gentet et al., 2012; Lovett-Barron et al., 2012). In addition, SOM cells are extensively coupled to each other through gap junctions (Gibson et al., 1999; Fanselow et al., 2008). Alterations in intrinsic properties with age could change how SOM cells act as an electrically coupled network, such as by changing their tendency to correlate or synchronize their activity (Amitai et al., 2002; Long et al., 2005; de la Rocha et al., 2007).
Across the SOM interneuron population there exists a degree of variability in the morphology, physiological characteristics, and co-expression of additional neuropeptides. Whether this reflects variability within a single class or is sufficiently diverse to warrant multiple subtypes is unclear (Ma et al., 2006; Sugino et al., 2006; McGarry et al., 2010). This issue has been partially addressed by the creation of transgenic mouse lines that express a fluorescent molecule, such as green fluorescent protein (GFP), in particular subsets of inhibitory neurons. Here, we used such a mouse line to study SOM inhibitory cells by utilizing a line of mice that expresses GFP in approximately one-third of SOM cells (Oliva et al., 2000). In these mice, the GFP-positive inhibitory neurons (“GIN”) express the neuropeptide, SOM, exhibit adapting responses to intracellular current steps, and are often of Martinotti morphology with an axon traveling up to layer 1 and ramifying extensively (Oliva et al., 2000; Halabisky et al., 2006; Ma et al., 2006; Fanselow et al., 2008).
Understanding the normal trajectory of GIN cell maturation serves several purposes. First, it helps clarify the physiological role(s) these cells can play during different stages of postnatal development by indicating how intrinsic properties of GIN cells change over age, how readily these cells are excited and what their firing characteristics are once activated. Second, it will help us learn how to best distinguish between types and subtypes of inhibitory neurons even as their physiological characteristics, which are often used as factors to distinguish between cell types (Kawaguchi, 1995; Kawaguchi and Kubota, 1996; Kawaguchi and Kondo, 2002; Markram et al., 2004; Ascoli et al., 2008), change systematically with age. Finally, the way circuitry of excitatory and inhibitory neurons changes at different stages of maturation may help us determine causes and mechanisms of abnormal cortical development (Dani et al., 2005; Lewis et al., 2005; Yizhar et al., 2011).
Here, we characterized the intrinsic physiological properties of GIN cells and regular-spiking (RS) excitatory cells in the mouse primary somatosensory cortex during a developmental period (P11–P32+) that encompasses changes in multiple intrinsic cellular properties in somatosensory cortex (Maravall et al., 2004; Jiao et al., 2006, 2011; Goldberg et al., 2011) as well as whisking onset. We found that changes in sub- and supra-threshold properties occurred in both cell types, collectively resulting in an increase in GIN cell excitability and no change in RS cell excitability as a function of age. These results suggest that as the neocortical circuit develops, GIN cells may increasingly participate in sensory processing within somatosensory cortex.
Materials and Methods
Slicing Procedure
All experiments were carried out in compliance with the University of Pittsburgh School of Medicine animal use policies and were approved by the University of Pittsburgh Institutional Animal Care and Use Committee. Thalamocortical slices from mouse somatosensory cortex were prepared as previously described (Agmon and Connors, 1991). In addition, a subset of cells was recorded from coronal sections of the same brain region. No systematic differences between these two slicing angles were observed, so the data were pooled.
Recording Procedures
Whole-cell current-clamp recordings were performed using micropipettes (4–7 MΩ) filled with internal solution containing (in mM): 135 K-gluconate, 4 KCl, 2 NaCl, 10 HEPES, 0.2 EGTA, 4 ATP-Mg, 0.3 GTP-Tris, and 14 phosphocreatine-Tris (pH 7.25, 280–290 mOsm). Membrane potentials reported here were not corrected for the liquid junction potential. Recordings were conducted at 32°C. When patching, cell-attached seal resistances were 1 GΩ or greater and series resistance after achieving whole-cell configuration was 5–20 MΩ. Data were collected using a Multiclamp 700B amplifier and pClamp10 software (Molecular Devices). Data were analyzed using in-house programs written in Matlab (The MathWorks, Natick, MA; E. Fanselow).
Cell Visualization and Identification
Cells were viewed under infrared-differential interference contrast illumination using a Nikon FN-1 microscope and a Dage IR-1000 CCD camera. GIN cells were identified by visualization of GFP under epifluorescence illumination. RS pyramidal cells did not express GFP in these mice and were, therefore, targeted for recording based on having a triangular-shaped soma. During recording, RS pyramidal cells were positively distinguished from RS inhibitory interneurons as having strongly adapting spike firing rates during suprathreshold current steps, small amplitude afterhyperpolarization (AHPs), and during a train of action potentials the first AHP was smaller than subsequent AHPs (Porter et al., 2001; Beierlein et al., 2003). All cells were recorded in layers 2 and 3 of somatosensory cortex. Layer 2/3 cells were defined as those between the bottom of layer 1, identified by its lack of cell bodies, and the tops of the barrels, which demarcate layer 4.
Cells Recorded
Recordings from a total of 269 GIN cells and 200 RS cells from a total of 170 mice were analyzed for this study. Numbers of cells for each cell type and age can be found in Table 1. All mice were of the GIN strain [Jackson Labs, Bar Harbor, ME; (Oliva et al., 2000)] and were aged P11–P50. Cells from those aged >P31 were combined and are identified here as P32+. In addition, we combined P18 and P19 cells into one group, identified as P19 in the text and on our plots. Both male and female mice were used. The morphologies of GIN cells have been described extensively in other publications, and these cells have been shown to express the peptide, SOM; (Oliva et al., 2000; Halabisky et al., 2006; Ma et al., 2006; Fanselow et al., 2008).
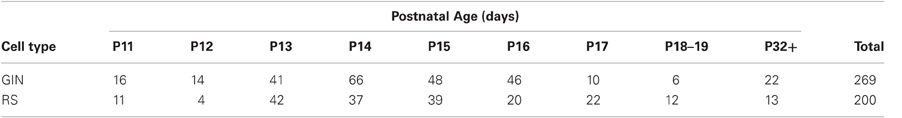
Table 1. Cell counts.
Measures of Cellular Properties
Once patched, we presented each cell with a series of negative and positive current steps, ranging from −100 to 300 pA in 10 or 20 pA steps. The following measures were made from the voltage traces recorded during these current steps.
Adaptation ratio: inverse of mean of the last three interspike intervals during a 200 pA step, divided by the inverse of the initial interspike interval in that step.
Action potential threshold (mv): voltage at the time of the peak of the third derivative of the voltage trace for the first action potential in a given current step.
AHP magnitude (mV): voltage at the most negative trough of the AHP (within 4 ms of the action potential peak) minus the action potential threshold voltage.
AHP slope (mV/ms): slope of the AHP for 8 ms following the most negative trough in the AHP.
Firing frequency, initial (Fi; Hz): inverse of the first interspike interval during a 200 pA current step.
Firing frequency, steady state (Fss; Hz): average of the inverse of the last three interspike intervals in a 200 pA current step.
Half-width (ms): width of the action potential halfway between the threshold voltage and the peak voltage.
Input-output gain (F–I slope; Hz/pA): slope of the linear portion of each frequency-current (F–I) curve calculated from responses to suprathreshold current steps. Frequency was defined as the inverse of the interspike intervals throughout the entire current step.
Input resistance (MΩ): magnitude of voltage deflection (mV)/magnitude of current step (pA); calculated as the slope of the V/I plot for positive and negative voltage deflections between ±8 mV.
Membrane time constant (τm; ms): calculated from a monoexponential curve best fitting the falling phase of the voltage deflection in response to negative current steps. Only voltage deflections <8 mV negative to the resting membrane potential were used.
Rebound depolarization (mV): The height of the voltage peak within 200 ms of the end of a current step. Current steps with voltage deflections from −70 to −15 mV were used.
Resting membrane potential (Vrest; mV): average voltage in the 20 ms prior to a current step.
Rheobase current (pA): We plotted the number of action potentials as a function of input current and extrapolated to find the current required to elicit a single action potential.
Sag magnitude (mV): calculated from negative-going current steps as the difference between the peak negative voltage deflection and the average voltage for the last 50 ms of the 600 ms current step. Only traces in which the maximum voltage deflection was >15 mV more negative than the resting membrane potential were analyzed.
Statistical Analyses
For quantification of RS and GIN cell properties, measurements were made from negative or positive current steps as described above. When results were plotted as a function of age, the resulting data were fit with linear, exponential, second degree polynomial or sigmoidal functions, as appropriate, using SigmaPlot (San Jose, CA). P11 and P32+ values were compared for each type of measurement using a two-tailed t-test and results are presented in Table 2.
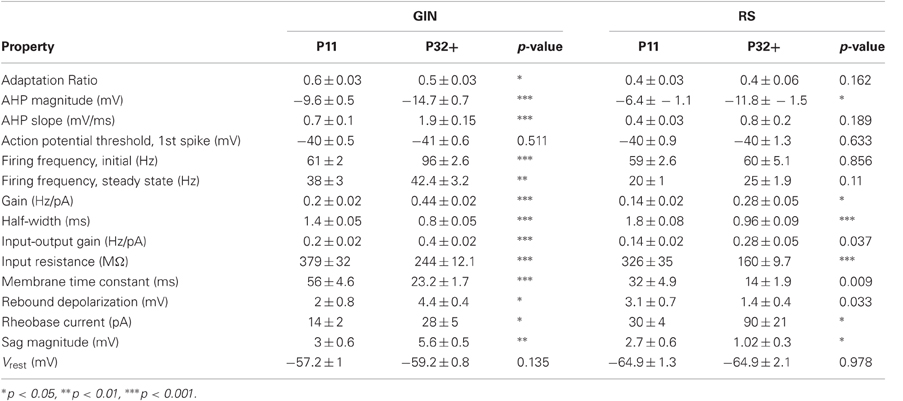
Table 2. Cell properties at P11 and P32+.
Results
In this study, we quantified intrinsic physiological properties of GIN and RS pyramidal cells in layer 2/3 of somatosensory cortex ranging in age from P11 to P32+. We recorded from local pyramidal neurons (RS cells) in order to directly compare how GIN and RS cells develop relative to one another within the same network. The development of intrinsic properties of pyramidal cells has been reported previously in multiple brain regions (McCormick and Prince, 1987; Maravall et al., 2004; Frick et al., 2007; Oswald and Reyes, 2008), and the results we present here for RS cells are largely in agreement with these previous studies. In contrast, the changes in GIN properties we observed have not been reported for the somatosensory cortex and differed somewhat from those described for visual cortex (Lazarus and Huang, 2011).
Subthreshold Intrinsic Properties
We observed that multiple subthreshold characteristics of GIN cells developed over the time window examined in this study, P11–P32+ (Figure 1). First, we examined several intrinsic properties of these cells: the input resistance (Rin), membrane time constant (τm), rheobase current, resting membrane potential (Vrest), and the threshold voltage for action potential generation (Vthresh). We found that several, but not all, of these features changed over this age range (Figure 2). The Rin of GIN cells decreased significantly from P11 to P32+ (P11: 379 ± 32 MΩ; P32+: 244 ± 12.1 MΩ, p < 0.001). This change occurred rapidly in GIN cells, as Rin decreased mainly between P11 (379 ± 32 MΩ) and P12 (247 ± 22 MΩ) then remained steady until P32+ (Figure 2A). The τm in GIN cells also decreased from P11 to P12 then remained steady until P32+ (P11: 56 ± 4.6 ms; P12: 32 ± 4 ms; P32+: 23.2 ± 1.7 ms, p < 0.001; Figure 2B). The rheobase current in GIN cells increased from P11 to P12 and then remained constant (P11: 14 ± 2 pA; P12: 37 ± 7 pA, P32+: 28 ± 5 pA, p < 0.05; Figure 2C).
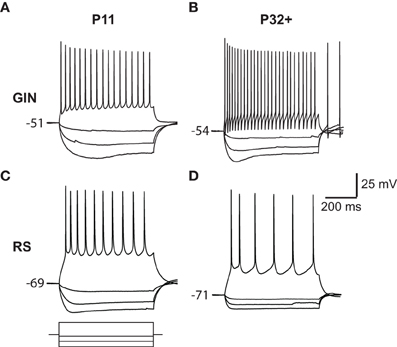
Figure 1. Responses of GIN and RS cells to current steps. (A) Voltage responses to current steps injected into a P11 GIN cell. (B) Voltage responses to current steps injected into a P32+ GIN cell. (C) Top: Voltage responses to current steps injected into a P11 RS cell. Bottom: Current steps representing −100, −60, −20, and +100 pA current steps, each of 600 ms duration. The same amplitude current steps were used for A–D. (D) Voltage responses to current steps injected into a P32+ RS cell.
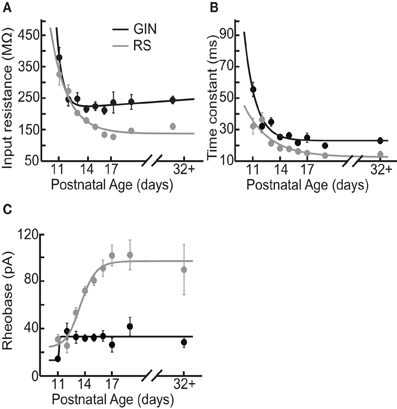
Figure 2. Intrinsic properties of GIN cells and RS cells change over development. (A) Average input resistance of GIN cells (black) and RS cells (gray) decreases as a function of age. (B) The average membrane time constant also decreases with age in both the GIN cells (black) and the RS cells (gray). (C) The rheobase current increases from P11 to P12 in the GIN cells, then remains constant into maturity (black). The rheobase current in the RS cells increases significantly with age (gray). Data for each cell type were fit with an exponential function (A and B) or a sigmoidal function (C).
In RS cells, the Rin and τm also decreased during this period, but did so more gradually than in GIN cells (Rin: P11, 326 ± 35 MΩ; P32+, 160 ± 9.7 MΩ, p < 0.001; τm: P11, 32 ± 4.9 ms; P32+, 14 ± 1.9 ms, p = 0.009; Figures 2A,B). The rheobase current in RS cells increased threefold, from 30 ± 4 pA at P11 to 90 ± 21 pA at P32+ (Figure 2C). This increase in rheobase current also occurred more gradually over the second postnatal week than in GIN cells. Vrest did not change significantly throughout development in GIN cells (P11: −57.2 ± 1 mV; P32+: −59.2 ± 0.8 mV, p = 0.135; Table 2) or RS cells (P11: −64.9 ± 1.3 mV; P32+: −64.9 ± 2.1 mV; p = 0.978; Table 2). In addition, Vthresh remained constant across the age range investigated here in both GIN cells (P11: −40 ± 0.5 mV; P32+: −41 ± 0.6 mV, p = 0.511; Table 2) and RS cells (P11: −40 ± 0.9 mV; P32+: −40 ± 1.3, p = 0.633; Table 2).
Collectively, these results suggest that during the age range investigated, the intrinsic excitability of both GIN and RS cells decreased. But it should be noted that within the same age range, GIN cells remained more excitable than RS cells, exhibiting higher input resistance, higher τm, lower rheobase current, and more depolarized Vrest than RS cells across this developmental period.
Another characteristic feature of GIN cells is the presence of a pronounced “sag current” in response to hyperpolarizing current steps (Oliva et al., 2000; Halabisky et al., 2006; Ma et al., 2006) Figures 1B and 3A). In GIN cells, sag currents are mediated by Ih currents (Ma et al., 2006). We observed a strong increase in the magnitude of the sag current with age (P11: 3 ± 0.6 mV; P32+: 5.6 ± 0.5 mV, p < 0.01; Figures 3A,B). A related feature observed in GIN cells is the presence of a rebound depolarization when the cell is released from hyperpolarization, which in some cases results in the generation of a rebound spike (Figures 1B and 3A). This depolarization is also mediated by Ih currents in GIN cells (Ma et al., 2006). We observed that the amplitude of rebound depolarization also increased with age (P11: 2 ± 0.8 mV; P32+: 4.4 ± 0.4 mV, p < 0.05; Figure 3C), and showed a similar developmental time course as the change in sag current magnitude. RS cells also showed a small Ih-mediated sag current (Maravall et al., 2004), but the magnitude of the sag current and rebound depolarization decreased with age in RS cells (Figures 3A–C), consistent with previous results (Maravall et al., 2004). Together, these findings suggest that Ih currents increased in GIN cells and decreased in RS cells from ages P11 to P32+.
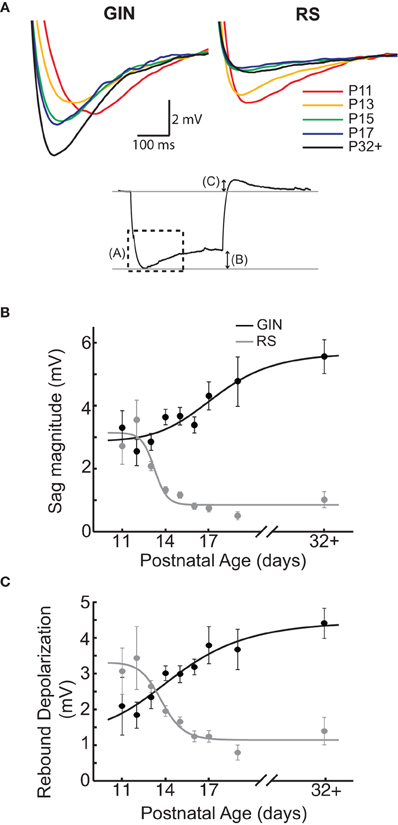
Figure 3. Sag currents increase in GIN cells with age but decrease in RS cells. (A) Top: Average sag current traces for GIN cell traces (left) and RS cell (right) by age. The colors correspond to the following ages: P11 (red), P13 (orange), P15 (green), P17 (blue), and P32+ (black). Bottom: Response of a GIN cell to a hyperpolarizing current step. The dotted box denotes the region illustrated above in (A). The arrows describe the sag magnitude [shown in (B)] and the rebound depolarization [shown in (C)]. For descriptions of how these quantities were measured, see Materials and Methods. (B) The magnitude of the sag current in GIN cells increases with age (black), whereas the sag current decreases with age in the RS cells (gray). (C) The rebound depolarization also increases in GIN cells (black) and decreases in RS cells, following a similar time course as the sag current (gray). Data for each cell type were fit with a sigmoidal function (B and C).
Action Potential Properties
GIN cells exhibit a distinct action potential and AHP waveform, which is likely due to expression of several types of potassium currents (Zhang and McBain, 1995; Rudy and McBain, 2001; Halabisky et al., 2006; Ma et al., 2006). We therefore sought to determine whether action potential properties of GIN cells changed with age, which would suggest differential expression of these currents across development. We measured three properties related to the shape of the action potential: action potential half-width, the AHP magnitude, and the slope of the voltage depolarization following the AHP. The average action potential half-width in GIN cells decreased with age, from 1.4 ± 0.05 ms at P11 to 0.8 ± 0.05 ms at P32+ (p < 0.001; Figure 4A). Narrowing of the action potential with age was also observed in RS cells (P11: 1.8 ± 0.08 ms; P32+: 0.96 ± 0.09 ms, p < 0.001; Figure 4A), but at all ages recorded the half-width of GIN cells was shorter than for RS cells of the same age.
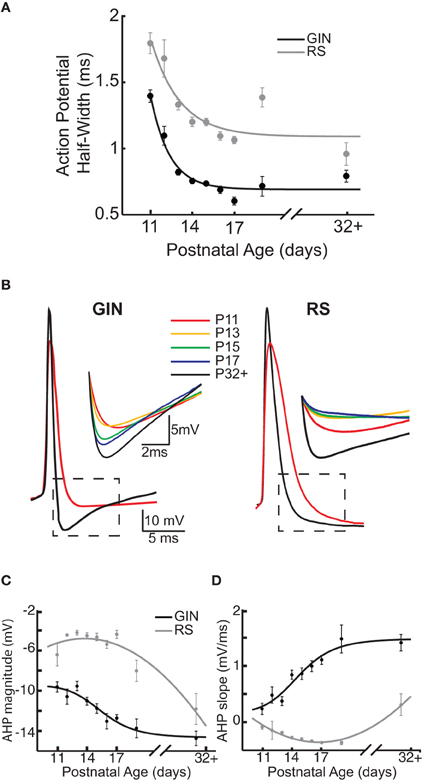
Figure 4. Action potential properties change as a function of age in GIN and RS cells. (A) Across development, action potential half-width decreases in GIN (black) and RS cells (gray). (B) Left: Overlaid action potential waveforms of a P11 GIN cell (red) and a P32+ GIN cell (black). Dashed black box indicates region shown above, which illustrates the change in the AHP with age in GIN cells. Right: Overlaid action potential waveforms of a P11 RS cell (red) and a P32+ RS cell (black). Dashed black box indicates region shown above, which illustrates the change in the afterhyperpolarization (AHP) with age in RS cells. The colors correspond to the following ages: P11 (red), P13 (orange), P15 (green), P17 (blue), and P32+ (black). (C) Quantification of AHP magnitude (measured as the most negative point of the AHP, minus the action potential threshold) for GIN cells (black) and RS cells (gray). (D) Quantification of the AHP slope for GIN cells (black) and RS cells (gray). Data for each cell type were fit with a sigmoidal function (C and D; black) or a second degree polynomial (C and D; gray).
GIN cells can display a complex “triphasic” AHP shape following an action potential that consists of both a rapid “early” component, followed by a slower “late” component (Halabisky et al., 2006; Ma et al., 2006). We found that both of these features were almost completely absent at P11 in the GIN cells but developed throughout the second and third postnatal weeks (Figures 1A,B and 4B). Specifically, the trough of the AHP became increasingly negative with age (P11: −9.6 ± 0.5 mV; P32+: −14.7 ± 0.7 mV, p < 0.001; Figures 4B,C). We then quantified the repolarization of the voltage following the AHP and found that the slope increased almost threefold from P11 (0.7 ± 0.1 mV/ms) to P32+ (1.9 ± 0.15 mV/ms, p < 0.001; Figures 4B,D). Therefore, in GIN cells, although the AHP became increasingly negative with age, the voltage repolarized more quickly so that by ~8 ms following the AHP the voltage was more depolarized in mature animals than younger animals (Figures 4B,D). In contrast, RS cells had a smaller AHP magnitude across all ages than GIN cells (Figure 4C). We did observe a significant increase in the AHP magnitude with age in RS cells (P11: −6.4 ± −1.1 mV; P32+ −11.8 ± −1.5 mV, p < 0.05), but no significant change in AHP slope for RS cells (P11: 0.4 ± 0.03 mV/ms; P32+: 0.8 ± 0.2 mV/ms; p = 0.189).
Firing Properties
Finally, we examined how the propensity for GIN cells to fire in response to a current step changed as a function of age. We started by quantifying the firing of the GIN cells throughout the duration of suprathreshold current steps across each age (Figure 5A). GIN cells across all ages exhibited adaptation throughout the current steps, such that the initial firing rate was higher than the steady state firing rate (Figure 5A). Both the initial (P11: 61 ± 2 Hz; P32+: 96 ± 2.6 Hz, p < 0.001) and the steady state firing rate (P11: 38 ± 3 Hz; P32+: 42.4 ± 3.2 Hz, p < 0.01) increased significantly with age. The ratio of the two values, the adaptation ratio, decreased across development (P11: 0.6 ± 0.03; P32+: 0.5 ± 0.03, p < 0.05; Figure 5C). This is likely due to the fact that the initial firing rate increased more with age than the steady state firing rate, causing GIN cells to exhibit more adaptation in older animals. In comparison, we observed no significant change in the initial firing rate, steady state firing rate, or adaptation ratio across ages in RS cells (Table 2; Figures 5B,C).
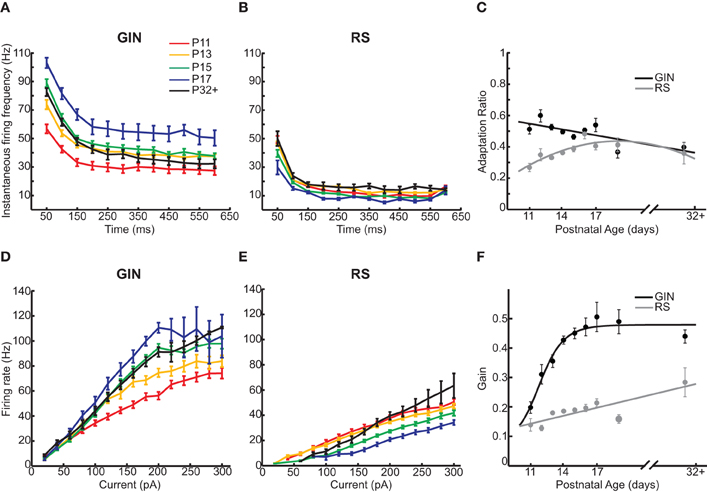
Figure 5. GIN cells show increased firing rates with age. (A) Instantaneous firing rate across a 200 pA current step of 600 ms duration for GIN cells. (B) Instantaneous firing rate across a 200 pA current step of 600 ms duration for RS cells. (C) The adaptation ratio (first ISI/average of last three ISIs) decreased slightly with age in GIN cells (black) but did not change in RS cells (gray). (D) The frequency/current (f/I) curve of GIN cells calculated from 20 to 300 pA across age showed a multiplicative increase. (E) The f/I curve of RS cells calculated from 20 to 300 pA across age shows primarily a rightward shift. (F) The gain (calculated as the slope of the linear portion of the f/I curve) for GIN cells (black) increased with age, but not in RS cells (gray). The colors in A, B, D, and E correspond to the following ages: P11 (red), P13 (orange), P15 (green), P17 (blue), and P32+ (black). Data for each cell type were fit by a linear fit (C, black; F, gray), a second degree polynomial (C, gray), or a sigmoidal function (F, black).
In order to fully understand how the firing dynamics of GIN cells and RS cells changed during development, we examined the input–output relationship of both cell types from P11 to P32+. When we compared the input–output relationship across age, GIN cells showed a “multiplicative” increase in firing rate from P11 to P32+ (Figure 5D). This was primarily because whereas the firing rates increased with age, the rheobase current stayed constant from P12 through P32+ (Figures 2C and 5D). To quantify this change, we calculated the slope of the linear portion of the input–output relationship, or the “gain” of the cell. The gain of the GIN cells increased significantly across development (P11: 0.2 ± 0.02 Hz/pA; P32+: 0.44 ± 0.02 Hz/pA, p < 0.001; Figure 5F). RS cells also showed a significant increase in gain from P11 (0.14 ± 0.02 Hz/pA) to P32+ (0.28 ± 0.05 Hz/pA, p < 0.05; Figure 5F). However, the dominant change in the input–output curve of RS cells was a rightward shift with age (Figure 5E). This was due to the increase in rheobase current with age in RS cells (Figure 2C), resulting in more current being required to drive RS cells to fire at a given rate as the neurons matured.
Discussion
In this study, we sought to determine whether physiological features of GIN inhibitory cells changed as a function of age. Our data demonstrated that multiple intrinsic physiological characteristics of L2/3 GIN and RS cells in somatosensory cortex changed across the developmental time period investigated here (P11–P32+). GIN and RS cells showed decreased intrinsic excitability over the second and third weeks of postnatal development, based on features such as input resistance, membrane time constant, and rheobase current. However, despite these changes, the net change in GIN cell output during this time was an increase in firing rate as a function of age. This was due to an increase in initial and steady state firing rates with age, which resulted in a multiplicative increase in the input–output relationship. In contrast, RS cells did not show substantial changes in gain with age. Together, these results suggest that, for the same level of input current, GIN cells became more active as the animal matured through the age range investigated, whereas RS cells became less readily activated.
The results we reported here for GIN cells are consistent with developmental changes to intrinsic properties reported for pyramidal neurons in the current study and elsewhere (Maravall et al., 2004) and for other types of inhibitory interneurons (Goldberg et al., 2011) in the upper layers of the somatosensory cortex. Therefore, this may be a general developmental trend across many cell types within this neocortical region. It should be noted that a recent study investigated maturation of SOM and PV cells in the visual cortex during the first few weeks of postnatal development (Lazarus and Huang, 2011). Interestingly, they observed different trends than we reported here, as SOM cells in the visual cortex displayed increases in input resistance and membrane time constant with age. These different developmental trajectories seen by Lazarus and Huang (2011) could reflect differences between cortical areas. Additionally, these authors investigated SOM and PV cells from ages P15–P30, and grouped the data into bins of multiple days, including P15–P17. Because the decreases we observed in SOM cell input resistance and membrane time constant occurred at earlier ages (greatest changes prior to day 14), it is difficult to compare across these studies.
Intrinsic Cellular Properties During Postnatal Development
Previous studies have examined the properties of pyramidal neurons during the age range studied here and have observed a similar decrease in intrinsic excitability of these cells with age (McCormick and Prince, 1987; Maravall et al., 2004; Oswald and Reyes, 2008). Interestingly, although we observed changes to these properties in GIN and RS cells as a function of age, GIN cells consistently exhibited higher Rin, higher τm, and lower rheobase current than RS cells of the same age. This illustrates that the relative intrinsic excitability between GIN and RS cells is preserved at all ages. This may be important for maintaining the proper ratio of excitation to inhibition throughout development (Zhang et al., 2011).
In excitatory neurons and non-GIN inhibitory interneurons, such as the FS cells, changes in input resistance are driven primarily by increased expression of potassium leak currents (Goldberg et al., 2011; Guan et al., 2011), which could have caused the change in input resistance we reported for GIN cells. It is currently unknown whether the amount of synaptic input or gap junction coupling changes over development in GIN cells, but either could also contribute to the changes in intrinsic properties observed here.
A prominent feature of GIN cells is the presence of a strong “sag” current and related rebound depolarization during and after negative current pulses, respectively (McGarry et al., 2010; Ma et al., 2012). Both of these properties are mediated by Ih currents in GIN cells (Ma et al., 2006). We found a pronounced increase in the magnitude of the sag current and rebound depolarization in GIN cells, illustrating that the expression of Ih is likely increasing in GIN cells over development. Ih currents often underlie the generation of rhythmic activity (McCormick and Pape, 1990; Maccaferri and McBain, 1996; Pape, 1996; Luthi and McCormick, 1998; Griguoli et al., 2010). GIN cells in both the neocortex and hippocampus show a strong preference for firing at theta frequencies (Chapman and Lacaille, 1999a,b; Klausberger et al., 2003; Lawrence et al., 2006; Fanselow et al., 2008; Griguoli et al., 2010). This could result partially from the expression of Ih current (Griguoli et al., 2010). A developmental increase in Ih current could cause the theta preference found in GIN cells to mature during this period of postnatal development.
Maturation of GIN Action Potential Waveform
A dominant factor that controls the action potential waveform is the expression of voltage-gated potassium channels (Rudy and McBain, 2001). In particular, the potassium channel family, Kv3, has been shown to underlie the narrow action potential waveform in FS inhibitory interneurons (Rudy and McBain, 2001; Lien and Jonas, 2003; Goldberg et al., 2011). The action potential half-width observed in FS cells decreases during the second and third weeks of postnatal development and this property is paralleled by increased expression of Kv3 over development (Goldberg et al., 2011). It is possible that developmental increases in potassium currents could also underlie the decreased action potential half-widths observed in GIN cells in the current study. Although Kv3 channels are observed in deep layer SOM inhibitory interneurons, they are not present in superficial SOM cells (Chow et al., 1999), which were recorded here. The specific types of potassium channels expressed in superficial SOM cells are not known, so it is difficult to know which potassium currents could underlie the developmental changes in action potential waveform we observed in our study.
We demonstrated that the voltage trajectory following the AHP trough depolarized more rapidly in older GIN cells than in younger ones. The ability of mature GIN cells to repolarize more rapidly following an action potential may underlie the increased firing rates observed at older ages. Ih currents can act on the shape and duration of the AHP and increase the slope of the membrane potential during the interspike interval (McCormick and Pape, 1990; Maccaferri and McBain, 1996; Pape, 1996; Griguoli et al., 2010). The changes observed here in the AHP shape and slope, therefore, further support the idea that Ih currents increase in GIN cells over the second and third postnatal weeks.
GIN Cells Display Multiplicative Increases in the Input−Output Relationship with Age
We assessed the firing output of GIN and RS cells over development by examining changes in firing rates. The initial and steady state firing rates of GIN cells increased with age. Because the rheobase current remained largely constant in GIN cells, the increase in firing rate resulted in a multiplicative increase in the input–output curve of GIN cells as a function of age. Such gain changes can arise from alterations in the rate and balance of excitatory and inhibitory synaptic inputs to a neuron (Chance et al., 2002; Mitchell and Silver, 2003; Larkum et al., 2004). Another way to modulate the gain of a neuron is to affect a process that is spike dependent, such as the action potential AHP (Mehaffey et al., 2005; Diaz-Quesada and Maravall, 2008). This will increase or decrease the firing rate of a neuron without a concomitant change in rheobase current. Our observed changes to the AHP in GIN cells as a function of age could account for the increased gain we observed in these cells.
In contrast, in RS cells the more prominent change in firing rate over development was an increase in rheobase current, accompanied by a rightward shift of the input–output curve (Oswald and Reyes, 2008). Subtractive shifts in input–output curves can be caused by alterations in intrinsic neuronal excitability (Silver, 2010), which do not cause changes in gain. The changes in intrinsic properties (such as input resistance) of RS cells are likely the cause of the subtractive change in the input–output relationship observed in these cells over development.
Characterizing Subtypes of Inhibitory Neurons
Establishing relevant distinctions between subtypes of inhibitory neurons, while critical for characterizing their role(s) in the neocortex, has been difficult (Gupta et al., 2000; Markram et al., 2004; Ascoli et al., 2008; Guerra et al., 2011). This has been aided, but not entirely ameliorated, by the use of lines of mice that express fluorescent proteins in inhibitory neurons of interest. It is not clear whether GIN cells form a homogeneous population. These cells have been subdivided into three (McGarry et al., 2010) and four (Halabisky et al., 2006) groups based on physiological and morphological characteristics. In our study, we showed that physiological factors frequently used to characterize inhibitory neurons vary with age. Therefore, in order to use these factors to accurately categorize GIN neurons it is necessary to take age into account. Here, we focused on changes in the physiological features of GIN cells, but other features, such as morphological characteristics, can also be considered when subdividing GIN cells (McGarry et al., 2010). It would be interesting to know whether the morphological features of GIN cells also develop over this time window, and whether they change in concert with the physiological changes we have described. In fact, developmental morphological changes could constitute possible mechanisms for some of the physiological changes we observed. For example, changes in overall dendritic length with age could account for the decreased input resistance in GIN cells we report in this study.
Impact of GIN Cell Maturation on Cortical Circuitry
This study represents the first in-depth analysis showing how the physiology of GIN cells in layers 2/3 of somatosensory cortex changes during the second and third postnatal weeks. This encompasses a period of massive reorganization of the neocortex correlated with the onset of sensory input and plasticity. Our results suggest that GIN cells become more active in the cortical network around P14, which corresponds to the approximate time of whisking onset in mice and rats (Mosconi et al., 2010). Although a precise function for GIN cells, and more broadly SOM cells, in sensory processing is still being investigated, there are several implications of our results.
First, changes in intrinsic properties of SOM cells can affect how these cells communicate amongst themselves via electrical connections, or gap junctions. Gap junctions are common between SOM cells (Gibson et al., 1999; Fanselow et al., 2008), and are involved in the generation of synchronous activity between SOM interneurons (Beierlein et al., 2000; Fanselow et al., 2008). The ability of electrically coupled cells to synchronize depends on both the properties of the coupling as well as the intrinsic properties of the individual cells (Amitai et al., 2002; Lewis and Rinzel, 2003; Mancilla et al., 2007; Hayut et al., 2011). Therefore, as the intrinsic properties of SOM cells mature during postnatal development the ability of SOM cells to synchronize their activity through gap junctions may change. Factors such as input resistance, membrane time constant, and AHP size and shape could all influence gap junction-mediated synchrony between GIN cells. However, determining how the changes we saw in these factors as a function of age would individually or collectively affect GIN–GIN synchrony would require detailed computational and experimental investigations that are beyond the scope of this study.
Second, SOM cells participate in cortical “UP-states” (Fanselow and Connors, 2010), brief periods of depolarization and higher neuronal activity observed in a range of neocortical regions and layers. UP-states have been described in vitro (Sanchez-Vives and McCormick, 2000; Shu et al., 2003; Fanselow and Connors, 2010), in vivo during anesthesia (Steriade et al., 1993; Sanchez-Vives and McCormick, 2000) and in sleep and waking states (Steriade et al., 2001; Petersen et al., 2003). The function of UP-states is not well understood, but they represent a high-conductance state with neuronal activity that is reminiscent of firing observed in intact animals (Destexhe and Pare, 1999; Destexhe et al., 2003; Rudolph et al., 2005; Fanselow and Connors, 2010). Work by Fanselow and Connors (2010) suggested that GIN cells could be involved in terminating UP-states. If, as our current results suggest, GIN cells play a larger role in cortical activity as an animal progresses through the second and third weeks of postnatal development, then the propensity for GIN cells to terminate UP-states might also increase during the same period. Indeed, Fanselow and Connors (2010) demonstrated a strong inverse correlation between UP-state duration and age, as well as a decrease in UP-state frequency with increasing age from P13 to P17. Such an ability to terminate UP-states could potentially extend to termination of other periods of heightened activity within the cortex, such as seizures. In fact, loss of SOM-expressing, dendrite-targeting inhibitory cells of the hippocampus has been associated with increased seizure activity (Buckmaster and Jongen-Relo, 1999; Cossart et al., 2001).
Third, SOM cells influence the activity of the surrounding neuronal network in multiple ways. These mechanisms would likely be affected by the type of age-driven changes in the input–output relationship (gain) of GIN cells that we observed. For example, because SOM interneurons directly inhibit FS cells (Gibson et al., 1999; Ma et al., 2012), an increase in SOM cell gain could paradoxically increase local excitatory neuron activity through disinhibition. In contrast, it has been shown that activation of even a few pyramidal cells exerts strong disynaptic inhibition onto surrounding pyramidal cells via SOM interneurons (Kapfer et al., 2007; Silberberg and Markram, 2007). In this way, increases in SOM cell gain may serve to increase SOM-mediated disynaptic self-inhibition of pyramidal cells, resulting in a decrease in cortical excitability. Note that these two methods of regulating cortical activity are not mutually exclusive, but may instead work antagonistically to fine tune cortical activity.
It will be useful in future studies to determine how developmental changes to synaptic connections complement development of the intrinsic properties we have described here, and, in turn, affect the influence SOM cells have on neighboring neurons. Excitatory inputs onto SOM cells are initially weak, but display strong short-term facilitation (Gibson et al., 1999; Fanselow et al., 2008), which suggests these cells are engaged during periods of heightened neuronal activity (Kapfer et al., 2007; Silberberg and Markram, 2007; Fanselow et al., 2008; Hayut et al., 2011). Interestingly, inhibitory output from SOM cells initially exhibits weak depression followed by weak facilitation (Ma et al., 2012). Together, these short-term dynamics suggest that SOM cells would be able to increase and then sustain their inhibitory influence on downstream targets during sensory processing. This is in contrast to FS cells, which receive initially strong but rapidly depressing synapses from upstream neurons and make depressing connections onto target neurons (Beierlein et al., 2003; Ma et al., 2012). This suggests that FS cells, while exerting strong inhibitory output at first, would decrease their influence on surrounding cells as ongoing neuronal activity progressed. These opposing short-term dynamics suggest SOM and FS cells may be specialized for distinct modes of inhibitory processing: FS cells are optimized for fast, transient inhibition, whereas SOM cells can provide somewhat delayed, but sustained, inhibition (Tan et al., 2008). The extent to which each of these functions is fulfilled at a given point during development remains to be determined. Developmental changes in the short-term dynamics of synapses onto and from SOM cells would dictate the degree to which these cells could be activated by high-frequency inputs and the time course over which they could affect their downstream targets. Additionally, inhibitory synapses between SOM cells and FS cells can produce synchronous activity between these different types of inhibitory interneurons (Hu et al., 2011). Therefore, developmental regulation of the inhibitory output from SOM cells may impact the ability of SOM cells to synchronize with FS cells through inhibitory synapses. Further investigation of SOM input and output properties (e.g., synaptic dynamics) as a function of age will be critical to our understanding of the role of SOM cells during this postnatal time period.
Finally, multiple studies in vitro, in vivo, and using computational models have suggested unique roles for SOM inhibitory interneurons during cortical sensory processing (Tan et al., 2008; Vierling-Claassen et al., 2010; Hayut et al., 2011; Gentet et al., 2012; Ma et al., 2012). For example, inhibition onto the apical dendrite of pyramidal cells can inhibit pyramidal cell firing by influencing active currents in this dendritic sub-region (Larkum et al., 1999, 2001; Perez-Garci et al., 2006; Gentet et al., 2012; Lovett-Barron et al., 2012). This suggests that SOM cells may be involved in regulating excitatory synapses onto such apical dendrites, including long-range projections from other cortical and subcortical areas (Petreanu et al., 2007, 2009). In contrast, FS cells, which terminate on the perisomatic regions of their targets, would not directly control these inputs. Thus, developmentally mediated increases in SOM cell activity due to increases in gain might more closely regulate long-range inputs to somatosensory cortex at later ages. In addition, SOM cells exhibit different behaviors in vivo than other inhibitory interneurons, including FS cells. Specifically, it has been shown that SOM cells are preferentially active during quiet wakefulness, and are hyperpolarized in response to sensory input, whereas FS cells respond robustly to sensory input (Gentet et al., 2012). If, as these findings collectively suggest, increased SOM cell activity gates out excitatory distal dendritic input during sensory processing, then it would appear from our study that such dendritic input (e.g. from motor cortex) becomes increasingly gated as a function of age. Whether and why more excitatory dendritic input might be useful early in the development of the sensorimotor system, or a detriment at older ages, is not yet known. In any case, it is clear that SOM and FS cells possess distinct intrinsic and synaptic properties that may contribute to their different behaviors in vivo. The development of these properties in both FS and SOM cells happens concurrently, over the second and third postnatal weeks, and may contribute to the dichotomous roles of these subsets of interneurons in neocortical processing.
Conflict of Interest Statement
The authors declare that the research was conducted in the absence of any commercial or financial relationships that could be construed as a potential conflict of interest.
Acknowledgments
We would like to thank Drs. Anne-Marie Oswald, Brent Doiron, and David Golomb for helpful comments on the manuscript. This work was supported by the University of Pittsburgh School of Medicine.
References
Agmon, A., and Connors, B. W. (1991). Thalamocortical responses of mouse somatosensory (barrel) cortex in vitro. Neuroscience 41, 365–379.
Amitai, Y., Gibson, J. R., Beierlein, M., Patrick, S. L., Ho, A. M., Connors, B. W., and Golomb, D. (2002). The spatial dimensions of electrically coupled networks of interneurons in the neocortex. J. Neurosci. 22, 4142–4152.
Ascoli, G. A., Alonso-Nanclares, L., Anderson, S. A., Barrionuevo, G., Benavides-Piccione, R., Burkhalter, A., Buzsaki, G., Cauli, B., Defelipe, J., Fairen, A., Feldmeyer, D., Fishell, G., Fregnac, Y., Freund, T. F., Gardner, D., Gardner, E. P., Goldberg, J. H., Helmstaedter, M., Hestrin, S., Karube, F., Kisvarday, Z. F., Lambolez, B., Lewis, D. A., Marin, O., Markram, H., Munoz, A., Packer, A., Petersen, C. C., Rockland, K. S., Rossier, J., Rudy, B., Somogyi, P., Staiger, J. F., Tamas, G., Thomson, A. M., Toledo-Rodriguez, M., Wang, Y., West, D. C., and Yuste, R. (2008). Petilla terminology: nomenclature of features of GABAergic interneurons of the cerebral cortex. Nat. Rev. Neurosci. 9, 557–568.
Beierlein, M., Gibson, J. R., and Connors, B. W. (2000). A network of electrically coupled interneurons drives synchronized inhibition in neocortex. Nat. Neurosci. 3, 904–910.
Beierlein, M., Gibson, J. R., and Connors, B. W. (2003). Two dynamically distinct inhibitory networks in layer 4 of the neocortex. J. Neurophysiol. 90, 2987–3000.
Buckmaster, P. S., and Jongen-Relo, A. L. (1999). Highly specific neuron loss preserves lateral inhibitory circuits in the dentate gyrus of kainate-induced epileptic rats. J. Neurosci. 19, 9519–9529.
Chance, F. S., Abbott, L. F., and Reyes, A. D. (2002). Gain modulation from background synaptic input. Neuron 35, 773–782.
Chapman, C. A., and Lacaille, J. C. (1999a). Cholinergic induction of theta-frequency oscillations in hippocampal inhibitory interneurons and pacing of pyramidal cell firing. J. Neurosci. 19, 8637–8645.
Chapman, C. A., and Lacaille, J. C. (1999b). Intrinsic theta-frequency membrane potential oscillations in hippocampal CA1 interneurons of stratum lacunosum-moleculare. J. Neurophysiol. 81, 1296–1307.
Chittajallu, R., and Isaac, J. T. (2010). Emergence of cortical inhibition by coordinated sensory-driven plasticity at distinct synaptic loci. Nat. Neurosci. 13, 1240–1248.
Chow, A., Erisir, A., Farb, C., Nadal, M. S., Ozaita, A., Lau, D., Welker, E., and Rudy, B. (1999). K(+) channel expression distinguishes subpopulations of parvalbumin- and somatostatin-containing neocortical interneurons. J. Neurosci. 19, 9332–9345.
Cossart, R., Dinocourt, C., Hirsch, J. C., Merchan-Perez, A., De Felipe, J., Ben-Ari, Y., Esclapez, M., and Bernard, C. (2001). Dendritic but not somatic GABAergic inhibition is decreased in experimental epilepsy. Nat. Neurosci. 4, 52–62.
Dani, V. S., Chang, Q., Maffei, A., Turrigiano, G. G., Jaenisch, R., and Nelson, S. B. (2005). Reduced cortical activity due to a shift in the balance between excitation and inhibition in a mouse model of Rett syndrome. Proc. Natl. Acad. Sci. U.S.A. 102, 12560–12565.
Daw, M. I., Ashby, M. C., and Isaac, J. T. (2007). Coordinated developmental recruitment of latent fast spiking interneurons in layer IV barrel cortex. Nat. Neurosci. 10, 453–461.
de la Rocha, J., Doiron, B., Shea-Brown, E., Josic, K., and Reyes, A. (2007). Correlation between neural spike trains increases with firing rate. Nature 448, 802–806.
Destexhe, A., and Pare, D. (1999). Impact of network activity on the integrative properties of neocortical pyramidal neurons in vivo. J. Neurophysiol. 81, 1531–1547.
Destexhe, A., Rudolph, M., and Pare, D. (2003). The high-conductance state of neocortical neurons in vivo. Nat. Rev. Neurosci. 4, 739–751.
Diaz-Quesada, M., and Maravall, M. (2008). Intrinsic mechanisms for adaptive gain rescaling in barrel cortex. J. Neurosci. 28, 696–710.
Ehret, G. (1976). Development of absolute auditory thresholds in the house mouse (Mus musculus). J. Am. Audiol. Soc. 1, 179–184.
Fanselow, E. E., and Connors, B. W. (2010). The roles of somatostatin-expressing (GIN) and fast-spiking inhibitory interneurons in UP-DOWN states of mouse neocortex. J. Neurophysiol. 104, 596–606.
Fanselow, E. E., Richardson, K. A., and Connors, B. W. (2008). Selective, state-dependent activation of somatostatin-expressing inhibitory interneurons in mouse neocortex. J. Neurophysiol. 100, 2640–2652.
Frick, A., Feldmeyer, D., and Sakmann, B. (2007). Postnatal development of synaptic transmission in local networks of L5A pyramidal neurons in rat somatosensory cortex. J. Physiol. 585, 103–116.
Gentet, L. J., Kremer, Y., Taniguchi, H., Huang, Z. J., Staiger, J. F., and Petersen, C. C. (2012). Unique functional properties of somatostatin-expressing GABAergic neurons in mouse barrel cortex. Nat. Neurosci. 15, 607–612.
Gibson, J. R., Beierlein, M., and Connors, B. W. (1999). Two networks of electrically coupled inhibitory neurons in neocortex. Nature 402, 75–79.
Goldberg, E. M., Jeong, H. Y., Kruglikov, I., Tremblay, R., Lazarenko, R. M., and Rudy, B. (2011). Rapid developmental maturation of neocortical FS cell intrinsic excitability. Cereb. Cortex 21, 666–682.
Griguoli, M., Maul, A., Nguyen, C., Giorgetti, A., Carloni, P., and Cherubini, E. (2010). Nicotine blocks the hyperpolarization-activated current Ih and severely impairs the oscillatory behavior of oriens-lacunosum moleculare interneurons. J. Neurosci. 30, 10773–10783.
Guan, D., Horton, L. R., Armstrong, W. E., and Foehring, R. C. (2011). Postnatal development of A-type and Kv1- and Kv2-mediated potassium channel currents in neocortical pyramidal neurons. J. Neurophysiol. 105, 2976–2988.
Guerra, L., McGarry, L. M., Robles, V., Bielza, C., Larranaga, P., and Yuste, R. (2011). Comparison between supervised and unsupervised classifications of neuronal cell types: a case study. Dev. Neurobiol. 71, 71–82.
Gupta, A., Wang, Y., and Markram, H. (2000). Organizing principles for a diversity of GABAergic interneurons and synapses in the neocortex. Science 287, 273–278.
Halabisky, B., Shen, F., Huguenard, J. R., and Prince, D. A. (2006). Electrophysiological classification of somatostatin-positive interneurons in mouse sensorimotor cortex. J. Neurophysiol. 96, 834–845.
Hayut, I., Fanselow, E. E., Connors, B. W., and Golomb, D. (2011). LTS and FS inhibitory interneurons, short-term synaptic plasticity, and cortical circuit dynamics. PLoS Comput. Biol. 7:e1002248. doi: 10.1371/journal.pcbi.1002248
Hensch, T. K. (2005). Critical period plasticity in local cortical circuits. Nat. Rev. Neurosci. 6, 877–888.
Hu, H., Ma, Y., and Agmon, A. (2011). Submillisecond firing synchrony between different subtypes of cortical interneurons connected chemically but not electrically. J. Neurosci. 31, 3351–3361.
Jiao, Y., Zhang, C., Yanagawa, Y., and Sun, Q. Q. (2006). Major effects of sensory experiences on the neocortical inhibitory circuits. J. Neurosci. 26, 8691–8701.
Jiao, Y., Zhang, Z., Zhang, C., Wang, X., Sakata, K., Lu, B., and Sun, Q. Q. (2011). A key mechanism underlying sensory experience-dependent maturation of neocortical GABAergic circuits in vivo. Proc. Natl. Acad. Sci. U.S.A. 108, 12131–12136.
Kapfer, C., Glickfeld, L. L., Atallah, B. V., and Scanziani, M. (2007). Supralinear increase of recurrent inhibition during sparse activity in the somatosensory cortex. Nat. Neurosci. 10, 743–753.
Kawaguchi, Y. (1995). Physiological subgroups of nonpyramidal cells with specific morphological characteristics in layer II/III of rat frontal cortex. J. Neurosci. 15, 2638–2655.
Kawaguchi, Y., and Kondo, S. (2002). Parvalbumin, somatostatin and cholecystokinin as chemical markers for specific GABAergic interneuron types in the rat frontal cortex. J. Neurocytol. 31, 277–287.
Kawaguchi, Y., and Kubota, Y. (1996). Physiological and morphological identification of somatostatin- or vasoactive intestinal polypeptide-containing cells among GABAergic cell subtypes in rat frontal cortex. J. Neurosci. 16, 2701–2715.
Klausberger, T., Magill, P. J., Marton, L. F., Roberts, J. D., Cobden, P. M., Buzsaki, G., and Somogyi, P. (2003). Brain-state- and cell-type-specific firing of hippocampal interneurons in vivo. Nature 421, 844–848.
Kobayashi, M., Hamada, T., Kogo, M., Yanagawa, Y., Obata, K., and Kang, Y. (2008). Developmental profile of GABAA-mediated synaptic transmission in pyramidal cells of the somatosensory cortex. Eur. J. Neurosci. 28, 849–861.
Larkum, M. E., Senn, W., and Luscher, H. R. (2004). Top-down dendritic input increases the gain of layer 5 pyramidal neurons. Cereb. Cortex 14, 1059–1070.
Larkum, M. E., Zhu, J. J., and Sakmann, B. (1999). A new cellular mechanism for coupling inputs arriving at different cortical layers. Nature 398, 338–341.
Larkum, M. E., Zhu, J. J., and Sakmann, B. (2001). Dendritic mechanisms underlying the coupling of the dendritic with the axonal action potential initiation zone of adult rat layer 5 pyramidal neurons. J. Physiol. 533, 447–466.
Lawrence, J. J., Grinspan, Z. M., Statland, J. M., and McBain, C. J. (2006). Muscarinic receptor activation tunes mouse stratum oriens interneurones to amplify spike reliability. J. Physiol. 571, 555–562.
Lazarus, M. S., and Huang, Z. J. (2011). Distinct maturation profiles of perisomatic and dendritic targeting GABAergic interneurons in the mouse primary visual cortex during the critical period of ocular dominance plasticity. J. Neurophysiol. 106, 775–787.
Lee, S. H., Land, P. W., and Simons, D. J. (2007). Layer- and cell-type-specific effects of neonatal whisker-trimming in adult rat barrel cortex. J. Neurophysiol. 97, 4380–4385.
Lewis, D. A., Hashimoto, T., and Volk, D. W. (2005). Cortical inhibitory neurons and schizophrenia. Nat. Rev. Neurosci. 6, 312–324.
Lewis, T. J., and Rinzel, J. (2003). Dynamics of spiking neurons connected by both inhibitory and electrical coupling. J. Comput. Neurosci. 14, 283–309.
Lien, C. C., and Jonas, P. (2003). Kv3 potassium conductance is necessary and kinetically optimized for high-frequency action potential generation in hippocampal interneurons. J. Neurosci. 23, 2058–2068.
Long, M. A., Cruikshank, S. J., Jutras, M. J., and Connors, B. W. (2005). Abrupt maturation of a spike-synchronizing mechanism in neocortex. J. Neurosci. 25, 7309–7316.
Lovett-Barron, M., Turi, G. F., Kaifosh, P., Lee, P. H., Bolze, F., Sun, X. H., Nicoud, J. F., Zemelman, B. V., Sternson, S. M., and Losonczy, A. (2012). Regulation of neuronal input transformations by tunable dendritic inhibition. Nat. Neurosci. 15, 423–430.
Luthi, A., and McCormick, D. A. (1998). H-current: properties of a neuronal and network pacemaker. Neuron 21, 9–12.
Ma, Y., Hu, H., and Agmon, A. (2012). Short-term plasticity of unitary inhibitory-to-inhibitory synapses depends on the presynaptic interneuron subtype. J. Neurosci. 32, 983–988.
Ma, Y., Hu, H., Berrebi, A. S., Mathers, P. H., and Agmon, A. (2006). Distinct subtypes of somatostatin-containing neocortical interneurons revealed in transgenic mice. J. Neurosci. 26, 5069–5082.
Maccaferri, G., and McBain, C. J. (1996). The hyperpolarization-activated current (Ih) and its contribution to pacemaker activity in rat CA1 hippocampal stratum oriens-alveus interneurones. J. Physiol. 497(Pt 1), 119–130.
Mancilla, J. G., Lewis, T. J., Pinto, D. J., Rinzel, J., and Connors, B. W. (2007). Synchronization of electrically coupled pairs of inhibitory interneurons in neocortex. J. Neurosci. 27, 2058–2073.
Maravall, M., Stern, E. A., and Svoboda, K. (2004). Development of intrinsic properties and excitability of layer 2/3 pyramidal neurons during a critical period for sensory maps in rat barrel cortex. J. Neurophysiol. 92, 144–156.
Markram, H., Toledo-Rodriguez, M., Wang, Y., Gupta, A., Silberberg, G., and Wu, C. (2004). Interneurons of the neocortical inhibitory system. Nat. Rev. Neurosci. 5, 793–807.
McCormick, D. A., and Pape, H. C. (1990). Properties of a hyperpolarization-activated cation current and its role in rhythmic oscillation in thalamic relay neurones. J. Physiol. 431, 291–318.
McCormick, D. A., and Prince, D. A. (1987). Post-natal development of electrophysiological properties of rat cerebral cortical pyramidal neurones. J. Physiol. 393, 743–762.
McGarry, L. M., Packer, A. M., Fino, E., Nikolenko, V., Sippy, T., and Yuste, R. (2010). Quantitative classification of somatostatin-positive neocortical interneurons identifies three interneuron subtypes. Front. Neural Circuits 4:12. doi: 10.3389/fncir.2010.00012
Mehaffey, W. H., Doiron, B., Maler, L., and Turner, R. W. (2005). Deterministic multiplicative gain control with active dendrites. J. Neurosci. 25, 9968–9977.
Mitchell, S. J., and Silver, R. A. (2003). Shunting inhibition modulates neuronal gain during synaptic excitation. Neuron 38, 433–445.
Mosconi, T., Woolsey, T. A., and Jacquin, M. F. (2010). Passive vs. active touch-induced activity in the developing whisker pathway. Eur. J. Neurosci. 32, 1354–1363.
Murayama, M., and Larkum, M. E. (2009). Enhanced dendritic activity in awake rats. Proc. Natl. Acad. Sci. U.S.A. 106, 20482–20486.
Oliva, A. A. Jr., Jiang, M., Lam, T., Smith, K. L., and Swann, J. W. (2000). Novel hippocampal interneuronal subtypes identified using transgenic mice that express green fluorescent protein in GABAergic interneurons. J. Neurosci. 20, 3354–3368.
Oswald, A. M., and Reyes, A. D. (2008). Maturation of intrinsic and synaptic properties of layer 2/3 pyramidal neurons in mouse auditory cortex. J. Neurophysiol. 99, 2998–3008.
Oswald, A. M., and Reyes, A. D. (2011). Development of inhibitory timescales in auditory cortex. Cereb. Cortex 21, 1351–1361.
Pape, H. C. (1996). Queer current and pacemaker: the hyperpolarization-activated cation current in neurons. Annu. Rev. Physiol. 58, 299–327.
Perez-Garci, E., Gassmann, M., Bettler, B., and Larkum, M. E. (2006). The GABAB1b isoform mediates long-lasting inhibition of dendritic Ca2+ spikes in layer 5 somatosensory pyramidal neurons. Neuron 50, 603–616.
Petersen, C. C., Hahn, T. T., Mehta, M., Grinvald, A., and Sakmann, B. (2003). Interaction of sensory responses with spontaneous depolarization in layer 2/3 barrel cortex. Proc. Natl. Acad. Sci. U.S.A. 100, 13638–13643.
Petreanu, L., Huber, D., Sobczyk, A., and Svoboda, K. (2007). Channelrhodopsin-2-assisted circuit mapping of long-range callosal projections. Nat. Neurosci. 10, 663–668.
Petreanu, L., Mao, T., Sternson, S. M., and Svoboda, K. (2009). The subcellular organization of neocortical excitatory connections. Nature 457, 1142–1145.
Porter, J. T., Johnson, C. K., and Agmon, A. (2001). Diverse types of interneurons generate thalamus-evoked feedforward inhibition in the mouse barrel cortex. J. Neurosci. 21, 2699–2710.
Rudolph, M., Pelletier, J. G., Pare, D., and Destexhe, A. (2005). Characterization of synaptic conductances and integrative properties during electrically induced EEG-activated states in neocortical neurons in vivo. J. Neurophysiol. 94, 2805–2821.
Rudy, B., and McBain, C. J. (2001). Kv3 channels: voltage-gated K+ channels designed for high-frequency repetitive firing. Trends Neurosci. 24, 517–526.
Sanchez-Vives, M. V., and McCormick, D. A. (2000). Cellular and network mechanisms of rhythmic recurrent activity in neocortex. Nat. Neurosci. 3, 1027–1034.
Shu, Y., Hasenstaub, A., and McCormick, D. A. (2003). Turning on and off recurrent balanced cortical activity. Nature 423, 288–293.
Silberberg, G., and Markram, H. (2007). Disynaptic inhibition between neocortical pyramidal cells mediated by Martinotti cells. Neuron 53, 735–746.
Steriade, M., Nunez, A., and Amzica, F. (1993). A novel slow (<1 Hz) oscillation of neocortical neurons in vivo: depolarizing and hyperpolarizing components. J. Neurosci. 13, 3252–3265.
Steriade, M., Timofeev, I., and Grenier, F. (2001). Natural waking and sleep states: a view from inside neocortical neurons. J. Neurophysiol. 85, 1969–1985.
Sugino, K., Hempel, C. M., Miller, M. N., Hattox, A. M., Shapiro, P., Wu, C., Huang, Z. J., and Nelson, S. B. (2006). Molecular taxonomy of major neuronal classes in the adult mouse forebrain. Nat. Neurosci. 9, 99–107.
Tan, Z., Hu, H., Huang, Z. J., and Agmon, A. (2008). Robust but delayed thalamocortical activation of dendritic-targeting inhibitory interneurons. Proc. Natl. Acad. Sci. U.S.A. 105, 2187–2192.
Vierling-Claassen, D., Cardin, J. A., Moore, C. I., and Jones, S. R. (2010). Computational modeling of distinct neocortical oscillations driven by cell-type selective optogenetic drive: separable resonant circuits controlled by low-threshold spiking and fast-spiking interneurons. Front. Hum. Neurosci. 4:198. doi: 10.3389/fnhum.2010.00198
Yizhar, O., Fenno, L. E., Prigge, M., Schneider, F., Davidson, T. J., O'Shea, D. J., Sohal, V. S., Goshen, I., Finkelstein, J., Paz, J. T., Stehfest, K., Fudim, R., Ramakrishnan, C., Huguenard, J. R., Hegemann, P., and Deisseroth, K. (2011). Neocortical excitation/inhibition balance in information processing and social dysfunction. Nature 477, 171–178.
Zhang, L., and McBain, C. J. (1995). Potassium conductances underlying repolarization and after-hyperpolarization in rat CA1 hippocampal interneurones. J. Physiol. 488(Pt 3), 661–672.
Keywords: somatostatin, inhibition, somatosensory cortex, postnatal development
Citation: Kinnischtzke AK, Sewall AM, Berkepile JM and Fanselow EE (2012) Postnatal maturation of somatostatin-expressing inhibitory cells in the somatosensory cortex of GIN mice. Front. Neural Circuits 6:33. doi: 10.3389/fncir.2012.00033
Received: 01 March 2012; Accepted: 14 May 2012;
Published online: 31 May 2012.
Edited by:
Jessica Cardin, Yale University School of Medicine, USAReviewed by:
Ariel Agmon, West Virginia University, USABernardo Rudy, New York University School of Medicine, USA
Copyright: © 2012 Kinnischtzke, Sewall, Berkepile and Fanselow. This is an open-access article distributed under the terms of the Creative Commons Attribution Non Commercial License, which permits non-commercial use, distribution, and reproduction in other forums, provided the original authors and source are credited.
*Correspondence: Erika E. Fanselow, Department of Neurobiology, University of Pittsburgh School of Medicine, W1458 BST, 200 Lothrop St., Pittsburgh, PA 15261, USA. e-mail: circuit@pitt.edu