Analysis and modeling of ensemble recordings from respiratory pre-motor neurons indicate changes in functional network architecture after acute hypoxia
- 1 Department of Neurosciences, School of Medicine, Case Western Reserve University, Cleveland, OH, USA
- 2 Pulmonary, Critical Care and Sleep Medicine, Department of Medicine, School of Medicine, Case Western Reserve University, Cleveland, OH, USA
We have combined neurophysiologic recording, statistical analysis, and computational modeling to investigate the dynamics of the respiratory network in the brainstem. Using a multielectrode array, we recorded ensembles of respiratory neurons in perfused in situ rat preparations that produce spontaneous breathing patterns, focusing on inspiratory pre-motor neurons. We compared firing rates and neuronal synchronization among these neurons before and after a brief hypoxic stimulus. We observed a significant decrease in the number of spikes after stimulation, in part due to a transient slowing of the respiratory pattern. However, the median interspike interval did not change, suggesting that the firing threshold of the neurons was not affected but rather the synaptic input was. A bootstrap analysis of synchrony between spike trains revealed that both before and after brief hypoxia, up to 45% (but typically less than 5%) of coincident spikes across neuronal pairs was not explained by chance. Most likely, this synchrony resulted from common synaptic input to the pre-motor population, an example of stochastic synchronization. After brief hypoxia most pairs were less synchronized, although some were more, suggesting that the respiratory network was transiently “rewired” after the stimulus. To investigate this hypothesis, we created a simple computational model with feed-forward divergent connections along the inspiratory pathway. Assuming that (1) the number of divergent projections was not the same for all presynaptic cells, but rather spanned a wide range and (2) that the stimulus increased inhibition at the top of the network; this model reproduced the reduction in firing rate and bootstrap-corrected synchrony subsequent to hypoxic stimulation observed in our experimental data.
Introduction
Respiration is controlled by neuronal circuits in the brainstem that have been studied extensively using various approaches and experimental techniques. The respiratory rhythm is generated in the ventrolateral brainstem and while the exact mechanism responsible for its genesis is debated (Del Negro et al., 2002; Rybak et al., 2008) the pathway by which the brainstem relays inspiratory signals to the diaphragm is well documented. As such, the brainstem, in particular the ventral respiratory column, represents an excellent model to study the neuronal control of motor responses that are self-regulated, adaptive and malleable.
Independent of the underlying interactions between intrinsic cellular properties and extrinsic network properties to generate inspiration, the formation of inspiratory motor activity is amenable to a hierarchical model with three layers. The first and second layers are in the rostral ventrolateral respiratory column. This group of neurons contains distinct neuronal populations. The first layer is in the pre-Bötzinger complex (preBötC) and is involved in the initiation of inspiration (pre-inspiratory, pre-I), whereas the second layer is less defined anatomically and contributes to the ramping output pattern (inspiratory-augmenting, I-Aug). The third layer is the rostral ventral respiratory group (rVRG), which is caudal to the preBötC and is a population of bulbo-spinal premotor neurons that transmit central inspiratory drive to spinal motoneurons, whose axons innervate the diaphragm. Thus, within this hierarchical organization the preBötC determines the timing of inspiration (rhythmicity), whereas each subsequent layer modulates the shape and amplitude of the efferent signals which directly control the mechanics of inspiration.
In this paper, we focus on the connectivity and coherent firing in a subpopulation of neurons that comprise a significant portion of the inspiratory motor output in the respiratory column (Feldman et al., 1984). This study utilizes multielectrode array recordings from an in situ rat preparation allowing us to monitor the neuronal activity of many neurons simultaneously as well as the phrenic motor output (Baekey et al., 2001). In addition, we performed a statistical analysis of these data using bootstrap techniques allowing us to identify temporal correlations (spike synchrony) between spike trains from different neurons that cannot be accounted for by chance. Synchronous activity may be derived from common input and as such, synchrony reflects the underlying connectivity from one layer to the next. In effect, recent experimental, theoretical and computational studies have demonstrated that neurons receiving stochastic partially common inputs fire synchronous spikes (Galán et al., 2006b; Galán et al., 2007a; Ermentrout et al., 2008), a phenomenon known as stochastic synchronization. The fraction of synchronous spikes increases monotonically with increasing correlation (overlap) of the synaptic inputs (Galán et al., 2006b; Galán et al., 2007a; Ermentrout et al., 2008). Thus, the amount of synchrony between two spike trains that cannot be accounted for by chance reflects the amount of common input to the neuronal pair. In the final part of the study, we use this relationship to model the connections between presynaptic neurons with divergent projections onto postsynaptic neurons. In summary, we have recorded from pre-motor inspiratory neurons and from their pair-wise synchronization, we reverse-engineer the connectivity with an upstream layer of inspiratory-augmenting neurons (I-Aug), which in turn is driven by the neurons in the preBötC referred to above.
The respiratory rhythm is quite variable and can be modulated in amplitude and frequency by external stimuli, such as low oxygen (hypoxia). Whereas the frequency and amplitude of respiration increase during acute hypoxia (Powell et al., 1998), subsequently, the respiratory frequency decreases below baseline and gradually recovers over the next few minutes in what is known as post-hypoxic frequency decline, PHFD (Coles and Dick, 1996; Dick et al., 2004). We hypothesized this behavior is reflected in the neuronal activity of the ventral respiratory column. Thus, we expected changes not only in the firing rates of the neurons but also in their temporal cross-correlations, e.g., spike synchronization. In this paper, we report our analysis revealing significant changes in spike synchrony across pre-motor neurons after hypoxia.
Materials and Methods
Experimental Methods
All experiments were performed in accordance with the guidelines of the Institutional Animal Care and Use Committee (IACUC) of Case Western Reserve University.
General surgical methods
For these experiments we used the working heart brainstem preparation (WHBP) of the rat (Paton, 1996) (Figure 1). Male Sprague-Dawley rats (n = 6) (P21–P28, 60–100 g) were pretreated with heparin sodium (1000 units – IP), anesthetized with isoflurane (2–3%), then bisected below the diaphragm. The rostral half of the animal was submerged in cold artificial cerebrospinal fluid (aCSF) to decerebrate at the precollicular level. We removed the fur, skin and viscera, dissected the phrenic motor nerve and descending aorta and exposed the dorsal medullary surface.
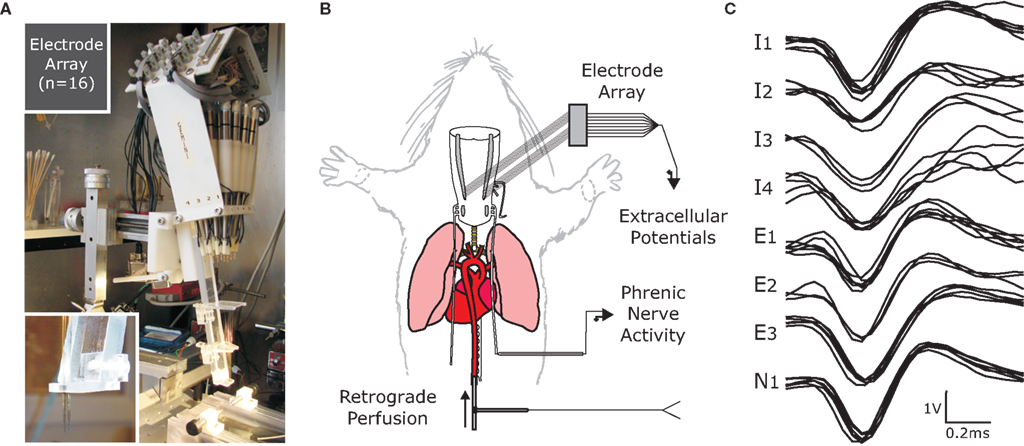
Figure 1. Multielectrode array technology (A) was applied to an in situ perfused rat preparation (B) to obtain ensemble recordings (C). (A) The electrode array had 16 tungsten microelectrodes with impedance 10–12 MΩ. Each individual electrode was positioned with a micromotor in steps as small as 1 μm over a range of 1 cm. (B) Decerebrate P21–P28 rats were retrogradely perfused through the descending aorta with artificial cerebrospinal fluid bubbled with 95% O2/5% CO2. These preparations generate spontaneous respiratory pattern, which was monitored from phrenic nerve activity. (C) Extracellular action potentials were digitized and recorded using CED Spike2 software and a Power1401 data acquisition system. (The amplitude calibration as labeled is for seven of the recordings; the exception is I4 for which it is 0.2 V).
After surgery, the preparation was moved to the recording chamber and mounted supine in a stereotaxic frame. The distal end of the descending aorta was cannulated with a #4 French, double-lumen catheter (Braintree Scientific) and perfused (21–28 ml/min – Marlow Watson 505S peristaltic pump) with an iso-osmotic aCSF saturated with 95% O2/5% CO2. Perfusion pressure was monitored through the other lumen (CWE TA-100 transducer-amplifier). The preparation was immobilized with vecuronium bromide (0.4 mg/200 ml perfusate). Perfusion pressure was maintained at 60–80 mmHg and corrected with 4 μM vasopressin (20 μl added to perfusate, as needed). Additionally, NaCN (0.1%, 50-μl bolus) was used to stimulate carotid chemoreceptors transiently initiating respiratory patterning in the preparation.
Electrode placement and neuronal sampling strategy
The distal end of the left phrenic nerve was drawn into a bipolar suction electrode. The signal was amplified (Grass P511), filtered (0.1–3 KHz) and digitized using a CED Power 1401 and Dell PC running Spike2 software. Pressure was adjusted to maintain an appropriate perfusion of the brainstem and pons indicated by a ramp patterned phrenic nerve output bursting at 15–30 breaths per minute and post inspiratory activity in the vagus nerve recording.
The 16-channel microelectrode array was secured on a stereotaxic frame aligning the tungsten electrodes (10–12 MΩ) perpendicular to the neural surface with eight electrodes on either side of the brainstem. Each set of eight was divided into two sagittally oriented linear rows of four electrodes separated by 250 μm while electrodes within each row are separated by 300 μm. Stereotaxic coordinates were used to position electrodes bilaterally among inspiratory pre-motor neurons in the rVRG. Each electrode was positioned in steps as small as a micron to isolate a single extracellular potential (Figure 1). In cases where more than one neuron was recorded on a single electrode, the principle component analysis (PCA) feature of the Spike2 software was used to discriminate individual spike trains (spike sorting). The independent depth adjustment of each electrode optimized the yield of parallel single neuron recordings.
Experimental protocol
With many single neurons monitored in the rVRG and a satisfactory nerve recording (signal-to-noise ratio >3), a 10-min baseline recording was made to characterize the recorded neurons, assess baseline synchrony, and for comparison with the poststimulus activity. After the baseline recording, the preparation was exposed to hypoxic perfusate (8% O2/5% CO2) for 15–25 s evoking a hypoxic ventilatory response followed by PHFD (Dick et al., 2001). Signals were recorded in Spike2 software for subsequent off-line analysis.
Data Analysis
Table 1 summarizes the source of the experimental data sets considered in this study. We recorded from brainstem respiratory neurons of six different rats. We recorded simultaneously from 8 to 23 neurons in a preparation and exposed each preparation to brief hypoxia (see Experimental Protocol) up to three times. While our recordings included inspiratory, expiratory, and non-modulated activity patterns, our analysis focused on the inspiratory activity. The total number of pairs of inspiratory neurons was 562. Some neuronal pairs were duplicates because each stimulation was considered as a different experiment, as the hypoxic stimuli were transient and reversible. If only one hypoxic exposure was analyzed for each animal, i.e., if each pair was considered once in our analysis, then the total number of pairs would be 203. However, these results were qualitatively the same as those for the 562 pairs.
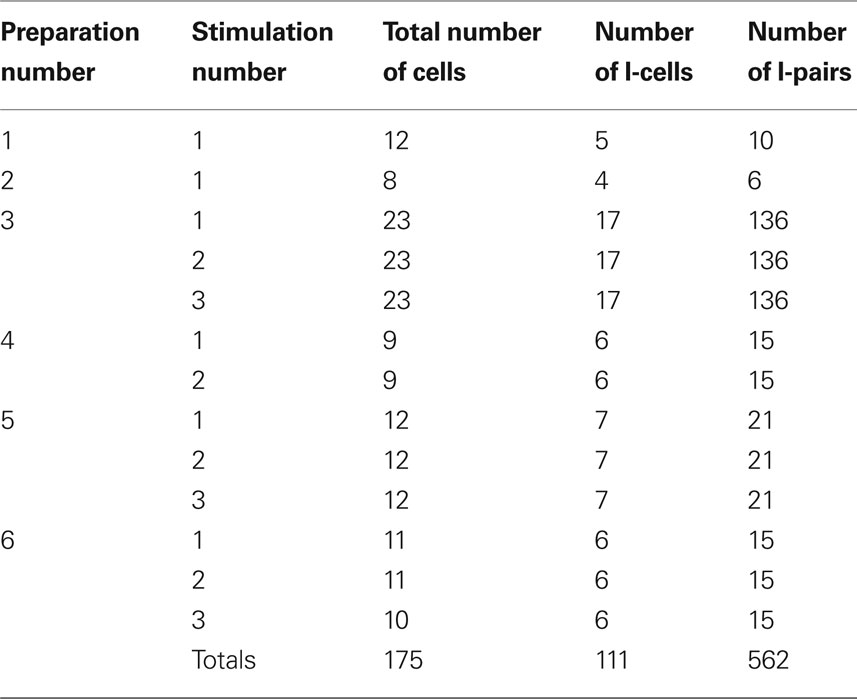
Table 1. Origin of the data and number of cells and pairs investigated.
Epochs (80 s) of the recordings were analyzed for baseline and PHFD. The recorded data included extracellular potentials from the microelectrode array and phrenic nerve activity (PNA). Multi-fiber PNA was “integrated” (low-pass filtered) with a linear integrator using a 100-ms time constant to obtain a moving-time average of activity (Figures 2A,B) and using this integrated PNA, time stamps were added to indicate the onset of each inspiratory and expiratory phase. Action potentials of single neurons were converted to times of occurrence, i.e., spike trains (Figures 2A,B). These processed epochs were exported to Matlab (version R2008a) for further analysis.
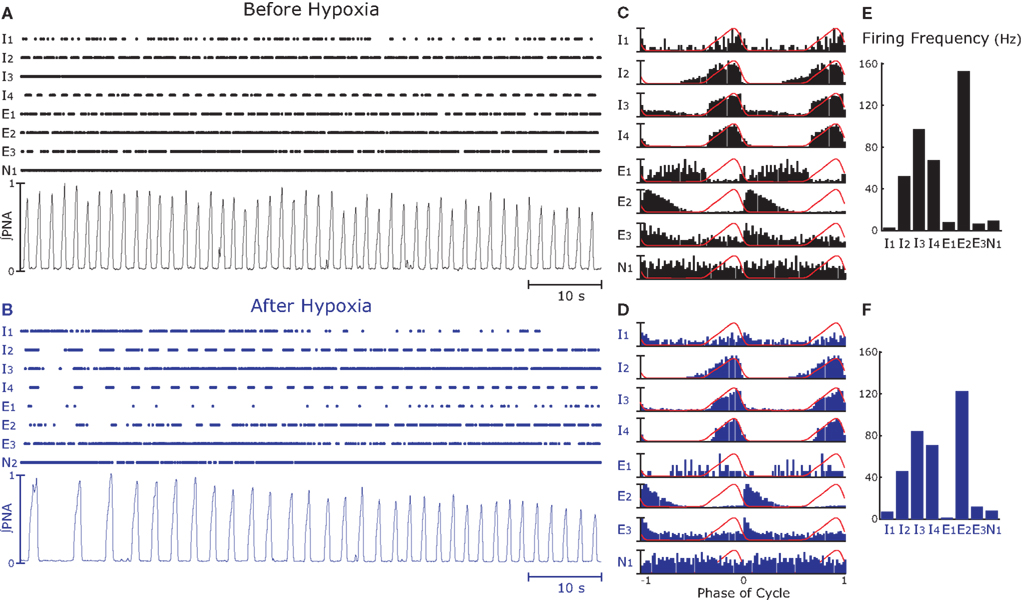
Figure 2. Simultaneous recordings of neurons (n = 8) in the rostral ventral respiratory group (raster plots) and integrated phrenic nerve activity (∫PNA, see Data Analysis) before (A) and after (B) hypoxia. (A,B) The complete 80-s epochs analyzed; raster plots of eight simultaneously recorded neurons (those in Figure 1) and ∫PNA. In (B), immediately after hypoxia (8% O2, 5% CO2, and 87% N2 for 15 s), respiratory frequency is less than that before hypoxia (A) and amplitude of ∫PNA displays. (C,D) Cycle-triggered averages (CTA) of spike activity during the epochs. Recordings were from the caudal VRC and include neurons with inspiratory- (I1, I2, I3, I4), expiratory- (E1, E2, E3), and a non-respiratory (N1)-modulated activity. Except for I1 and E1, major features of the activity profiles in the CTA did not change after hypoxia. (E,F) Action potential firing frequency decreased after hypoxia.
The following measures were computed from a 10-min baseline period in order to ensure that there was only one neuron per channel and to characterize the cell-type: (1) Autocorrelation histograms were created for each spike train to ensure that it represents the activity of a single neuron (not shown). A spike train with potentials from two or more neurons would include short intervals not constrained by refractoriness. (2) Cycle-triggered histograms (Figures 2C,D) were used to classify activity patterns with significant respiratory modulation according to the phase (inspiratory – I, or expiratory – E) in which they are more active and by trends in their burst patterns (augmenting, decrementing or plateau). The cycle-triggered histograms were computed as the cross-correlation function of a spike train with respect to the phase of the phrenic nerve signal. The phase was calculated by linear interpolation of time between the beginning and the end of the respiratory cycle. Specifically, if tk denotes the beginning of the k-th cycle, or equivalently, the end of the (k − 1)-th cycle, the phase is defined as: φ(t) = (t − tk)/(tk+1 − tk) for tk ≤ t < tk+1. The beginning of the respiratory cycle, i.e., the trigger, was considered as the termination of inspiration.
Firing rates
The firing rate of a neuron is calculated as the inverse of the median interspike interval (ISI). This is a good approximation to the intraburst firing frequency. In other words, if two spike trains have different number of bursts but the firing frequency during the bursts is the same, then the firing rate will return very similar values.
Raw synchrony as a cross-correlation coefficient between spike trains
Our experiments are designed to quantify spike synchrony across neurons in the respiratory column, and their modulation across different states of the preparation. Spike synchronization between neuron X and Y is calculated in the following way. Let  be the time of the i-th spike in channel X and let
  be the time of the j-th spike in neuron Y. For each spike time pair
  the relative separation is compared to a tolerance, δ = 2 ms. We then define Rxy as the number of pairs such that
  Analogously we define Rxx as the number of pairs such that
  and Ryy as the number of pairs such that
  A raw estimate of spike synchrony then reads:
If δ is sufficiently small, i.e., much smaller than the typical ISI, and the two neurons fire at the same rate, expression (1) yields the fraction of spikes that occur at the same time in both neurons. This measure resembles the definitions of neuronal synchronization and spike time reliability reported in various publications (Hunter et al., 1998; Schreiber et al., 2004; Galán et al., 2006a, 2007b), which are equivalent to the cross-correlation coefficient of two spike trains convolved with a Gaussian or a step function of width 2δ. In fact, the algorithm described above is mathematically equivalent to the latter case but without calculating the convolution explicitly. This way, we only need to store spike times in the computer’s memory and not the whole binary traces (1 = spike, 0 = no spike) representing the firing of each neuron, which would be required to calculate the convolution explicitly. Because the binary traces are sparse, i.e., they contain many more 0’s than 1’s, by keeping the spike times only we save a significant fraction of memory space, which in turn speeds the computational implementation of our synchrony algorithm considerably. For example, the analysis presented in Figure 2 took just a few seconds to run fully in Matlab R2008a on a Dell PC with an Intel® Xeon® CPU (1.60 GHz with 2GB RAM). Furthermore, since this measure of synchrony is fundamentally a cross-correlation matrix, it allows us to run a clustering analysis to identify neuronal pairs that are more coherent among themselves than with respect to other neuronal groups (see Figure 4). This technique has demonstrated the existence of synchronized assemblies among inspiratory neurons of the central pattern generator of respiration (Baekey et al., 2009), which is upstream of the network investigated here.
Bootstrapping and bootstrap-corrected synchrony
Expression (1) quantifies the total amount of synchronization, including the fraction of synchronous spikes that would occur by chance in two uncoupled neurons receiving independent inputs. We therefore refer to it as raw synchrony. Since we are interested in the synchronous events that occur as a result of network interactions, we need to subtract the amount of synchrony expected by chance,  which is higher, the higher the firing rates of the neurons. To this end, we apply a standard bootstrap technique: we use surrogate data obtained by shuffling the spike times of each neuron independently.
By shuffling we mean that the ISI from the actual recordings are randomly permuted. For example: Let the times of four successive spikes be {t1, t2, t3, t4}. The ISI are {Δ1 = t2 − t1,Δ2 = t3 − t2, Δ3 = t4 − t3}. A randomly shuffled sequence of ISI {Δ2, Δ3, Δ1} results in the shuffled spike train {t1, t1 + Δ2, t1 + Δ2 + Δ3, t1 + Δ2 + Δ3 + Δ1} = {t1, t1 − t2 + t3, t1 − t2 + t4, t4}, which has the same ISI distribution as the original spike train as well as the same mean firing rate. Note that shuffling preserves the times of the first and last spikes. As a result, all shuffles will have at least these two spikes fully synchronized. To correct for this artifactual “synchrony” the shuffled sequence was randomly shifted up to hundred milliseconds.
Because the firing pattern of each neuron is typically different during inspiration and expiration, we shuffle the spikes separately for the inspiratory and the expiratory phase. This way the ISI distribution of the surrogates during inspiration is identical with the ISI distribution of the experimental data during inspiration, and analogously, during expiration. Spike-shuffling, however, alters the timing of the spikes randomly and therefore, the auto- and cross-correlations of the actual data are not preserved in the surrogates. Since the spikes of each neuron are shuffled independently, the level of synchrony in the surrogate data represents the amount of synchrony that can be accounted for by chance. Obviously, this value depends on how the spikes were shuffled, i.e., on the random realization of the surrogate data set. Thus, in order to be more rigorous, we first generate N = 300 surrogate data sets for each neuronal pair XY and then calculate the distribution of synchrony values. The 99th percentile of this distribution is our estimate of synchrony by chance,  This implies that if the synchrony level for that pair in the actual data,
  is greater than
  then that synchrony level is significant with 99% confidence. Moreover, the difference
  represents the amount of synchrony that cannot be accounted for by chance and is therefore due to temporal correlations emerging from network interactions. Our bootstrap-corrected synchrony measure, Sxy thus reads:
Note that Sxy reports the level of non-trivial spike synchronization. Indeed, for two different neurons, Sxy is the amount of synchrony that cannot be accounted for by chance, and for the same neuron, Sxx is always zero, since a spike train is always perfectly synchronized with itself but this synchrony is trivial.
Computational Simulations and Network Model
General considerations about the model
The purpose of the computer simulations is to investigate a minimalist model of the brainstem inspiratory network that replicates the following features of the experimental data: (1) during baseline conditions, significant spike synchrony in pairs of inspiratory premotor neurons reflects common synaptic inputs; (2) after hypoxia, the firing rate of inspiratory premotor neurons decreases significantly due to decreased excitation or increased inhibition; and (3) after hypoxia, there are significant changes in synchrony that cannot be explained by chance nor by the reduction in the firing rates. Most of these changes are negative (synchrony decreases) but some are positive.
Our network simulations, although original, borrow several elements from previously published models. We employ simplified but realistic models of the single neuron dynamics, as is the case with other models of the respiratory network (Rybak et al., 2004, 2008) and divide the network into a pre-inspiratory population, an inspiratory population and an inspiratory premotor population (see Figure 6). We record from the inspiratory premotor population in our experiments. These neurons project to motoneurons whose axons form the phrenic nerve, which are not included in our model.
The single-cell dynamics have been adapted from the neuronal model recently proposed by Izhikevich, which is basically a quadratic integrate-and-fire model with realistic phase-resetting properties. This model consists of two variables, the membrane potential and a recovery variable, both with a resetting threshold (Izhikevich, 2004).
Recent experimental work has provided evidence for functional SK channels (a subtype of calcium dependent potassium channels) in pre-motor neurons (Tonkovic-Capin et al., 2003). These channels, similar to other potassium channels, endow neurons with type II excitability, which can be modeled as neurons with a resonator-like phase-resetting curve (Galán et al., 2006a). Therefore we use the Izhikevich model of resonator neuron for the pre-motor population and for simplicity, for the inspiratory population as well. For the pre-inspiratory neurons in the preBötC we use a similar model but with a saw-tooth drive, I(t) that mimics the intrinsic bursting properties of these neurons along the lines of models previously published by other groups (Butera et al., 1999a,b; Del Negro et al., 2001).
In order to produce population wide activity that is synchronized on the time scale of the inspiratory burst, all pre-inspiratory neurons were driven by a saw-tooth drive, I(t), and noise was added to produce a temporal dispersion of spiking activity. The resulting pattern of pre-inspiratory activity mimicked the pattern described in previous models where biophysical mechanisms producing a slow wave, saw-tooth-like membrane potential trajectory were incorporated along with heterogeneity of cellular and synaptic properties (Butera et al., 1999a,b; Del Negro et al., 2001). We note that this form of coherent activity may also be facilitated by the presence of gap junctions in the system (Rekling et al., 2000; Bou-Flores and Berger, 2001; Solomon et al., 2001).
Network architecture
Stochastic synchronization is an efficient mechanism for generating coherent activity in neuronal networks (Galán et al., 2006b). This phenomenon emerges when uncoupled neurons receive common fluctuating inputs, for example, synaptic barrages from divergent presynaptic terminals. Because this connectivity pattern is ubiquitous in the brain, stochastic synchronization can account for most temporal correlations observed in neural circuits. We therefore hypothesize that this is the phenomenon underlying spike synchronization in the brainstem inspiratory network. Since feed-forward divergent projections are sufficient to cause downstream synchrony, we modeled a pure feed-forward network (i.e., no connections within each layer). A simplified diagram is shown in Figure 6 (left) to illustrate the fundamental features of the simulated network: pre-inspiratory neurons in the pre-Bötzinger complex (excitatory (+) and inhibitory (−) open circles); inspiratory-augmenting neurons in the area of the pre-Bötzinger complex (3 circles: red, yellow, and blue); and pre-motor neurons in the rVRG (9 circles: red, orange, purple, green, and blue). The similarity of the colors between any two premotor neurons indicates the proportion of common inputs, i.e., the blending of the primary colors: red, blue and yellow. While not all inputs to pre-motor neurons necessarily originate from the inspiratory-augmenting population in the pre-Bötzinger area, a significant portion do (Schwarzacher et al., 1995). For the purpose our model the exact anatomical location of the neurons is not essential. Note that in our model the concept of layer is topological, not anatomical: it refers to how neurons are connected, and not to where they are precisely located.
Recently published data demonstrate that a fraction of inspiratory pacemaker neurons in the pre-Bötzinger complex are inhibitory, as they express the glycine transporter 2 (GlyT2) gene (Morgado-Valle et al., 2010). We assume in our model that the majority of pre-inspiratory neurons are inhibitory. Although there is no direct evidence for this assumption, it is consistent with recent studies demonstrating that a major fraction of all inspiratory neurons in the rodent brainstem slice preparation are glycinergic (Winter et al., 2010).
In our model, both excitatory and inhibitory pre-Bötzinger complex neurons provide divergent connections to the inspiratory-augmenting population. Each of the pre-inspiratory “pacemaker” neurons has the same connection probability with any inspiratory-augmenting neuron. Modifying the ratio between inhibition and excitation while keeping the other parameters of the network unchanged, we determined that there must be at least 15% excitation (ratio inhibition/excitation = 85/15) in order for the premotor neurons to fire some spikes. However, the firing rate, the synchrony values and their changes after hypoxia were only comparable with the experimental results when the fraction of excitatory pre-inspiratory neurons was in the range between 25% and 45%. When that fraction was over 50%, the median bootstrap corrected synchrony between premotor neurons took large values (around 0.6 and higher) before and after hypoxia, indicating that most pairs were highly synchronized, contrary to what we observed experimentally. In the simulations producing the results shown in the figures, we took 70% of the pre-inspiratory neurons as inhibitory and 30% as excitatory (ratio 70/30).
The inspiratory-augmenting population in turn provides divergent excitatory connections to pre-motor neurons, but not with equal probability. The connection probability ranges from Pmin = 10% to Pmax = 30%. Moreover, the number of projections from each inspiratory-augmenting neuron plotted versus its rank in the population follows a power-law distribution. The rank equals one for the neuron with the largest number of projections and equals the total number of neurons for the neuron with the smallest number of projections. The power-law distribution is not essential to reproduce the experimental data. In fact, a distribution that decays exponentially with the rank yields qualitatively the same results, and so will any distribution that decays sufficiently fast with the rank, as it guarantees that the inspiratory-augmenting neurons are not equally driving the premotor neurons. This implies that some are strong drivers (hubs) but most are weak. In particular, the power-law distribution as a function of the rank, P(r), that we consider has the form: P(r) = Pmaxr−A, with A = log(Pmax/Pmin)/log(N). Although a uniform distribution can account for different levels of synchrony between pre-motor pairs, it can neither reproduce the range of synchrony nor the synchrony changes after brief hypoxia that we observed in the experiments.
In addition to the network topology, the fast synaptic kinetics (τ ∼ 10 ms) contribute to the overall level of stochastic synchronization in the pre-motor population, as recently shown in simulations and experiments in other parts of the brain (Galán et al., 2008).
Implementation details
The dynamics of the r-th neuron in each subpopulation is determined by the membrane potential, V and a recovery variable, U. The parameters of the model are chosen so that the membrane potential is in mV and time in ms. When the membrane potential exceeds 30 mV, the membrane potential is reset to V = c and the recovery variable is reset to U = d (see Table 2).The superscripts indicate the neuronal type of each subpopulation: p for pre-inspiratory (30 neurons), i for inspiratory-augmenting (90 neurons) and m for premotor (100 neurons). The dynamics of the synaptic conductances for each neuron, r, are denoted by G. The superscripts indicate the neuronal type and the nature of the synaptic conductance: I for inhibitory, E for excitatory. The synaptic connections are denoted by J and are generated randomly with the probabilities described in the previous paragraph every time the simulation program runs. The superscripts of J refer to the layers being connected: pi for pre-inspiratory to inspiratory-augmenting neurons, and im for inspiratory-augmenting to premotor neurons. The sign “+” as a superscript means that only the excitatory connections are considered and the inhibitory connections are ignored. Analogously, the sign “−” as a superscript means that only the inhibitory connections are considered and the excitatory connections are ignored. The variable S tracks the firing of presynaptic neurons; S = 0, unless the presynaptic neuron fired at the previous time point, then S = 1. The dynamical equations were integrated in time with the Euler method (dt = 0.5 ms).
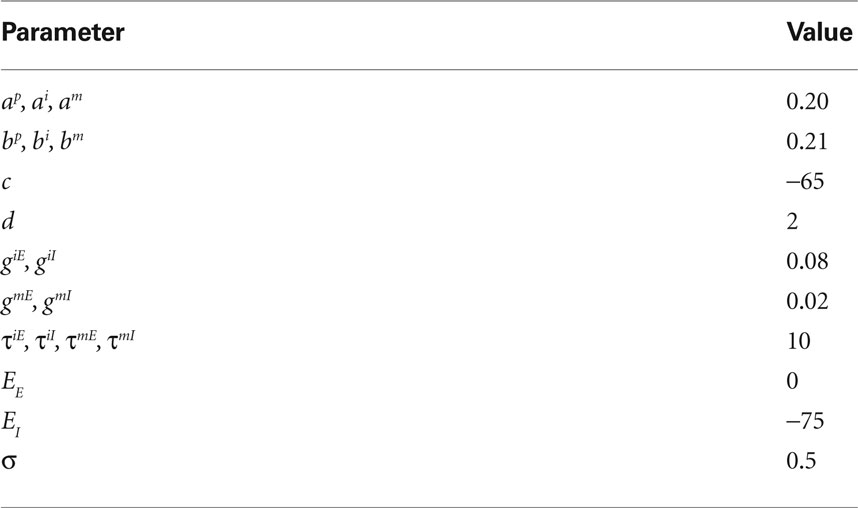
Table 2. Parameters used in the simulations and their values.
Dynamics of the pre-inspiratory population with an intrinsic saw-tooth drive, I(t) and background Gaussian noise, η(t) with standard deviation, σ:
Dynamics of the inspiratory population:
Dynamics of the pre-motor population:
Temporal evolution of synaptic conductances for the inspiratory neurons:
Temporal evolution of synaptic conductances for the premotor neurons:
In the absence of stimulation the neurons of the model rest around −60 mV. Neither the resting potential nor the resetting parameters c and d play a significant role in the dynamics of this quadratic integrate-and-fire model. In this type of model, the time T to reach the resetting threshold from any starting value of the membrane potential V0, is given by the arctangent function:  where I is the driving current. Note, that the arctangent function is a sigmoid with a horizontal asymptote for large negative values of V0. That means that for two different starting conditions
  and
and  such that
  and
and  the difference in time to reach threshold is negligible. Indeed, changing the value of c, d or the resting potential of the neurons has no effect on the frequency or synchrony in our model.
Modeling the dynamics after hypoxic stimulation
We hypothesize that hypoxic stimulation facilitates the recruitment of pre-inspiratory neurons. In our model, this implies that the inspiratory-augmenting neurons are being more inhibited, providing less excitation to the premotor neurons (Figure 6, right). As a result, the premotor neurons will have shorter and fewer bursts of activity, as observed in our experiments. In the simulations, the recruitment of pre-inspiratory cells is equivalent to adding more inhibitory neurons (10%), as compared to the network before hypoxia.
Results
Experimental Data
We recorded multielectrode data from six animals in the rVRG that included pre-motor inspiratory neurons, as reported in Table 1. A representative example of the recorded data for a given experiment is displayed in Figures 1C and 2. The raster plots show the firing of eight neurons over 80 s before and after hypoxia (Figures 2A,B, respectively). Integrated PNA is shown below the raster plots. The cross-correlation function between the phase of the phrenic nerve signal and the activity of each neuron, also known as cycle-triggered histogram (see Materials and Methods), is plotted in Figures 2C,D. These histograms allowed classification of the neurons according to the phase of the cycle when they were maximally active: inspiratory pre-motor neurons (I1–I4) were active during the burst of PNA (inspiration), whereas expiratory neurons (E1–E3) discharge when PNA was quiescent (expiration). One neuron was not modulated by respiration (N1). Neuronal firing frequency, calculated as the reciprocal of the median ISI (see Materials and Methods), is displayed in Figures 2E,F.
In the remaining analysis, we focused on the premotor neurons with inspiratory activity before and after hypoxia. After hypoxia there is an apparent decrease in the number and duration of bursts in these neurons. We then investigated whether the changes in spiking activity were consistent across neurons and whether, on a finer time scale, neurons are also tightly synchronized to each other.
For the 111 inspiratory pre-motor neurons, we observed a significant reduction of action potentials after hypoxia (p < 0.05, Wilcoxon sign rank test, Figure 3A). However, the intraburst firing frequency did not significantly change (Figure 3B). These results suggested that the inputs rather than the firing threshold of the neurons had changed, specifically an increase in inhibitory or decrease in excitatory inputs. We determined coincident (within a 2-ms time window) spikes during the 80-s epochs for each neuronal pair and found that the number of coincident events decreased significantly after hypoxia (p < 0.05 and Wilcoxon sign rank test, Figure 3C). This decrease could have resulted from the overall decrease in firing rate. Therefore, we calculated the harmonic mean of the action potentials for each neuron in the pair before and after hypoxia and found that it also decreased significantly (Figure 3D). However, we could not conclude that the decrease in synchronous spikes resulted from the decrease in firing rate. Because neuronal synchrony was defined by the cross-correlation coefficient between two spike trains, which was the number of coincident spikes divided by the harmonic mean of the spikes fired by each neuron (see Materials and Methods), we compared the numerator of this expression with the denominator, before (Figure 3E) and after (Figure 3F) hypoxia. In both cases, the numerator grew faster than the denominator as the number of fired spikes increased. The quadratic fit had a slightly shallower slope after compared to before hypoxia, suggesting that hypoxia reduced the overall level of raw neuronal synchrony across pairs of inspiratory pre-motor neurons.
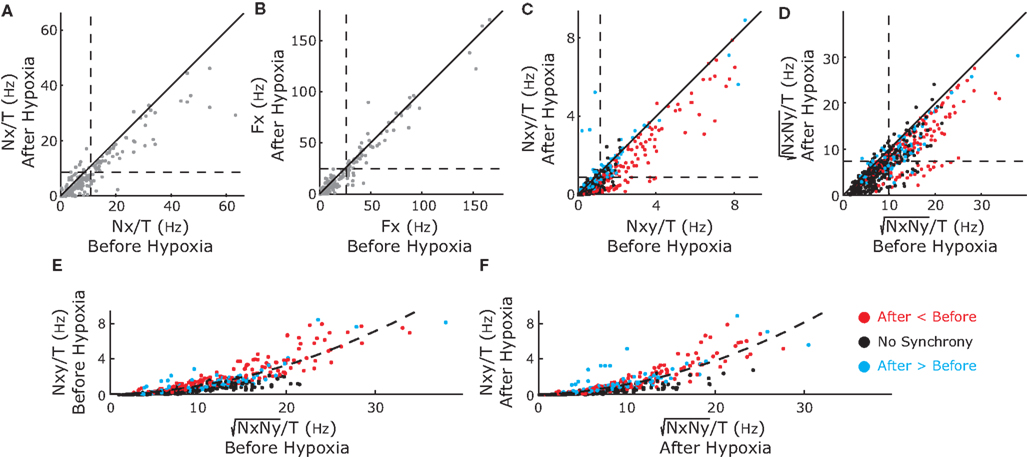
Figure 3. Changes in activity of the recorded inspiratory premotor neurons (n=111) before and after hypoxia. (A) The total number of spikes discriminated divided by the duration of the analyzed epoch (T = 80 s) before (x-axis) versus after (y-axis) hypoxia. In this and (B–D), the diagonal solid line is the line of identity. The majority of points, especially for the neurons that have the highest average frequency before hypoxia, are below the line of identity. The horizontal and vertical dashed lines plot the means before and after hypoxia, respectively [also for (B–D)]. The intersection of the dashed lines (11.0 ± 0.9 before versus 8.7 ±0.7 after hypoxia) is below the line of identity. (B) Firing frequency (Fx) of activity as the inverse of the mean ISI before versus after hypoxia. The intersection of the means is close to the line of identity (26.1 ± 2.3 before versus 24.3 ± 2.3 after hypoxia). (C) The frequency of coincident action potentials (Nxy, pairs of spikes occurring within 2 ms) decreased after hypoxia. The intersection of the dashed lines (1.2 ± 0.1 before versus 0.9 ± 0.1 after hypoxia) is below the line of identity. The color of the points is defined by where the points landed on the curve in Figure 5 with values of synchrony corrected by the bootstrap method: red represents an increase in bootstrap-corrected synchrony; blue, a decrease; and black has no synchrony (these points are at the origin in Figure 5). This color coding is the same for all panels. (D) Harmonic mean of the number of fired spikes in each pair (√NxNy), before and after hypoxia. The intersection of the dashed lines (10.0 ± 0.2 before versus 7.4 ± 0.2 after hypoxia) is below the line of identity. (E) The relationship between coincident spikes (Nxy) and spike occurrence (√NxNy) before hypoxia. The dashed line is the relationship showing that as spike frequency increases, there is a greater probability of coincident spikes. (F) The relationship between coincident spikes (Nxy) and spike occurrence (√NxNy) after hypoxia. As before hypoxia, there is a greater probability of coincident spikes with increasing firing frequency. Means shown with errors as SEM.
To exclude effects of firing rate on neuronal synchrony, we used a bootstrap technique as explained in Materials and Methods. Briefly, for each neuron we generated surrogate spike trains with the same number of spikes and the same ISI distribution as the real data and calculated the neuronal synchronization between each pair of surrogate spike trains. We repeated this process 300 times to obtain a distribution of synchrony values for the surrogate data sets. If the synchrony value of the real data was greater than the 99th percentile of that distribution, then synchrony was significant with a 99% confidence. Otherwise, the synchrony of the real data was not significant and mapped to zero. Figure 4A, shows the raw synchrony matrix, the 99th percentile of the synchrony distribution (described as synchrony confidence limit) and the bootstrap-corrected synchrony, before (top) and after (bottom) hypoxia for the experiment shown in Figure 2. Synchrony was significant among a subgroup of inspiratory pre-motor neurons but not among the rest, with the exception of two expiratory neurons that were weakly synchronized (E2–E3). In the bootstrap-corrected synchrony after hypoxia (Figure 4B), one pair of inspiratory neurons increased its synchrony (I3–I4) but two other pairs (I2–I3 and I2–I4) decreased their synchrony. The dendrograms derived from the bootstrap-corrected synchrony matrices reflected these changes and revealed a tight cluster of inspiratory neurons (I2, I3, and I4) that changed synchrony slightly after hypoxia (Figure 4C).
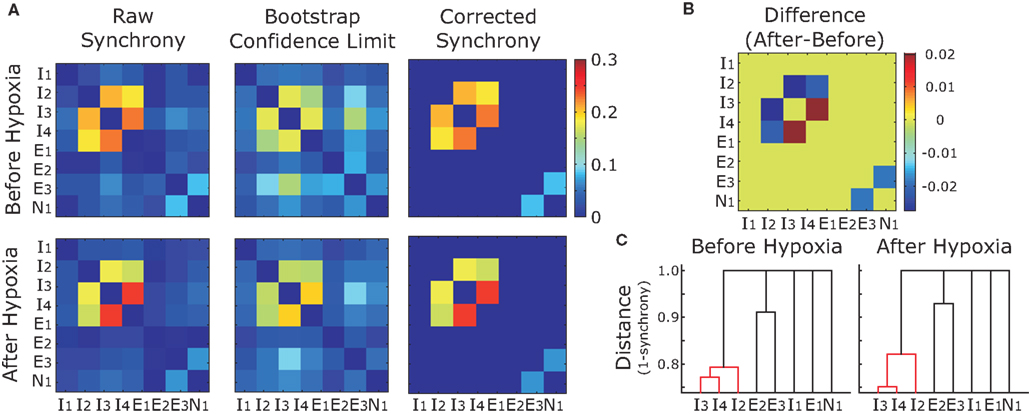
Figure 4. Color-coded synchrony matrices (A, B) and dendrogram (C) display the synchrony among pairs of recorded neurons for the experiment in Figures 1 and 2. (A) Left-hand Column, the raw synchrony (not corrected for firing rate); Middle Column, upper confidence limit of synchrony in shuffled data, the bootstrap correction for the dependence of synchrony on the firing rate; and Right-hand Column, corrected synchrony (raw synchrony-synchrony of the shuffles). Top Row, synchrony in recordings before hypoxia; Bottom Row, after hypoxia. After bootstrap correction, the majority of pairs appear not to be synchronized, however, three of six pairs of premotor I neurons are synchronized. (B) The effect of brief hypoxia on synchrony (after-before hypoxia). One pair (red, I3 and I4) increases whereas the other three pairs decrease synchrony. (C) A dendrogram shows the clustering of neurons before (left) and after (right) hypoxia. In summary, these different graphics complement each other and consistently reveal significant changes in synchrony before and after hypoxia.
We observed the same trend for the bootstrap-corrected synchrony across the whole set of inspiratory pre-motor neurons (Figure 5A): 162 pairs (29%) decreased their synchrony after hypoxia; 86 pairs (15%) increased; and 314 pairs (56%) were not significantly synchronized either before or after hypoxia. Those who were synchronized before and/or after hypoxia had a significant trend to decrease their synchrony (p < 0.05, Wilcoxon sign rank test), as revealed by the histogram of difference in synchrony, which is clearly skewed to the left (Figure 5B). Obviously, since most pairs were not synchronized either before or after synchrony, considering all pairs in the analysis would not yield significant changes of synchrony at the population level.
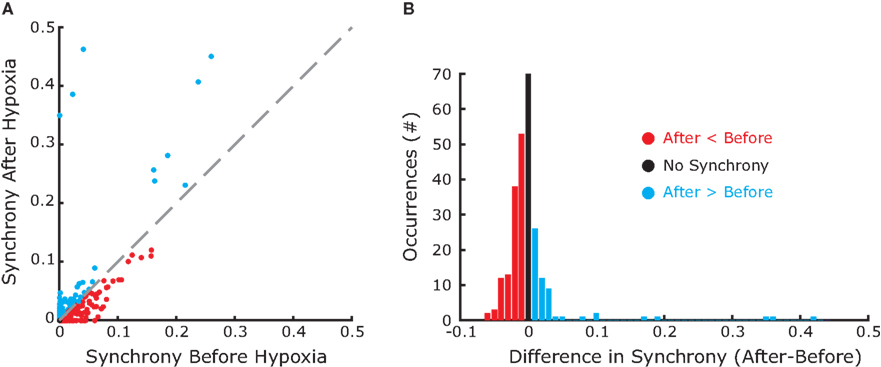
Figure 5. Group data showing increases and decreases in synchrony before and after hypoxia. (A) The magnitude of bootstrap-corrected synchrony before hypoxia (x-axis) plotted against that after hypoxia (y-axis) for all pairs of neurons recorded. The diagonal dashed gray line is the line of identity. Blue dots above this line indicate pairs where synchrony increased after hypoxia; the red dots below indicate that synchrony decreased. Black dots, located at the origin, represent pairs that were not significantly synchronized either before or after hypoxia. (B) Histogram representing the synchrony difference (after–before). Blue, red, and black match with (A) Clearly, more pairs decreased than increased synchrony.
Summarizing the experimental results, we observed significant synchrony across approximately half of the pairs of inspiratory pre-motor neurons before hypoxia. After transient hypoxic stimulation, synchrony decreased across approximately two-thirds and increased across one-third of those pairs. These synchrony changes were independent of the decrease in the number of spikes after hypoxia.
We propose that these effects can be accounted for by enhanced inhibitory input, as sketched in Figure 6. The inspiratory pre-motor neurons receive excitatory divergent input from inspiratory-augmenting neurons in the preBötC, which in turn receive mostly inhibitory divergent input from preBötC pre-inspiratory neurons. A recruitment of more inhibitory pre-I neurons following hypoxia could account for the overall increase of inhibition in the hierarchical network. At the same time, the divergent projections between layers create temporal correlations across postsynaptic cells receiving overlapping inputs, which translates to significant spike synchronization. In Figure 6, neurons with similar colors are temporally correlated: the more similar the colors, the higher the synchrony. Note that after hypoxia, the elimination of a presynaptic input increases synchrony among some premotor pairs (red and blue or green and blue) but decreases synchrony among others (orange and green). To test our hypothesis, we implemented a computational model of the network dynamics with these ingredients (see details in Materials and Methods) and analyzed the simulated network dynamics in the same fashion as the experimental data.
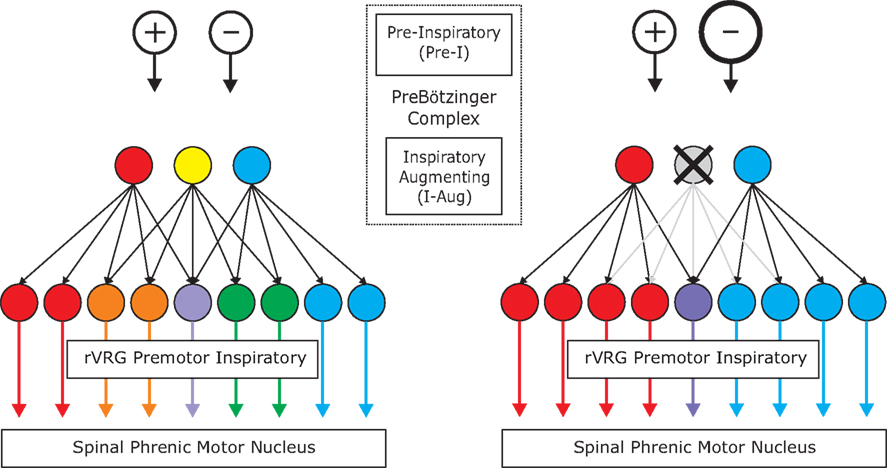
Figure 6. Simplified diagram of the simulated network before (left) and after (right) hypoxia. The top layers [two Open Circles and three Filled Circles (Red, Yellow, and Blue)] contain two types of neurons in the preBötC; the excitatory and inhibitory Pre-I neurons as well as the excitatory I-Aug neurons. After hypoxia, there is a recruitment of inhibitory pre-I neurons in the preBötC which turns off some of the I-Aug activity in the preBötC [Yellow filled circle becomes inactive (gray with X)]. The third layer (nine Filled Circles) contains I-Aug neurons of the rVRG. The vast majority of these are bulbo-spinal premotor neurons and transmit central respiratory drive to spinal motor neurons. The blending of colors represents the degree of overlapping input and hence, the more similar the colors, the higher the synchrony. The elimination of a presynaptic input increases synchrony among some premotor pairs (red and blue or green and blue) but decreases synchrony among others (orange and green).
Computational Simulations
Figure 7 displays the raster plots of neuronal activity for the whole network during an inspiratory burst. The analysis of the traces for the pre-motor inspiratory population is presented in Figures 8 and 9. Figure 8A reveals a significant decrease in the number of fired spikes after hypoxia. However, the firing rate of the neurons (Figure 8B), calculated as the inverse of the mean ISI did not change significantly. This means that once the neurons started firing, they fired with the same frequency as before but they fired with interruptions (gaps) after hypoxia, as displayed in Figure 7. The number of coincident spikes over the simulated time interval also decreased after hypoxia (Figure 8D). As in the experiments, the number of coincident spikes versus the harmonic mean of the number of spikes in the pair fit a quadratic function whose slope at any point was slightly lower after hypoxia, which indicates an overall trend across the population to decrease synchrony after hypoxia. A bootstrap analysis of the simulated data was applied to disentangle the amount of synchrony and synchrony changes that can be explained by chance from the contribution due to the network architecture and its modification following hypoxia. The bootstrap-corrected synchrony is shown in Figure 9. As in the experimental data, neuronal synchronization can increase or decrease after hypoxia, but the decrease (58% of 4950 pairs) was much more pronounced across all pairs than the increase (38%). Also 4% of pairs did not show significant synchrony before or after hypoxia. As a result, the histogram of the synchrony change was significantly skewed to the left (p < 0.05, Wilcoxon sign rank test).
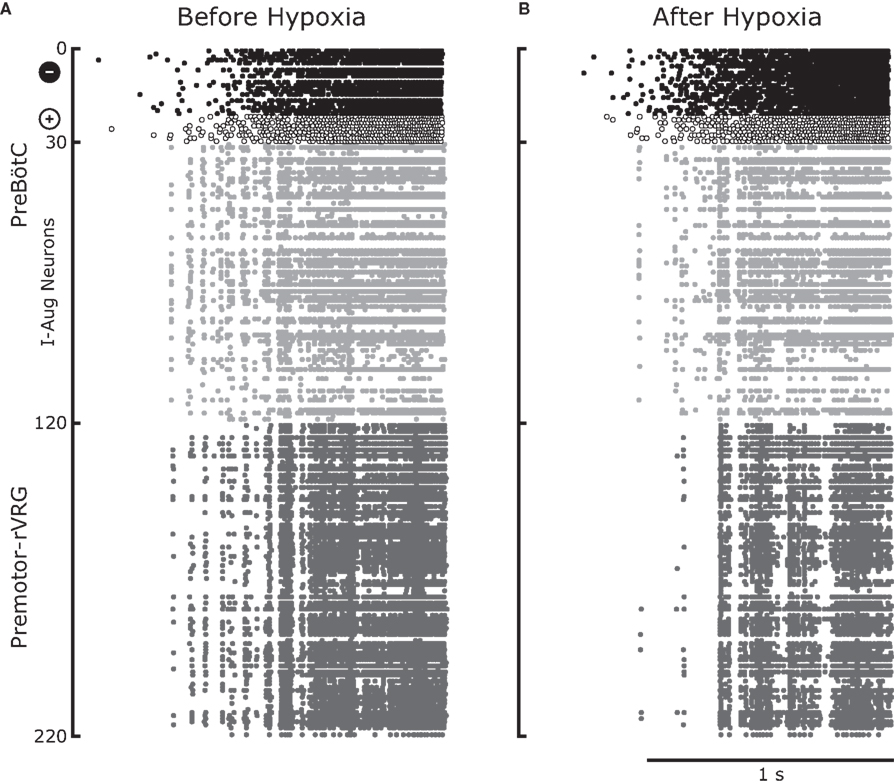
Figure 7. Illustrative example of output from the computational model for an entire inspiratory burst. Before hypoxia (A) and after hypoxia (B) there was a recruitment of inhibitory pre-inspiratory preBötC neurons which resulted in enhanced inhibition of preBötC inspiratory-augmenting neurons, some of which were turned off. This led to a reduction of common inputs to the rVRG premotor neurons which in turn reduced the firing and altered spike synchronization among these neurons. The sudden termination of the burst is consistent with the experimental data of inspiratory neurons shown in Figures 2C,D.
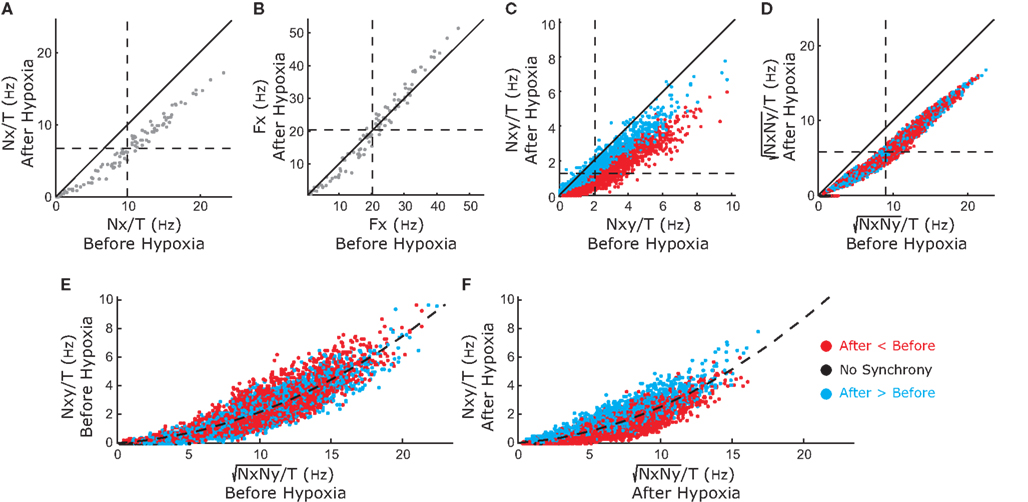
Figure 8. Changes in activity produced by the model simulating inspiratory premotor neurons before and after hypoxia. These graphs show the relation of simulated activity before and after hypoxia as in Figure 3 for the recorded data. In (A–F), the synthetic data replicates the relationships in the original data. The color coding of the points is consistent across panels.
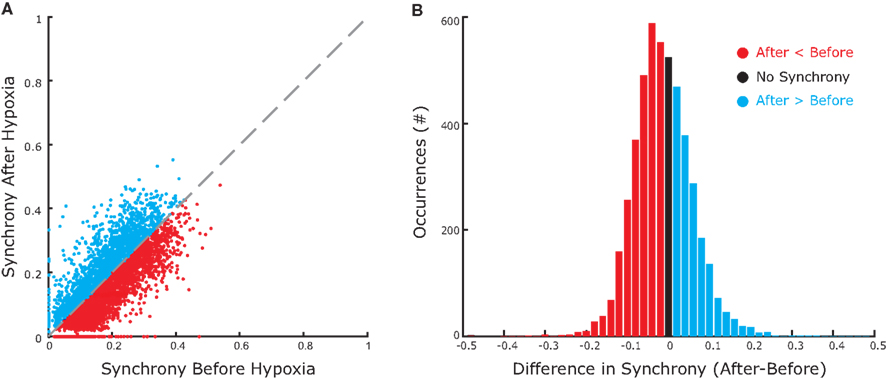
Figure 9. In silico data showing increases and decreases in synchrony before and after hypoxia. (A,B) As in the recorded data, the magnitude of bootstrap-corrected synchrony decreased after hypoxia (number of red dots > blue dots).
Discussion
In our analysis of ensemble recordings of inspiratory premotor neurons in the rVRG, we applied state-of-the-art statistical tools and obtained several novel results. First, subpopulations of pre-motor neurons had synchronized spike activity indicating a common drive from upstream inspiratory neurons. Second, this synchrony was malleable. Physiological stimuli modulated synchrony: it decreased in most pairs but increased in others, suggesting alterations of the functional network connectivity. The synchrony changes are independent of changes in the firing rate. Third, whereas the intraburst firing frequency of the premotor inspiratory neurons was similar before and after hypoxia, the total number of spikes fired decreased significantly. Thus, the firing threshold of the pre-motor neurons may have been unaffected poststimulus; rather the neurons received less net excitation after hypoxia. Fourth, a simple computational model of inspiratory neurons in the ventral respiratory column reproduced efficiently the experimental observations. The model consisted of a feed-forward network with three layers: the pre-inspiratory cells, the inspiratory-augmenting neurons, and the pre-motor neurons. To qualitatively reproduce the experimental results, a key element of the model was that not all the inspiratory-augmenting neurons were equivalent: some projected onto many pre-motor neurons (hubs), while most projected onto just a few.
We should emphasize, however, that there is currently no direct evidence for the network architecture hypothesized in our studies. Consequently, besides common fluctuating inputs there may be other connectivity patterns contributing to the short timescale synchronization observed in our experiments. Moreover, there is no direct evidence for a selective increase in feed-forward inhibition as opposed to depression of excitatory inputs from the pre-inspiratory population after hypoxia. The assumptions used in our computational model should rather be considered as a proof of principle for plausible features of the respiratory column to be investigated in future.
How robust is our model? We have quantified how excitation and inhibition from the pre-inspiratory population affect the results of the computational model (data not shown). The firing rate, synchrony values and their changes after hypoxia were comparable with the experimental results when excitation was between 25% and 45%, keeping other neuron (threshold, etc.) and network parameters (synaptic strengths, connection probabilities, etc.) unchanged. This effective range may well vary as those parameters change. As a result, the validity of our model should not be limited when the actual ratio of excitation and inhibition is experimentally determined.
Our analysis of multielectrode recordings has similarities and differences with respect to a previously published method, gravity analysis (Lindsey et al., 1997; Lindsey and Gerstein, 2006) which has been used to detect moments of synchrony in ensemble recordings. In gravity analysis, each neuron is represented as a particle in an N-dimensional space, N being the total number of neurons recorded. At the beginning of the recording, neurons are equidistant to each other. As time progresses, when two neurons fire within a time window δ, they attract each other, analogously to the gravitational force between two bodies, and move towards each other. In addition, there is an ongoing friction force quantified by a parameter γ that acts on every particle (neuron). The dissipative forces slow down the particles by opposing the attractive forces, which facilitates the agglomeration of particles representing neurons that tend to fire synchronously. At the end of the recording, clusters in the N-dimensional space identify assemblies of synchronized neurons. If δ and γ are properly chosen, our clustering analysis based on our synchrony measure (Figure 4) yields similar results as the gravity analysis (data not shown). However, our analysis is computationally more efficient. In addition, our analysis does not require the parameter γ which has to be chosen heuristically in gravity analysis with an appropriate choice being crucial for the algorithm to work.
What is the physiological relevance of malleable synchronization in the respiratory column? Neuronal synchronization can transmit and process information at a low metabolic cost (Buzsaki, 2006). Action potentials are metabolically expensive, therefore, the implementation of firing rate codes for every purpose of brain function can be inefficient. In contrast, for a fixed and relatively low firing rate, neurons can synchronize their action potentials leading to a constructive summation of postsynaptic currents in downstream neurons or muscle fibers. The following two assumptions are implicit in this argument: (1) projections from neurons that are capable of synchronizing their spikes converge onto the same downstream target; (2) the postsynaptic currents are integrated sufficiently fast (within a few milliseconds), so that downstream targets can sum independent coincident spikes. Interestingly, both requirements are met across several areas of the brain including the olfactory bulb (Lagier et al., 2004; Galán et al., 2006b) hippocampus (Buzsaki, 2002; Vida et al., 2006), cerebellum (de Solages et al., 2008; Middleton et al., 2008) and neocortex (Hasenstaub et al., 2005). Thus synchrony across pre-motor and motor neurons in the respiratory control network may be an efficient way of regulating diaphragm contraction. Our data and simulations showing significant spike synchrony among inspiratory pre-motor neurons strongly support this idea. However, to validate this hypothesis further, the changes in neuronal synchronization across pre-motor neurons should co-vary with the shape and pattern of the phrenic nerve signal, i.e., the motor output of the network.
In our analysis, we have focused on the dynamics of inspiratory pre-motor neurons. There are two reasons why we focused specifically on these neurons and not on expiratory neurons. The first reason is a convenient anatomical feature: inspiratory pre-motor neurons are localized in a relatively well segregated area that facilitates the simultaneous recording from many of them. The second and most important reason, is that they are part of the effector output of the network that ultimately control the motoneuron activity and hence, the phrenic output and diaphragm. Whereas we have shown that spike synchronization within inspiratory pre-motor populations is significant and malleable, we surmise that the neuronal dynamics of expiratory populations along the ventral respiratory column are crucial to explain the natural variability of the respiratory rhythm. This will be investigated in future work with the techniques and analyses reported here.
Conflict of Interest Statement
The authors declare that the research was conducted in the absence of any commercial or financial relationships that could be constructed as a potential conflict of interest.
Acknowledgments
We are grateful to the reviewers for their valuable feedback. We thank Abigail Zaylor and Greg van Lunteren for their excellent technical assistance. This work has been supported by The Mount Sinai Health Care Foundation (RFG), The Alfred P. Sloan Foundation (RFG), the National Institutes of Health (HL-090554, TED) and the American Heart Association (SDG 0735037N, DMB).
References
Baekey, D. M., Dick, T. E., and Galán, R. F. (2009). Spike synchronization is population specific in the respiratory pattern generator. BMC Neurosci. 10, P248. doi: 10.1186/1471-2202-10-S1-P248.
Baekey, D. M., Morris, K. F., Gestreau, C., Li, Z., Lindsey, B. G., and Shannon, R. (2001). Medullary respiratory neurones and control of laryngeal motoneurones during fictive eupnoea and cough in the cat. J. Physiol. (Lond.) 534, 565–581.
Bou-Flores, C., and Berger, A. J. (2001). Gap junctions and inhibitory synapses modulate inspiratory motoneuron synchronization. J. Neurophysiol. 85, 1543–1551.
Butera, R. J. Jr, Rinzel, J., and Smith, J. C. (1999a). Models of respiratory rhythm generation in the pre-Botzinger complex. II. Populations Of coupled pacemaker neurons. J. Neurophysiol. 82, 398–415.
Butera, R. J. Jr, Rinzel, J., and Smith, J. C. (1999b). Models of respiratory rhythm generation in the pre-Botzinger complex. I. Bursting pacemaker neurons. J. Neurophysiol. 82, 382–397.
Coles, S. K., and Dick, T. E. (1996). Neurones in the ventrolateral pons are required for post-hypoxic frequency decline in rats. J. Physiol. (Lond.) 497(Pt 1), 79–94.
de Solages, C., Szapiro, G., Brunel, N., Hakim, V., Isope, P., Buisseret, P., Rousseau, C., Barbour, B., and Lena, C. (2008). High-frequency organization and synchrony of activity in the Purkinje cell layer of the cerebellum. Neuron 58, 775–788.
Del Negro, C. A., Johnson, S. M., Butera, R. J., and Smith, J. C. (2001). Models of respiratory rhythm generation in the pre-Botzinger complex. III. Experimental tests of model predictions. J. Neurophysiol. 86, 59–74.
Del Negro, C. A., Morgado-Valle, C., and Feldman, J. L. (2002). Respiratory rhythm: an emergent network property? Neuron 34, 821–830.
Dick, T. E., Dutschmann, M., and Paton, J. F. (2001). Post-hypoxic frequency decline characterized in the rat working heart brainstem preparation. Adv. Exp. Med. Biol. 499, 247–254.
Dick, T. E., Hsieh, Y. H., Morrison, S., Coles, S. K., and Prabhakar, N. (2004). Entrainment pattern between sympathetic and phrenic nerve activities in the Sprague-Dawley rat: hypoxia-evoked sympathetic activity during expiration. Am. J. Physiol. Regul. Integr. Comp. Physiol. 286, R1121–R1128.
Ermentrout, G. B., Galan, R. F., and Urban, N. N. (2008). Reliability, synchrony and noise. Trends Neurosci. 31, 428–434.
Feldman, J. L., McCrimmon, D. R., and Speck, D. F. (1984). Effect of synchronous activation of medullary inspiratory bulbo-spinal neurones on phrenic nerve discharge in cat. J. Physiol. (Lond.) 347, 241–254.
Galán, R. F., Ermentrout, G. B., and Urban, N. N. (2006a). Predicting synchronized neural assemblies from experimentally estimated phase-resetting curves. Neurocomputing 69, 1112–1115.
Galán, R. F., Fourcaud-Trocmé, N., Ermentrout, G. B., and Urban, N. N. (2006b). Correlation-induced synchronization of oscillations in olfactory bulb neurons. J. Neurosci. 26, 3646–3655.
Galán, R. F., Ermentrout, G. B., and Urban, N. N. (2007a). Stochastic dynamics of uncoupled neural oscillators: Fokker-Planck studies with the finite element method. Phys. Rev. E Stat. Nonlin. Soft Matter Phys. 76, 056110.
Galán, R. F., Ermentrout, G. B., and Urban, N. N. (2007b). Reliability and stochastic synchronization in type I vs. type II neural oscillators. Neurocomputing 70, 2102–2106.
Galán, R. F., Ermentrout, G. B., and Urban, N. N. (2008). Optimal time scale for spike-time reliability: theory, simulations, and experiments. J. Neurophysiol. 99, 277–283.
Hasenstaub, A., Shu, Y., Haider, B., Kraushaar, U., Duque, A., and McCormick, D. A. (2005). Inhibitory postsynaptic potentials carry synchronized frequency information in active cortical networks. Neuron 47, 423–435.
Hunter, J. D., Milton, J. G., Thomas, P. J., and Cowan, J. D. (1998). Resonance effect for neural spike time reliability. J. Neurophysiol. 80, 1427–1438.
Izhikevich, E. M. (2004). Which model to use for cortical spiking neurons? IEEE Trans. Neural Netw. 15, 1063–1070.
Lagier, S., Carleton, A., and Lledo, P. M. (2004). Interplay between local GABAergic interneurons and relay neurons generates gamma oscillations in the rat olfactory bulb. J. Neurosci. 24, 4382–4392.
Lindsey, B. G., and Gerstein, G. L. (2006). Two enhancements of the gravity algorithm for multiple spike train analysis. J. Neurosci. Methods 150, 116–127.
Lindsey, B. G., Morris, K. F., Shannon, R., and Gerstein, G. L. (1997). Repeated patterns of distributed synchrony in neuronal assemblies. J. Neurophysiol. 78, 1714–1719.
Middleton, S. J., Racca, C., Cunningham, M. O., Traub, R. D., Monyer, H., Knopfel, T., Schofield, I. S., Jenkins, A., and Whittington, M. A. (2008). High-frequency network oscillations in cerebellar cortex. Neuron 58, 763–774.
Morgado-Valle, C., Baca, S. M., and Feldman, J. L. (2010). Glycinergic pacemaker neurons in preBotzinger complex of neonatal mouse. J. Neurosci. 30, 3634–3639.
Paton, J. F. (1996). A working heart-brainstem preparation of the mouse. J. Neurosci. Methods 65, 63–68.
Powell, F. L., Milsom, W. K., and Mitchell, G. S. (1998). Time domains of the hypoxic ventilatory response. Respir. Physiol. 112, 123–134.
Rekling, J. C., Shao, X. M., and Feldman, J. L. (2000). Electrical coupling and excitatory synaptic transmission between rhythmogenic respiratory neurons in the preBotzinger complex. J. Neurosci. 20, RC113.
Rybak, I. A., O’Connor, R., Ross, A., Shevtsova, N. A., Nuding, S. C., Segers, L. S., Shannon, R., Dick, T. E., Dunin-Barkowski, W. L., Orem, J. M., Solomon, I. C., Morris, K. F., and Lindsey, B. G. (2008). Reconfiguration of the pontomedullary respiratory network: a computational modeling study with coordinated in vivo experiments. J. Neurophysiol. 100, 1770–1799.
Rybak, I. A., Shevtsova, N. A., Paton, J. F., Dick, T. E., St-John, W. M., Morschel, M., and Dutschmann, M. (2004). Modeling the ponto-medullary respiratory network. Respir. Physiol. Neurobiol. 143, 307–319.
Schreiber, S., Fellous, J. M., Tiesinga, P., and Sejnowski, T. J. (2004). Influence of ionic conductances on spike timing reliability of cortical neurons for suprathreshold rhythmic inputs. J. Neurophysiol. 91, 194–205.
Schwarzacher, S. W., Smith, J. C., and Richter, D. W. (1995). Pre-Botzinger complex in the cat. J. Neurophysiol. 73, 1452–1461.
Solomon, I. C., Halat, T. J., El-Maghrabi, R., and O’Neal, M. H. 3rd (2001). Differential expression of connexin26 and connexin32 in the pre-Botzinger complex of neonatal and adult rat. J. Comp. Neurol. 440, 12–19.
Tonkovic-Capin, V., Stucke, A. G., Stuth, E. A., Tonkovic-Capin, M., Hopp, F. A., McCrimmon, D. R., and Zuperku, E. J. (2003). Differential processing of excitation by GABAergic gain modulation in canine caudal ventral respiratory group neurons. J. Neurophysiol. 89, 862–870.
Vida, I., Bartos, M., and Jonas, P. (2006). Shunting inhibition improves robustness of gamma oscillations in hippocampal interneuron networks by homogenizing firing rates. Neuron 49, 107–117.
Keywords: neural control of respiration, working heart brainstem preparation, hypoxia, spike synchronization, bootstrap analysis, neural network simulation
Citation: Galán RF, Dick TE and Baekey DM (2010) Analysis and modeling of ensemble recordings from respiratory pre-motor neurons indicate changes in functional network architecture after acute hypoxia. Front. Comput. Neurosci. 4:131. doi: 10.3389/fncom.2010.00131
Received: 22 November 2009;
Paper pending published: 21 December 2009;
Accepted: 17 August 2010;
Published online: 15 September 2010.
Edited by:
Jakob H. Macke, University College London, UKReviewed by:
Jeffrey C. Smith, National Institute of Neurological Disorders and Stroke, USARobert J. Butera, Georgia Institute of Technology, USA
Copyright: © 2010 Galán, Dick and Baekey. This is an open-access article subject to an exclusive license agreement between the authors and the Frontiers Research Foundation, which permits unrestricted use, distribution, and reproduction in any medium, provided the original authors and source are credited.
*Correspondence: Roberto Fernández Galán, Department of Neurosciences, School of Medicine, Case Western Reserve University, 10900 Euclid Avenue, Cleveland, OH 44106-4975, USA. e-mail: rfgalan@case.edu