Limits to the development of feed-forward structures in large recurrent neuronal networks
- 1 Functional Neural Circuits Group, Faculty of Biology, Albert-Ludwig University of Freiburg, Germany
- 2 Bernstein Center Freiburg, Albert-Ludwig University of Freiburg, Germany
- 3 RIKEN Brain Science Institute, Wako, Japan
- 4 Institute of Neuroscience and Medicine (INM-6), Computational and Systems Neuroscience, Research Center Jülich, Germany
- 5RIKEN Computational Science Research Program, Wako, Japan
Spike-timing dependent plasticity (STDP) has traditionally been of great interest to theoreticians, as it seems to provide an answer to the question of how the brain can develop functional structure in response to repeated stimuli. However, despite this high level of interest, convincing demonstrations of this capacity in large, initially random networks have not been forthcoming. Such demonstrations as there are typically rely on constraining the problem artificially. Techniques include employing additional pruning mechanisms or STDP rules that enhance symmetry breaking, simulating networks with low connectivity that magnify competition between synapses, or combinations of the above. In this paper, we first review modeling choices that carry particularly high risks of producing non-generalizable results in the context of STDP in recurrent networks. We then develop a theory for the development of feed-forward structure in random networks and conclude that an unstable fixed point in the dynamics prevents the stable propagation of structure in recurrent networks with weight-dependent STDP. We demonstrate that the key predictions of the theory hold in large-scale simulations. The theory provides insight into the reasons why such development does not take place in unconstrained systems and enables us to identify biologically motivated candidate adaptations to the balanced random network model that might enable it.
1 Introduction
For several decades now it has been commonly assumed that functional structures in the brain develop by strengthening synapses between neurons that fire in a correlated fashion (Hebb, 1949). In particular, feed-forward structures in which neural activity is propagated as a wave from one pool to the next (Abeles, 1991) would seem to be favored by a synaptic plasticity dynamics which strengthens causally correlated connections and weakens acausally correlated connections. This key property of spike-timing dependent plasticity (STDP) was postulated theoretically (Gerstner et al., 1993) before it was observed experimentally on the timescale of 10 ms (Markram and Sakmann, 1995; Markram et al., 1997; Bi and Poo, 1998), although strengthening of causal correlations on the timescale of 100 ms had already been found (Gustafsson et al., 1987).
Such feed-forward structures, also known as synfire chains or braids, have been postulated to underlie experimentally observed precise spike-timing, for example in mammalian cortex (Eckhorn et al., 1988; Gray and Singer, 1989; Abeles et al., 1993; Prut et al., 1998; Ikegaya et al., 2004; Pulvermüller and Shtyrov, 2009) or songbird HVC (Hahnloser et al., 2002; Kozhevnikov and Fee, 2007). The propagation of waves of activity along synfire chains has been shown to be stable under quite general conditions (Diesmann et al., 1999; Gewaltig et al., 2001). Apart from being a natural candidate for the representation of serial activities, such as the sequential activation of muscles to generate a movement, Bienenstock (1995) conjectured that all cortical computation is carried out by the action and interaction of such structures. It has since been shown that co-ordinated activity between synfire chains can realize the phenomenon of compositionality (Hayon et al., 2004).
Given the great degree of interest in feed-forward structures, the experimentally confirmed existence of a plasticity rule that is apparently predestined to generate them, and the growing availability of both tools suitable for large-scale neuronal network simulations (e.g., Morrison et al., 2005; Migliore et al., 2006; Gewaltig and Diesmann, 2007; Pecevski et al., 2009) and the high-performance computers on which to run them, it seems curious that there have been no truly convincing studies demonstrating their development.
It is in the nature of numerical studies that they use simplified models and therefore run the risk of generating artifacts, i.e., behavior that does not occur if a simplified model is replaced with a more realistic one. When investigating STDP in recurrent networks, there are at least two commonly chosen model simplifications that run a high risk of yielding such non-generalizable behavior. So far, all reports of structure development in a recurrent network have been based on network models which represent only a small fraction of the number of synaptic inputs a neuron typically receives (Hertz and Prügel-Bennet, 1996; Levy et al., 2001; Izhikevich et al., 2004; Iglesias et al., 2005; Doursat and Bienenstock, 2006; Jun and Jin, 2007; Masuda and Kori, 2007; Hosaka et al., 2008; Liu and Buonomano, 2009; Fiete et al., 2010). This is a serious issue, as STDP is driven by correlation between pre- and post-synaptic neurons. Scaling down the network size and increasing the strength of individual synapses increases the correlation between pre- and post-synaptic neurons. This leads to a strong competition effect between the inputs which can result in a very small number of inputs driving the post-synaptic neuron in a non-biological winner-takes-all manner. This is particularly so if, as for the majority of previous studies, an additive model for STDP is assumed, which has a strong symmetry breaking tendency leading to a bimodal distribution of synaptic strengths (Song et al., 2000). However, even very early experimental findings on STDP revealed that the strength of potentiation and depression is dependent on the initial strength of the synapse (Bi and Poo, 1998, but see also Debanne et al., 1996, 1999; Montgomery et al., 2001; Wang et al., 2005). Theoretical studies have revealed that even quite a small dependence on the weight leads to a qualitatively different behavior and a unimodal distribution of synaptic strengths (van Rossum et al., 2000; Rubin et al., 2001; Gütig et al., 2003; see also Morrison et al., 2008) which is more similar to the distributions observed experimentally (Turrigiano et al., 1998; Sjöström et al., 2001; Song et al., 2005). Moreover, weight-dependent “soft-bounded” rules can be more plausibly generated with a kinetic modeling approach than an additive “hard-bounded” rule (Zou and Destexhe, 2007). It is therefore not clear, and should not be assumed, that behavior observed in networks with low numbers of synapses per neuron and/or additive STDP are representative for networks with biologically realistic numbers of synapses and weight-dependent STDP. Indeed, a network exhibiting cortical connectivity levels and using a model for STDP with weight dependence fitted to experimental findings did not develop structure either spontaneously or as a result of repeated synchronous stimuli to a subset of neurons (Morrison et al., 2007).
One reason for this may have been that a critical additional mechanism is required. Many of the above mentioned studies include homeostatic regulating mechanisms such as normalization of weights on the axon and dendrite (Doursat and Bienenstock, 2006; Fiete et al., 2010), pre-synaptic activity dependent weight dynamics to maintain a given post-synaptic rate (Liu and Buonomano, 2009) or axonal pruning of weak synapses once a certain number of very strong synapses have been created (Jun and Jin, 2007). Additionally, STDP has been supplemented with plasticity dynamics on other time scales: Izhikevich et al. (2004) employ both short-term plasticity and slow long-term potentiation, whereas Jun and Jin (2007) implement slow long-term depression and a reversible activation and silencing of synapses. Clearly, some of these mechanisms are more biologically plausible than others and it may well turn out that one or more of them is necessary for the development of structure in networks with realistic connectivity.
In this article, we develop a theory for the recruitment into a structure of neurons in a recurrent network in response to repeated external synchronous input. We show that recruitment is characterized by an unstable fixed point that cannot be stabilized by simply introducing pre- or post-synaptic homeostatic mechanisms such as those proposed in previous studies (Doursat and Bienenstock, 2006; Fiete et al., 2010). We demonstrate that the key predictions of the theory can be reproduced by a large-scale neuronal network model. Finally, we consider what biologically plausible adaptations to the network model could allow the stable propagation of feed-forward structure.
2 Materials and Methods
2.1 Network Model
Our network model is based on the balanced random network model of Brunel (2000), see Figure 1A. The neurons are 80% excitatory and 20% inhibitory and randomly connected; excitatory–excitatory connections are subject to weight-dependent STDP, all other connections are static. The network activity is presumed to be in the asynchronous irregular regime with an average firing rate of νr.
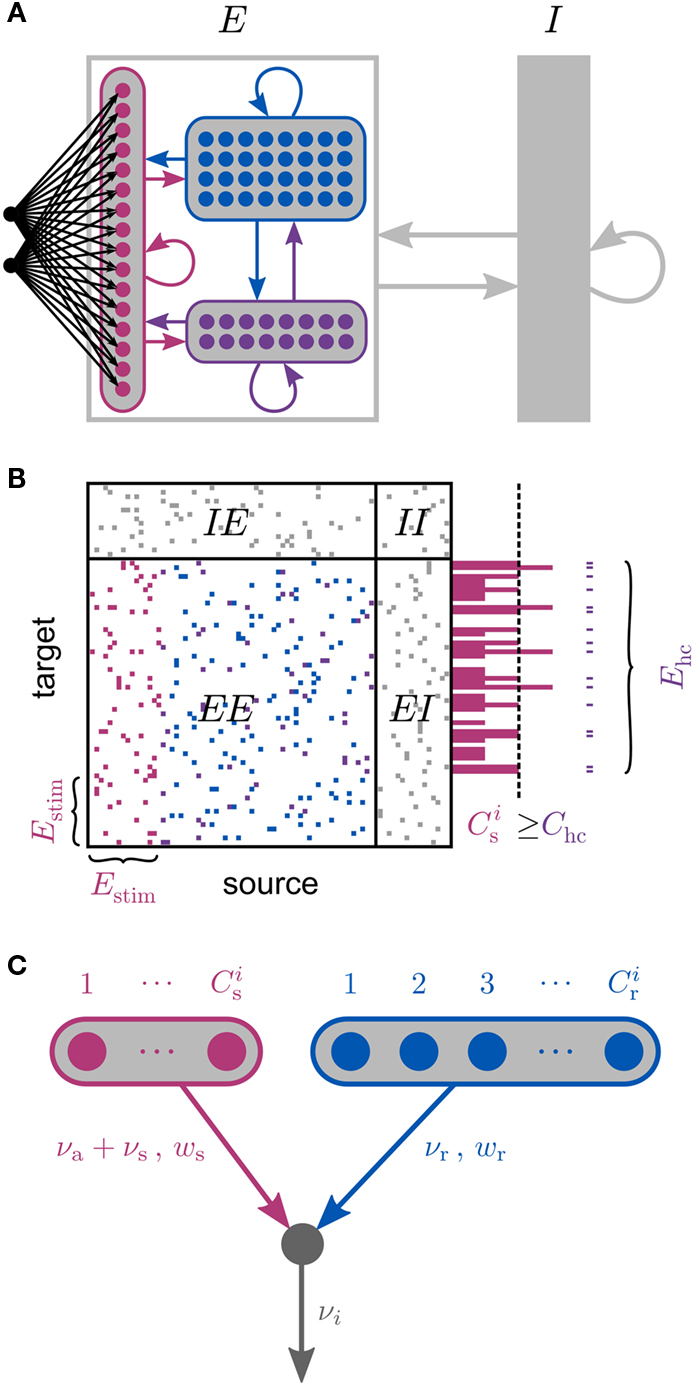
Figure 1. Network and single neuron model. (A) Balanced recurrent network model based on Brunel (2000). A subset of the excitatory population (Estim, pink disks) receives feed-forward input from each member of an external group of size NSIP (black disks). The external group fires synchronously with rate νs and asynchronously with rate νa. The externally stimulated population Estim makes recurrent connections to the rest of the excitatory population. Nhc neurons receive a number of connections from Estim above a given threshold Chc (high-connectivity group, purple disks) whereas all other neurons receive fewer connections from Estim (blue disks). All neurons also receive external excitatory Poisson input (not shown). (B) Determination of the high-connectivity group from the connectivity matrix (shown here in diluted form). The subdivisions of the connectivity matrix indicate the source and target populations, e.g., EI contains the connections from the inhibitory population I to the excitatory population E. The entries in row i of the connectivity matrix indicate the sources of the synaptic inputs of neuron i according to the color scheme in (A). The histogram gives the number of connections  each neuron receives from Estim. If neuron i receives a number of connections from Estim greater than or equal to the arbitrary threshold Chc (vertical dashed line) it is considered a member of the high-connectivity group Ehc. (C) Simplified input structure of a neuron in a recurrent network: the post-synaptic neuron i (gray disk) receives input from
  neurons from Estim (pink disks) that fire asynchronously with rate νa and synchronously with rate νs and from
  neurons selected from the rest of the network (blue disks) that fire asynchronously with rate νr. The mean synaptic weights from these populations are ws and wr, respectively.
A subset Estim of the excitatory population receives feed-forward input from each element of an external group of size NSIP; these connections are also subject to STDP. Each neuron in the external group spikes independently as a Poisson process of rate νa and synchronously with the rest of the group as a Poisson process of rate νs, thus implementing a single interaction process (SIP, see Kuhn et al., 2003). The total rate of a neuron in the external group is the same as the network firing rate, i.e., νa + νs = νr. All neurons in the network receive additional excitatory independent Poisson spike trains; the neurons in the externally stimulated group receive Poisson spike trains at a slightly reduced rate to compensate for their additional external stimulus.
Due to the random connectivity, the number of connections neurons receive from Estim is binomially distributed. For a given connectivity threshold Chc, a high-connectivity group Ehc can be located within the excitatory population (not including Estim). Each neuron in Ehc receives at least Chc connections from Estim, whereas all other excitatory neurons receive fewer than Chc connections from Estim. This is illustrated in Figure 1B. In general, NSIP, Nstim, and Chc can all be chosen independently. For a given binomial distribution of connections from Estim, the choice of Nstim and Chc completely determines Nhc, the number of neurons in the high-connectivity group Ehc. As we are investigating the development of feed-forward structures in this article, we are interested in the case that successive groups have similar sizes. We therefore link the independent variables such that Chc = NSIP and require Nhc ≈ Nstim. In other words, for a given value of NSIP, we select the size of the externally stimulated population Nstim such that the binomial distribution of connections results in Nhc ≈ Nstim neurons that receive at least NSIP connections from Estim and all other excitatory neurons in the network receive fewer than NSIP connections from Estim.
2.2 Fixed Point Analysis of Structural Development
If pre- and post-synaptic spike trains are stochastic, the weight updates of a synapse can be described as a random walk. Using Fokker–Planck mean field theory, the drift of the random walk corresponds to the average rate of change of synaptic strength. The drift can be calculated as a function of the correlation of the pre- and post-synaptic spike trains. Assuming stationarity, the raw cross-correlation function of the pre-synaptic spike train  and the post-synaptic spike train
  with mean firing rates of νi/j = 〈ρi/j〉 is given by:
Γji (Δt) = 〈ρj (t)ρi (t + Δt)〉t
This results in the following expression for the mean synaptic drift:
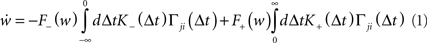
where F± (w) describe the weight-dependent potentiation/depression of a synapse due to a single spike pair and K± (Δt) = exp (−|Δt|/τ±) is the window function of STDP. A more thorough derivation of (1) can be found in Kempter et al. (1999) and Kistler and van Hemmen (2000; but see also Kempter et al., 2001; Rubin et al., 2001; Gütig et al., 2003; Morrison et al., 2008; Gilson et al., 2009a).
To investigate the fixed point behavior of STDP in the context of a large recurrent network in which structure development is being induced by synchronous stimulation of a subset of neurons, we make the following assumptions, abstracted from the network model displayed in Figure 1A. Each neuron i receives  excitatory connections from neurons selected from the subset of neurons Estim receiving synchronous stimulation and
  connections from neurons selected from the rest of the network. Synchronous spikes from the stimulated subset occur irregularly and are governed by a Poisson process with a rate of νs. Each neuron in the stimulated subset also fires independently as a Poisson process with rate νa; the composite activity for a neuron from the stimulated subset is therefore a Poisson process with rate νa + νs. The activity of a neuron in the rest of the network can be described as a Poisson process with rate νr. The input structure of an excitatory neuron in the recurrent network is illustrated in Figure 1C. We further assume that the post-synaptic spike rate is generated by an inhomogeneous Poisson process
 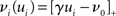 with scaling factor γ, threshold ν0 and membrane potential ui, where [·]+ denotes a piecewise linear function that is defined as 0 for negative values, i.e., [x]+ = (x + |x|)/2. In the following, we will assume the function is positive and omit the square brackets. The membrane potential is given by
 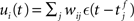 where wij is the weight of the synapse between neuron j and neuron i, and ∊(t) describes the time course of the response of the membrane potential to the arrival of an excitatory event, i.e., wij∊(t) is the post-synaptic potential. Finally, we assume that the dynamics of the system is sufficiently well captured by considering the changes to the mean values of the synapses between the two input populations and the output neuron,
 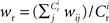 and
and 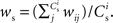 The expected rate of the output neuron is therefore:

where 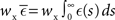 is the total area under the respective post-synaptic potential. The conditional firing rate after a spike at
  from a neuron in the unstimulated input population is:

Similarly, the conditional firing rate after a spike at  from a neuron in the population receiving synchronous stimulus is:
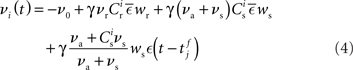
Inserting these pre- and post-synaptic spike trains into the expression for the synaptic drift given in (1) results in a coupled system of differential equations for the evolution of the mean weights:
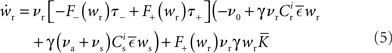
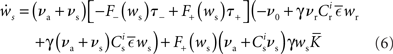
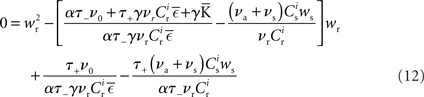
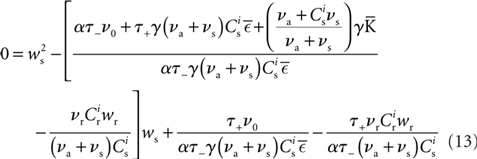
where  The nullclines for wr and ws can be found by setting the left hand side of these equations to zero and solving for wr and ws respectively. The crossing points of the nullclines (if any) represent the fixed points of the system and can be found numerically.
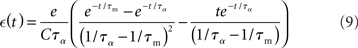
To do this, appropriate values must be determined for the model parameters. For the numerical simulations in this study (see Section 2.3) we use a current-based integrate-and-fire neuron model with α-shaped post-synaptic currents, i.e., the dynamics of the membrane potential is given by:
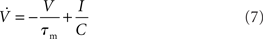
where τm is the time constant of the membrane potential, C is the membrane capacitance and I is the input current. The time course of a post-synaptic current with peak amplitude w is given by:
We can therefore calculate the time course of the post-synaptic potential as:
and determine the model parameters.
and
in terms of the parameters of the integrate-and-fire neuron model and the STDP update rule.
2.3 Numerical Simulations
We perform numerical simulations of the network model described in Section 2.1. Our realization of the abstract model consists of 80,000 leaky integrate-and-fire neurons with α-shaped post-synaptic currents. The neurons are 80% excitatory and 20% inhibitory, each receiving 3840 excitatory and 960 inhibitory recurrent connections. Excitatory–excitatory connections are drawn from an initial normal distribution and are subject to weight-dependent power-law STDP (Morrison et al., 2007; Standage et al., 2007).
Each neuron except the externally stimulated group Estim receives an additional independent Poisson spike train equivalent to 1200 excitatory inputs each spiking at νx. When no external synchronous stimulation is provided (Nstim = 0), a choice for the rate of the independent Poisson input to each neuron of νx = 14 Hz results in network activity in the asynchronous irregular regime (Brunel, 2000) with an average firing rate of νr and a unimodal distribution of the plastic recurrent weights with mean 38.6 pA and SD 3 pA (data not shown). In the absence of homeostasis, νr = 9.6 Hz; in the presence of weight normalizing pre-synaptic homeostasis applied every 3 s, νr = 9.5 Hz; in the presence of pre- and post-synaptic homeostasis applied alternately every 1.5 s, νr = 9.2 Hz.
When external synchronous stimulation is provided (Nstim > 0), each neuron in Estim receives additional external stimulus at a total rate of νr from each of the NSIP neurons in the external group ESIP. Consequently, the total rate of the independent Poisson spike trains received by neurons in Estim is reduced to 1200·νx − NSIP νr to compensate for the additional external stimulus. We draw the initial weights of the recurrent plastic synapses in the stimulated network from a normal distribution with the same mean and SD as the equilibrium weight distribution of the unstimulated network. The initial weights of the connections from the external group ESIP to the stimulated group Estim are set to the mean of the equilibrium weight distribution of the unstimulated network.
During an initial equilibration period of 100 s the external group ESIP generates independent Poisson spike trains at rate νa = νr with no synchronous events, i.e., νs = 0 Hz. After this period, the external group ESIP provides partially synchronous stimulus to the stimulated group Estim with a synchronous rate of νs = 3 Hz and an asynchronous rate of νa = νr − νs.
We perform simulations with different values for the size NSIP of the external group. The threshold Chc for membership of the high-connectivity group Ehc is set equal to NSIP. For each value of NSIP, we examine the connectivity of the network to determine empirically the value of Nstim that results in a high-connectivity group of approximately equal size, i.e., Nhc ≈ Nstim.
Following the standards suggested by Nordlie et al. (2009), the network model details are provided in tabular form in Table 1. Table 2 contains the values for the parameters used in the network simulations.
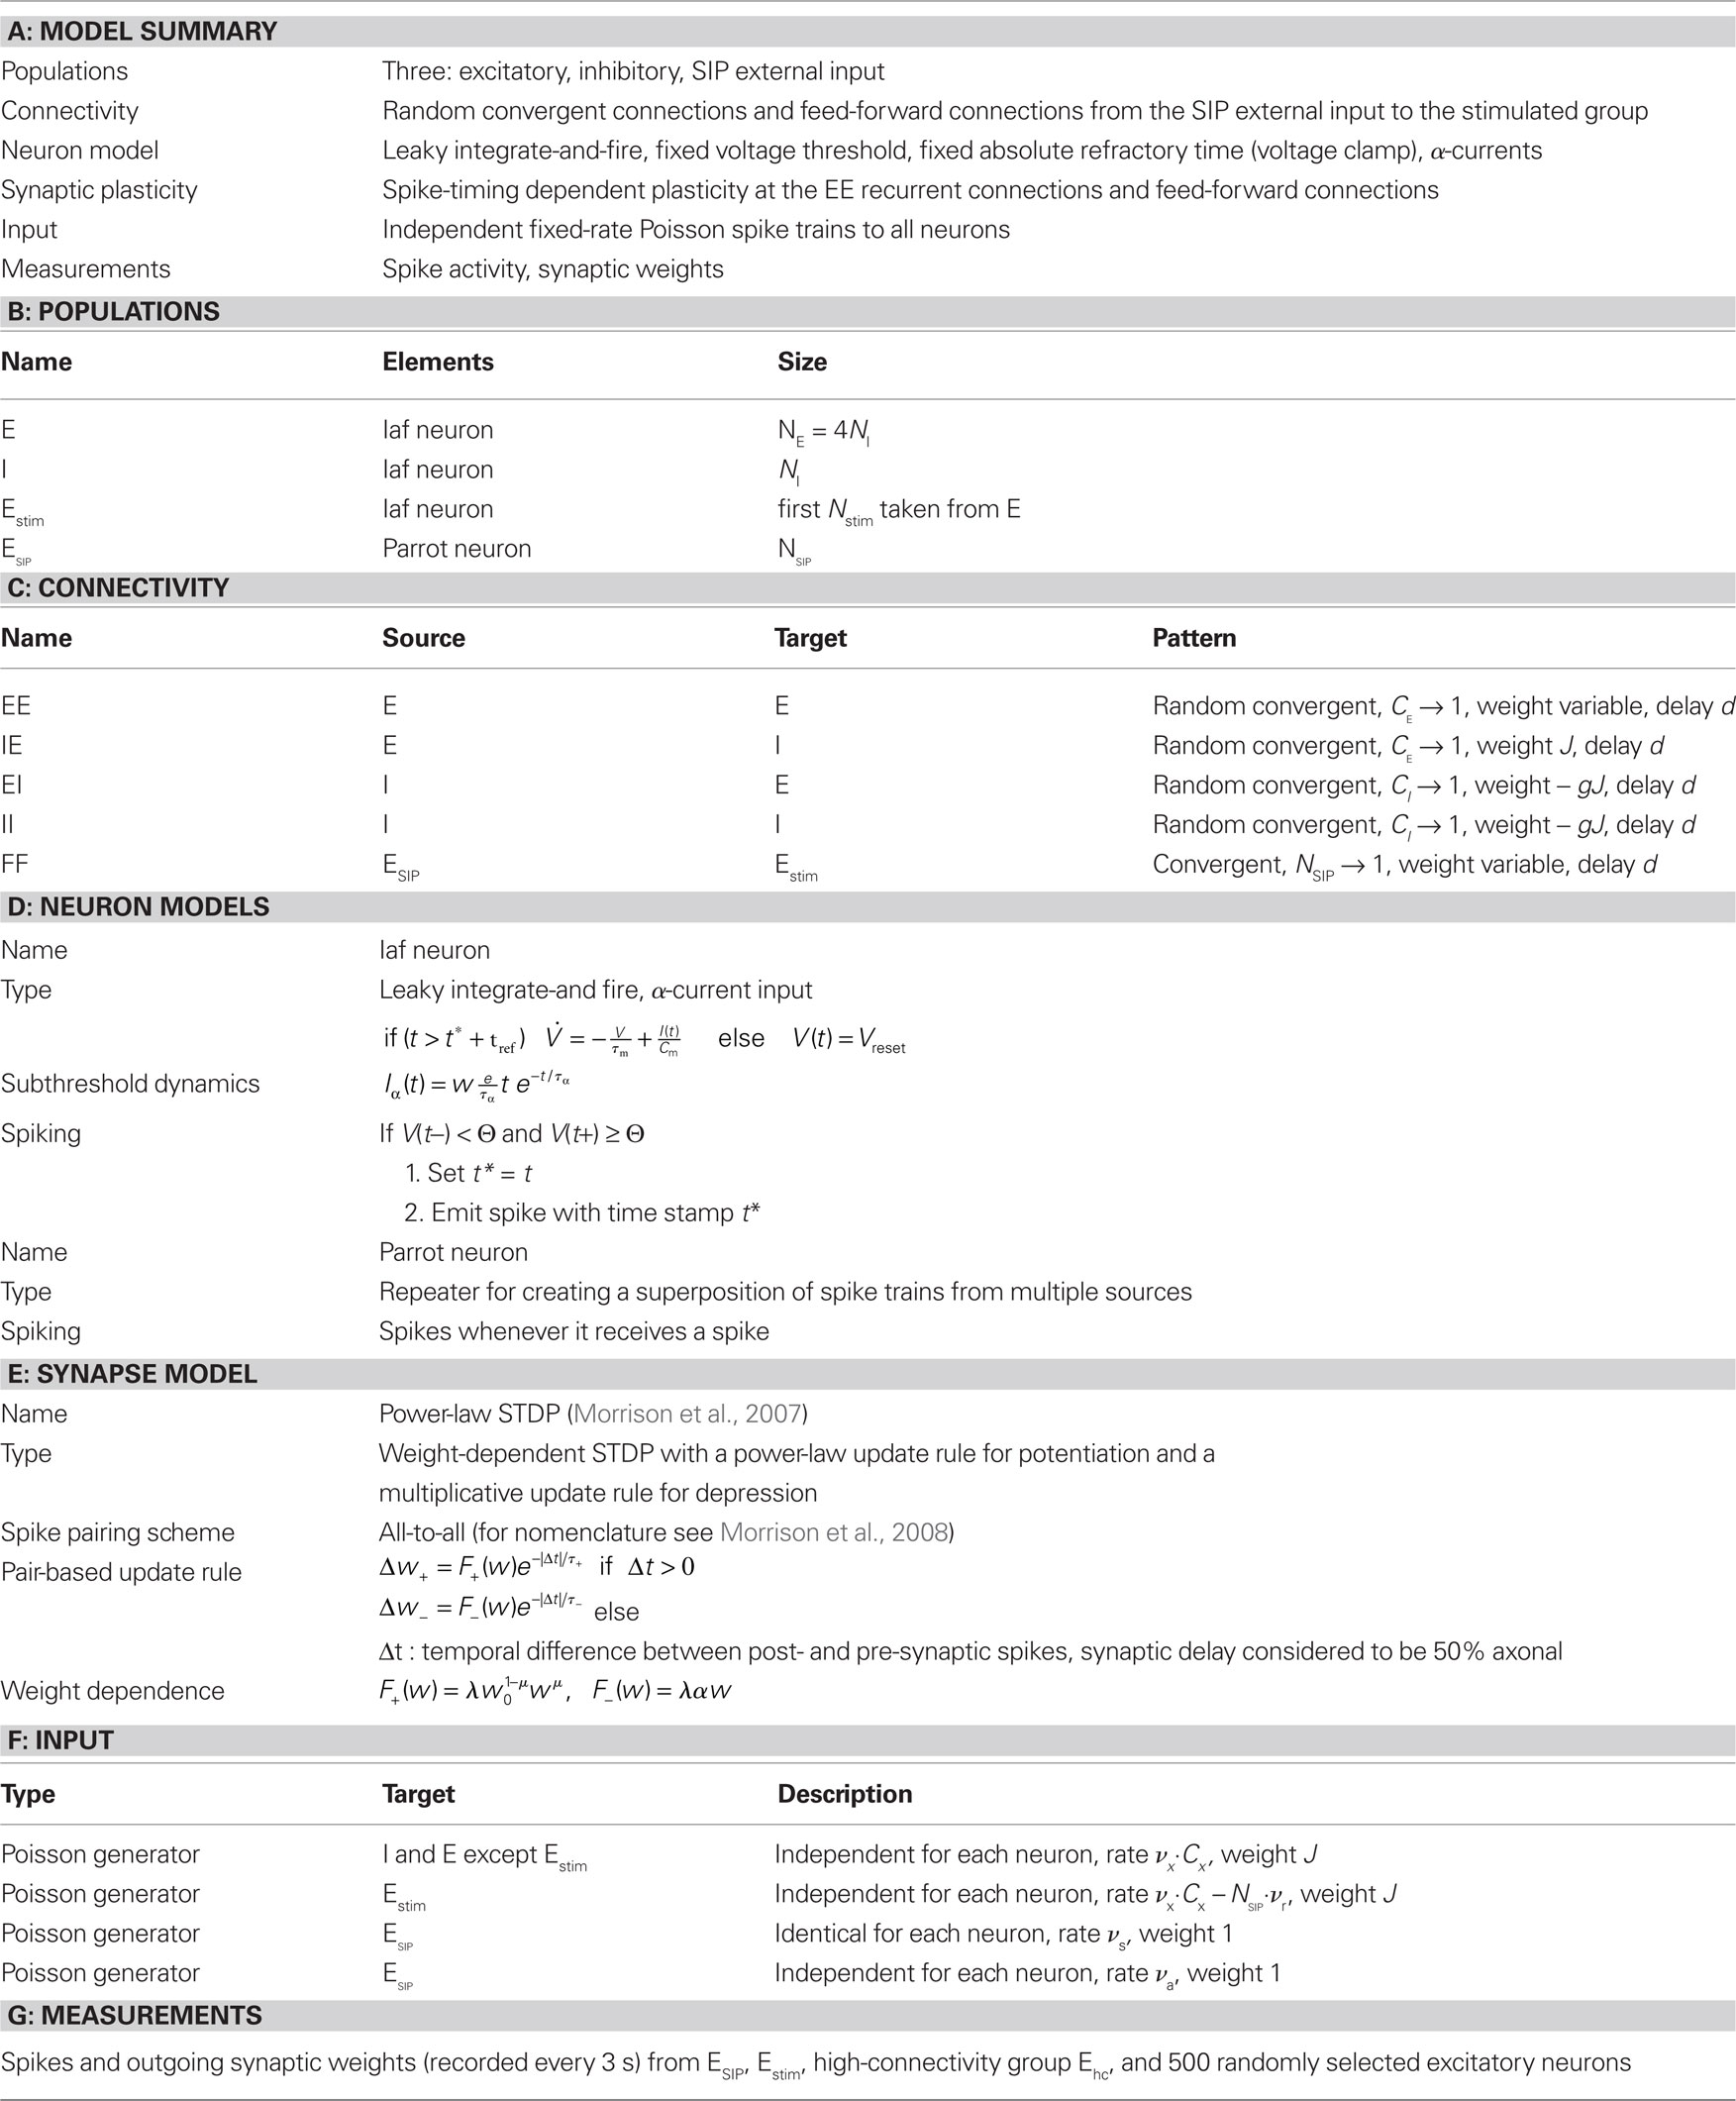
Table 1. Tabular description of network model after Nordlie et al. (2009).
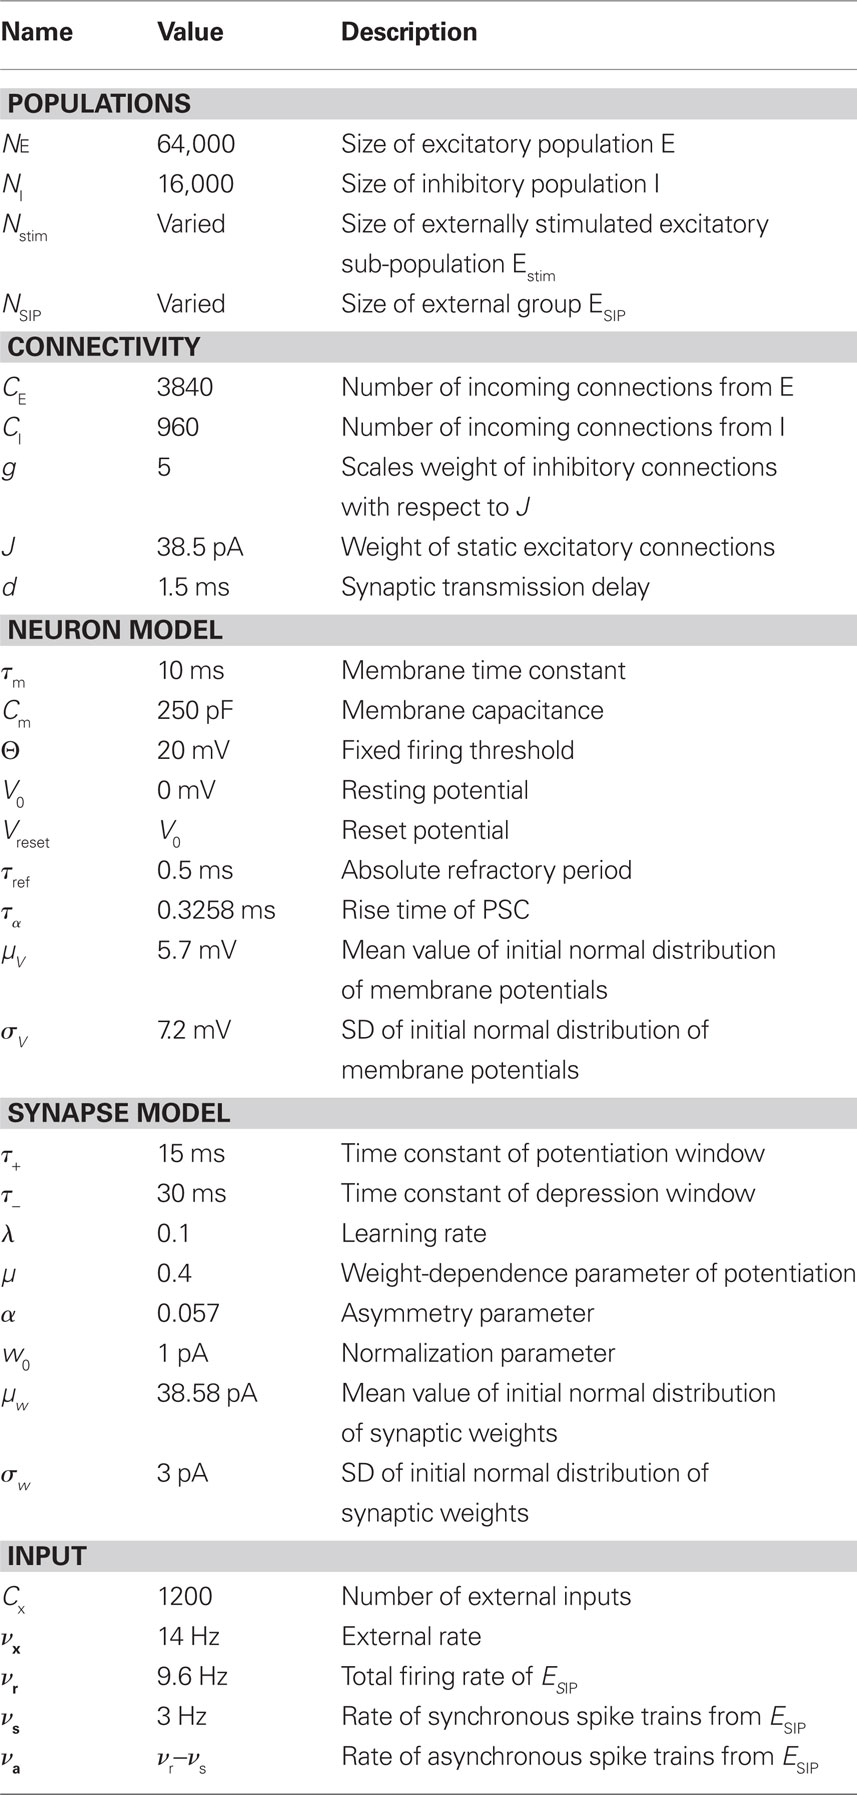
Table 2. Simulation parameters.
The network simulations were carried out with a computation time step of 0.1 ms on the Stallo Linux cluster (Notur, UiT) and the JUGENE BlueGene/P supercomputer using the simulation software NEST (Gewaltig and Diesmann, 2007) at revision 8611. Simulation scripts are available from the authors on request.
2.4 Data Analysis
Spike times are recorded from the stimulated group, the high-connectivity group, and from 500 neurons randomly chosen from the excitatory population (random group). The times of the synchronous spikes of the external group are also recorded. Weights of all outgoing connections were recorded in intervals of 3 s from the external group, the stimulated group, the high-connectivity group and the random group.
The development of the mean weights shown in Figure 5 is determined from the outgoing weights of the external group and the weights of the connections from the stimulated group to the high-connectivity group. The weight distributions in Figures 6D,H are histograms (bin size 1 pA) of the weights of the connections between the specific neuronal groups recorded at 25 min.
To create the histograms in Figures 6A,C,E,G we record the number of spikes in each group in each 1 ms time bin within the 10 ms directly after a synchronous event over a period of 10 s and normalize by the number of neurons and the number of synchronous input events. Figures 6B,F and 7A–D show the development of the peri-stimulus spiking activity of the specific neuronal groups, which is the number of spikes within the 10 ms before (control) and within the 10 ms after each synchronous input event. Data is normalized with respect to the number of neurons in a group and the number of synchronous input events within successive periods of 10 s.
The scatter plots in Figure 7E are generated by recording the time-to-first-spike following each synchronous event in a 1 min period for all excitatory neurons in the network. Each marker in the plot shows the mean and SD ofthe response times for a specific neuron; the color of the markers indicates the likelihood of the neuron to respond to a synchronous stimulus within 10 ms.
3 Results
3.1 Fixed Point Analysis of Weight Dynamics
To investigate the dynamics of STDP in a recurrent network undergoing synchronous stimulation, we select the update rule proposed by van Rossum et al. (2000), which is additive for potentiation (F+(w) = λ) and multiplicative for depression (F−(w) = αλw). This rule is a good fit to the experimental data on the dependence of the magnitude of synaptic strength change on the initial synaptic strength (Bi and Poo, 1998). Furthermore, this choice has the advantage that the rule exhibits the same qualitative behavior as other weight-dependent rules (see Morrison et al., 2008), yet is more tractable than many other weight-dependent rules such as the partially multiplicative model proposed by Gütig et al. (2003) or the power-law formulation (Morrison et al., 2007; Standage et al., 2007).
Inserting F±(w) into the equation system for the synaptic drifts given in (5) and (6) and setting the left hand sides to zero results in the following quadratic expressions for the nullclines of wr and ws:
The nullclines can be determined analytically; the crossing of the nullclines can be found numerically. To this end we assume input to the neuron analogous to that received by a neuron in the recurrent network simulation described in Section 2.3. The rate of the asynchronous background population is νr = 9.6 Hz, and the asynchronous and synchronous rates of the SIP input are νa = 6.6 Hz and νs = 3 Hz. The total number of incoming recurrent excitatory synapses is  We set STDP parameters α = 0.0132 pA−1, λ = 0.03 pA, τ+ = 15 ms and τ− = 30 ms and neuronal parameters γ = 3.66 × 10³(Vs)−1 and ν0 = 176.1 Hz. In the absence of synchronous stimulation
  this choice of synaptic and neuronal parameters results in a self-consistent output rate νi = νr and a stable fixed point
  thus reproducing the corresponding values of the unstimulated network simulation. The parameters
  and
and  are calculated from the neuronal and STDP parameters as described in Section 2.2. The nullclines for
  are illustrated in Figure 2A. Note that as
  the nullcline for ws is much more sensitive to the value of wr than vice versa. The value of
  is negative for values of ws above the ws-nullcline and positive for values of ws below it. Similarly,
  is positive for values of wr to the left of the wr-nullcline and negative for values to the right of it. Consequently, the fixed point indicated by the intersection of the nullclines is a stable attractor. Figure 2B shows the location of the fixed point as a function of the number of synchronous inputs
  . Again, ws is the more sensitive variable.
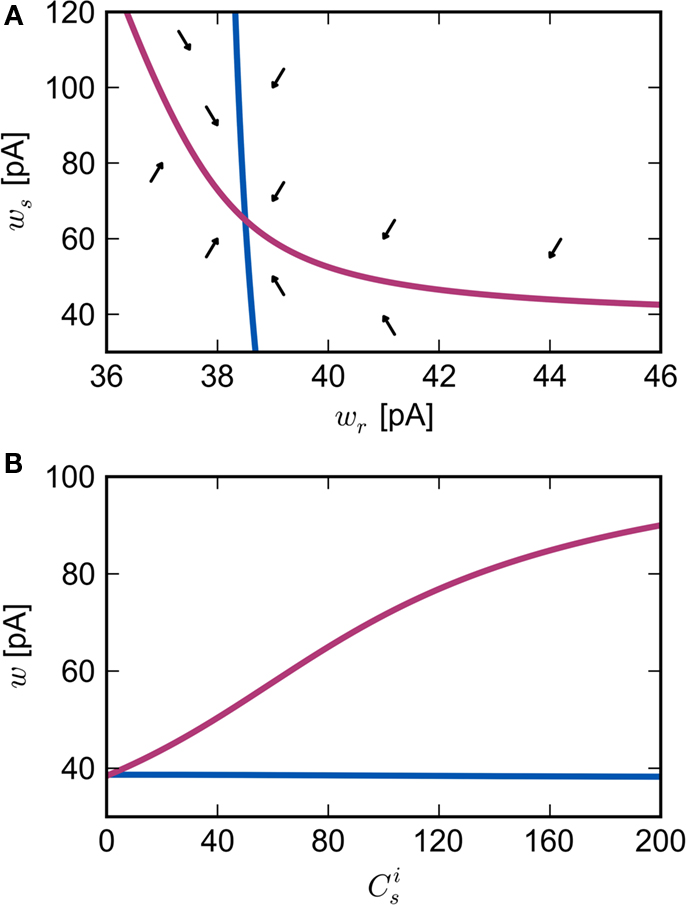
Figure 2. Fixed point of the synaptic drift equations. (A) Nullcline for ws as a function of wr (red curve) and for wr as a function of ws (blue curve) for  . The crossing point of the nullclines determines the fixed point
  of the coupled equations. Arrows show the sign of the derivatives of wr and ws; arrows pointing up (down) indicate
  arrows pointing right (left) indicate
  for the values of wr and ws at the base of the arrows. (B) Location of fixed point (
 ; blue,
  ; red) as a function of the number of synchronous inputs
  .
.
We can now exploit our knowledge of the network connectivity to determine the distribution of  and thus the distribution of fixed points. Each neuron receives CE connections drawn randomly from the NE excitatory neurons in the network, so the number of connections drawn from the Estim population receiving synchronous stimulus is distributed binomially; the number of trials is CE and the probability of success in an individual trial is p =Nstim/NE, where Nstim is the number of neurons in Estim. Multiplying the probability of drawing Cs connections PP (Cs, CE) with the number of excitatory neurons NE gives the expected number of neurons in the network that have Cs connections from Estim. Let us now consider an idealized network model in which the number of neurons with Cs connections from Estim is indeed ⌊NE · Pp (Cs, CE)⌋ and assign each neuron a connectivity rank Ri, where Rj < Rk entails
  Figure 3A shows the equilibrium average strength of the synapses from the stimulated neurons
  as a function of the size of the stimulated group Nstim and the connectivity rank of the post-synaptic neuron in the idealized network. Only the neurons with the highest connectivity are displayed (Ri ≤ 1000), as these are the neurons that will most easily be recruited into a structure. However, Figure 3A suggests that this is unlikely to occur, as
  increases slowly with decreasing R, i.e., neurons which receive similar numbers of connections from the stimulated group will tend to develop similar synaptic strengths. Consequently, there will be no development of clearly defined groups that respond in a qualitatively different fashion to a synchronous event in the stimulated group. The increase of
  with increasing Nstim is more rapid; small variations in the size of a synchronously firing group can have a large effect on the outgoing weight distribution.
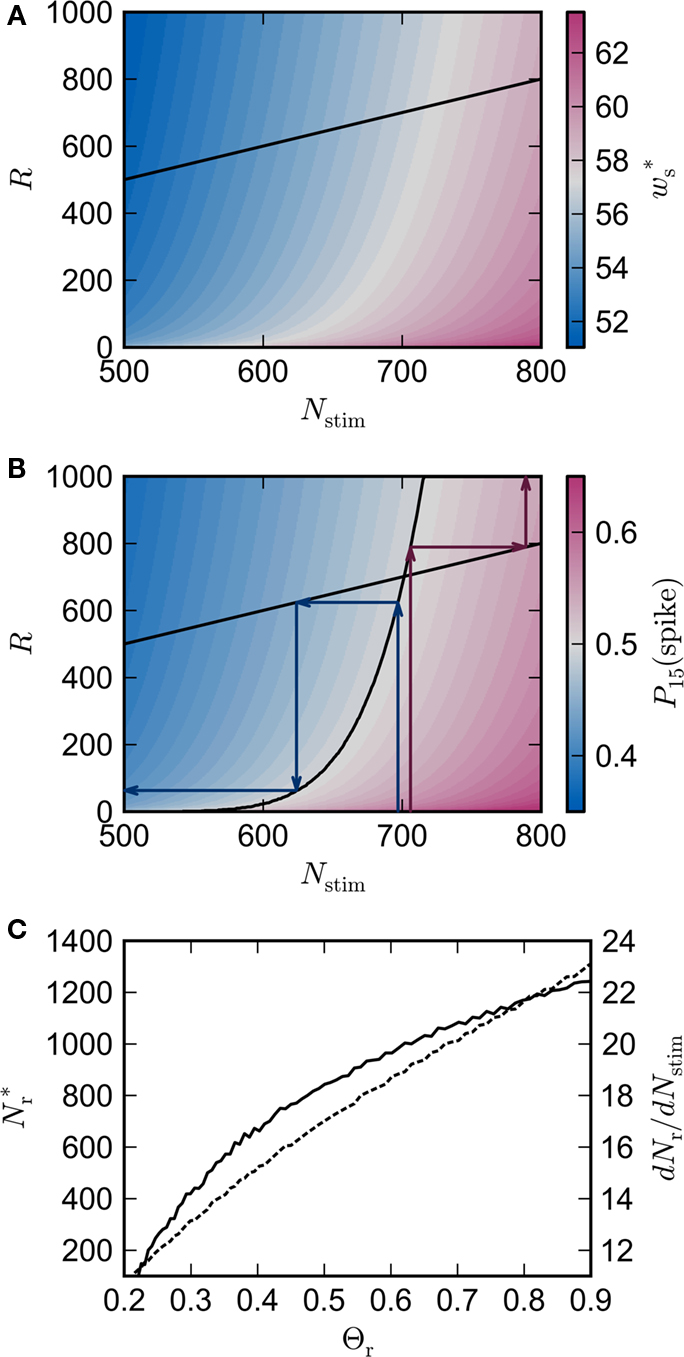
Figure 3. Distribution of fixed points and likelihood of responding to synchronous stimulus. (A) Average strength of synapse from the stimulated group  as a function of the size of the stimulated group (horizontal axis) and the connectivity rank of the post-synaptic neuron (vertical axis). The black line indicates the group of highest connectivity equal in size to the stimulated group (R = Nstim). (B) Expected number of spikes emitted by the post-synaptic neuron in the 15 ms following a synchronous spike in the stimulated group; axes and black line as in (A); the black curve indicates the number of neurons which respond to a synchronous event with a spike with probability greater than or equal to the recruitment threshold Θr = 0.5. The black line and curve represent a return map for the development of feed-forward structure in a network with an unstable fixed point at Nstim = 701. The blue arrows show two iterations of the return map for an initial stimulated population of size Nstim = 697; the pink arrows show one iteration for Nstim = 706. (C) Location and nature of the fixed point as functions of the recruitment threshold Θr. Dashed curve: fixed point
  , solid curve: slope of the tangent to the Nr (Nstim) curve at
  .
.
This insight can be further clarified by calculating the number of spikes a post-synaptic neuron is expected to produce within a given time t after a synchronous event in the stimulated input group. This can be found by integrating the conditional firing rate:
Figure 3B shows the number of spikes expected within 15 ms after a synchronous event for every fixed point calculated in Figure 3A. To determine the development of functional structure, we introduce a recruitment threshold Θr. All neurons that have a probability of responding to a synchronous event in Estim of at least Θr are considered to have been recruited into the structure, neurons for which P15 (spike) < Θr are considered to be outside the structure. The black curve indicates the number of neurons recruited Nr as a function of the size of the stimulated group Nstim for an arbitrary choice of recruitment threshold Θr = 0.5, i.e., for a choice of Nstim, the height of the black curve gives the number of neurons that are recruited by this stimulus such that each neuron has at least a 50% probability of firing immediately after a synchronous event in Estim.
The black diagonal line indicates a connectivity rank equal to the size of the stimulated group, i.e., the Nstim neurons in the network that receive the most input from the synchronously stimulated group. The two lines represent an approximation of a return map for groups of synchronously firing neurons: the curve indicates Nr (Nstim) and the diagonal indicates Nstim, therefore their intersection reveals the fixed point at which the number of neurons recruited is equal to the number of neurons stimulated,  If the fixed point were stable, the
  recruited neurons would recruit another group of
  neurons, which would in turn recruit another such group, thus stably propagating structure through the network. However, the fixed point is unstable, since the slope of the Nr (Nstim) curve is positive at the intersection. If Nstim is initially below the crossing point, the number of neurons recruited is smaller than Nstim. These neurons will in turn recruit even fewer neurons, and so the structure will decay to nothing within a few iterations. Conversely, if the number of stimulated neurons is larger than the crossing point, the number of neurons recruited will be greater than Nstim. These neurons will in turn recruit an even greater number of neurons, until the entire network is recruited within a few iterations. This is illustrated by the map iterations shown as arrows in Figure 3B. Note that the iterations are approximative, as the composition of pre- and post-synaptic rates is in general not constant over iterations.
Figure 3C shows the dependence of the fixed point on the choice of the recruitment threshold Θr. As the requirement on the reliability of spiking following a synchronous event increases, the fixed point shifts to greater values of Nstim. The slope of the tangent of the Nr (Nstim) curve is positive across the whole range of Θr, demonstrating that the fixed point is always unstable.
The main factors influencing the shape of Figure 3 are the random wiring of the network and the smooth change of the fixed point of the weight distribution  with increasing number of synchronous connections (Figure 2B). The number of connections a neuron receives from a given group is binomially distributed. This causes a “fan-out” structure – if we can find a group of neurons which receives at least k inputs from a synchronously active group, we can also find an even larger group which receives slightly fewer than k connections. Due to the smooth change of the fixed point of the weight distribution with k, the equilibrium weight distribution and thus the equilibrium response to a synchronous event of a neuron receiving k − 1 or k − 2 synchronous connections is very similar to the equilibrium distribution and response of a neuron receiving k connections.
It is therefore worthwhile to determine to what extent the smooth shift of the weight distribution shown in Figure 2B is robust to parameter changes. Figure 4A shows the development of fixed points as a function of the number of synchronous connections for four different scenarios. In the top left panel we consider the case of lower input rates: νr = 5 Hz, νa = 3.5 Hz and νs = 1.5 Hz, corresponding to a lower recurrent network rate and a lower synchronous stimulus rate. We set ν0 = 190 Hz and γ 7.02 × 10³ (Vs)−1, which corresponds to a reduced external Poisson rate and results in a self-consistent rate νi = νr when there is no synchronous stimulus  . The top right panel reproduces the standard input scenario (νr = 9.6 Hz, ν0 = 175 Hz) except the rate of synchronous events is a greater proportion of the total rate of the synchronous population: νa = 2.6 Hz and νs = 7 Hz. The bottom left panel reproduces the standard input scenario (νr = 9.6 Hz, νa = 6.6 Hz, νs = 3 Hz, ν0 = 175 Hz) for the multiplicative STDP model introduced by Rubin et al. (2001): F+ (w) = λ (wmax − w) and F− (w) = αλw. The synaptic parameters are chosen as for the additive/multiplicative model of van Rossum et al. (2000) investigated above, but with α = 2.13 and wmax = 200 pA. Finally, the bottom right panel shows the results for the standard input scenario in combination with the power-law STDP developed in Morrison et al. (2007) and investigated numerically in Section 3.2:
 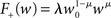 and F− (w) = λαw. Synaptic parameters are set as above, but with α = 0.057, w0 = 1 pA and μ = 0.4. In this example, the nullclines cannot be calculated analytically. For both the alternative STDP models investigated, the deviating parameters are chosen to give the same results for the standard input scenario with no synchronous input
  as the additive/multiplicative model of van Rossum et al. (2000) investigated above: a self-consistent rate
  and a stable fixed point
  .
.
Figure 4. Robustness of results with respect to input rate, STDP model and post-synaptic homeostasis. (A) Location of fixed point ( ; blue,
  ; red) as a function of the number of synchronous inputs
  for different scenarios, see text for details. Top left: low recurrent and external rates (solid curves) with additional homeostatic regulation of the post-synaptic rate (dashed curves). Top right: high synchronous rate (solid curves) with additional homeostatic regulation of the incoming synaptic weights of the post-synaptic neuron. Bottom left: standard input rates and multiplicative STDP model. Bottom right: standard input rates and power-law STDP model. (B) Expected number of spikes emitted by the post-synaptic neuron in the 15 ms following a synchronous spike in the stimulated group in the low rate scenario; axes and black curves as in Figure 3. (C) As in (B) for the standard input rate scenario with the power-law STDP model.
It has previously been suggested that homeostatic regulatory mechanisms are crucial for the development of structure (Doursat and Bienenstock, 2006; Liu and Buonomano, 2009; Fiete et al., 2010). The equation system for the synaptic drifts given in (5) and (6) can easily be extended to incorporate post-synaptic homeostatic mechanisms. A term −λν (νi − νh) acts to increase the synaptic weights if the rate of the post-synaptic neuron is less than a desired rate νh and to decrease them if the post-synaptic rate exceeds νh. A natural choice for νh is the self-consistent rate of the unstimulated network, νr. Similarly, a homeostatic mechanism to conserve the sum of a neuron’s incoming synaptic weights can be modeled by an additional term  where
where  is the total number of incoming synapses and wh is a desired mean synaptic weight. A natural choice for wh is the fixed point of the one-dimensional system in the case that the neuron receives no synchronous input
  . For both models of post-synaptic homeostasis, the expressions for the nullclines of wr and ws given in (12) and (13) acquire additional contributions to the linear and constant coefficients but maintain their quadratic form. In Figure 4A, the development of the fixed point assuming post-synaptic rate homeostasis is shown for the low rate scenario with λν = 3 × 10⁻⁴ pA. Similarly, the fixed point development assuming post-synaptic weight homeostasis is shown for the high synchronous rate scenario with λw = 5 × 10⁻⁶ s−1. In both cases, the presence of post-synaptic homeostasis causes a greater separation to develop between the mean weights of the unsynchronized inputs and the synchronized inputs.
In all scenarios, a smooth shift of the fixed point of the weight distribution  with increasing number of synchronous connections can be observed. When combined with the assumption of random connectivity, all scenarios result in a qualitatively similar return map to that shown in Figure 3 with an unstable fixed point. This is demonstrated in Figures 4B,C with a recruitment threshold of Θr = 0.5 for the low rate scenario (without homeostasis) and the power-law STDP scenario, respectively. As the theoretical model is developed from the point of view of the post-synaptic neuron, it is not easily extensible to account for pre-synaptic homeostatic mechanisms such as the normalization of outgoing weights. However, due to the similarity in behavior between neurons with similar numbers of synchronous inputs, implementing a pre-synaptic mechanism to regulate the total strength of outgoing synapses will not result in symmetry breaking for some specific value of
  . These results lead us to conclude that stable development of structure as a response to synchronous stimulation cannot occur in randomly connected networks incorporating weight-dependent STDP without additional network, cellular or sub-cellular assumptions.
3.2 Simulation Results
To check the predictions of the theoretical model we simulate a large-scale neuronal network with biologically realistic numbers of incoming synapses per neuron and weight-dependent STDP, see Section 2.3 for details. An excitatory sub-population of the network Estim of size Nstim is stimulated by an external group ESIP of size NSIP in which the neurons fire mostly independently but with synchronous events at 3 Hz. Figure 5 shows the development of the mean synaptic weight between the external synchronous group and the stimulated group (top panel) and between the stimulated group and the high-connectivity group (bottom panel) for different sizes of the external group NSIP. The size of the stimulated group Nstim is chosen such that a high-connectivity group Ehc can be found of similar size (Nhc ≈ Nstim) where each neuron in the high-connectivity group receives at least NSIP connections from the stimulated group whereas all other excitatory neurons in the network receive fewer than NSIP connections from the stimulated group. For low values of NSIP, the mean synaptic weight between ESIP and Estim saturates within 10 min. As predicted by the theoretical model derived above, the downstream effect is much weaker; little change can be seen in the mean synaptic weight between Estim and Ehc, even though each neuron in the Ehc receives at least as many inputs from Estim as each neuron in Estim receives from ESIP. For higher values of NSIP, the network is still evolving at 10 min, but the substantially greater effect on the mean synaptic weights between ESIP and Estim, and between Estim and Ehc can be clearly seen.
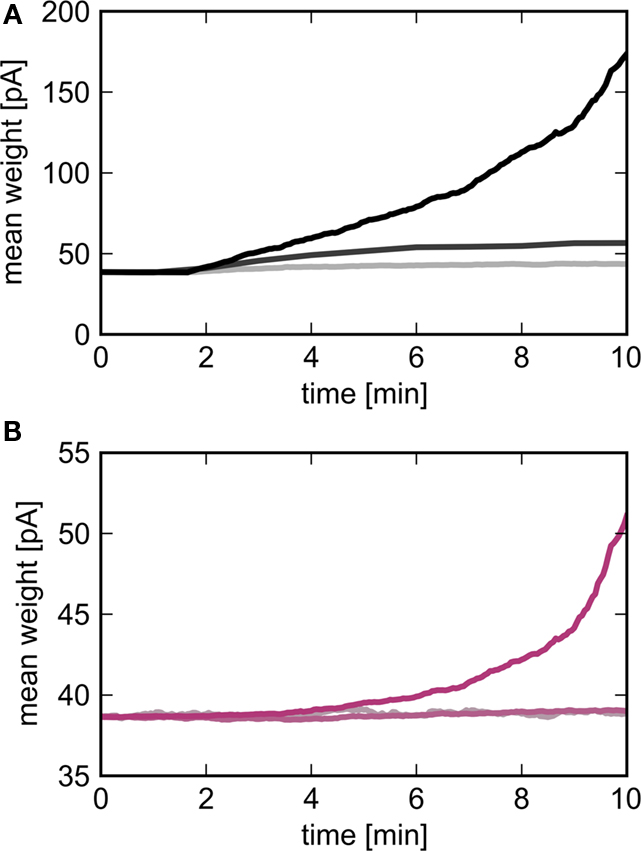
Figure 5. Evolution of the mean synaptic weights as a function of the size of the external group NSIP. Light to dark curves correspond to NSIP = 10, 20, 30 resulting in a size for the stimulated group Nstim = 46, 164, 295 respectively. (A) Mean weight of synapses between the external group ESIP and the stimulated group Estim as a function of time. (B) Mean weight of synapses between the stimulated group and the high-connectivity group receiving at least NSIP connections from it (Nhc = 44, 158, 291).
The rapid change in network behavior as the number of synchronous inputs increases can be seen in Figure 6, see Section 2.4 for the data analysis details. In the upper panel, NSIP = 20 and Nstim = 164. Each neuron in the stimulated group Estim receives input from each of the 20 neurons in the external stimulating group ESIP. Each neuron in the corresponding high-connectivity group Ehc of a similar size (Nhc = 158) receives at least 20 synaptic inputs from Estim. All other excitatory neurons in the network receive 19 or fewer synaptic inputs from Estim and on average 10. The probability that neurons in the stimulated group fire in response (i.e., within 10 ms) to a synchronous stimulation event increases slightly in the first 10 min and then saturates. The probability that neurons in Ehc fire in response to a synchronous stimulation event mediated by Estim remains at base level (i.e., determined by the network firing rate of ≈10 Hz) throughout the simulation. The weight distributions between all groups are very similar (see Figure 6D).
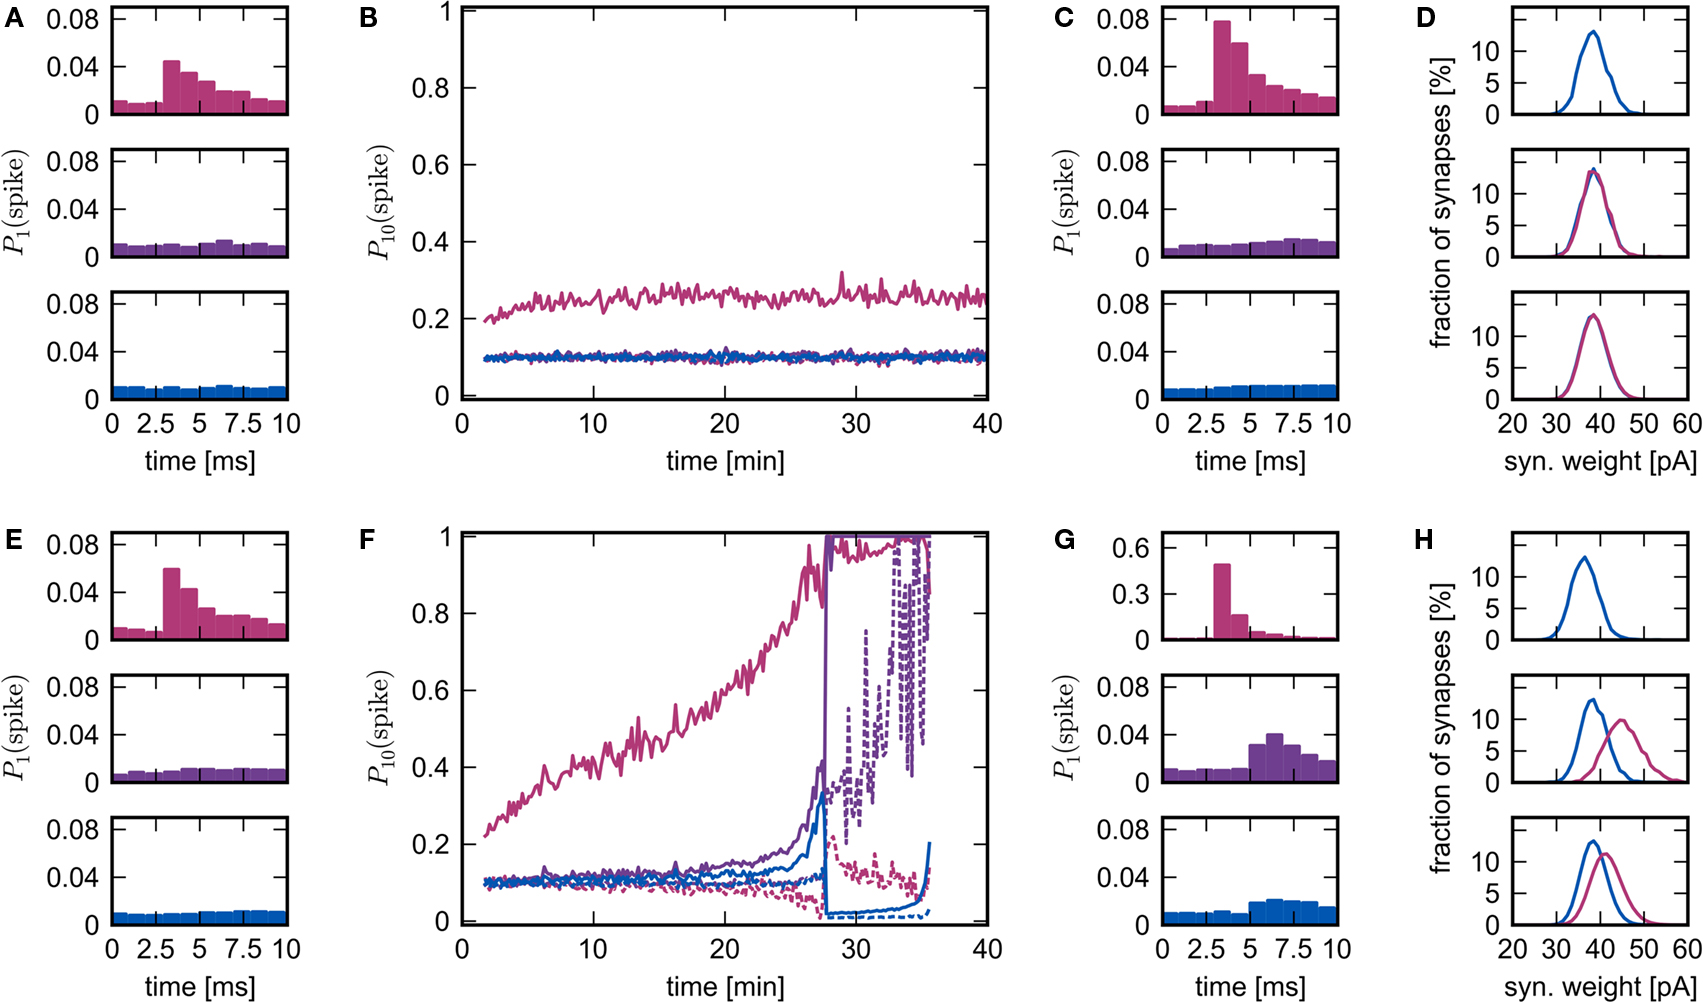
Figure 6. Evolution of network response to synchronous stimulus. (A) Probability of emitting a spike after a synchronous event in the first 10 s of stimulation for the stimulated group (top), the high-connectivity group (middle) and the random group (bottom) for NSIP = 20 and Nstim = 164. (B) Evolution of the probability of emitting a spike in the 10 ms immediately before (dashed lines) or immediately after a synchronous event (solid lines) in successive 10 s periods. Colors as in (A). (C) As in (A) but for the 10 s period following 25 min of simulation. (D) Distribution of incoming synaptic weights at 25 min for the stimulated group (top) from the random group (blue), the synaptic weight distribution from the external group (mean 56.9 pA) is not shown; for the high-connectivity group (middle) from the random group (blue) and the stimulated group (pink); for the random group (bottom) from the random group (blue) and the stimulated group (pink). (E–H): As for (A–D) but for NSIP = 25 and Nstim = 228. The synaptic weight distribution from the external group to the stimulated group (mean 161.4 pA) is not shown in the top panel of (H).
In the lower panel, NSIP = 25, Nstim = 228 and Nhc = 228. Each neuron in Ehc receives 25 or more synaptic inputs from Estim, whereas all other excitatory neurons in the network receive 24 or fewer inputs from Estim and on average 14. The probability that neurons in Estim fire in response to a synchronous stimulation event increases steadily over the course of the simulation until almost all neurons are firing in response to every synchronous event. The probability that neurons in Ehc fire in response to a synchronous stimulation event, mediated by Estim, remains at approximately base level for the first 20 min. Between 20 and 25 min, the probability of response increases sharply. However, the probability that neurons randomly selected from the rest of the network fire in response to a synchronous stimulation event also increases sharply during this period. This is reflected in the weight distributions. The middle panel of Figure 6H shows the distribution of incoming synaptic weights to the high-connectivity group Ehc. The mean of the distribution of weights between Estim and Ehc shifts to a higher value than that between randomly selected neurons and Ehc, as seen in Figure 2B. However, the same is true to a lesser extent for the distributions of the incoming weights to the random group (bottom panel of Figure 6H). Note that the mean of the distribution of the incoming synaptic weights to the stimulated group from the rest of the network has shifted to a lower value (top panel of Figure 6H) due to the acausal correlation between activity in the network and activity in the stimulated group. If the synapses from ESIP to Estim are clipped to an upper bound, this drift eventually leads to a decoupling of the stimulated group, as was reported in Morrison et al. (2007). However, the insight that STDP reduces the strength of recurrent connections was originally described by Abbott and Nelson (2000), and more recently proved for polysynaptic loops of arbitrary length by Kozloski and Cecchi (2010).
Between 27 and 28 min the increasing response of the network to synchronous events causes it to enter a pathological state in which some neurons are firing very rapidly all the time and some are almost silent. The theoretical model developed in Section 3.1 does not predict the occurrence or the characteristics of the pathological state, as it does not take into account the interactions between neurons in the network, only the interactions between a synchronously firing group and its post-synaptic targets.
To test the conclusion that the introduction of homeostatic mechanisms do not alter the nature of the fixed point, we repeat the above experiments with pre-synaptic homeostasis. Every 3 s the outgoing synapses of every excitatory neuron in the recurrent network are adjusted by a multiplicative factor such that the total sum of its plastic synapses is reset. Similarly to the results obtained without homeostasis, synchronous stimulation from a group of NSIP = 20 external neurons is neither enough to produce a reliable response of the stimulated group (Nstim = 164) nor any substantial changes in the high-connectivity group (Nhc = 158), whereas a slightly stronger stimulus (NSIP = 25, Nstim = 228, Nhc = 228) causes a network to enter a pathological state (see Figures 7A,B). The transition occurs much later, at around 90 min rather than 28 min in the absence of homeostasis, demonstrating the stabilizing effect of the weight normalization. Unlike the results shown in Figure 6F for pure STDP, as soon as the stimulated group reflects the stimulus with sufficient reliability, a clear difference between the response likelihood of the high-connectivity group and the network as a whole can be observed. The high response likelihood of the high-connectivity group breaks down rapidly when the network starts responding more strongly to the synchronous stimulation at around 60 min. This is another example of the decoupling of a synchronously active group from its embedding network as described above and in Morrison et al. (2007). As the response to the synchronous stimulus of the network generally lags behind the response in the high-connectivity group, acausal correlations are generated in the incoming synapses of the high-connectivity group. As the synaptic weights decrease, so does the mean membrane potential, thus diminishing the response of the neurons to the synchronous stimulus events. The stimulated group Estim does not decouple in this fashion because the increasing strength of the connections from the external input can compensate for the loss of input from the recurrent network.
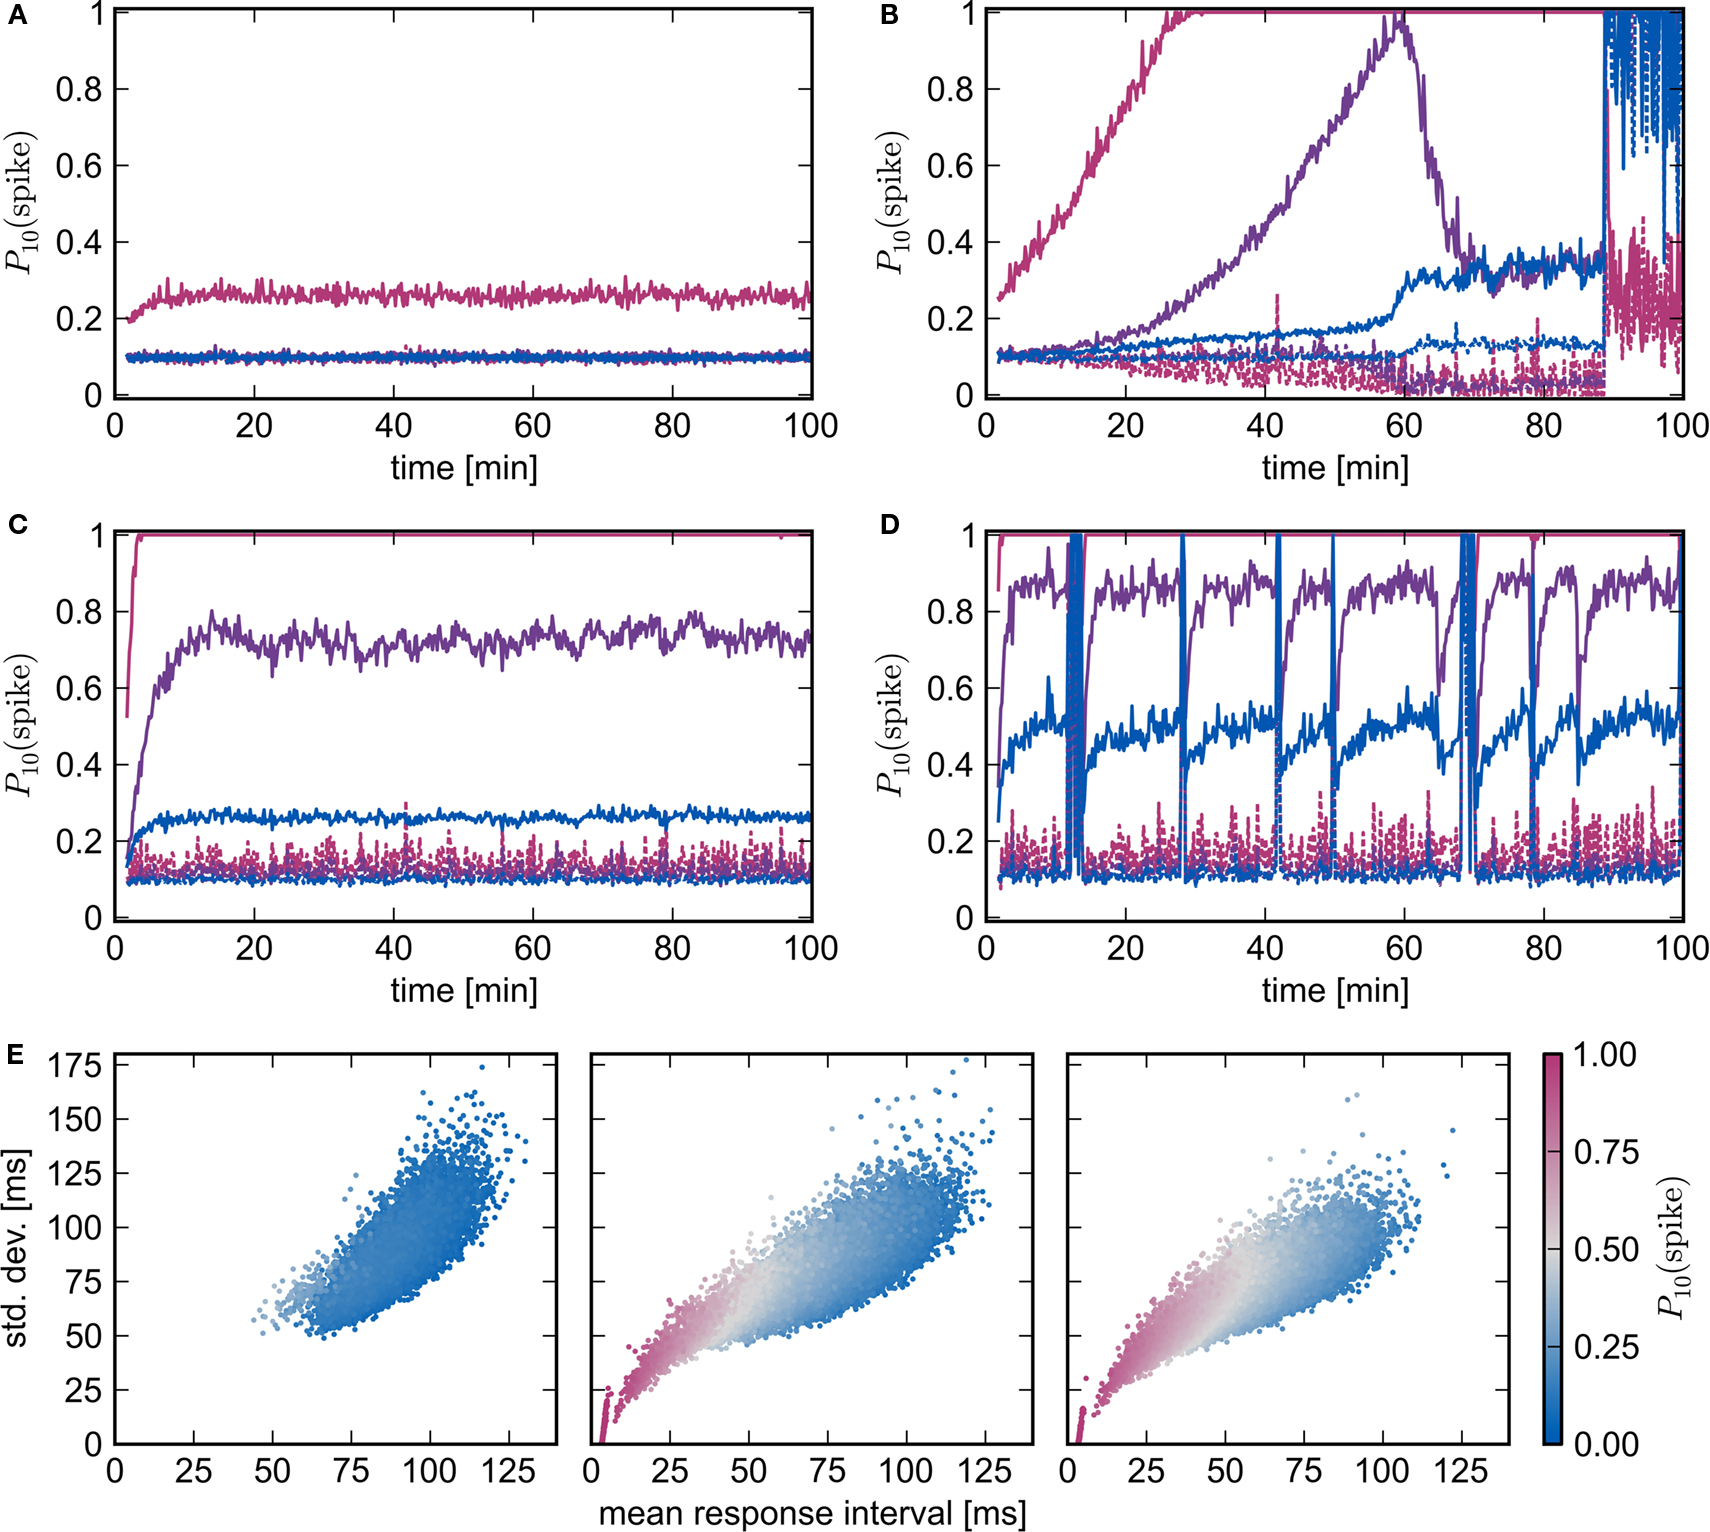
Figure 7. Spike-timing dependent plasticity and homeostasis. (A,B) Evolution of network response to synchronous stimulus where STDP synapses in the recurrent network are subject to weight normalizing pre-synaptic homeostasis for NSIP = 20, Nstim = 164, Nhc = 158 and NSIP = 25, Nstim = 228, Nhc = 228, respectively. Probability of emitting a spike in the 10 ms immediately before (dashed lines) or immediately after a synchronous event (solid lines) in successive 10 s periods for the stimulated group (pink), the high-connectivity group (purple) and the random group (blue). (C,D) As in (A,B) but for pre- and post-synaptic homeostasis; NSIP = 50, Nstim = 584, Nhc = 576 and NSIP = 75, Nstim = 961, Nhc = 963, respectively. (E) Response latency and reliability for a network with STDP, pre- and post-synaptic homeostasis. Mean and SD of the response interval for each excitatory neuron to each synchronous event in the 26th minute (left, middle) or 21st minute (right). Marker color indicates the likelihood of the neuron to fire within 10 ms of a synchronous event. From left to right the panels correspond to NSIP = 20, 50, 75 and Nstim = 164, 584, 961.
Figures 7C,D show the development of the response likelihood when post-synaptic homeostasis is also applied, such that the total strength of incoming and outgoing synapses are normalized alternately every 1.5 s. The network behavior is much more stable. The network remains in a stable asynchronous irregular activity regime even when an external group of size NSIP = 50 stimulates a group of Nstim = 584 excitatory neurons (Figure 7C). However, the response probability of the high-connectivity group (Nhc = 576) saturates at a lower level than the maximum response likelihood reached in Figure 7B with purely pre-synaptic homeostasis. Although increasing NSIP increases the number of neurons in Estim available to drive a potential high-connectivity group Ehc, it also increases the size of Ehc. In the presence of pre-synaptic homeostasis, this reduces the mean strength of the connections between Estim and Ehc.
Synchronous stimulation from an external group of size NSIP = 75 drives the network into a pathological state despite the homeostasis as can be seen in Figure 7D. The interaction between the homeostasis and the strong stimulus sets up an oscillatory behavior in which the network repeatedly enters a pathological state but is reset by the application of homeostasis. Between pathological interludes, all neurons have a high probability of responding to a synchronous stimulus. The absence of clearly defined neuronal groups can be seen in Figure 7E. In the left panel, the network with STDP, pre- and post-synaptic homeostasis shows little response to synchronous stimulation by a small group of NSIP = 20 external neurons: the average latency is approximately the inter-spike interval of the network background rate. The middle and the left panel correspond to Figures 7C,D, i.e., synchronous stimulation by much larger external groups of NSIP = 50 and NSIP = 75 neurons, respectively. The neurons of the stimulated group (Nstim = 584 and Nstim = 961) can be seen to have separated themselves and respond quickly and reliably to the synchronous stimulus. The mean response latency shifts to an earlier value and the mean SD of the latency is reduced, demonstrating that the network as a whole responds earlier and more reliably to the stronger stimulus. Those neurons that respond earliest also have the lowest SD and are thus most likely to respond within 10 ms of a synchronous stimulus. However, there is no separation of a second group from the mass. We therefore conclude that no development of feed-forward structure can be observed, even in the presence of pre- and post-synaptic homeostasis and strong synchronous stimulus.
4 Discussion
We have developed a simple model using a mean field approach and a linear neuron model to investigate the propagation of feed-forward structure in plastic recurrent networks. The key prediction of the model is that the number of neurons recruited by a repeated synchronous stimulus protocol is subject to an unstable fixed point. A synchronously firing group of neurons of a size below that of the fixed point recruits a smaller group, leading to a failure of the structure to propagate, whereas a synchronously firing group of a size above that of the fixed point recruits a larger group, causing the whole network to be recruited. In other words, a repeated synchronous stimulus is always either not enough or too much. We demonstrated by simulation that a large-scale network behaves as predicted by the mean field theory.
The existence of the unstable fixed point is robust. Employing a different weight-dependent STDP model, altering the input rates or introducing homeostatic mechanisms, e.g., regulating incoming synapses so as to maintain the total synaptic strength or post-synaptic rate, only influences the dynamics quantitatively. The unstable fixed point can be shifted to a larger or smaller group size, but it cannot be turned into a stable fixed point. The instability arises through the combination of a binomial distribution of connections from a given synchronously active group with the smooth change of the stable fixed point in the synaptic weight distribution as a function of the number of synchronous connections. Thus, any change to the model assumptions which does not produce a qualitative change in at least one of these factors will produce similar results, e.g., distributing the conduction delays or defining the conduction delay to be largely axonal, although such adaptations of the network model may well suppress or alter the pathological state the network enters when the amount of stimulation is too high (see Lubenov and Siapas, 2008). As an example, we demonstrated that the introduction of pre- and post-synaptic homeostatic mechanisms that maintain the total strength of outgoing and incoming recurrent synapses makes the network more stable, but does not enable the development of feed-forward structures.
Stable propagation of feed-forward structure is only possible if one or more of our assumptions are false. Other simulation studies have previously reported structure development (Hertz and Prügel-Bennet, 1996; Levy et al., 2001; Izhikevich et al., 2004; Doursat and Bienenstock, 2006; Jun and Jin, 2007; Masuda and Kori, 2007; Hosaka et al., 2008; Liu and Buonomano, 2009; Fiete et al., 2010). However, it is our contention that the risk of non-generalizable results is high when studying networks that are small, have few incoming synapses per neuron, or assume STDP rules that are independent of the synaptic weight. Each neuron in our network model receives a biologically realistic number of inputs (6000) and the network exhibits a biologically realistic degree of sparseness (connection probability of 0.06), while our model of STDP reproduces the experimentally found weight dependence of the amount of potentiation and depression a synapse undergoes (Bi and Poo, 1998; Morrison et al., 2007). We therefore suggest that the previously reported development of structure be considered artifactual until a greater degree of validation can be obtained. In our view, a weak proof of principle would be the demonstration of bounded structural growth in a network model with at least as great a degree of biological realism as in our study with respect to connectivity and plasticity, with additional assumptions that at least do not contradict experimental findings. A stronger, more convincing, proof would be provided by such a network model in which the additional assumptions are experimentally motivated.
Given that the brain does develop stable signal pathways, there is every reason to expect that a network model can be developed that fulfills these criteria for a strong proof of principle. One indication that the model we have investigated is overly simplified is that the combination of network structure, neuronal dynamics and plasticity leads to a symmetrical distribution of synaptic weights, rather than the skewed distribution observed experimentally (Sjöström et al., 2001). Therefore, a promising candidate adaptation that might result in a stable fixed point and thus stable propagation of feed-forward structure is the initial connectivity of the network. Here, we assume a random graph; however, the cortical network consists of several layers with layer-specific connectivity and exhibits long range patchy connections (Lewis et al., 2002; Schüz and Braitenberg, 2002; Thomson and Bannister, 2003; Binzegger et al., 2004). A more realistic graph structure might eliminate the “fan-out” tendency that underlies the instability of the fixed point. Such adaptations may also entail the use of a more complex neuron model than assumed here. Kumar et al. (2008) demonstrated that the regime enabling stable propagation activity in a feed-forward sub-network embedded in a locally connected random network is much greater for a conductance-based neuron model than previously found for a current-based model (Mehring et al., 2003). Moreover, a more sophisticated neuron model, particularly with respect to the dendritic integration of inputs, might exhibit greater symmetry breaking properties.
Another candidate is the formulation of the STDP rule. Although we have shown that our results are robust to the choice of update rule, we have only considered extremely simplified models of STDP exclusively at excitatory–excitatory synapses; the role of plasticity at inhibitory synapses is neglected. We addressed models in which the STDP window is fitted by two exponential functions, which is easy to analyze but may be too simplistic. Further, we have so far only considered rules based on pairs of spikes. Pfister and Gerstner (2006) introduced a rule based on triplets of spikes which accounts for experimental findings on the dependence of the weight change on the frequency of the pairing protocols (Sjöström et al., 2001). The triplet model has been shown to map to the BCM rule (Bienenstock et al., 1982) and to give near-optimal information transmission when combined with spike-frequency adaptation in the post-synaptic neuron (Hennequin et al., 2010). The triplet interaction could well also prove to be important for the development of structure. Moreover, recent experimental findings reveal that neuromodulation can influence STDP. Seol et al. (2007) showed that the polarity of the STDP window depends on the activation of receptors sensitive to cholinergic and adrenergic activity. A recent study by Kozloski and Cecchi (2010) demonstrated that polysynaptic loops eliminated by standard STDP can be restored by such a reversed rule. This finding suggests that the interaction of causal and anti-causal windows may indeed result in the kind of symmetry breaking that would enable groups of neurons to develop a qualitatively different response to a given synchronous stimulus. Neuromodulation can also be essential either for inducing STDP or for altering the threshold for induction, see Pawlak et al. (2010) in this special issue for a review. Finally, our theoretical approach does not take into account interactions of STDP with other forms of plasticity except post-synaptic homeostasis. Although no development of feed-forward structure occurs in our homeostatically regulated network models, the presence of homeostasis certainly has a strong stabilizing effect on the network dynamics. Therefore, homeostasis may be a crucial element that enables network dynamics to be maintained during stimulus-driven development of structure. Short-term plasticity is another feature overlooked in the current study. The interaction of STDP with depression and facilitation could result in different network dynamics that would be more favorable to symmetry breaking, as could the incorporation of tagging processes to stabilize the developed structures (Frey and Morris, 1997; Reymann and Frey, 2007; Clopath et al., 2008). We therefore conclude that the development and investigation of more sophisticated models of STDP that interact with other forms of plasticity on different time scales would be a useful future extension of this research.
A third area in which the model presented here could be adapted is the stimulus protocol. Here, we investigated whether structure can develop from the seed of a single correlated group. Several forms of synaptic pathway organization have been identified and mathematically analyzed for recurrent networks under the assumption that they receive input from more than one pool of correlated inputs (e.g., Gilson et al., 2009b,c; see Gilson et al., 2010 for a thorough review). However, the majority of the findings assume STDP that is independent of the synaptic weight or only very weakly dependent. Moreover, only small networks are considered in which each neuron receives external correlated input. It will therefore be interesting to discover how these results scale up to the large, sparsely connected networks with weight-dependent plasticity considered in this article.
These candidate adaptations are not intended to be exhaustive. There are many ways in which the theoretical approach and network model presented here could be improved and supplemented. However, we hope that the suggestions above can serve to stimulate research to reveal the necessary and sufficient conditions for the development of structure in the mammalian brain.
Conflict of Interest Statement
The authors declare that the research was conducted in the absence of any commercial or financial relationships that could be construed as a potential conflict of interest.
Acknowledgments
Partially funded by DIP F1.2, BMBF Grant 01GQ0420 to BCCN Freiburg, EU Grant 15879 (FACETS), EU Grant 269921 (BrainScaleS), Helmholtz Alliance on Systems Biology (Germany), Next-Generation Supercomputer Project of MEXT (Japan), Neurex, and the Junior Professor Program of Baden-Württemberg. High-performance computing facilities were made available through the Norwegian Metacenter for Computational Science (Notur) and JUGENE Grant JINB33 at the Research Center Jülich. We gratefully acknowledge T. Potjans for his help in determining appropriate connectivity levels for our network model and S. Jahnke for his comments on an earlier version of the manuscript.
References
Abbott, L. F., and Nelson, S. B. (2000). Synaptic plasticity: taming the beast. Nat. Neurosci. 3(Suppl.), 1178–1183.
Abeles, M. (1991). Corticonics: Neural Circuits of the Cerebral Cortex, 1st Edn. Cambridge: Cambridge University Press.
Abeles, M., Bergman, H., Margalit, E., and Vaadia, E. (1993). Spatiotemporal firing patterns in the frontal cortex of behaving monkeys. J. Neurophysiol. 70, 1629–1638.
Bi, G.-Q., and Poo, M.-M. (1998). Synaptic modifications in cultured hippocampal neurons: dependence on spike timing, synaptic strength, and postsynaptic cell type. J. Neurosci. 18, 10464–10472.
Bienenstock, E. L., Cooper, L. N., and Munro, P. W. (1982). Theory for the development of neuron selectivity: orientation specificity and binocular interaction in visual cortex. J. Neurosci. 2, 32–48.
Binzegger, T., Douglas, R. J., and Martin, K. A. C. (2004). A quantitative map of the circuit of cat primary visual cortex. J. Neurosci. 39, 8441–8453.
Brunel, N. (2000). Dynamics of sparsely connected networks of excitatory and inhibitory spiking neurons. J. Comput. Neurosci. 8, 183–208.
Clopath, C., Ziegler, L., Vasilaki, E., Büsing, L., and Gerstner, W. (2008). Tag-trigger-consolidation: a model of early and late long-term-potentiation and depression. PLoS Comput. Biol. 4, e1000248. doi: 10.1371/journal.pcbi.1000248
Debanne, D., Gähwiler, B. H., and Thompson, S. M. (1996). Cooperative interactions in the induction of long-term potentiation and depression of synaptic excitation between hippocampal CA3-CA1 cell pairs in vitro. Proc. Natl. Acad. Sci. U.S.A. 93, 11225–11230.
Debanne, D., Gähwiler, B. H., and Thompson, S. M. (1999). Heterogeneity of synaptic plasticity at unitary CA1-CA3 and CA3-CA3 connections in rat hippocampal slice cultures. J. Neurosci. 19, 10664–10671.
Diesmann, M., Gewaltig, M.-O., and Aertsen, A. (1999). Stable propagation of synchronous spiking in cortical neural networks. Nature 402, 529–533.
Doursat, R., and Bienenstock, E. (2006). “Neocortical self-structuration as a basis for learning,” in 5th International Conference on Development and Learning (ICDL 2006), Indiana University, Bloomington, IN.
Eckhorn, R., Bauer, R., Jordan, W., Brosch, M., Kruse, W., Munk, M., and Reitböck, H. J. (1988). Coherent oscillations: a mechanism of feature linking in the visual cortex? Biol. Cybern. 60, 121–130.
Fiete, I. R., Senn, W., Wang, C. Z. H., and Hahnloser, R. H. R. (2010). Spike-time-dependent plasticity and heterosynaptic competition organize networks to produce long scale-free sequences of neural activity. Neuron 65, 563–576.
Gerstner, W., Ritz, R., and van Hemmen, J. (1993). Why spikes? Hebbian learning and retrieval of time-resolved excitation patterns. Biol. Cybern. 69, 503–515.
Gewaltig, M.-O., Diesmann, M., and Aertsen, A. (2001). Propagation of cortical synfire activity: survival probability in single trials and stability in the mean. Neural Netw. 657–673.
Gilson, M., Burkitt, A. N., Grayden, D. B., Thomas, D. A., and van Hemmen, J. L. (2009a). Emergence of network structure due to spike-timing-dependent plasticity in recurrent neuronal networks. I. Input selectivity – strengthening correlated input pathways. Biol. Cybern. 101, 81–102.
Gilson, M., Burkitt, A. N., Grayden, D. B., Thomas, D. A., and van Hemmen, J. L. (2009b). Emergence of network structure due to spike-timing-dependent plasticity in recurrent neuronal networks. II. Input selectivity – symmetry breaking. Biol. Cybern. 101, 103–114.
Gilson, M., Burkitt, A. N., Grayden, D. B., Thomas, D. A., and van Hemmen, J. L. (2009c). Emergence of network structure due to spike-timing-dependent plasticity in recurrent neuronal networks IV. Structuring synaptic pathways among recurrent connections. Biol. Cybern. 101, 427–444.
Gilson, M., Burkitt, A. N., and van Hemmen, J. L. (2010). STDP in recurrent neuronal networks. Front. Comput. Neurosci. 4:23. doi: 10.3389/fncom.2010.00023
Gray, C. M., and Singer, W. (1989). Stimulus-specific neuronal oscillations in orientation columns of cat visual cortex. Proc. Natl. Acad. Sci. U.S.A. 86, 1698–1702.
Gustafsson, B., Wigstrom, H., Abraham, W. C., and Huang, Y.-Y. (1987). Long-term potentiation in the hippocampus using depolarizing current pulses as the conditioning stimulus to single volley synaptic potentials. J. Neurosci. 7, 774–780.
Gütig, R., Aharonov, R., Rotter, S., and Sompolinsky, H. (2003). Learning input correlations through nonlinear temporally asymmetric Hebbian plasticity. J. Neurosci. 23, 3697–3714.
Hahnloser, R. H., Kozhevnikov, A. A., and Fee, M. S. (2002). An ultra-sparse code underlies the generation of neural sequences in a songbird. Nature 419, 65–70.
Hayon, G., Abeles, M., and Lehmann, D. (2004). Modeling compositionality by dynamic binding of synfire chains. J. Comput. Neurosci. 17, 179–201.
Hebb, D. O. (1949). The Organization of Behavior: A Neuropsychological Theory. New York: John Wiley and Sons.
Hennequin, G., Gerstner, W., and Pfister, J.-P. (2010). STDP in adaptive neurons gives close-to-optimal information transmission. Front. Comput. Neurosci. 4:143. doi: 10.3389/fncom.2010.00143
Hertz, J., and Prügel-Bennet, A. (1996). Learning synfire-chains by self-organization. Network 7, 357–363.
Hosaka, R., Araki, O., and Ikeguchi, T. (2008). STDP provides the substrate for igniting synfire chains by spatiotemporal input patterns. Neural Comput. 20, 415–435.
Iglesias, J., Eriksson, J., Grize, F., Tomassini, M., and Villa, A. (2005). Dynamics of pruning in simulated large-scale spiking neural networks. Biosystems 79, 11–20.
Ikegaya, Y., Aaron, G., Cossart, R., Aronov, D., Lampl, I., Ferster, D., and Yuste, R. (2004). Synfire chains and cortical songs: temporal modules of cortical activity. Science 5670, 559–564.
Izhikevich, E. M., Gally, J. A., and Edelman, G. M. (2004). Spike-timing dynamics of neuronal groups. Cereb. Cortex 14, 933–944.
Jun, J. K., and Jin, D. Z. (2007). Development of neural circuitry for precise temporal sequences through spontaneous activity, axon remodeling, and synaptic plasticity. PLoS ONE 2, e723. doi: 10.1371/journal.pone.0000723
Kempter, R., Gerstner, W., and van Hemmen, J. L. (1999). Hebbian learning and spiking neurons. Phys. Rev. E 59, 4498–4514.
Kempter, R., Gerstner, W., and van Hemmen, J. L. (2001). Intrinsic stabilization of output rates by spike-based Hebbian learning. Neural Comput. 12, 2709–2742.
Kistler, W. M., and van Hemmen, J. L. (2000). Modeling synaptic plasticity in conjunction with the timing of pre- and postsynaptic action potentials. Neural Comput. 12, 385–405.
Kozhevnikov, A., and Fee, M. S. (2007). Singing-related activity of identified HVC neurons in the zebra finch. J. Neurophysiol. 97, 4271–4283.
Kozloski, J., and Cecchi, G. A. (2010). A theory of loop formation and elimination by spike timing-dependent plasticity. Front. Neural Circuits 4:7. doi: 10.3389/fncir.2010.00007
Kuhn, A., Aertsen, A., and Rotter, S. (2003). Higher-order statistics of input ensembles and the response of simple model neurons. Neural Comput. 1, 67–101.
Kumar, A., Rotter, S., and Aertsen, A. (2008). Conditions for propagating synchronous spiking and asynchronous firing rates in a cortical network model. J. Neurosci. 28, 5268–5280.
Levy, N., Horn, D., Meilijson, I., and Ruppin, E. (2001). Distributed synchrony in a cell assembly of spiking neurons. Neural Netw. 14, 815–824.
Lewis, D., Melchitzky, D., and Burgos, G.-G. (2002). Specificity in the functional architecture of primate prefontal cortex. J. Neurocytol. 31, 265–276.
Liu, J. K., and Buonomano, D. V. (2009). Embedding multiple trajectories in simulated recurrent neural networks in a self-organizing manner. J. Neurosci. 29, 13172–13181.
Lubenov, E. V., and Siapas, A. G. (2008). Decoupling through synchrony in neuronal circuits with propagation delays. Neuron 58, 118–131.
Markram, H., Lübke, J., Frotscher, M., and Sakmann, B. (1997). Regulation of synaptic efficacy by coincidence of postsynaptic APs and EPSPs. Science 275, 213–215.
Markram, H., and Sakmann, B. (1995). Action potentials propagating back into dendrites trigger changes in efficacy of single-axon synapses between layer V pyramidal neurons. Soc. Neurosci. Abstr. 21, 2007.
Masuda, N., and Kori, H. (2007). Formation of feedforward networks and frequency synchrony by spike-timing-dependent plasticity. J. Comput. Neurosci. 22, 327–345.
Mehring, C., Hehl, U., Kubo, M., Diesmann, M., and Aertsen, A. (2003). Activity dynamics and propagation of synchronous spiking in locally connected random networks. Biol. Cybern. 88, 395–408.
Migliore, M., Cannia, C., Lytton, W. W., Markram, H., and Hines, M. (2006). Parallel network simulations with neuron. J. Comput. Neurosci. 21, 119–223.
Montgomery, J., Pavlidis, P., and Madison, D. (2001). Pair recordings reveal all-silent synaptic connections and the postsynaptic expression of long-term potentiation. Neuron 29, 691–701.
Morrison, A., Aertsen, A., and Diesmann, M. (2007). Spike-timing dependent plasticity in balanced random networks. Neural Comput. 19, 1437–1467.
Morrison, A., Diesmann, M., and Gerstner, W. (2008). Phenomenological models of synaptic plasticity based on spike-timing. Biol. Cybern. 98, 459–478.
Morrison, A., Mehring, C., Geisel, T., Aertsen, A., and Diesmann, M. (2005). Advancing the boundaries of high connectivity network simulation with distributed computing. Neural Comput. 17, 1776–1801.
Nordlie, E., Plesser, H. E., and Gewaltig, M.-O. (2009). Towards reproducible descriptions of neuronal network models. PLoS Comput. Biol. 5, e1000456. doi: 10.1371/journal.pcbi.1000456
Pawlak, V., Wickens, J. R., Kirkwood, A., and Kerr, J. N. D. (2010). Timing is not everything: neuromodulation opens the STDP gate. Front. Syn. Neurosci. 2:146. doi: 10.3389/fnsyn.2010.00146
Pecevski, D., Natschläger, T., and Schuch, K. (2009). PCSIM: a parallel simulation environment for neural circuits fully integrated with python. Front. Neuroinform. 3:11. doi: 10.3389/neuro.11.011.2009
Pfister, J.-P., and Gerstner, W. (2006). Triplets of spikes in a model of spike timing-dependent plasticity. J. Neurosci. 26, 9673–9682.
Prut, Y., Vaadia, E., Bergman, H., Haalman, I., Hamutal, S., and Abeles, M. (1998). Spatiotemporal structure of cortical activity: Properties and behavioral relevance. J. Neurophysiol. 79, 2857–2874.
Pulvermüller, F., and Shtyrov, Y. (2009). Spatiotemporal signatures of large-scale synfire chains for speech processing as revealed by MEG. Cereb. Cortex 19, 79–88.
Reymann, K. G., and Frey, J. U. (2007). The late maintenance of hippocampal LTP: Requirements, phases, “synaptic tagging,” “late-associativity” and implications. Neuropharmacology 52, 24–40.
Rubin, J., Lee, D., and Sompolinsky, H. (2001). Equilibrium properties of temporally asymmetric Hebbian plasticity. Phys. Rev. Lett. 86, 364–367.
Schüz, A., and Braitenberg, V. (2002). “The human cortical white matter: quantitative aspects of cortico-cortical long-range connectivity,” in Cortical Areas: Unity and Diversity, Chapter 16, eds A. Schüz and R. Miller (London: Taylor and Francis), 377–385.
Seol, G., Ziburkus, J., Huang, S., Song, L., Kim, I., Takamiya, K., Huganir, R., Lee, H.-K., and Kirkwood, A. (2007). Neuromodulators control the polarity of spike-timing-dependent plasticity. Neuron 55, 919–929.
Sjöström, P., Turrigiano, G., and Nelson, S. (2001). Rate, timing, and cooperativity jointly determine cortical synaptic plasticity. Neuron 32, 1149–1164.
Song, S., Miller, K. D., and Abbott, L. F. (2000). Competitive Hebbian learning through spike-timing-dependent synaptic plasticity. Nat. Neurosci. 3, 919–926.
Song, S., Sjöström, P. J., Reigl, M., Nelson, S., and Chklovskii, D. B. (2005). Highly nonrandom features of synaptic connectivity in local cortical circuits. PLoS Biol. 3, e350. doi: 10.1371/journal.pbio.0030350
Standage, D., Jalil, S., and Trappenberg, T. (2007). Computational consequences of experimentally derived spike-time and weight dependent plasticity rules. Biol. Cybern. 96, 615–623.
Thomson, A. M., and Bannister, P. (2003). Interlaminar connections in the neocortex. Cereb. Cortex 13, 5–14.
Turrigiano, G. G., Leslie, K. R., Desai, N. S., Rutherford, L. C., and Nelson, S. B. (1998). Activity-dependent scaling of quantal amplitude in neocortical neurons. Nature 391, 892–896.
van Rossum, M. C. W., Bi, G.-Q., and Turrigiano, G. G. (2000). Stable Hebbian learning from spike timing-dependent plasticity. J. Neurosci. 20, 8812–8821.
Wang, H.-X., Gerkin, R. C., Nauen, D. W., and Bi, G.-Q. (2005). Coactivation and timing-dependent integration of synaptic potentiation and depression. Nat. Neurosci. 8, 187–193.
Keywords: spike-timing dependent plasticity, feed-forward structure, random recurrent network
Citation: Kunkel S, Diesmann M and Morrison A (2011) Limits to the development of feed-forward structures in large recurrent neuronal networks. Front. Comput. Neurosci. 4:160. doi: 10.3389/fncom.2010.00160
Received: 15 March 2010;
Accepted: 25 December 2010;
Published online: 14 February 2011.
Edited by:
Per Jesper Sjöström, University College London, UKReviewed by:
Brent Doiron, University of Pittsburgh, USASean L. Hill, Ecole Polytechnique Fédérale de Lausanne, Switzerland
Tim P. Vogels, Ecole Polytechnique Fédérale de Lausanne, Switzerland
Copyright: © 2011 Kunkel, Diesmann and Morrison. This is an open-access article subject to an exclusive license agreement between the authors and Frontiers Media SA, which permits unrestricted use, distribution, and reproduction in any medium, provided the original authors and source are credited.
*Correspondence: Abigail Morrison, Bernstein Center Freiburg, Hansastrasse 9a, 79104 Freiburg im Breisgau, Germany. e-mail: morrison@bcf.uni-freiburg.de