Distinguishing linear vs. non-linear integration in CA1 radial oblique dendrites: it’s about time
- 1 Department of Basic Physics, University of La Laguna, S.C. de Tenerife, Spain
- 2 Department of Biomedical Engineering and Neuroscience Graduate Program, University of Southern California, Los Angeles, CA, USA
- 3 Institute of Molecular Biology and Biotechnology, Foundation for Research and Technology-Hellas, Heraklion, Greece
It was recently shown that multiple excitatory inputs to CA1 pyramidal neuron dendrites must be activated nearly simultaneously to generate local dendritic spikes and supralinear responses at the soma; even slight input desynchronization prevented local spike initiation (Gasparini and Magee, 2006; Losonczy and Magee, 2006). This led to the conjecture that CA1 pyramidal neurons may only express their non-linear integrative capabilities during the highly synchronized sharp waves and ripples that occur during slow wave sleep and resting/consummatory behavior, whereas during active exploration and REM sleep (theta rhythm), inadequate synchronization of excitation would lead CA1 pyramidal cells to function as essentially linear devices. Using a detailed single neuron model, we replicated the experimentally observed synchronization effect for brief inputs mimicking single synaptic release events. When synapses were driven instead by double pulses, more representative of the bursty inputs that occur in vivo, we found that the tolerance for input desynchronization was increased by more than an order of magnitude. The effect depended mainly on paired-pulse facilitation of NMDA receptor-mediated responses at Schaffer collateral synapses. Our results suggest that CA1 pyramidal cells could function as non-linear integrative units in all major hippocampal states.
Introduction
In vitro and modeling studies of both CA1 and neocortical pyramidal neurons have shown that the thin basal and apical branches of these cells are capable of generating local dendritic spikes (Schiller et al., 2000; Larkum et al., 2001, 2009; Wei et al., 2001; Ariav et al., 2003; Gasparini et al., 2004; Jarsky et al., 2005; Milojkovic et al., 2005; Nevian et al., 2007; Major et al., 2008), and that the voltage-dependent currents that underlie dendritic spiking can lead to supralinear summation of two or more spatially convergent excitatory inputs (Shepherd and Brayton, 1987; Mel, 1993; Mel et al., 1998; Ariav et al., 2003; Poirazi et al., 2003a,b; Polsky et al., 2004; Losonczy and Magee, 2006; Katz et al., 2009). Losonczy and Magee (2006) used multi-site two-photon glutamate uncaging to stimulate varying numbers of spines on radial oblique dendrites of CA1 pyramidal neurons, with the goal to map out the spatio-temporal requirements for triggering local spikes in these branches. Unlike Polsky et al. (2004) who found that two inputs to a layer 5 basal dendrite could sum supralinearly when the second input was delivered up to 40 ms after the first, this study found that supralinear summation in CA1 oblique dendrites occurred only when a set of spines on a single branch was activated within a very narrow time window – typically within 6 ms or less. When the stimulus was spread over a longer period, a local spike generally did not occur and the post-synaptic response instead grew linearly with the number of activated spines.
The demonstration of such a brief (6 ms) window for supralinear interaction in CA1 oblique dendrites is striking, as it implies that the triggering of dendritic spikes can tolerate only a few milliseconds of dispersion in the volley of action potentials carried by the CA3 axons providing input to a specific dendritic branch. Magee and colleagues proposed that this very narrow window of opportunity for spike generation in oblique dendrites could allow CA1 neurons to respond selectively – or at least differently – to the highly synchronized inputs that occur during hippocampal sharp waves and high-frequency ripples as opposed to the more loosely synchronized inputs riding on theta waves (Gasparini and Magee, 2006; Losonczy and Magee, 2006). This hypothesis is important, since it points to a concrete biophysical mechanism for distinguishing between two major hippocampal states at the level of CA1 dendrites. The hypothesis also makes the interesting and somewhat unintuitive prediction that when an animal is actively involved in exploring its environment and engaged in hippocampus-dependent navigation or episodic memory tasks, the principal neurons of the CA1 region are functioning as essentially linear devices (see also Cash and Yuste, 1999).
An alternative possibility, and one that we explore in this work, is that the single-pulse stimulus protocol used in Losonczy and Magee (2006) is relatively ineffective at activating NMDA receptor-mediated conductances within the post-synaptic compartment, in comparison to the short bursts of spikes typical of Schaffer collateral activation in vivo (Ranck, 1973; Suzuki and Smith, 1985; Mizuseki et al., 2009). While it is the case that CA3 neurons discharge at very low frequencies on average (1–3 Hz; Csicsvari et al., 2000; Frerking et al., 2005), during the theta rhythm they typically fire bursts of 1–4 spikes (2.4 spikes per burst on average) with inter-spike-intervals (ISIs) ranging from 3 to 7 ms (Ranck, 1973; Tropp-Sneider et al., 2006; Mizuseki et al., 2009). This type of firing pattern is significant since, beyond the opportunity for classical temporal summation afforded by a train of inputs, glutamate binding kinetics lead NMDA conductances to increase substantially in response to brief trains compared to single stimuli (Mainen et al., 1999; Umemiya et al., 1999; Mcallister and Stevens, 2000; Oertner et al., 2002; Nimchinsky et al., 2004; Popescu et al., 2004; Polsky et al., 2009). Functionally, the increased NMDA conductance resulting from a train of inputs – even just two glutamate releases – can lead to a marked enhancement of the supralinear interaction between synaptic inputs (see comparison of summation of single-pulse vs. double-pulse inputs in Polsky et al., 2004 and for different inter-stimulus-intervals in Polsky et al., 2009). Given that NMDA currents can produce regenerative spike-like depolarizations lasting many tens of milliseconds, easily outlasting the burst of spikes that triggered it, we hypothesized that stronger, longer lasting NMDA channel activation evoked by multi-pulse stimuli might significantly widen the very narrow time window reported by Magee and colleagues during which supralinear summation of synaptic inputs can occur. If this is the case, the reduced demands for input synchronization afforded by stronger NMDA channel activation could allow dendritic spikes to routinely occur in all major hippocampal states.
To investigate these issues, we used a detailed compartmental model of a CA1 pyramidal neuron based on one described previously (Poirazi et al., 2003a). The model was adapted to five different reconstructed morphologies for this study (Figure 1), and slightly modified to fit the experimental data of Losonczy and Magee (2006), and to incorporate evidence in pyramidal neurons for the non-saturation of NMDA receptor-mediated conductances by single glutamate pulses. We first replicate the main findings of Losonczy and Magee (2006), including the very brief window for non-linear integration using single-pulse stimuli. We then show that double-pulse stimuli increase a CA1 pyramidal neuron’s tolerance for input asynchrony by at least an order of magnitude.
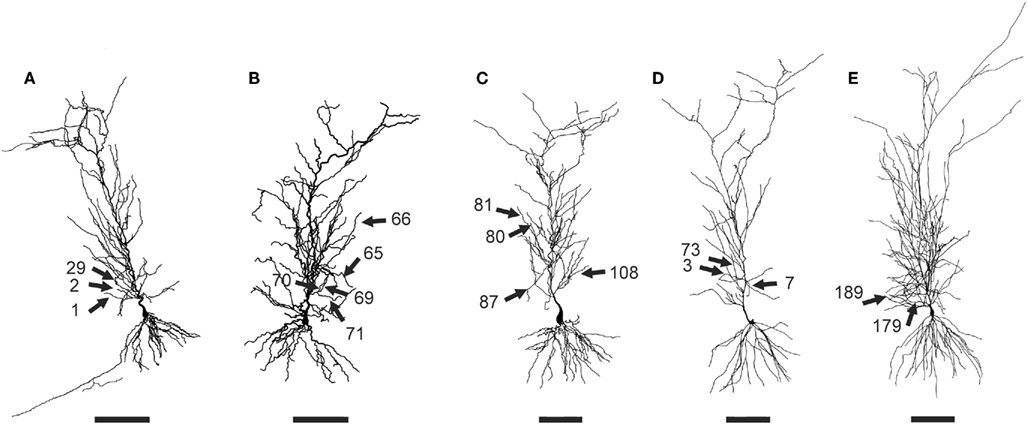
Figure 1. Morphological properties of CA1 pyramidal neurons used in the present work. (A) n123, (B) n125, (C) n128, (D) n129, (E) n130. The cell morphologies were downloaded from the Duke-Southampton archive of neuronal morphology at http://neuron.duke.edu. The bar is 100 μm. The 17 dendrites used for calculating average responses are indicated with arrows.
Materials and Methods
The multi-compartmental model used in this work is based on the previously described model in Poirazi et al. (2003a) and was adapted here for each CA1 pyramidal neuron morphology (Figure 1). The model was implemented in NEURON (Hines and Carnevale, 1997) with a fixed time step of 0.1 ms.
Model Morphologies
Five young CA1 pyramidal neuron morphologies from the Duke–Southampton archive of neuronal morphology at the NEURON database (http://neuron.duke.edu.) were adapted to be used in this work (Figure 1). The neurons are the typical CA1 cells from in vitro hippocampal slice recordings and 3D digitized with Neurolucida (MicroBrightField, Inc.,) from 2-month-old Fischer 355 rats (Pyapali et al., 1998) killed with an overdose of halothane. Their morphological properties, area, and number of sections, are shown in the Table 1. The branch diameter was increased by a factor of 1.25 for every cell, to compensate for possible shrinkage effects and to reproduce the experimental unitary EPSP at the soma. The branches selected were between ∼50 and ∼150 μm from the soma and with a unitary EPSP amplitude close to 1 mV at the soma, in accordance with the experimental procedures of Losonczy and Magee (2006). The selected dendrites (14.5% of all dendrites) and their morphological properties are shown in the Table 2.

Table 1. Morphological properties of the five CA1 pyramidal cells: area in μm2 and number of sections in parenthesis.
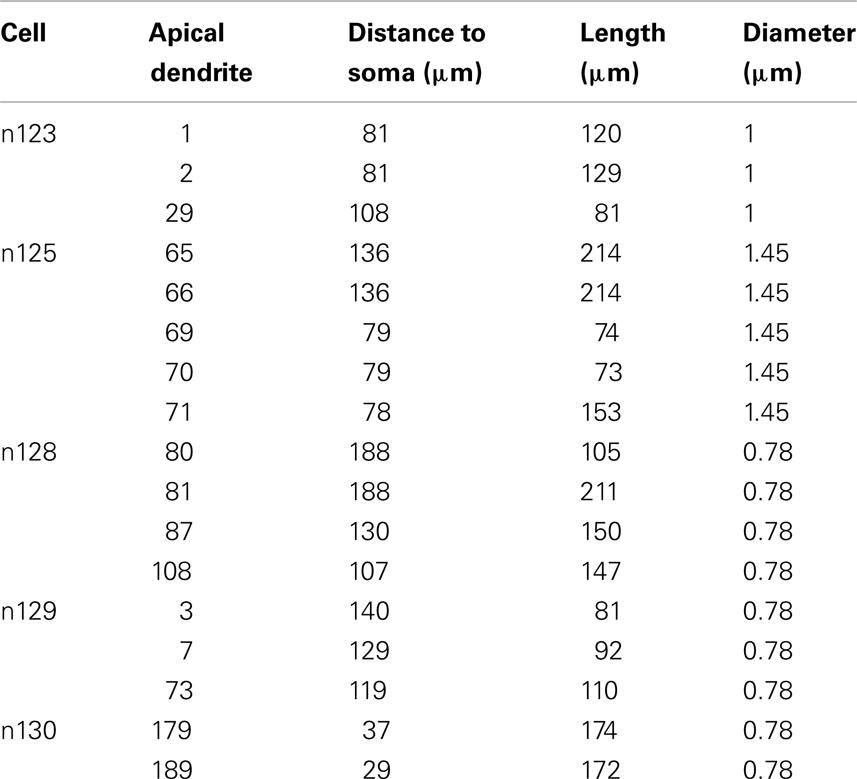
Table 2. Morphological properties of apical dendrites used in this study.
Passive Properties
The membrane capacitance, Cm, and the internal resistivity, Ra, were 1 μF/cm2 and 50 Ω-cm, respectively, for all sections except the apical trunk, where Ra decreased sigmoidally from the soma to the tuft:
where x is the perpendicular distance to the soma. In addition, the membrane resistance, Rm, was 200 KΩ-cm2 at the soma and it decreased sigmoidally over the apical trunk:
The input resistances, Rin measured with injection of current pulses at the soma for neurons n123, n125, n128, n129, n130 were 62.4, 31.8, 63.4, 127.4, and 93.0 MΩ, respectively.
Active Properties
The following active mechanisms were inserted in the model: a Hodgkin–Huxley (HH) sodium conductance, a sodium persistent conductance (nap), a potassium delayed rectifier conductance (kdir), proximal and apical K-A conductances (kap/kad), a slow calcium-dependent potassium conductance (kahp), a muscarinic potassium conductance (km), a BK-type calcium-dependent potassium conductance (kct), a T-type calcium conductance (cat), an N-type calcium conductance (can), two L-type calcium conductances (cal, calH in distal dendrites to account for distally restricted initiation of calcium spikes), an R-type calcium conductance (car), and an H-type conductance (h). Table 3 shows the distribution and maximal value of each conductance along the various sections of the model cells. The steady-state activation/inactivation and time constants, as well as the ionic current equations of all mechanisms are shown in Table 4.
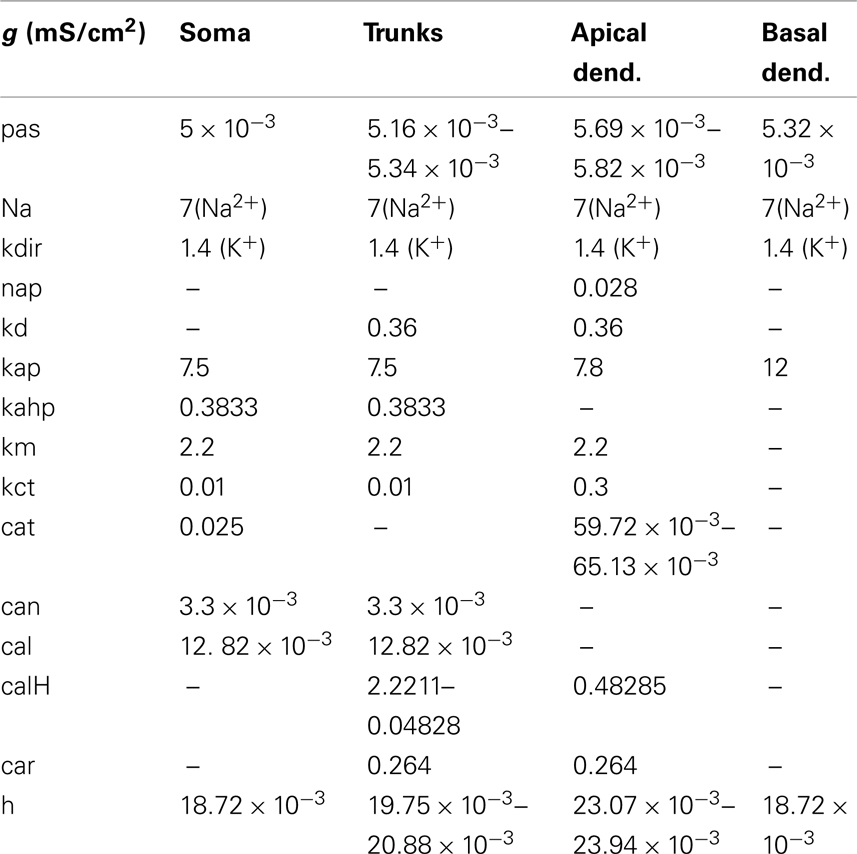
Table 3. Conductance values for the various membrane mechanisms.
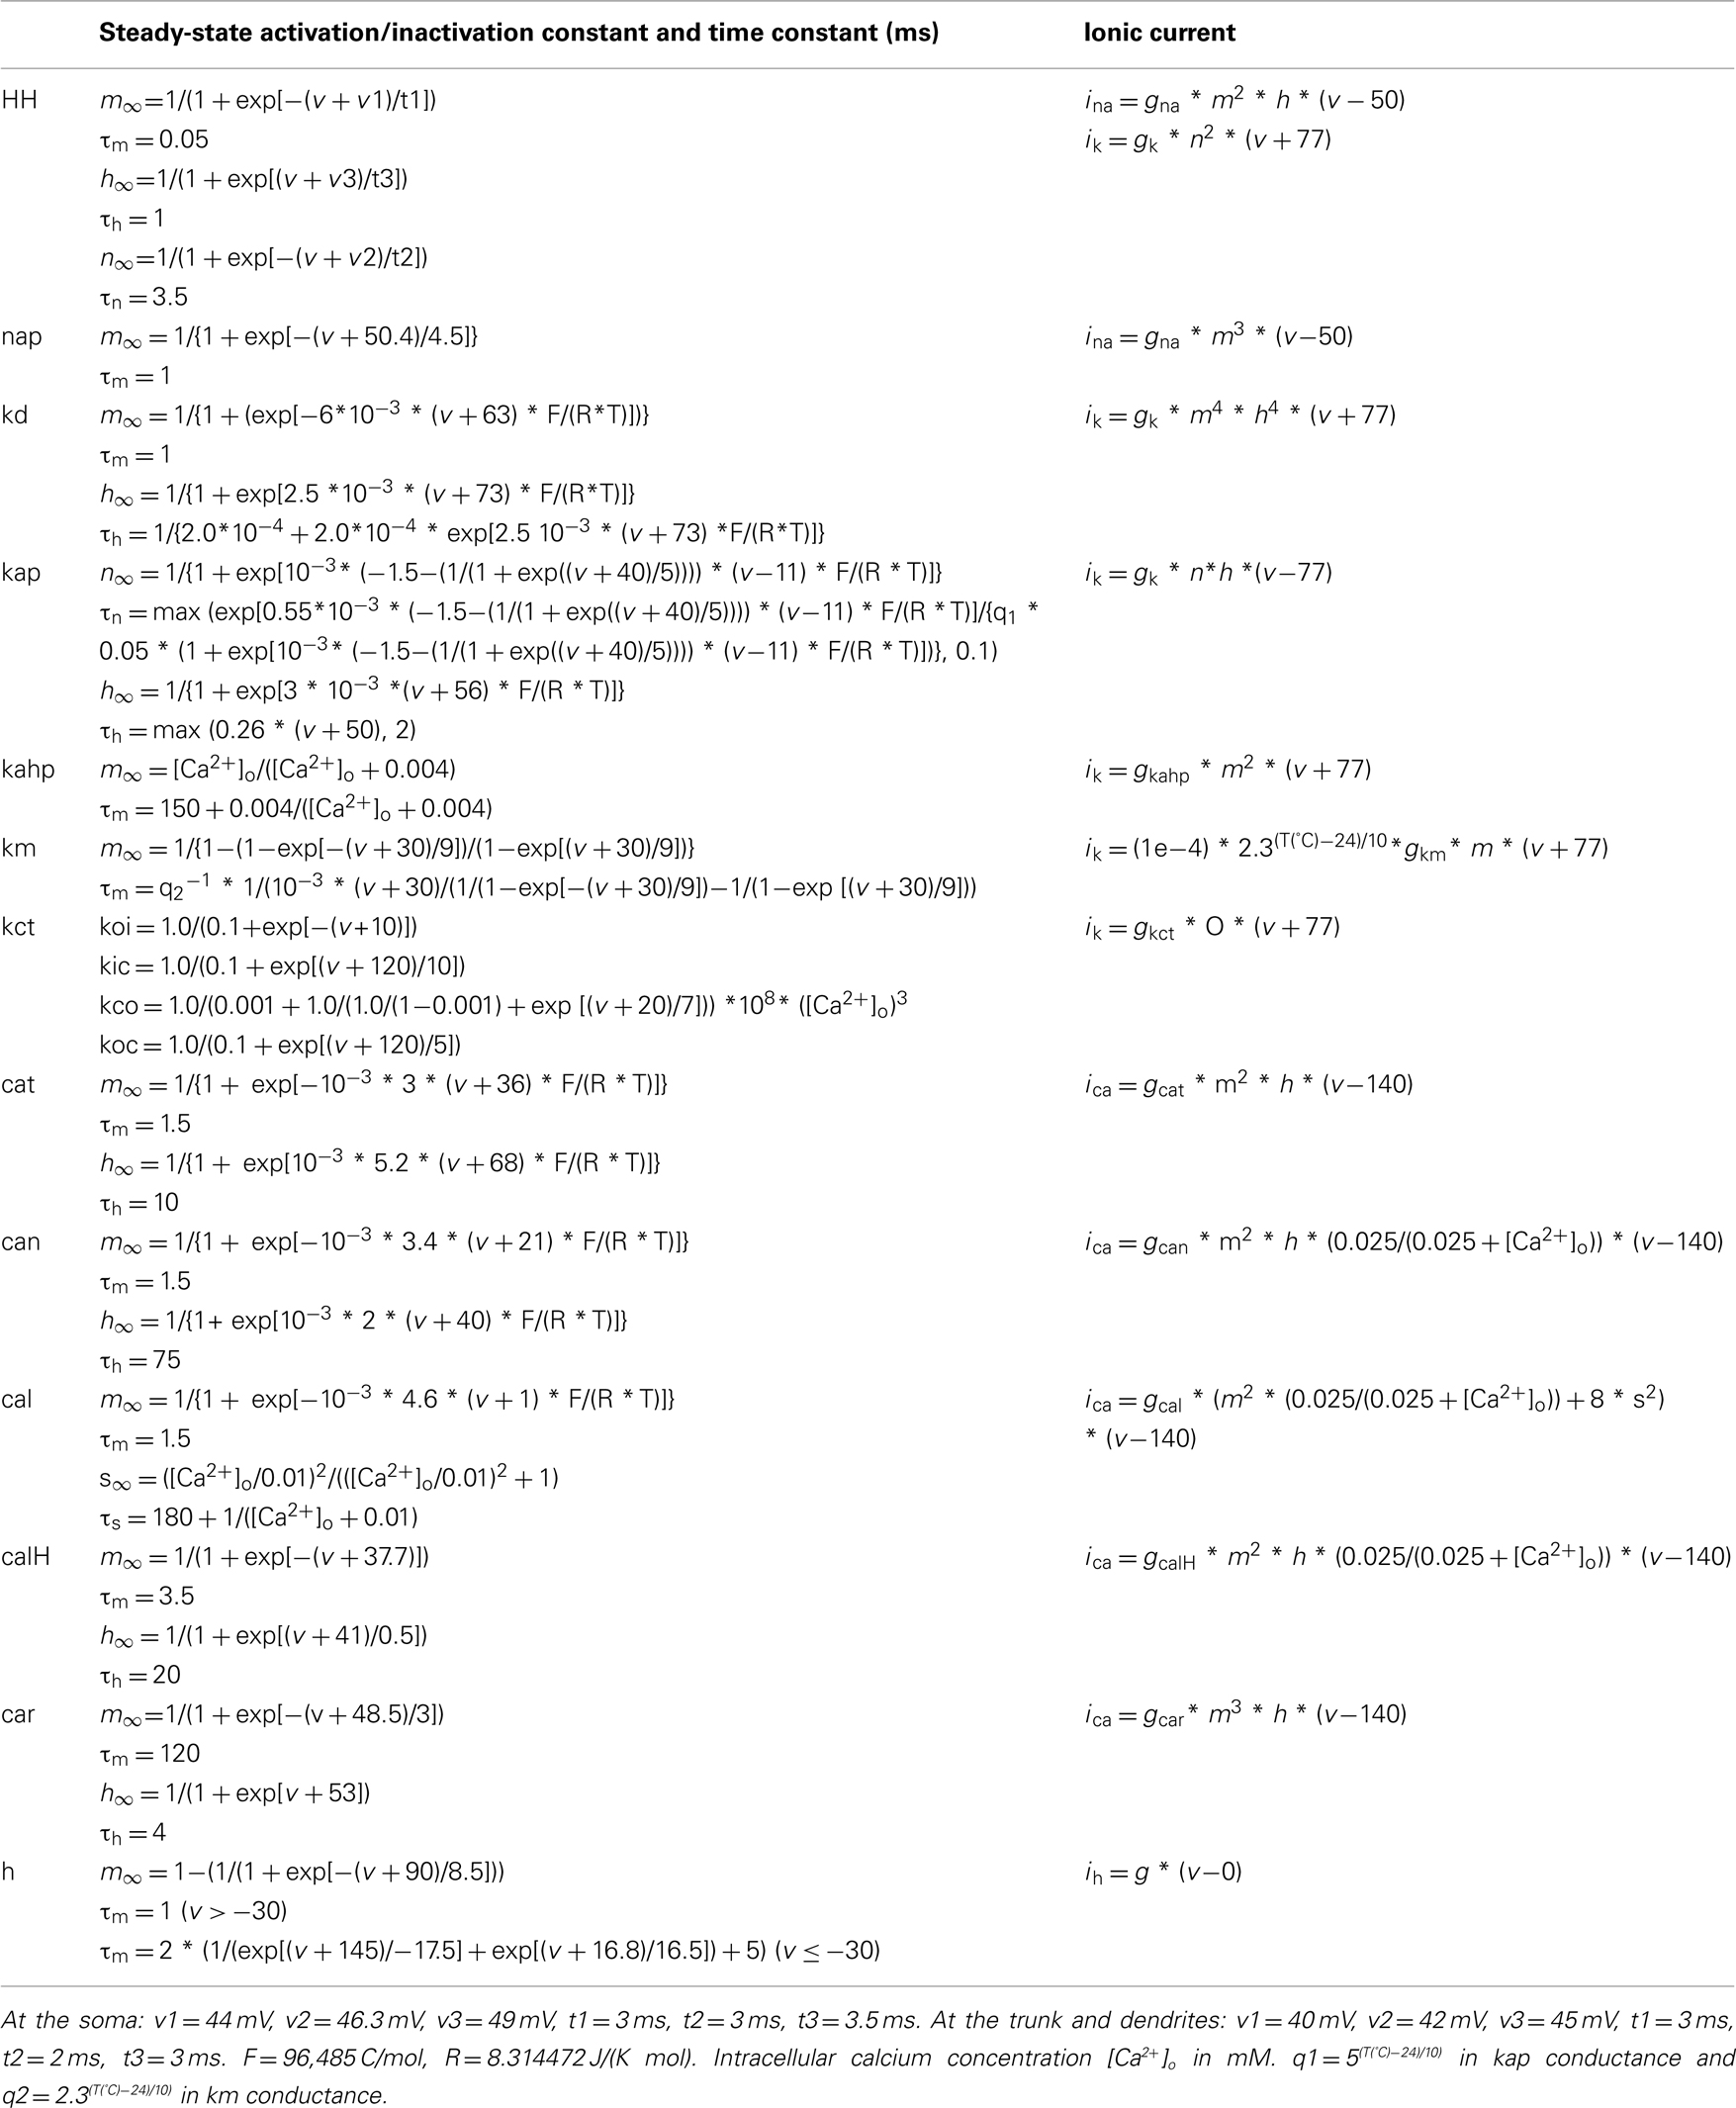
Table 4. Conductance kinetic parameters.
A calcium extrusion mechanism was also inserted in all sections except the axon. The calcium pump was modeled by a simple decay differential equation as shown below:
where d is the layer depth where the calcium concentration is calculated, in this case d = 0.1 μm of the spine diameter and τ = 200 ms. The calcium concentration at rest was set to [Ca]∞ = 100 pM.
Synapses were located beyond 40 μm from the branch points at 2 μm intervals, in accordance with Losonczy and Magee (2006) and they included both AMPA and NMDA conductances. The AMPA and NMDA conductances were modeled with a two-state kinetic scheme (Destexhe et al., 1998). When a presynaptic potential generates a glutamate pulse of 1 mM, the rising phases for the AMPA and NMDA currents were 0.3 and 1 ms, respectively. The receptor kinetic equation is
where m represent the fraction of receptors in the open estate, α (0.94 ms−1 mM−1 AMPA, 2 ms−1 mM−1 NMDA) and β (0.3 ms−1 AMPA, 0.027 ms−1 NMDA) are the forward and backward rate constants, respectively. T is the glutamate concentration in the synaptic cleft. The synaptic current is given by
where B(V) is a function that represents the voltage dependence of the NMDA receptor
where [Mg]o = 1 mM is used to implement the voltage-dependent magnesium block. Both reversal potentials, EAMPA and ENMDA were 0 mV.
The maximal AMPA conductance for each synapse was tuned to generate a local (dendritic) 5 mV depolarization upon a single-pulse stimulation with both an AMPA and an NMDA mechanism. The respective NMDA conductance was derived as a function of the AMPA conductance:

where r is the NMDA/AMPA ratio (r = 0.396). Note that these values represent the maximum single channel conductances and are not proportional to the total amount of AMPA/NMDA current. To ensure that the ratio of AMPA/NMDA current in our model is consistent with experimentally reported values for apical dendrites of CA1 pyramidal neurons (Béïque et al., 2006; McDermott et al., 2006) we measured the AMPA/NMDA ratio as described in McDermott et al. (2006): the cell was first clamped at the resting membrane potential using a somatic and a dendritic clamping electrode, in the presence of K+, Na+, and Ca++ channel blockers, and the absence of Mg++. A number of 15 synapses were stimulated with a single synchronous pulse and the current was measured at the dendritic clamping electrode. This procedure was repeated with the NMDA receptors blocked (100%) and the NMDA component was estimated by subtracting the two traces. The ratio of AMPA/NMDA current using this approach was 0.75 ± 0.01 (n = 17), which is similar to reported experimental values for apical dendrites of CA1 pyramidal neurons (Béïque et al., 2006; McDermott et al., 2006). A ratio of 1.1 ± 0.25 (n = 5) was reported by Béïque et al. (2006) while a ratio of 2 ± 0.04 (n = 19), was reported by McDermott et al. (2006), although the approaches used to measure these ratios differ in the two studies. Due to the lack of precise measurements for AMPA/NMDA current ratios in apical oblique dendrites of CA1 pyramidal neurons, a larger NMDA component than the one reported in the above studies was needed in order to replicate the slow component in the experimental traces of Losonczy and Magee (2006) shown in Figure 2. This discrepancy could also be explained by the fact that the AMPA/NMDA ratios in the above studies were obtained at room temperature (22°C) while the Losonczy and Magee (2006) studies discussed here were done near body temperature (35°C). Recent evidence shows that the NMDA current amplitude decreases significantly (20–40% reduction) when the temperature drops from 35 to 25°C (Cais et al., 2008), which could partially explain why a larger NMDA conductance was needed in order to replicate the experimental data of Losonczy and Magee (2006).
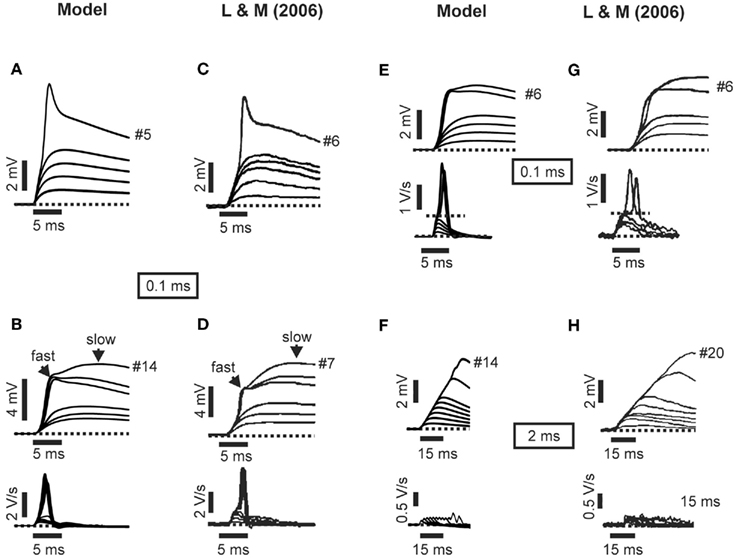
Figure 2. Model and experimental recordings produced by single stimulation of synaptic inputs in apical oblique dendrites. (A) Representative example of a model somatic EPSP evoked by stimulating an increasing number of synapses (1–5) with an inter-burst delay (IBD) of 0.1 ms in an apical oblique dendrite. The trace is very similar to the respective experimental data shown in part (C). (B) Another example of a model somatic EPSP (top) and the associated first temporal derivative (bottom) evoked by stimulating 1–14 synapses with an IBD of 0.1 ms in an apical oblique dendrite. The traces should be compared to the respective experimental data shown in part (D). (E) Similar to B, generated by stimulating a different dendrite in the model cells. To be compared with experimental traces in part (G). (F) Representative example of a model somatic EPSP (top) and the associated first temporal derivative (bottom) evoked by stimulating 1–14 synapses with an IBD of 2 ms in an apical oblique dendrite. The traces should be compared to the respective experimental data shown in part (H). Experimental data were adapted with permission from Losonczy and Magee (2006).
Synaptic Stimulation
In all experiments reported in this work, synchronous synaptic stimulation refers to a sequential stimulation of synapses with a 0.1-ms interval between consecutive stimuli. This was implemented in order to match the experimental protocol used in Losonczy and Magee (2006). In addition, the adjacent synapse was always activated next, starting from the synapse nearest to the branch point.
The Double-Pulse Stimulation Protocol
For the double-pulse stimulation protocol, we simulated two co-localized, equal-sized sets of synapses. The first set was activated with both pulses while the second set was activated only on the second pulse. The first set of synapses consisted of both AMPA and NMDA receptors while the second set of synapses contained only NMDA receptors. For the second set, synapses contained only NMDA receptors whose total conductance was given as a function of the ISI between the two pulses:
This approach was used to model the experimental findings of Mainen et al. (1999), showing that in synapses of CA1 pyramidal neurons the NMDA-dependent current increases in response to multiple stimuli. Specifically, the NMDA current was found to nearly double when a second pulse was delivered within 10 ms (Mainen et al., 1999). A similar increase in basal dendrites of CA1 pyramidal neurons (Ariav et al., 2003) was found to fade for longer intervals, reaching baseline when the second pulse arrived after 100 ms (Jackie Schiller, personal communication). The above formula resulted in a very similar, time-dependent increase in the NMDA current produced by two-pulse stimuli in the model cell.
The amount of NMDA current produced by two pulses was estimated using the same procedure utilized to measure the AMPA/NMDA currents. When 15 synapses were stimulated with an ISI of 10 or 20 ms, the NMDA current ratio between the second and the first pulses was 1.96 ± 0.06 (n = 17) and 1.87 ± 0.05, respectively. These values are in close agreement with the reported experimental data of Mainen et al. (1999).
When the double-pulse stimulation protocol was used to activate synapses sequentially, the time interval between successive stimuli – termed Inter-burst Delay (IBD) – was defined as the delay between the first spike of the burst delivered to the previous synapse and the first spike of the burst delivered to the current synapse (see Figure 6A for a graphical illustration). This definition of IBD results in the creation of artificial coincidences in the data. For example, when five synapses are activated with a burst of two pulses separated by 10 ms (ISI = 10) and a between-synapse delay (IBD) of 10 ms, then two synapses are activated synchronously at 10, 20, 30, and 40 ms. Similarly, when five synapses are activated with an ISI = 10 ms and an IBD = 5 ms, then two synapses are activated synchronously at 10, 15, and 20 ms. In all cases, only two synapses fire coincidentally.
Definition of Linear vs. Non-Linear Integration
Integration of synaptic responses was considered linear if the arithmetic sum of individual EPSPs produced when stimulating each synapse independently (expected response) had a peak that was equal to the peak of the EPSP produced by the combined activation of all stimulated synapses (actual response). Integration was considered non-linear if the actual response was different from the expected response. Different dendrites generated different expected vs. actual EPSP curves because local dendritic spikes were generated in response to different numbers of activated synapses. Thus, in order to obtain an expected vs. actual response curve that represents the “average” dendritic branch response, we first needed to align all dendrites to a common reference point.
Threshold Alignment Procedure
To plot the model’s summary responses (Figure 4), data from each dendrite were grouped as described by Losonczy and Magee (2006). Specifically, each dendritic response was first aligned to its branch-specific threshold and an average was estimated on all aligned responses. The alignment threshold for a given branch was defined as the minimum number (n) of activated synapses that are necessary in order to have a supralinear jump in the expected vs. actual EPSP curve. This number, n, was then relabeled zero in all branches, enabling the alignment of all responses with respect to their supralinear jump (always located at n = 0). The same procedure was followed for both single and double-pulse stimuli. In all figures where average results are showed, the results were calculated from all five morphologies, by pulling together all stimulated branches and calculating the average response.
All simulations were run within the NEURON simulation environment (Hines and Carnevale, 1997) and data was analyzed using the Origin (OriginLab Corporation, Northampton, MA, USA) and Igor Pro 5 (WaveMetrics, Inc., Lake Oswego, OR, USA) software packages.
Results
Simulation experiments were carried out in 17 apical oblique dendrites located 50–150 μm from the cell body in the five different CA1 pyramidal cell morphologies shown in Figure 1. Branches were selected according to the size of the somatic EPSP generated by the stimulation of a single synapse located at various distances along the branch. To ensure comparability with experimental recordings only branches resulting in somatic EPSPs similar to the ones reported by Losonczy and Magee (2006) were used (see Materials and Methods for details). Model responses were generated using the same stimulation protocol as described in Losonczy and Magee (2006): for each dendrite, an increasing number of synapses (from 1 to 15) stimulated each in sequence with a fixed IBD (0.1, 2, 3, 4, or 5 ms). For the 0.1-ms interval, the input was called synchronous while for larger intervals it was termed asynchronous.
Model responses to single-pulse inputs closely matched those reported by Losonczy and Magee (2006). As shown in Figure 2, somatic traces generated by model cells for both synchronous (Figures 2A,B,E) and asynchronous (Figure 2F) cases closely resembled the respective experimental recordings (Figures 2C,D,H). In cases of synchronous synaptic stimulation, responses grew linearly as the first several synapses were added, followed by a distinct supralinear jump at the point where the local spike threshold was crossed (Figures 2A,B,E). In contrast, asynchronous inputs failed (in most cases) to produce distinct dendritic spikes (Figure 2F) and gave rise to linearly increasing responses over the whole range of stimulus intensities (Figure 4A, open squares). Note that linear integration was more pronounced as the temporal separation of synapses increased from 2 to 5 ms. For a delay of 2 ms a small supralinearity was occasionally observed, although for a larger number of synapses than in the synchronous case, while for delays larger than 3 ms the responses were always combined in a linear manner (see Figure 3). Figure 4 shows summary plots for both synchronous (Figure 4A, filled squares) and asynchronous (Figure 4A, open squares) inputs. Model responses for both cases closely match the experimental findings shown in Figure 4B. Specifically, the average peak EPSP at the dendritic spike threshold was 3.08 ± 0.26 mV (n = 17) at the cell body of the model (Figure 4A) vs. 3.4 ± 0.2 mV (n = 92) in the experimental data (Figure 4B). On average, the amount of somatic depolarization at this threshold in the model was 146 ± 6% (n = 17) of the expected arithmetic sum of the individual synaptic inputs, compared to 142 ± 9% (n = 92) in the experimental data. For asynchronous inputs, these values were 100 ± 15% (n = 17) in the model and 104 ± 8% (n = 23) in the data. The average number of synapses needed to generate a local dendritic spike was higher (7–10) in the experimental situation (n = 92) than in the model (5–6), suggesting that model synapses were somewhat stronger than their biological counterparts. The expected EPSP in all cases was computed as the arithmetic sum of the individual synaptic responses (at each time point); the peak of the expected EPSP was used as the linear prediction (corresponding to the 100% mark on the graphs in Figures 6C–E). For the asynchronous cases, responses for all 17 branches at four different inter-synapse delays sampled uniformly between 2 and 5 ms were averaged, approximating the procedure used by Losonczy and Magee (2006).
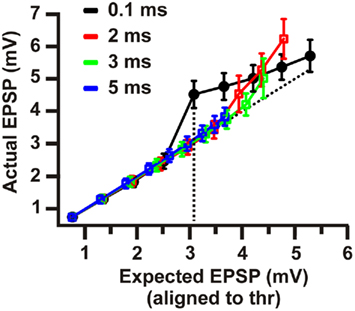
Figure 3. Model summary plot of mean input–output curves for threshold-aligned peak EPSP amplitudes (mean ± SEM) for four different inter-synapse delays. Supralinear amplification is clearly evident for synchronous inputs (black) and attenuates rapidly as inputs are activated with increasing temporal dispersion (red, green, blue).
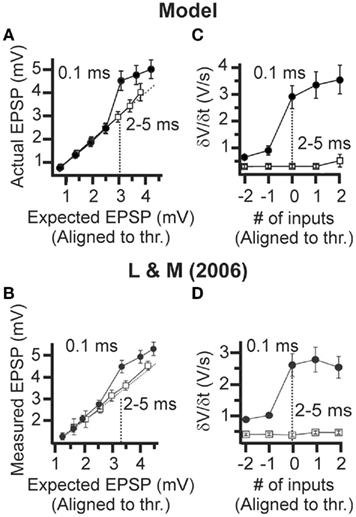
Figure 4. Dendritic integration of single-pulse stimuli in CA1 pyramidal neurons. (A) Model summary plot of mean input–output curves for threshold-aligned peak EPSP amplitudes (mean ± SEM). See Section “Materials and Methods” for an explanation of the threshold alignment procedure. A supralinear amplification was observed in the case of the synchronous synaptic stimulation (filled circle, IBD = 0.1 ms) with respect to the expected mean threshold EPSP of 3.1 mV (n = 17), while the input–output curve for asynchronous synaptic stimulation (empty square, IBD = 2–5 ms) was linear, (n = 17). The model results are in good agreement with the experimental data from Losonczy and Magee (2006) shown in (B). (B) Same as A with experimental data. The figure was adapted with permission from Losonczy and Magee (2006). A supralinear amplification was observed with respect to the expected mean threshold EPSP of 3.4 mV (n = 92), while the input–output curve for 2–5 ms was linear (n = 23). (C) Model summary plot of peak δV/δt amplitude (mean ± SEM) showing a sharp increase at threshold for the 0.1-ms inter-synapse interval (n = 17) but not in the 2- to 5-ms intervals (n = 17). The model results are again in good agreement with the Losonczy and Magee (2006) data shown in (D). (D) Same as C with experimental data. Figure was adapted with permission from Losonczy and Magee (2006). A sharp increase is evident at threshold for the 0.1-ms inter-synapse interval but not for 2- to 5-ms interval recordings.
The generation of a dendritic spike is associated with a sharp increase in the slope of the somatic voltage responses δV/δt. A summary plot shows δV/δt as a function of input intensity (Figure 4C), aligned to the threshold stimulus intensity for each of the 17 branches (same normalization procedure as was used in Losonczy and Magee, 2006). The same threshold value was used to plot both the synchronous and asynchronous data in Figure 4C. The mean peak δV/δt amplitude at threshold for synchronous inputs was 2.9 ± 0.4 V/s (n = 17) in the model (Figure 4C, filled circles), and 2.6 ± 0.4 V/s (n = 92) in the data (Figure 4D, filled circles). The respective value for asynchronous inputs was 0.30 ± 0.06 V/s in the model (Figure 4C, open squares), closely matching the experimental data (Figure 4D, open squares; average values for asynchronous inputs were not explicitly mentioned in the paper).
Having established that our model replicates the basic features of the Losonczy and Magee (2006) single-pulse data, we next considered the case of double-pulse stimulation. Several studies of hippocampal neurons indicate that a single glutamate vesicle is not sufficient to saturate all available NMDA binding sites (Mainen et al., 1999; Mcallister and Stevens, 2000; Nimchinsky et al., 2004), such that multiple glutamate release events triggered by a burst of spikes can lead to a significant increase in the post-synaptic NMDA conductance. Such an increase is consistent with the observation in both basal and apical oblique dendrites of neocortical pyramidal cells that double-pulse inputs lead to stronger NMDA-dependent local spikes than single-pulse inputs (Polsky et al., 2004) or multiple inputs separated by large inter-stimulus-intervals (Polsky et al., 2009). Furthermore, in the basal dendrites of hippocampal pyramidal neurons, both the fast (Na+) and slow (NMDA-dependent) component of local dendritic spikes generated by double-pulse inputs show larger, sharper non-linear transitions at threshold (Ariav et al., 2003) than the single-pulse-triggered d-spikes reported by Losonczy and Magee (2006). Though this comparison is imperfect given that the two data sets were taken from different regions of the dendritic tree, it is worth nothing that in layer 5 pyramidal cells, basal and apical oblique dendrites behave equivalently in this respect (Larkum et al., 2009).
We modeled the effect of double-pulse inputs on non-saturated NMDA receptors by activating an additional parallel NMDA conductance at each stimulated synapse upon the arrival of the second pulse (see Materials and Methods for details). Mainen et al. (1999) reported that the peak EPSC in response to synaptic activation of a single dendritic spine in CA1 pyramidal neurons grew 80 ± 8% with a second release event. In pilot experiments in which we fitted our voltage responses to double-pulse-evoked NMDA spike traces from basal dendrites of both CA1 and layer 5 pyramidal cells (Schiller et al., 2000; Ariav et al., 2003; Polsky et al., 2004), we found that somewhat larger second-pulse NMDA facilitation values led to the best fits – around 130%. Though the latter measurement involves actual NMDA-dependent regenerative voltage responses, and is thus closer to the functional question we are addressing, we nonetheless biased our model in favor of the more direct measurements from SC synapses reported by Mainen et al. (1999) and set the second-pulse NMDA conductance to a value that yielded a 95% increase in the NMDA EPSC peak on the second pulse. In control experiments, we verified that variations within this range of uncertainty had only a slight effect on the outcome. Figure 5A shows the NMDA current generated by stimulating dendrites in the five different cell morphologies, for NMDA conductance values leading to 80, 95, and 130% increase in the NMDA EPSC peak on the second pulse, while Figure 5B shows the respective EPSP traces from one representative dendrite for different IBDs. As is evident in the figure, EPSP traces are only mildly affected by changes in the NMDA current within the abovementioned range.
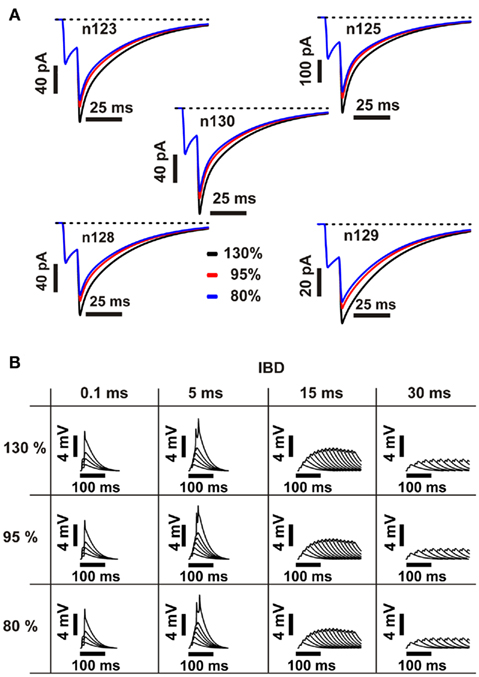
Figure 5. Effect of second-pulse NMDA current magnitude on post-synaptic responses. (A) Black, red, and blue traces correspond to NMDA EPSCs in one representative dendrite of each of the five cell morphologies, where the maximum value of the second peak is 130, 95, and 80% bigger than the first peak, respectively. The number of activated synapses is 15, the inter-burst delay (IBD) is 0.1 ms, and the inter-stimulus interval (ISI) is 10 ms. (B) Corresponding EPSPs generated by stimulating a representative dendrite in n123 using the above NMDA current values, for increasing number of synapses and inter-burst values. EPSPs are not significantly affected by changes in the NMDA current amplitude.
In vivo recordings in awake behaving animals show that during active exploration, CA1 (Harris et al., 2001; Mizuseki et al., 2009) as well as CA3 (Suzuki and Smith, 1985; Mizuseki et al., 2009) cells commonly fire short bursts with ISIs in the 5- to 30-ms range. We thus measured the time window for supralinear summation of synaptic inputs using double-pulse inputs with different ISIs and IBDs (i.e., between-synapse delay in delivering the burst, IBDs; Figure 6). Adopting an intermediate value of 10 ms (corresponding to a 100-Hz burst), four cases of expected (red) vs. actual (black) voltage responses are shown for IBD’s of 0.1, 5, 15, and 30 ms (Figure 6B). In each case, the number of synapses (indicated by the small # next to each point) that maximized the response supralinearity was selected, defined as the ratio of the “facilitating NMDA” (shown as “actual” in Figure 6) and predicted (“expected”) response peaks. Supralinearity ratios for IBDs and ISIs ranging from 0.1 to 30 ms are shown in Figure 6C while Figure 6D (black squares) shows the same ratios for a fixed ISI of 10 ms. A key observation in Figure 6D is that the supralinearity score remains above 150% for IBD’s ranging from 0.1 ms up to 13 ms. For longer IBD’s, input spikes arrived over an extended window. For example, the maximum supralinearity for a 13-ms IBD occurred when 11 synapses were stimulated sequentially. In this case, the two-spike bursts (ISI = 10 ms) delivered to 11 synapses at 13 ms intervals were spread over a total window of 13 × 10 = 130 ms. This not-very-synchronous input pattern generated the same supralinearity score (150%) as five to six synapses stimulated once inside a 6-ms window (Figures 2A,B,D and 4A). Thus, when CA3 inputs arrive in the form of two-spike bursts, supralinear integration appears possible even when inputs are spread over an interval that is more than an order of magnitude wider than that observed for single-pulse inputs.
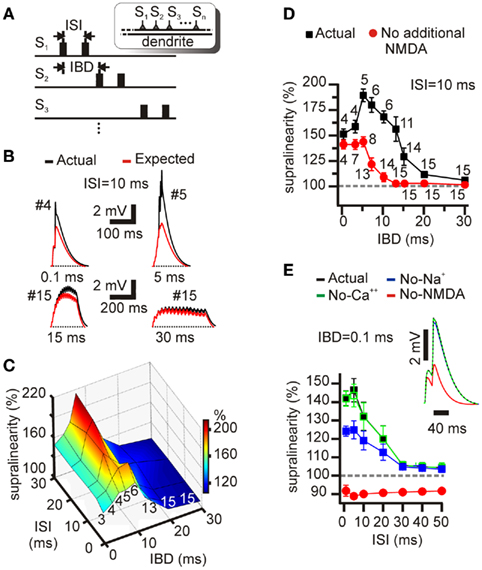
Figure 6. Supralinear summation of within-branch inputs stimulated with double pulses. (A) Schematic illustration of inter-burst delay (IBD) and inter-stimulus interval (ISI) used to stimulate synapses in the double-pulse simulation experiments. (B) Examples of four somatic EPSPs where the number of stimulated synapses is optimized to induce the peak supralinearity in response to double-pulse stimulation with a fixed ISI of 10 ms and four different inter-synapse delays: 0.1, 5, 15, and 30 ms. Traces shown in each panel correspond to actual (black) and expected (red) cases. The symbol # indicates the total number of stimulated synapses. The supralinearity is larger when five synapses are stimulated with a 5-ms delay than when four synapses are stimulated nearly simultaneously (0.1 ms delay). (C) Percent supralinearity in response to double-pulse stimulation within a branch. The number of synapses used was different for each branch, selected to maximize the supralinearity score for every IBD/ISI combination (i.e., three synapses were used when synapses were stimulated with an IBD of 0.1 ms and an ISI of 1 ms, resulting in a supralinearity of 142 ± 4%). The numbers along the front edge of the plot represent the average number of stimulated synapses for every synapse delay calculated using the mean synapse number used for ISI’s of 1, 5, 10, 20, and 30 ms. Peak supralinearity drops steeply for synapse delays larger than 15 ms. (D) Black squares: Summary graph showing the peak supralinearity achieved by the stimulation of synapses with a fixed ISI of 10 ms and varying inter-synapse delays. Small numbers again indicate mean number of stimulated synapses. Note that as IBD increases, more synapses are needed to obtain the maximum supralinearity. However, using more than 15 synapses led to no further change in the peak supralinearity. Red circles: Same graph under conditions where the second pulse elicited the same peak conductance as the first (no additional NMDA component). (E) Summary graph showing the effect of various blockers on the supralinear summation of double-pulse inputs. A total of three synapses located within a dendrite were stimulated with an IBD of 0.1 ms and an ISI ranging from 1 to 50 ms. Blockade of Ca++ channels by 90% (green open squares) did not affect synaptic integration; blockade of Na+ channels by 90% (blue filled squares) reduced the magnitude of the supralinearity; blockade of NMDA channels by 90% (red filled circles) resulted in sublinear integration.
It should be noted that the definition of IBD (delay between the first spike of the burst delivered to the previous synapse and the first spike of the burst delivered to the current synapse) creates artificial coincidences in the stimulated synapses. For example, for an ISI of 10 ms and an IBD of 10 ms, when stimulating six synapses, there are five coincident activations of two of the synapses at time points 10, 20, 30, 40, and 50 ms. However, these coincidences cannot explain the observed non-linearities for several reasons. First, for an ISI = 10 ms, and IBDs larger than 10 ms, there are no coincident synaptic activations and yet a large non-linearity effect is still seen in Figure 6D. Second, for an ISI = 10 ms and an IBD = 5 ms, there are only three coincident activations of two synapses (at 10, 15, and 20 ms) and yet the supralinearity is larger than the ISI = IBD = 10 ms case where there are five coincidences. Third, for an ISI = 10 ms and an IBD = 7 ms, there are no coincident activations and yet the supralinearity is larger than the ISI = IBD = 10 ms case but smaller than the ISI = 10 ms, IBD = 5 ms case. Finally, for ISI = 10 ms and IBD = 0.1 ms (and for any other ISI values), all synapses are stimulated simultaneously but the observed supralinearity for IBDs up to 13 ms (for which coincidences are much fewer) is larger (Figure 6D). Thus, the supralinearity observed when synapses are asynchronously activated with double pulses does not arise from the accidental coincident activation of a subset of the stimulated synapses.
We next assessed how much the broadening of the window of supralinear interaction depended on conventional temporal summation, in the absence of NMDA conductance paired-pulse facilitation: we ran simulations in which the second pulse elicited the same peak conductance as the first. The number of participating synapses was again chosen to maximize the supralinearity on a case-by-case basis. The window of strong supralinear interaction was considerably narrowed compared to the facilitating NMDA condition, though it was still longer than for single pulses (Figure 6D, red circles).
To investigate the biophysical mechanisms underlying supralinear summation of double-pulse inputs in our model, we measured supralinearity scores in the presence of various channel blockers. In these simulations, three synapses on an oblique dendrite were stimulated nearly simultaneously (IBD of 0.1 ms), with burst ISI’s ranging from 1 to 50 ms (Figure 6E). Under control conditions, supralinear integration was evident for ISI’s less than 20 ms, becoming nearly linear beyond 30 ms. Similar results were obtained by Polsky et al. (2004) in basal dendrites of layer 5 pyramidal neurons using dual-site focal synaptic stimulation. Blockade of Ca++ channels by 90% had no effect on the supralinearity score (Figure 6E; open green squares). In contrast, blockade of voltage-dependent Na+ channels by 90% (filled blue squares) substantially reduced the magnitude of the supralinearity, while blockade of NMDA channels (filled red circles) resulted in strictly sublinear summation for all ISI’s.
Discussion
It has been shown that multiple excitatory inputs to apical dendrites in CA1 stratum radiatum (SR) can trigger a local dendritic spike, and hence summate supralinearly, only when the inputs are activated nearly simultaneously (Losonczy and Magee, 2006). When single-pulse inputs were even slightly desynchronized, i.e., with inter-synapse delays of only 1–2 ms, dendritic spikes were not triggered and post-synaptic summation at the cell body became essentially linear. Based on these findings, it has been suggested that the dendritic integration in CA1 may be behavioral-state-dependent: linear during REM sleep and awake exploration (theta rhythm), when synchronization of CA3 inputs on a millisecond time scale is unlikely, and non-linear during the highly synchronized sharp waves and ripples associated with awake resting states and/or slow wave sleep.
Our results suggest that this dichotomy may not hold under in vivo conditions. Using a detailed compartmental model of a CA1 pyramidal cell developed previously (Poirazi et al., 2003a), modified slightly to fit the data most relevant to the present study, we replicated the tight synchronization requirement for single-pulse summation in apical oblique dendrites as reported by Losonczy and Magee (2006). We then showed that when individual CA3 axons fire even minimal bursts rather than single spikes, which we modeled by two glutamate releases leading to an increased NMDA conductance on the second pulse, local dendritic spikes can be triggered, and synaptic integration can be strongly supralinear (>150%), even when the temporal dispersion among CA3 inputs spans more than 100 ms. Our findings are consistent with recent data on layer 5 pyramidal neurons (Polsky et al., 2009), where double-pulse stimuli separated by up to 100 ms were shown to be capable of inducing large NMDA spikes and supralinear summation of inputs.
The much greater tolerance for temporal dispersion of bursty inputs suggests that non-linear dendritic integration could occur even with the relatively loose synchronization of CA3 neurons during the theta cycle (Csicsvari et al., 1998, 2000), given that CA3 cells are known to occasionally fire in short bursts during various behavioral tasks (Mizuseki et al., 2009). The two-layer model of a CA1 pyramidal cell, in which apical oblique branches provide a layer of separately thresholded non-linear integrative subunits (Poirazi et al., 2003a; Katz et al., 2009), may thus apply to all major hippocampal states, rather than being limited to states with extreme neuronal synchronization.
The broadening of the time window for supralinear integration in our model using double pulses was due primarily to facilitation of NMDAR-mediated responses, with an additional smaller contribution from classical temporal summation of voltage between the two pulses (Figure 6D). Several studies support the assumption of non-saturated NMDARs (Mainen et al., 1999; Mcallister and Stevens, 2000; Nimchinsky et al., 2004). In addition, the bursty firing patterns of CA3 neurons in vivo (Ranck, 1973; Suzuki and Smith, 1985; Tropp-Sneider et al., 2006; Mizuseki et al., 2009), coupled with evidence for reliable axonal propagation (Emptage et al., 1999, 2003; Meeks et al., 2005) and robust short-term synaptic facilitation at Schaffer collateral synapses (Dobrunz et al., 1997; Speed and Dobrunz, 2008), appear ideally suited to deliver the multiple glutamate releases per input “event” that can lead to strong NMDA-dependent post-synaptic responses.
Our model does not include short-term synaptic plasticity, the effects of inhibition, mGLURs, calcium buffering, glutamate spillover, microlocation, etc., Nonetheless, in its various stages of development it has reproduced a wide variety of experimental data (Poirazi et al., 2003a,b; Markaki et al., 2005; Pissadaki et al., 2010), including the Losonczy and Magee (2006) data as shown in Figures 2 and 3. Furthermore, our main prediction regarding input synchronization derives from simulation experiments in which only a slight change was made to the stimulus (using double pulses) relative to the known data with which the model was validated (using single pulses), and involves only a few additional biophysical assumptions that are well grounded in the published literature. Our results are also consistent with double-pulse response data from closely related cells (Polsky et al., 2004, 2009), and from closely related branches in the same cells (Ariav et al., 2003). Further experiments will nonetheless be needed to map out with greater certainty the interactions between state-dependent rhythms and dendritic integration in hippocampal function.
Conflict of Interest Statement
The authors declare that the research was conducted in the absence of any commercial or financial relationships that could be construed as a potential conflict of interest.
Acknowledgments
We would like to thank Jackie Schiller for advice on double-pulse stimulation protocols, useful discussions with Jeff Magee, and numerous helpful comments from the anonymous reviewers. This work was supported by NSF, NIH, the EMBO Young Investigator award (Panayiota Poirazi), and a Marie Curie Fellowship of the EU (PIOF-GA-2008-219622, Panayiota Poirazi).
References
Ariav, G., Polsky, A., and Schiller, J. (2003). Submillisecond precision of the input-output transformation function mediated by fast sodium dendritic spikes in basal dendrites of CA1 pyramidal neurons. J. Neurosci. 23, 7750–7758.
Béïque, J.-C., Lin, D.-T., Kang, M.-G., Aizawa, H., Takamiya, K., and Huganir, R. L. (2006). Synapse-specific regulation of AMPA receptor function by PSD-95. Proc. Natl. Acad. Sci. U.S.A. 103, 19535–19540.
Cais, O., Sedlacek, M., Horak, M., Dittert, I., and Vyklicky, L. Jr. (2008). Temperature dependence of NR1/NR2B NMDA receptor channels. Neuroscience 15, 428–438.
Cash, S., and Yuste, R. (1999). Linear summation of excitatory inputs by CA1 pyramidal neurons. Neuron 22, 383–394.
Csicsvari, J., Hirase, H., Czurko, A., and Buzsaki, G. (1998). Reliability and state dependence of pyramidal cell-interneuron synapses in the hippocampus: an ensemble approach in the behaving rat. Neuron 21, 179–189.
Csicsvari, J., Hirase, H., Mamiya, A., and Buzsaki, G. (2000). Ensemble patterns of hippocampal CA3-CA1 neurons during sharp wave-associated population events. Neuron 28, 585–594.
Destexhe, A., Mainen, M., and Sejnowski, T. J. (1998). “Kinetic models of synaptic transmission,” in Methods in Neuronal Modeling, 2nd Edn, eds C. Koch and I. Segev (Cambridge, MA: MIT Press), 1–26.
Dobrunz, L. E., Huang, E. P., and Stevens, C. F. (1997). Very short-term plasticity in hippocampal synapses. Proc. Natl. Acad. Sci. U.S.A. 94, 14843–14847.
Emptage, N., Bliss, T. V. P., and Fine, A. (1999). Single synaptic events evoke NMDA receptor-mediated release of calcium from internal stores in hippocampal dendritic spines. Neuron 22, 115–124.
Emptage, N. J., Reid, C. A., Fine, A., and Bliss, T. V. (2003). Optical quantal analysis reveals a presynaptic component of LTP at hippocampal Schaffer-associational synapses. Neuron 38, 797–804.
Frerking, M., Schulte, J., Wiebe, S. P., and Staubli, U. (2005). Spike timing in CA3 pyramidal cells during behavior: implications for synaptic transmission. J. Neurophysiol. 94, 1528–1540.
Gasparini, S., and Magee, J. C. (2006). State-dependent dendritic computation in hippocampal CA1 pyramidal neurons. J. Neurosci. 26, 2088–2100.
Gasparini, S., Migliore, M., and Magee, J. C. (2004). On the initiation and propagation of dendritic spikes in CA1 pyramidal neurons. J. Neurosci. 24, 11046–11056.
Harris, K., Hirase, H., Leinekugel, X., Henze, D. A., and Buzsáki, G. (2001). Temporal interaction between single spikes and complex spike bursts in hippocampal pyramidal cells. Neuron 32, 141–149.
Hines, M., and Carnevale, N. (1997). The NEURON simulation environment. Neural Comput. 9, 1179–1209.
Jarsky, T., Roxin, A., Kath, W. L., and Spruston, N. (2005). Conditional dendritic spike propagation following distal synaptic activation of hippocampal CA1 pyramidal neurons. Nat. Neurosci. 8, 1667–1676.
Katz, Y., Menon, V., Nicholson, D. A., Geinisman, Y., Kath, W. L., and Spruston, N. (2009). Synapse distribution suggests a two-stage model of dendritic integration in CA1 pyramidal neurons. Neuron 63, 171–177.
Larkum, M., Nevian, T., Sandler, M., Polsky, A., and Schiller, J. (2009). Synaptic integration in tuft dendrites of layer 5 pyramidal neurons: a new unifying principle. Science 325, 756–760.
Larkum, M. E., Zhu, J. J., and Sakmann, B. (2001). Dendritic mechanisms underlying the coupling of the dendritic with the axonal action potential initiation zone of adult rat layer 5 pyramidal neurons. J. Physiol. (Lond.) 533, 447–466.
Losonczy, A., and Magee, J. C. (2006). Integrative properties of radial oblique dendrites in hippocampal CA1 pyramidal neurons. Neuron 50, 291–307.
Mainen, Z. F., Malinow, R., and Svoboda, K. (1999). Synaptic calcium transients in single spines indicate that NMDA receptors are not saturated. Nature 399, 151–155.
Major, G., Polsky, A., Denk, W., Schiller, J., and Tank, D. W. (2008). Spatiotemporally graded NMDA spike/plateau potentials in basal dendrites of neocortical pyramidal neurons. J. Neurophysiol. 99, 2584–2601.
Markaki, M., Orphanoudakis, S., and Poirazi, P. (2005). Modelling reduced excitability in aged CA1 neurons as a calcium-dependent process. Neurocomputing 65–66, 305–314.
Mcallister, A., and Stevens, C. F. (2000). Nonsaturation of AMPA and NMDA receptors at hippocampal synapses. Proc. Natl. Acad. Sci. U.S.A. 97, 6173–6178.
McDermott, C., Hardy, M. N., Bazan, N. G., and Magee, J. C. (2006). Sleep deprivation-induced alterations in excitatory synaptic transmission in the CA1 region of the rat hippocampus. J. Physiol. (Lond.) 570, 553–565.
Meeks, J., Jiang, X., and Mennerick, S. (2005). Action potential fidelity during normal and epileptiform activity in paired soma-axon recordings from rat hippocampus. J. Physiol. (Lond.) 566, 425–441.
Mel, B., Ruderman, D. L., and Archie, K. A. (1998). Translation-invariant orientation tuning in visual “complex” cells could derive from intradendritic computations. J. Neurosci. 18, 4325–4334.
Mel, B. W. (1993). Synaptic integration in an excitable dendritic tree. J. Neurophysiol. 70, 1086–1101.
Milojkovic, B., Wuskell, J. P., Loew, L. M., and Antic, S. D. (2005). Initiation of sodium spikelets in basal dendrites of neocortical pyramidal neurons. J. Membr. Biol. 208, 155–169.
Mizuseki, K., Sirota, A., Pastalkova, E., and Buzsáki, G. (2009). Theta oscillations provide temporal windows for local circuit computation in the entorhinal-hippocampal loop. Neuron 64, 267–280.
Nevian, T., Larkum, M. E., Polsky, A., and Schiller, J. (2007). Properties of basal dendrites of layer 5 pyramidal neurons: a direct patch-clamp recording study. Nat. Neurosci. 10, 206–214.
Nimchinsky, E., Yasuda, R., Oertner, T. G., and Svoboda, K. (2004). The number of glutamate receptors opened by synaptic stimulation in single hippocampal spines. J. Neurosci. 24, 2054–2064.
Oertner, T. G., Sabatini, B. S., Nimchinsky, E. A., and Svoboda, K. (2002). Facilitation at single synapses probed with optical quantal analysis. Nat. Neurosci. 5, 657–664.
Pissadaki, E. K., Sidiropoulou, K., Reczko, M., and Poirazi, P. (2010). Encoding of spatio-temporal input characteristics by a CA1 pyramidal neuron model. PLoS Comput. Biol. 6, e1001038. doi: 10.1371/journal.pcbi.1001038
Poirazi, P., Brannon, T., and Mel, B. W. (2003a). Arithmetic of subthreshold synaptic summation in a model CA1 pyramidal cell. Neuron 37, 977–987.
Poirazi, P., Brannon, T., and Mel, B. W. (2003b). Pyramidal neuron as 2-layer neural network. Neuron 37, 989–999.
Polsky, A., Mel, B., and Schiller, J. (2009). Encoding and decoding bursts by NMDA spikes in basal dendrites of layer 5 pyramidal neurons. J. Neurosci. 29, 11891–11903.
Polsky, A., Mel, B. W., and Schiller, J. (2004). Computational subunits in thin dendrites of pyramidal cells. Nat. Neurosci. 7, 621–627.
Popescu, G., Robert, A., Howe, J. R., and Auerbach, A. (2004). Reaction mechanism determines NMDA receptor response to repetitive stimulation. Nature 430, 790–793.
Pyapali, G. K., Penttonen, M., Sik, A., Buzsaki, G., and Turner, D. A. (1998). Dendritic properties of intracellularly-stained rat hippocampal CA1 pyramidal neurons recorded in vivo and in vitro. J. Comp. Neurol. 391, 335–352.
Ranck, J. Jr. (1973). Studies on single neurons in dorsal hippocampal formation and septum in unrestrained rats. I. Behavioral correlates and firing repertoires. Exp. Neurol. 41, 461–531.
Schiller, J., Koester, H., Major, G., and Schiller, Y. (2000). NMDA spikes in basal dendrites of cortical pyramidal neurons. Nature 404, 285–289.
Shepherd, G., and Brayton, R. K. (1987). Logic operations are properties of computer-simulated interactions between excitable dendritic spines. Neuroscience 21, 151–165.
Speed, H., and Dobrunz, L. E. (2008). Developmental decrease in short-term facilitation at Schaffer collateral synapses in hippocampus is mGluR1 sensitive. J. Neurophysiol. 99, 799–813.
Suzuki, S., and Smith, G. K. (1985). Burst characteristics of hippocampal complex spike cells in the awake rat. Exp. Neurol. 89, 90–95.
Tropp-Sneider, J., Chrobak, J. J., Quirk, M. C., Oler, J. A., and Markus, E. J. (2006). Differential behavioral state-dependence in the burst properties of CA3 and CA1 neurons. Neuroscience 141, 1665–1677.
Umemiya, M., Senda, M., and Murphy, T. H. (1999). Behaviour of NMDA and AMPA receptor-mediated miniature EPSCs at rat cortical neuron synapses identified by calcium imaging. J. Physiol. (Lond.) 521, 113–122.
Keywords: CA1 pyramidal neuron, NMDA receptor, integration, compartmental model
Citation: Gómez González JF, Mel BW and Poirazi P (2011) Distinguishing linear vs. non-linear integration in CA1 radial oblique dendrites: it’s about time. Front. Comput. Neurosci. 5:44. doi: 10.3389/fncom.2011.00044
Received: 20 June 2011;
Accepted: 20 September 2011;
Published online: 14 November 2011.
Edited by:
David Hansel, University of Paris, FranceReviewed by:
Boris Gutkin, Institut Pasteur, FranceCarmen Canavier, LSU Health Sciences Center, USA
Copyright: © 2011 Gómez González, Mel and Poirazi. This is an open-access article subject to a non-exclusive license between the authors and Frontiers Media SA, which permits use, distribution and reproduction in other forums, provided the original authors and source are credited and other Frontiers conditions are complied with.
*Correspondence: Panayiota Poirazi, Institute of Molecular Biology and Biotechnology, Foundation for Research and Technology-Hellas, Heraklion, Crete, Greece. e-mail: poirazi@imbb.forth.gr