Information-selectivity of beta-amyloid pathology in an associative memory model
- School of Computer Science, University of Birmingham, Birmingham, UK
This work models the progression of beta-amyloid pathology according to Small’s synaptic scaling theory in an updated version of Ruppin and Reggia’s associative neural network model of Alzheimer’s disease, leading to a self-reinforcing cascade of damage. Using an information theoretic approach, it is shown that the simulated beta-amyloid pathology initially selectively targets neurons with low informational contribution to the overall performance of the network, but that it targets neurons with increasingly higher significance to the network as the disease progresses. The results additionally provide a possible explanation for the apparent low correlation between amyloid plaque density and cognitive decline in the early stages of Alzheimer’s disease.
1. Introduction
Prevailing medical opinion holds that the density of plaque deposits of beta-amyloid (Aβ) in the brain does not necessarily correlate well with cognitive decline in Alzheimer’s disease (AD), particularly in the early stages of the disease (Abeles et al., 1990; Hardy and Selkoe, 2002; Savioz et al., 2009), yet the amyloid hypothesis remains the key investigatory path in AD research due to its undeniable significance to the overall pathology of the disease (Hardy, 2009). At the same time, it is unclear what mechanisms drive progression of beta-amyloid throughout the network. Of particular interest on this topic is a theory proposed by Small (2008) which describes the progression of AD as a self-reinforcing cascade resulting from synaptic scaling within the network as a response to damage.
Synaptic scaling (or compensation, as it is termed here and elsewhere) is a mechanism by which neurons can compensate for reductions in their postsynaptic potential as connected contributory neurons die off or synapses between the neurons are blocked (e.g., by beta-amyloid, cell death, or tau neurofibrillary tangles; Ballatore et al., 2007). In an un-compensated network, average postsynaptic potentials into each neuron would decrease with damage and firing thresholds would not be reached, leading to overall failure of the network. Synaptic compensation mitigates this effect by increasing the weights of the remaining connections to each neuron, resulting in a maintained average postsynaptic potential profile albeit with increased noise (Horn et al., 1996; Small, 2008; Savioz et al., 2009). Small (2008) proposes that this synaptic compensatory mechanism directly drives progression of AD within the network.
Previous work (Rowan, 2011) introduced updates to an early Hopfield-class attractor neural network model of some of the symptoms of AD (Ruppin and Reggia, 1995a) which incorporated local, field-dependent synaptic compensation (Horn et al., 1996). This model remains widely cited (Duch, 2007; Savioz et al., 2009) even though it could be made capable of better approximation of the lesions representing AD pathology according to modern medical knowledge; originally the model only deleted neurons or synapses at random (Ruppin and Reggia, 1995a) or within a specified radius on a 2-D grid (Ruppin and Reggia, 1995b). The latest updates to this model have incorporated simulated tau neurofibrillary pathology (modeled as localized, spreading Gaussian synaptic suppression) which leads to a vastly different damage profile compared to random synaptic deletion (Rowan, 2011), and investigated the differences in network capacity and robustness under various connectivity strategies, which remains an important topic as identified by (Bullmore and Sporns, 2009).
Connectionist associative neural networks such as the Ruppin and Reggia model examined here belong to a different category from spiking neural networks and biochemical models, offering biological approximation rather than biological realism. This lack of complex detail, whilst limiting the resolution of the model on the one hand, can provide insights of a different kind to neuroscientists by revealing larger-scale network effects which may otherwise be lost in the detail of fine-grained models. Care must be taken to ensure that, whilst approximations of the “integrate and fire” sort which retain the key biological aspects of neural behavior may be permitted (Abbott, 1999), principles of large-scale biological plausibility such as sparse coding in stored patterns (Abeles et al., 1990) and sparse connectivity between neurons (Churchland and Sejnowski, 1994) must be adhered to.
The aim of this work therefore is not to replicate directly the biological processes implicated in Alzheimer’s disease, but rather to abstract the effects of certain fundamental rules of connected networks of neural-like units into a symbolic representation of much more general processes than would be possible in neurobiological models. This work further updates the Ruppin and Reggia model to include simulated Aβ pathology according to Small’s (2008) theory of disease progression and examines the effects, using an information theoretic approach, of Aβ on the cognitive performance of the network.
The remainder of this paper is organized as follows: Section 2 deals with the medical background to the amyloid hypothesis of AD and Small’s theory of progression via synaptic compensation mechanisms. Section 3 describes the Ruppin and Reggia model in greater detail and the updates made to it in this work, and section 4 presents the results of experiments characterizing the model. Section 5 deals with concluding remarks and outlines future directions in which this research could be taken.
2. Background
2.1. Beta-Amyloid Plaques
The amyloid hypothesis states that plaques consisting of extracellular deposits of beta-amyloid (Aβ) derived from amyloid precursor protein (APP) are formed in the brain, leading to neuronal toxicity, cell death, and subsequent neurodegeneration and cognitive deficiencies (Hardy, 2009).
It is believed that amyloid pathology affects several aspects of the overall process of AD, altering neurological processes directly by blocking synapses (Hardy, 2009) as well as exacerbating the effects of tau and cholinergic pathology (Wilcock et al., 2009).
However, original predictions that Aβ should be neurotoxic have been found lacking in support (Hardy, 2009). One reason for this is the observed discrepancy between the number of solidified amyloid plaques found in the brain, and the level of cognitive decline observed in the early stages of Alzheimer’s disease (Hardy and Selkoe, 2002; Minati et al., 2009; Savioz et al., 2009). A possible mechanism for neurotoxicity, via calcium signaling systems, is believed to arise from the interaction of Aβ with neuronal membranes, leading to relaxed regulation of Ca2+ flux into the neuron and the subsequent increase in Ca2+ ions inside the neuron beyond a critical level at which apoptosis (programmed cell death; Hynd et al., 2004), or even necrosis (traumatic cell death) occurs (Berridge, 2010).
The modification of Ca2+ signaling systems is also believed to underlie some of the cognitive deficits seen in AD more directly (Berridge et al., 2000). Ca2+ is closely related to the action of glutamate receptors on neurons in the hippocampus which are essential for long-term potentiation as part of a Hebbian learning process (Clapham, 2007), implying that disruptions in calcium signaling systems may lead to learning and memory deficiencies seen in AD. “Altered Ca2+ signaling accelerates Aβ formation, whereas Aβ peptides, particularly in soluble oligomeric forms, induce Ca2+ disruptions. A degenerative feed-forward cycle of toxic Aβ generation and Ca2+ perturbations results” (Demuro et al., 2010).
As well as forming external amyloid plaques, there is evidence that Aβ accumulates internally within neurons, inhibiting proteasomes (protein complexes which regulate the concentration of proteins within a cell and clear up pathological proteins), thus leading to a build-up of tau protein, and subsequent tau pathology. Proteasome inhibition also leads in turn to a further build-up of Aβ, thus exacerbating the cascade, and to calcium dysfunction. It has been suggested that intracellular Aβ oligomers can adversely affect long-term potentiation in the hippocampus, leading to further cognitive decline (LaFerla et al., 2007).
2.2. Synaptic Scaling and Disease Progression
Small proposed a mechanism by which the progression of Aβ pathology in Alzheimer’s disease may be tightly coupled with synaptic compensation, in a self-reinforcing cycle of neurodegeneration (Small, 2008). This theory has a key feature in common with a much earlier work by Wallenstein and Hasselmo (1998), chiefly that the brain’s own neuroregulation mechanisms have some role to play in selective spreading of the disease pathology throughout the brain. Whilst Wallenstein and Hasselmo concentrate on the spread of “runaway synaptic modification” (pathological exponential growth of large numbers of synaptic connections) progressing along paths of high activity, Small proposes a similar process involving the spread of Aβ pathology.
In brief, Small proposes that initial Aβ-related neurotoxicity in a single neuron causes a responding increase in synaptic compensation amongst connected neurons, necessary for each to maintain its average postsynaptic potential profile after the death of the Aβ-affected neuron. This increased synaptic compensation effectively increases the excitability of the neurons concerned, leading to locally raised intracellular calcium levels in the sub-network to which the toxic neuron was connected. As calcium plays a key role in mediating Aβ neurotoxicity (Demuro et al., 2010), these neurons now gain increased vulnerability to the surrounding amyloid pathology: a self-reinforcing, locally spreading cycle now occurs, whereby synaptic scaling in healthy neurons which were locally connected to an Aβ-toxified neuron leads to the spread of the pathology throughout the network.
3. Model Description
3.1. Learning Rule
Ruppin and Reggia showed how a variant of an attractor network model proposed by Tsodyks and Feigel’Man, 1988; the T-F model) is capable of storing patterns in a biologically plausible Hebbian activity-dependent manner. This is achieved using a repetitive-learning process whereby each pattern to be stored “must be presented to the network several times before it becomes engraved on the synaptic matrix with sufficient strength, and is not simply enforced on the network in a ‘one-shot’ learning process” (Ruppin and Reggia, 1995a). An updated version of the model (Ruppin and Reggia, 1995b) added Gaussian partial-connection of the network rather than full connectivity, and a further update (Rowan, 2011) introduced small-world connectivity (Watts and Strogatz, 1998).
The network learns patterns through a process of activity-dependent learning according to the update rule:

The model can be seen as a rough approximation of a single cortical unit. A set of external inputs (e.g., from other cortical units, or from the CA3 region of the hippocampus; O’Reilly and Rudy, 2000; Rolls and Kesner, 2006; Rolls, 2010) delivers activation greater than the neural threshold to each unit of the network according to the pattern to be learned. W is the weight matrix of undirected connections between neurons i and j, γ is a constant determining the magnitude of activity-dependent changes, N is the number of neurons in the network, K ≤ N is the number of other units to which each unit is connected, S refers to the neuronal state {0, 1}, and p is the coding rate denoting the proportion of 1 s compared to 0 s in the stored memory patterns (p « 1 as cortical networks are found to have low coding rates; Abeles et al., 1990).
The activity-dependent learning rule for pattern storage is based on the Hebbian principle but introduces the requirement for each given pair of units to remain in the same state for a certain number of update iterations (the suggested value is 5) before the synaptic weight between them is updated, and requires each pattern to be presented several times in turn to the network before it is completely stored. Thus the learning algorithm attempts to mitigate the biologically unrealistic effects of the Hebb rule’s ability to globally alter synaptic weights, and circumvents its method of storing each pattern in a “one-shot” process which is susceptible to the presence of errors or noise. By presenting each pattern several times to the network, any noise present in the inputs is reduced and the synaptic matrix is gradually constructed rather than being enforced in a single process by the learning rule.
3.2. Performance Evaluation
Patterns are recalled using a noisy version of the complete pattern applied to the network via the same set of external inputs used for learning with activation less than the neural firing threshold. A measure of the recall performance the network for a given pattern ξμ, termed the overlap between the resulting network state and the pattern, has the effect of counting the correctly firing units whilst also penalizing with a lower weighting those units which fire erroneously (equation 2; Tsodyks and Feigel’Man, 1988):
3.3. Synaptic Compensation
In the work by Ruppin and Reggia the network model was lesioned by deleting synapses or neurons at random and implementing a process of variable synaptic compensation, where “the magnitude of the remaining synapses is uniformly strengthened in a manner that partially compensates for the decrease in the neuron’s input field” (Ruppin and Reggia, 1995a) by multiplying the weights of the remaining synaptic connections by a globally determined (i.e., depending on knowledge of the overall fraction of deletion) local compensation factor.
Ruppin and Reggia examined the overall degradation in recall performance and the pattern of relative sparing of older memories compared to recently stored patterns (as observed in AD patients; Kopelman, 1989) as the network was progressively lesioned, and concluded that synaptic deletion and compensation in this model can be demonstrated to reveal similar symptoms to the cognitive decline observed in AD.
However a global synaptic compensation strategy is biologically implausible as each neuron must somehow be aware of the global deletion rate both for itself, and for other neurons around it. Horn et al. (1996) therefore introduce a neuronal-level compensatory mechanism which causes each neuron to adjust its output based only on changes in the neuron’s average postsynaptic potential (or summed input), and which does not require the explicit knowledge of either global or local levels of synaptic deletion.
As will be demonstrated in section 5, however, the precise compensation strategy employed is immaterial as long as the results (maintenance of average postsynaptic potential through scaling of remaining inputs) are consistent.
3.3.1. Algorithm
This algorithm is due to Horn et al. (1996) but re-presented here for clarity and completeness.
At any given moment, each neuron has an estimate  of its total connectivity compared to the starting value (wi = 1). It compensates for this reduced connectivity by multiplying the remaining incoming synapses by a value ci to give

where  is the expected value of the input field of each neuron in the network Ni, estimated by presenting a set of random noise patterns (coding rate p = 1, e.g., 0.1) in the pre-morbid state (i.e., before each iteration of lesioning) and measuring the total incoming weighted activation for this neuron on each pattern.
Given the assumption that  (i.e., the network is currently correctly compensating for any value of w < 1), we obtain from this the neuron’s average “noise-state” input field value:

The neuron’s average “signal-state” input field value is obtained similarly, using a set of previously stored patterns rather than random noise patterns (Horn et al., 1996, speculate that this process could occur biologically during dreaming):

again assuming 
The network is lesioned in some way unknown to the individual neurons (e.g., by deleting synapses).
Now, in order to estimate the new value of  in the post-morbid state, and thus to compute a new value for
  a further set of previously stored patterns is presented to the network and the network allowed to converge once more to a stable state. A new post-morbid value for each neuron’s input field
  is obtained as in equation 3, and the difference between
  and
and  can now be calculated to derive a value for
The post-morbid input field value  is separated into signal and noise terms with different power dependence on deletion:

The noise term is already known from equation 4, and is subtracted from  It is thus possible to calculate
  and from it, to derive a new value for the compensation factor:
3.4. Model Dynamics
Briefly, with due credit to Horn et al. (1993), the update rule for neuron i at time t without synaptic compensation is defined as:
where S ∈ {0, 1} denotes the state of neuron Si at time t, Θ is the step function, Wij is the synaptic weight between neurons i and j, and θ is the neural threshold.
With the addition of local synaptic compensation, the update dynamics become:
where Di denotes the set of neurons to which neuron i remains connected after lesioning. A more verbose description of the dynamics of the system is given in Horn et al. (1993).
3.5. Information Contribution of a Single Neuron
The beta-amyloid lesioning strategy proposed by Small (2008) raises an interesting question regarding the significance of which neurons succumb to Aβ, and at which point during the lesioning process they do so.
From within the context of synaptic compensation, one can easily deduce that neurons which are only sparsely connected to others will suffer a large relative drop in average postsynaptic (input) potential when one of their connected input neurons dies, and therefore a large compensation factor must be applied to make up for this shortfall. Conversely, a neuron which is densely and strongly connected to its neighbors will suffer much less severe a decrease in postsynaptic potential for each lost incoming connection, and its subsequent compensation will be low, safeguarding the neuron from excitability-induced Aβ pathology (Figure 1).
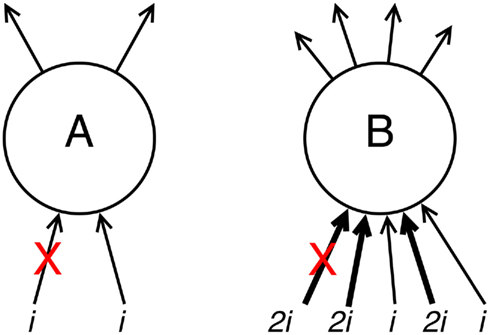
Figure 1. Demonstration of the effects of connectivity density and strength upon compensation rates. Neuron A has weak, sparse input activation totaling some arbitrary value 2i. If one of these input connections is deleted (e.g., after a connected neuron dies; denoted with a red cross), the remaining connectivity (see equation 7) w′ = 1i/2i = 0.5w, and the resulting compensation factor c′ = 1/w′ = 2c. Neuron B has strong, dense input activation totaling 8i. Deletion of one of these input connections (here, one of the stronger inputs, but the effect is even more pronounced when one of the weaker inputs is deleted) gives remaining connectivity w′ = 6i/8i = 0.75w and lower resulting compensation c′ = 1/w′ = 1.333c.
Due to their greater compensatory rates, sparsely connected neurons are thus more likely to succumb to Aβ early in the progression of the disease, according to Small’s (2008) theory.
This principle is independent of the specific compensatory mechanism employed within the model, providing that neurons have some mechanism of estimating their remaining connectivity  and scaling this connectivity up by some factor ci in order to maintain an average postsynaptic potential.
According to the Hebbian principle, the development of strong, dense input connectivity to a given neuron during the learning process indicates some kind of significance of that neuron to its local network (“cells that fire together, wire together,” or more formally, connection strengths are modified according to the degree of correlated activity between input and output). Additionally, it is known that during learning, “network connections develop in such a way as to maximize the amount of information that is preserved when signals are transformed” (Linsker, 1988), and thus we can pose the questions:
• Is there a possible selectivity of Aβ for neurons with low information contribution into the rest of the network?
• If so, could the preference of Aβ for low information-contributing neurons explain the observed poor correlation between Aβ deposits and cognitive decline in the early stages of AD?
Information contribution of a single neuron can be measured as the mutual information between a stimulus (in this case, one of the stored patterns) and the probability of a response from the neuron.
Skaggs et al. (1993) define mutual information between a neuron and a stimulus as “the information conveyed by a discrete random variable X about another discrete random variable Y, which is identical to the mutual information of X and Y.” The same measure is used by Rolls et al. (1997) and Borst and Theunissen (1999) in the context of neural stimuli and responses, but with the notation s (stimulus) and r (response) instead of X and Y. The measure used is:
where I(R,S) is the total information (in bits) conveyed by a neuron’s responses ri ∈ {0, 1} about stimuli sj ∈ S; the probability of a response from neuron i, p(ri), is obtained for each neuron by repeatedly retrieving stored patterns from the network and recording the number of times neuron i fires, normalized by the number of patterns retrieved during the trial; p(sj) is simply the number of times each pattern sj is retrieved during the trial, normalized by the total number of patterns retrieved; and p(ri | sj) is observed by noting each time neuron i responds to each pattern sj, normalized by the total number of responses of neuron i to all patterns in set S.
4. Results
To investigate these predictions regarding information contribution, a series of experiments was performed in which randomly generated networks were lesioned with either simulated beta-amyloid pathology or by randomly selecting neurons for deletion. The resulting network performance at each step, in addition to the average information contribution of the selected neurons at the time of deletion, was recorded and plotted against the total proportion of deletion. A second set of experiments examined the change in pattern retrieval time (measured in number of update iteration steps until a stable pattern is obtained) as the networks were lesioned via simulated Aβ and random deletion.
All experiments were undertaken with the following network parameters: network size N = 1200, connections per unit K = 150, firing threshold þeta = 0.048, noise T = 0.005, learning rate γ = 0.025, external input strength (learning mode) el = 0.065, external input strength (retrieval mode) er = 0.035, coding rate p = 0.1, neurons deleted per step Δd = 0.01. With the exception of network size and connectivity density, all the parameters were drawn directly from the findings of Ruppin and Reggia (1995a). The weight matrix was sparsely connected in a Gaussian manner, such that the probability of two neurons being connected increases with their proximity to each other. Results were averaged over ten runs.
4.1. Random Deletion
To investigate the effects on information contribution and network performance of deleting neurons using simulated beta-amyloid pathology, it is first necessary to form a baseline for comparisons. To achieve this, a network was created and then lesioned by deleting neurons and all their connections in random sequence until all neurons had been deleted. This was done by iteratively removing all incoming and outgoing connections (setting Wij = 0 and Wji = 0) from the weights matrix for each selected neuron Ni.
On each run, a set of 20 patterns was stored in the network according to the learning rule in equation 1. The network was then progressively lesioned at random in steps of Δd, or 12 neurons per step. Before the actual deletion in each step occurred, the information contribution of each of the selected neurons was obtained according to the algorithm in section 5, and the mean information contribution of the 12 units was recorded. The connections were then deleted to remove these neurons from the network. A round of synaptic compensation was then performed for the remaining neurons as described in section 3.
After each iteration, the performance of the network was evaluated by obtaining the average overlap of the network (equation 2) when presented with each of the stored 20 patterns for retrieval. The results of this random deletion are shown alongside the average information contribution of the deleted neurons at each lesioning step in Figures 2 and 3.
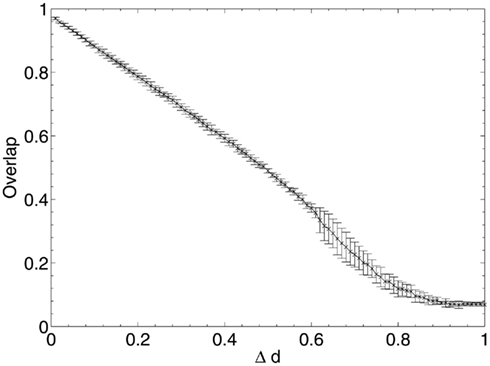
Figure 2. Network performance as neurons are deleted at random.
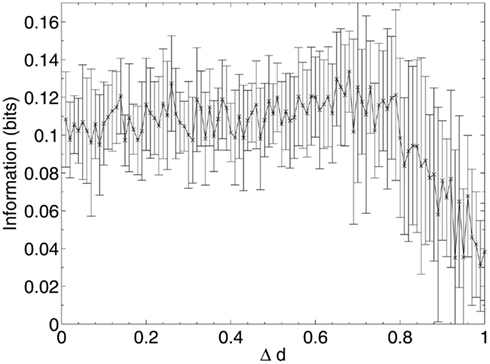
Figure 3. Mean information contribution of neurons deleted at random.
The results show a largely constant mean information contribution of the deleted neurons at each Δd step with large error bars (Figure 3), indicating that there is no specificity and high variability in information contribution during the deletion process. At around 80% deletion the information contribution starts to decline as the network becomes so highly disconnected that performance is at its minimum (Figure 2). Increasingly, the remaining neurons are unable to receive sufficient input activation to fire, leading to a decline in their average contribution to the network immediately prior to deletion.
There is a highly linear decline in network performance until a period at around 60% deletion when the decline deviates more strongly but continues overall on a similar trajectory. The graph is clearly different to the s-shaped curve of performance decline seen in experiments in a previous paper (Figure 4; Rowan, 2011), in which Δd of the remaining synapses chosen at random from across the whole network were deleted at each step, rather than deletion of all the synapses for the Δd selected neurons chosen at random.
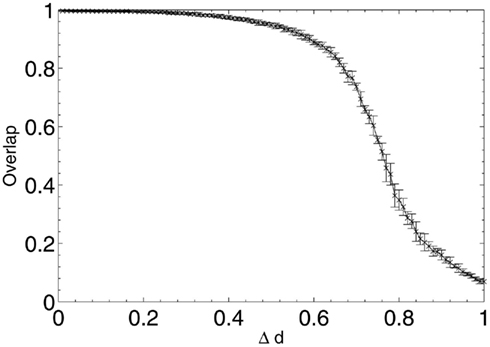
Figure 4. Network performance as synapses (rather than whole neurons) are deleted at random (Rowan, 2011), for comparison with Figure 2.
Synaptic deletion grants each individual neuron a greater chance of remaining in the output pattern at each lesioning step, as it is highly unlikely that all the connections belonging to any one neuron are removed at each step of deletion, but with neuronal deletion the performance decline appears to represent solely the result of random removal of units from the output patterns, as each neuron in the network is compared with the stored patterns; there are no hidden units whose removal would have no effect on the output pattern. This is the equivalent of randomly flipping bits in the retrieved patterns to zero: the actual network effects of this deletion do not become apparent until the period of irregular performance decline from around 60% deletion onward1.
4.2. Beta-Amyloid Lesioning
The experiment was then repeated with lesioning using simulated Aβ pathology according to the theory of Small (2008). To implement Aβ lesioning, the neurons at each step were selected probabilistically as a linear function of the compensation factor c of each neuron. Again, 20 patterns were stored before the lesioning process was initiated, whilst results with differing numbers of stored patterns are analyzed in section 4.
These results show that, when considering only neuronal information contribution, the lesioning process initially acts at random within the network due to the flat distribution of c, the compensation factor (Figure 7). The recorded information contribution of the first set of deleted neurons is almost exactly at the mid-point between lowest and highest information contribution (Figure 6). This random deletion also has a small negative effect on performance of the network, causing the overlap measure to begin just below 1 (Figure 5).
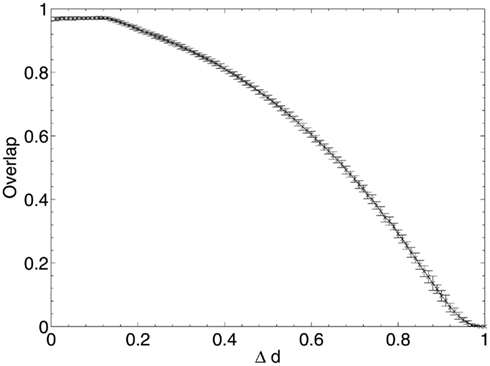
Figure 5. Network performance as neurons are deleted selectively using beta-amyloid progression strategy.
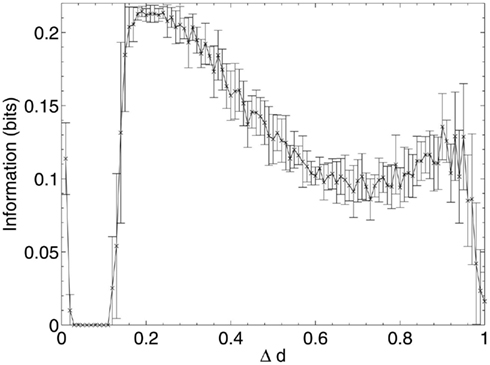
Figure 6. Mean information contribution of neurons deleted selectively using beta-amyloid progression strategy.
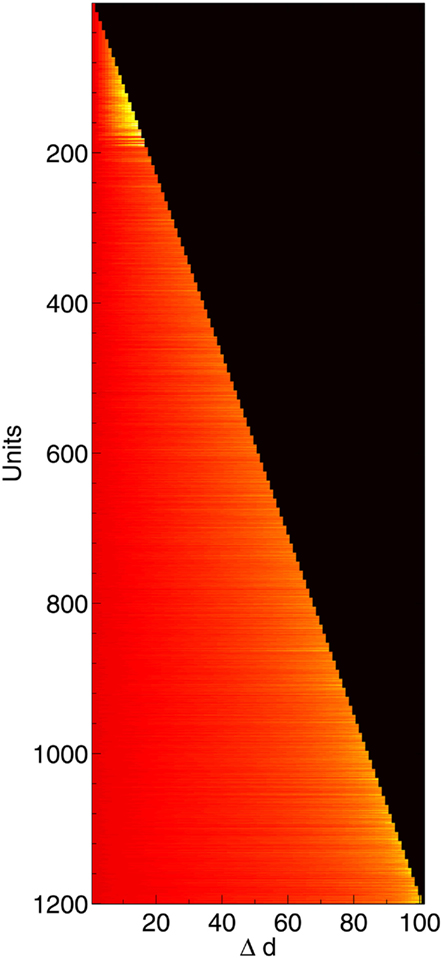
Figure 7. Change in compensation factor c as 1200 neurons are deleted, shown along the time course of the network from initial lesioning to 100% deletion. Hotter colors (lighter shades) denote higher values of c. Neurons nearer the top were deleted first; neurons on the bottom row survived all the way to the end.
Immediately after the onset of Aβ lesioning, as neurons with sparse and/or low-weighted incoming connectivity begin to lose their neighbors to the effects of Aβ, their compensation rates must increase faster than those of better connected neurons (Figure 7). Aβ now selectively targets neurons with low overall contribution to the network due to the greater compensation rates they must employ. Because these neurons contribute relatively little to the overall functioning of the network and its ability to recall patterns (as suggested by their sparse and low-weighted connectivity), the performance does not decline at all for up to 12–13% of deletion.
Once this reserve of low information contribution neurons has been lesioned, the information contribution of the neurons being selected for deletion begins to increase rapidly. Aβ still selects for the neurons with the highest compensation factors (and implicitly the lowest available information contribution), but at this stage deletion of the neurons begins to have a tangible effect on the performance of the network.
This result could explain the observed poor correlation between Aβ plaque density and cognitive decline in early AD (Hardy and Selkoe, 2002; Minati et al., 2009; Savioz et al., 2009). After the first random deletion step, during the subsequent 12–13% of neural atrophy due to Aβ in the model with 20 patterns stored, only insignificant (in information contribution terms) neurons are lesioned and there is correspondingly no apparent cognitive decline whatsoever. It is only after this point, as Aβ continues to selectively target the least significant of the remaining neurons, that cognitive decline becomes apparent as the average information contribution of the dying neurons, and hence the negative effect on the network of their removal, gradually increases.
The relative contribution of the remaining neurons then declines steadily between 20 and 70% deletion as the network progressively becomes more disconnected until, toward the end of the lesioning process, there is a second, smaller peak in information contribution which occurs as the last neurons to be deleted are the highly connected, significant neurons which are responsible for the above-zero recall performance even at this late stage. Finally, at around 90% deletion, the information contribution of the deleted neurons decreases rapidly to nearly zero as the small numbers of remaining neurons are finally disconnected from each other.
4.3. Retrieval Times
The experiment was repeated once more for both Aβ and random neuronal deletion, but instead of examining the decline in performance over Δd, the average number of network update iterations required to fall into a stable state for each cued pattern was recorded.
Figure 8 shows that, for random neuronal deletion, the length of time for pattern retrieval increases steadily until the peak (set artificially at 0.05N = 60 update iterations to prevent infinite updating which never converges) is reached. This is to be expected, as the removal of neurons and their connections at random from the network will necessitate longer travel paths of activation between the remaining neurons, and hence longer overall network update time.
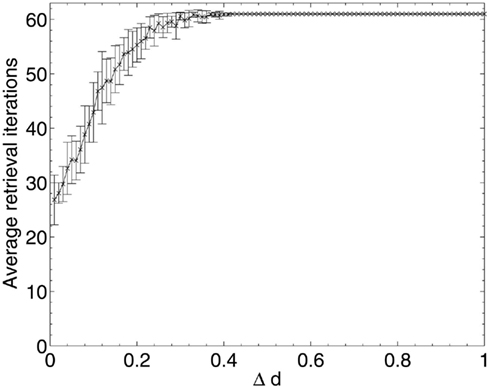
Figure 8. Changes in network pattern retrieval time during random neuronal deletion.
The results of Aβ lesioning on average pattern retrieval time (Figure 9) show a similar performance at the start of the lesioning process to that obtained during random deletion, but unlike in random deletion, the retrieval time actually begins to decrease over the first 10% of lesioning (the same period during which network performance remained stable and information contribution of deleted neurons was at its lowest in Figure 5). This implies that the network performance is actually being optimized by the removal of low-contribution neurons, although (due to the effects of neuronal deletion mentioned in section 1) these early deleted neurons are likely to be ones which do not fire in any of the stored patterns and hence have very low variance and correspondingly low information contribution, as their removal appears to have no associated negative impact on the overlap measure.
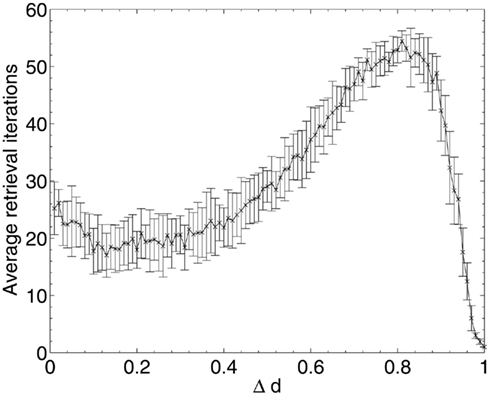
Figure 9. Changes in network pattern retrieval time during beta-amyloid lesioning.
Once the performance effects of neuronal deletion begin to appear at around 12–13% deletion, the retrieval time steadily increases. This appears intuitive if it is considered that, as the deletion progresses, only the most significant neurons (in terms of operation of the network) remain: it is only once these neurons are being deleted, at around 80% deletion onward, that both the information contribution of the deleted neurons and the retrieval time of the network reaches its peak. After the peak, at around 90% deletion, the network has become so fundamentally disconnected that these small numbers of highly significant neurons finally become disconnected from each other, leading to a network which does not respond to the input cues at all but just remains in a stable state unrepresentative any of the cued patterns.
4.4. Network Loading Levels
To investigate potential effects of the loading level of the network on the results (in other words, to determine whether the results obtained are dependent on the number of patterns stored as a proportion of the network’s maximum capacity), the experiment was repeated with increasing sizes of pattern sets.
The theoretical capacity of an associative network is  patterns (Gurney, 1997; where N is the number of units in the network), which gives a theoretical capacity for a 1200 unit network of 194 patterns, although as the network is connected sparsely (K = 150 connections per unit) the actual capacity is significantly lower. To find the limit of the network’s capacity experimentally, patterns were sequentially stored and later retrieved, and performance according to the overlap measure (equation 2) was obtained. The results in Figure 10 show that the average maximum capacity over 50 trials for a network with this particular size and connectivity, beyond which performance declines significantly, is around 115 patterns, but that performance also declines linearly prior to this capacity limit as a function of the number of patterns stored. The error bars begin to expand at around 90 patterns, indicating that some networks had already started to fail when they reached this number of stored patterns. Therefore, over the 50 trials analyzed, the maximum safe capacity (below which no network was seen to fail) was deduced to be approximately 90 patterns.
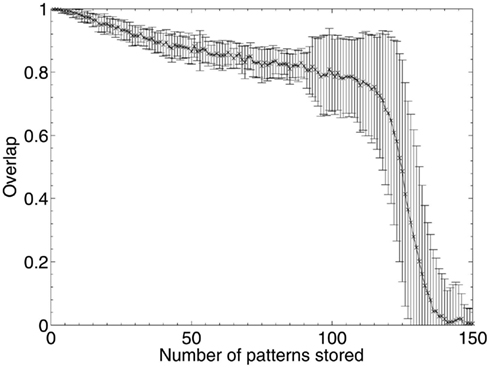
Figure 10. Network capacity (in number of discrete patterns stored) over 50 networks with N = 1200 units and K = 150 Gaussian connections per unit.
Results were then obtained for experiments in which 10, 15, 25, 30, 40, and 50 patterns respectively were stored in different networks, which were then lesioned by the same beta-amyloid process outlined previously. The results for network performance and information contribution for these varying network loading levels are shown in Figures 11 and 12.
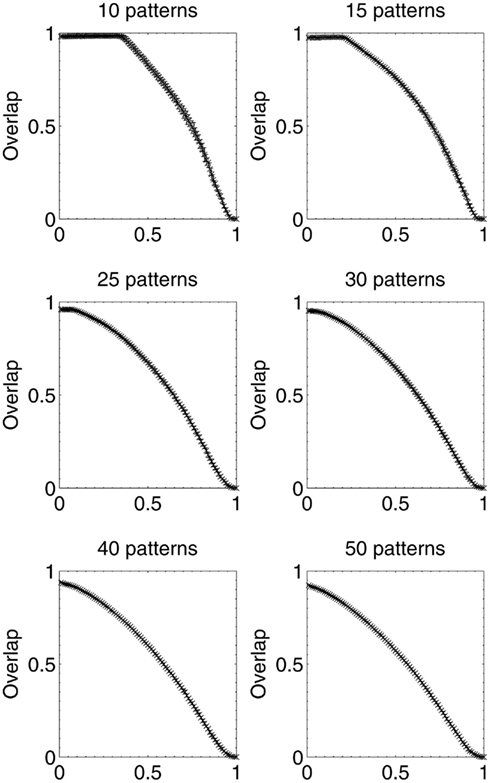
Figure 11. Network performance as neurons are deleted selectively using beta-amyloid progression strategy, for various sizes of pattern sets.
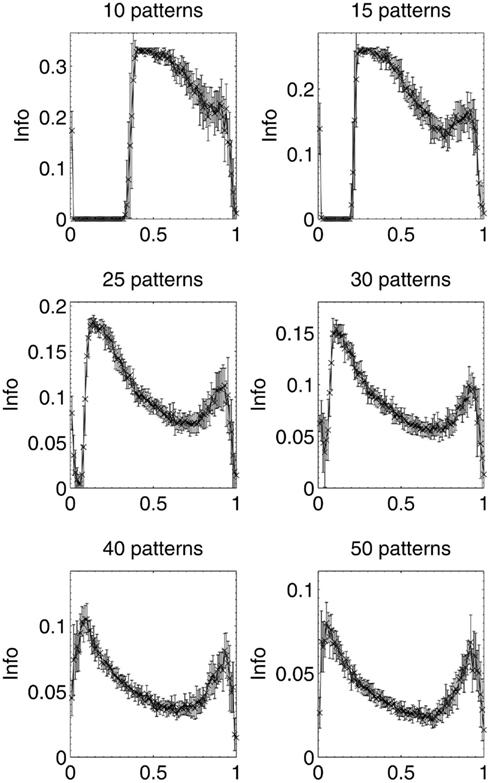
Figure 12. Mean information contribution of neurons deleted selectively using beta-amyloid progression strategy, for various sizes of pattern sets.
These results demonstrate that the extent of the information-selectivity effect depends on the loading level of the network. At low to medium loadings such as 10, 15, 20 (Figure 6), and 25 patterns per network, the effect is clearly visible albeit reduced as a function of the loading level. Beyond 25 patterns per network the effect becomes less pronounced, before all-but-disappearing at 50 patterns (which is more than a 50% loading level when considering that the maximum safe capacity was found to be less than 100 patterns). Even at this high loading level, the initial few deletions are still below the peak information contribution per neuron before the general information decline begins.
At these higher loading levels (40 patterns and above), the network is already noticeably below optimal retrieval performance even before lesioning begins, as can be seen in Figure 10, and this could account for the disappearance of the information-selectivity effect. Loading at these high levels may well be unreasonable in the biological context of the brain due to the increased noise, overlap between patterns, and non-optimal retrieval performance (Treves and Rolls, 1991), meaning that the principle outlined here should still be valid in the context of brain-like loading levels.
5. Discussion
This work has introduced a method for lesioning of computational neural network models via simulated beta-amyloid pathology according to Small’s (2008) theory of synaptic progression in an associative memory model incorporating local, neural field-dependent synaptic compensation (Horn et al., 1996).
Whilst Small highlights the association between high activity, highly connected neurons (e.g., cholinergic and glutamatergic pyramidal cells) and vulnerability to beta-amyloid pathology, the theory does not explain the observation that levels of amyloid deposits do not correlate well with cognitive deficits in early stages of AD (Hardy and Selkoe, 2002; Minati et al., 2009; Savioz et al., 2009). This work presents useful insights into the behavioral characteristics of beta-amyloid pathology within an associative neural network, and provides a potential answer to that question using information theory to measure empirically the information contribution of individual neurons to the network before they are lesioned. It has been shown that Aβ could selectively target neurons with low information contribution following the onset of AD with initially no adverse effect on network performance, but as the reserve of neurons with low information contribution is exhausted, the pathology begins to target neurons with increasing information contribution to the network, and the cognitive decline becomes more apparent and accelerative.
Interestingly, the model also suggests that rather than adversely affecting cognitive performance in the early stages of AD, the preference of beta-amyloid pathology for neurons with low information contribution may actually lead to a small network optimization effect via a form of neural Darwinism, as the removal of relatively insignificant neurons from the network results in shorter pattern retrieval times as well as a small reduction in energy requirements due to the reduction in neural volume. However, this effect is likely to be so small in a real brain as to be very difficult to measure experimentally, and may indeed be insignificant.
This type of neural network model is greatly abstracted from the low-level neurobiological processes occurring in Alzheimer’s disease, and it is also far from a complete model of cortical function, but care has been taken to ensure biological plausibility wherever approximations have been made (e.g., sparse neural coding in stored patterns; Abeles et al., 1990, sparse connectivity between neurons; Churchland and Sejnowski, 1994, activity-dependent rather than one-shot learning; Ruppin and Reggia, 1995a, local field-dependent synaptic compensation; Horn et al., 1996). The model can be shown to fit into the general context of cortical-hippocampal learning, with the network designed such that it obeys O’Reilly and Rudy’s principle that “the neocortex slowly (i.e., over extended periods of pattern presentation) learns about the general statistical structure of the environment, using overlapping distributed representations” (O’Reilly and Rudy, 2000), and incorporates back projections from the hippocampal CA3 to the cortex as according to Rolls and Kesner(Rolls and Kesner, 2006; Rolls, 2010), embodied here in the external input connections to the model which specify enforced activity of units during learning.
Nevertheless, the principles of the relationship between connectivity density and compensation rates explored in section 5 and demonstrated in the model are sufficiently general that they should apply to any neural network (artificial or biological) in which a pathology such as beta-amyloid targets neurons as a function of their increased activity as part of a compensatory mechanism when other connected neurons are targeted by the pathology. It is noted that biases appear when applying information theoretic measures to data, particularly with limited sample sets, and therefore the “true” information contribution measure of neurons in this work are subject to such biases (Paninski, 2003). This is an issue which could be addressed in future work, perhaps by applying Paninski’s methods, or those of Panzeri and Treves (1996).
This work has also demonstrated that neuronal deletion in an associative network model suffers from the fundamental problem that, as all neurons in an associative network are the “output layer,” the deletion of neurons from the network directly alters the output patterns, thus artificially reducing its performance even though the network may not actually be processing its input cues any differently. Such effects could be mitigated in future experiments by functionally separating “processing” from “output” in the model, for example by using a reservoir network (a recurrent neural network with a separate, trained, linear readout layer) and lesioning only the reservoir portion whilst the readout layer remains intact.
Finally, Alzheimer’s disease consists of multiple interacting pathologies including beta-amyloid progression and the hyperphosphorylation of tau protein into neurofibrillary tangles. Previous work introduced a method for simulating tau pathology in the Ruppin and Reggia model of AD (Rowan, 2011), and combination of this tau pathology simulation with the beta-amyloid pathology explored in this work could lead to further insights into the behavioral characteristics of the disease mechanisms. In particular, the precise relationship between the two pathologies is still poorly understood, but is likely to consist of a number of complex self-reinforcing cascades of degradation.
Conflict of Interest Statement
The author declares that the research was conducted in the absence of any commercial or financial relationships that could be construed as a potential conflict of interest.
Acknowledgments
With thanks to John Bullinaria for his comments. Research funded by EPSRC.
Footnote
- ^The direct effects of neuronal deletion upon the output pattern (i.e. leaving aside any network effects) can be mitigated by separating the “processing” from the the “output” in the network and lesioning only the processing layer, for example using a multi-layer perceptron or a reservoir network.
References
Abbott, L. F. (1999). Lapicque’s introduction of the integrate-and-fire model neuron (1907). Brain Res. Bull. 50, 303–304.
Abeles, M., Vaadia, E., and Bergman, H. (1990). Firing patterns of single units in the prefrontal cortex and neural network models. Network 1, 13–25.
Ballatore, C., Virginia, M. Y. L., and Trojanowski, J. Q. (2007). Tau-mediated neurodegeneration in Alzheimer’s disease and related disorders. Nat. Rev. Neurosci. 8, 663–672.
Berridge, M. J., Lipp, P., and Bootman, M. D. (2000). The versatility and universality of calcium signalling. Nat. Rev. Mol. Cell Biol. 1, 11–21.
Borst, A., and Theunissen, F. E. (1999). Information theory and neural coding. Nat. Neurosci. 2, 947–958.
Bullmore, E., and Sporns, O. (2009). Complex brain networks: graph theoretical analysis of structural and functional systems. Nat. Rev. Neurosci. 10, 186–198.
Churchland, P. S., and Sejnowski, T. J. (1994). The Computational Brain. Cambridge, MA: The MIT press.
Demuro, A., Parker, I., and Stutzmann, G. E. (2010). Calcium signaling and amyloid toxicity in Alzheimer’s disease. J. Biol. Chem. 285, 12463–12468.
Duch, W. (2007). Computational models of dementia and neurological problems. Methods Mol. Biol. 401, 305–336.
Hardy, J. (2009). The amyloid hypothesis for Alzheimer’s disease: a critical reappraisal. J. Neurochem. 110, 1129–1134.
Hardy, J., and Selkoe, D. J. (2002). The amyloid hypothesis of Alzheimer’s disease: progress and problems on the road to therapeutics. Science 297, 353.
Horn, D., Levy, N., and Ruppin, E. (1996). Neuronal-based synaptic compensation: a computational study in Alzheimer’s disease. Neural Comput. 8, 1227–1243.
Horn, D., Ruppin, E., Usher, M., and Herrmann, M. (1993). Neural network modeling of memory deterioration in Alzheimer’s disease. Neural Comput. 5, 736–749.
Hynd, M. R., Scott, H. L., and Dodd, P. R. (2004). Glutamate-mediated excitotoxicity and neurodegeneration in Alzheimer’s disease. Neurochem. Int. 45, 583–595.
Kopelman, M. D. (1989). Remote and autobiographical memory, temporal context memory and frontal atrophy in Korsakoff and Alzheimer patients. Neuropsychologia 27, 437–460.
LaFerla, F. M., Green, K. N., and Oddo, S. (2007). Intracellular amyloid-β in Alzheimer’s disease. Nat. Rev. Neurosci. 8, 499–509.
Minati, L., Edginton, T., Grazia Bruzzone, M., and Giaccone, G. (2009). Reviews: current concepts in Alzheimer’s disease: a multidisciplinary review. Am. J. Alzheimers Dis. Other Demen. 24, 95.
O’Reilly, R. C., and Rudy, J. W. (2000). Computational principles of learning in the neocortex and hippocampus. Hippocampus 10, 389–397.
Panzeri, S., and Treves, A. (1996). Analytical estimates of limited sampling biases in different information measures. Network 7, 87–108.
Rolls, E. T. (2010). A computational theory of episodic memory formation in the hippocampus. Behav. Brain Res. 215, 180–196.
Rolls, E. T., and Kesner, R. P. (2006). A computational theory of hippocampal function, and empirical tests of the theory. Prog. Neurobiol. 79, 1–48.
Rolls, E. T., Treves, A., and Tovee, M. J. (1997). The representational capacity of the distributed encoding of information provided by populations of neurons in primate temporal visual cortex. Exp. Brain Res. 114, 149–162.
Rowan, M. (2011). “Effects of compensation, connectivity and tau in a computational model of Alzheimer’s disease,” in Proceeding of the 2011 International Joint Conference on Neural Networks (IJCNN) (IEEE), San Jose, CA, 543–550.
Ruppin, E., and Reggia, J. A. (1995a). A neural model of memory impairment in diffuse cerebral atrophy. Br. J. Psychiatry 166, 19–28.
Ruppin, E., and Reggia, J. A. (1995b). Patterns of functional damage in neural network models of associative memory. Neural Comput. 7, 1105–1127.
Savioz, A., Leuba, G., Vallet, P. G., and Walzer, C. (2009). Contribution of neural networks to Alzheimer disease’s progression. Brain Res. Bull. 80, 309–314.
Skaggs, W. E., McNaughton, B. L., Gothard, K. M., and Markus, E. J. (1993). “An information-theoretic approach to deciphering the hippocampal code,” in Proceedings of the Advances in Neural Information Processing Systems 5, NIPS Conference (San Francisco, CA: Morgan Kaufmann Publishers Inc.), 1030–1037.
Small, H. (2008). Network dysfunction in Alzheimer’s disease: does synaptic scaling drive disease progression? Trends Mol. Med. 14, 103–108.
Treves, A., and Rolls, E. T. (1991). What determines the capacity of autoassociative memories in the brain? Network 2, 371–397.
Tsodyks, M. V., and Feigel’Man, M. V. (1988). The enhanced storage capacity in neural networks with low activity level. Europhys. Lett. 6, 101–105.
Wallenstein, G. V., and Hasselmo, M. E. (1998). “Neural networks and psychopathology:connectionist models in practice and research,” in Are there Common Neural Mechanisms for Learning, Epilepsy, and Alzheimer’s disease? chap. 12, eds D. J. Stein, and J. Ludik Cambridge, 316–344.
Watts, D. J., and Strogatz, S. H. (1998). Collective dynamics of “small-world” networks. Nature 393, 440–442.
Keywords: synaptic scaling, information, amyloid, computational model, associative memory, Alzheimer’s disease
Citation: Rowan M (2012) Information-selectivity of beta-amyloid pathology in an associative memory model. Front. Comput. Neurosci. 6:2. doi: 10.3389/fncom.2012.00002
Received: 14 September 2011; Accepted: 02 January 2012;
Published online: 18 January 2012.
Edited by:
Hava T. Siegelmann, Rutgers University, USAReviewed by:
Simon R. Schultz, Imperial College London, UKChristian Leibold, Ludwig Maximilians University, Germany
Copyright: © 2012 Rowan. This is an open-access article distributed under the terms of the Creative Commons Attribution Non Commercial License, which permits non-commercial use, distribution, and reproduction in other forums, provided the original authors and source are credited.
*Correspondence: Mark Rowan, School of Computer Science, University of Birmingham, Birmingham B15 2TT, UK. e-mail: m.s.rowan@cs.bham.ac.uk