Markovian Analysis of the Sequential Behavior of the Spontaneous Spinal Cord Dorsum Potentials Induced by Acute Nociceptive Stimulation in the Anesthetized Cat
 Mario Martin1*
  Javier Béjar1
  Gennaro Esposito1
  Diógenes Chávez2
  Enrique Contreras-Hernández2
  Silvio Glusman2,3
  Ulises Cortés1,4
  Pablo Rudomín2,5
- 1Universitat Politècnica de Catalunya (BarcelonaTech), Barcelona, Spain
- 2Department of Physiology, Biophysics and Neurosciences, Center for Research and Advanced Studies, National Polytechnic Institute, Mexico City, Mexico
- 3Stroger Cook County Hospital, Chicago, IL, USA
- 4Barcelona Supercomputing Center, Barcelona, Spain
- 5El Colegio Nacional, Mexico City, Mexico
In a previous study we developed a Machine Learning procedure for the automatic identification and classification of spontaneous cord dorsum potentials (CDPs). This study further supported the proposal that in the anesthetized cat, the spontaneous CDPs recorded from different lumbar spinal segments are generated by a distributed network of dorsal horn neurons with structured (non-random) patterns of functional connectivity and that these configurations can be changed to other non-random and stable configurations after the noceptive stimulation produced by the intradermic injection of capsaicin in the anesthetized cat. Here we present a study showing that the sequence of identified forms of the spontaneous CDPs follows a Markov chain of at least order one. That is, the system has memory in the sense that the spontaneous activation of dorsal horn neuronal ensembles producing the CDPs is not independent of the most recent activity. We used this markovian property to build a procedure to identify portions of signals as belonging to a specific functional state of connectivity among the neuronal networks involved in the generation of the CDPs. We have tested this procedure during acute nociceptive stimulation produced by the intradermic injection of capsaicin in intact as well as spinalized preparations. Altogether, our results indicate that CDP sequences cannot be generated by a renewal stochastic process. Moreover, it is possible to describe some functional features of activity in the cord dorsum by modeling the CDP sequences as generated by a Markov order one stochastic process. Finally, these Markov models make possible to determine the functional state which produced a CDP sequence. The proposed identification procedures appear to be useful for the analysis of the sequential behavior of the ongoing CDPs recorded from different spinal segments in response to a variety of experimental procedures including the changes produced by acute nociceptive stimulation. They are envisaged as a useful tool to examine alterations of the patterns of functional connectivity between dorsal horn neurons under normal and different pathological conditions, an issue of potential clinical concern.
1. Introduction to the Problem
Previous work (Manjarrez et al., 2000, 2003; Chávez et al., 2012) has indicated that some specific classes of spontaneous cord dorsum potentials (CDPs) appear specially associated with the activation of spinal pathways that lead to primary afferent depolarization and presynaptic inhibition. These and other studies led to the proposal that in the anesthetized cat these CDPs are generated by a segmentally distributed network of dorsal horn neurons with structured (non-random) patterns of functional connectivity between them, and that these patterns can be changed to other, also non-random and stable configurations, after the activation of nociceptive pathways induced by the intradermic injection of capsaicin.
Quite recently, we developed a Machine Learning procedure that allows the automatic selection and classification of CDPs (Martín et al., 2015). We used this procedure allowed us to automate the selection and systematic analysis of the spontaneous CDPs recorded along several hours of continuous recording. This revealed emerging non-random classes of CDPs that could be identified and compared among them. The resulting configurations behaved in a similar way across different experiments.
We now use this feature to build dictionaries of CDPs. That is, of a repertoire of specific classes of CDPs produced by neuronal activity, that allow us to discretize the recorded data as a sequence of symbols. We use a Markovian approach to determine (a) the extent to which different sequences of CDPs obtained from the same experiment are similar and (b) the dependence of spinal changes induced by nociception on supraspinal modulatory influences (see Section 6). To this end, we analyzed raw data from already published studies performed in anesthetized cats. We found that in both cases, those ensembles generate emergent phases of activity that are identifiable and follow a Markov chain of order one. That is, the system has memory in the sense that firing of neurons is not independent of the preceding neuronal activation. In view of the concurrent inhibition that follows individual CDPs (Contreras-Hernández et al., 2015), it is suggested that the statistical dependence between successive CDPs results, at least in part, from a structured (non-random) activation of the inhibitory GABAergic and glycinergic pathways that follow the generation of particular classes of CDPs.
In addition, we use this markovian property to build a procedure to identify portions of signals as belonging to a specific functional state of the connectivity between the neuronal networks involved in the generation of particular classes of CDPs. This identification procedure appears to be useful for the analysis of the sequential behavior of the ongoing CDPs recorded from different spinal segments in response to a variety of experimental procedures, among them, the changes produced by acute nociceptive stimulation induced by the intradermic injection of capsaicin.
Results we present in this paper indicate that: 1. CDPs sequences cannot be generated by a renewal (memoryless, or Markov order zero) stochastic process. 2. By modeling the CDPs sequences as generated by a Markov order one stochastic process it is possible to describe some functional features of the activity of the dorsal horn neurons involved in the generation of the CDPs. Based on the transition matrix calculated for experimental sequence it is possible to determine the functional state which produced that sequence. These procedures are envisaged as a useful tool to examine alterations in the time domain of the patterns of functional connectivity between dorsal horn neurons under normal and different pathological conditions, an issue of potential clinical concern.
1.1. Outline of the Paper
Section 2 describes the procedure for the acquisition of the signals and the experimental setup. It includes the definition of the set of experimental procedures performed in anesthetized cats. In Section 3 we detail the methodology used to extract the symbols corresponding to the sequence's elements of the recorded signals. Section 4 deals with the probabilistic modeling to describe the appearance of different symbols in a raw recording. From this modeling we can see that each experimental maneuver shows a different probabilistic distribution in pairs of consecutive symbols.
In Section 5 we prove, using statistical methods, that the sequence of symbols is markovian of order one. Section 6 shows how to make profit of this markovian property to identify to which among several experimental maneuvers a given sequence of data belongs. We also show the performance of this method using data from available experiments. Finally, Section 7 provides some conclusions and future directions of this work.
2. Data Acquisition
In this work we used data obtained from experiments performed in anesthetized cats, paralyzed, and maintained under artificial ventilation (see Chávez et al., 2012 for a general description of the experimental procedures). Briefly, spontaneous CDPs were recorded by means of a matrix of silver ball electrodes (from 8 to 12 depending on the experiment) placed on the cord dorsum in both sides of the L4–L7 spinal segments against a similar number of indifferent electrodes, each inserted on the paravertebral muscles close to the active electrode using AC amplifiers with filters set from 0.3 Hz to 10 kHz.
The experiments lasted between 6 and 10 h and the signals were recorded and stored digitally for off-line analysis. The recordings made during the experiments are divided in different steps, each one of them composed by a number of independent time steps (s1…sj) of equal time duration (e.g., divided in sets of lasting 10 minutes of continuous recording).
The aim is to detect the changes of the patterns of neuronal activity in the dorsal horn produced by the different maneuvers performed during the experiment. All the studied experiments record the activity for non contiguous periods where it is assumed that evident changes would appear.
The initial step of the experiments includes the spontaneous CDPs recorded under control conditions during a 30–60 min period. It is referred as control period (ctrl). It measures the events in the dorsal horn neurons of the cat spinal cord in the absence of purposeful stimulation. Data are registered for a number of successive time steps before performing a specific procedure.
In this set of experiments we also examined changes in spontaneous CDPs induced by nociceptive stimulation produced by the intradermic injection of capsaicin into the left footpad in preparations with intact neuroaxis. It is referred as capsaicin period (capsa). The injection of capsaicin activates the nociceptive peripheral receptors that send signals mostly to the dorsal horn neurons located in the L5 and L6 lumbar segments. This period has a duration of 3–4 h. Some of the data presently analyzed were obtained from experiments aimed to examine the effects of capsaicin injected after acute spinalization in order to eliminate supraspinal descending influences in the generation of the spontaneous CDPs. For this purpose the spinal cord was cooled and sectioned at T10 level. This maneuver is referred as spinalization period (esp).
Table 1 shows the experiments presently analyzed and the procedures followed in each of them. In the text, the different procedures are labeled as ctrl, capsa, and esp, and the numbers that follow refer to the order in which they were recorded. For example, ctrl2 refers to the second time step recording of 10 min during the control period of the experiment.
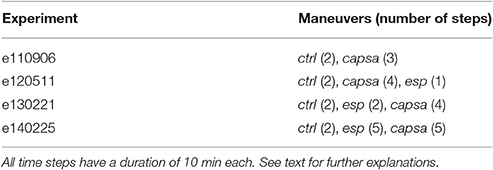
Table 1. Maneuvers performed in the experiments presently analyzed and the number of time steps.
Through all the paper the experiment e130221 will be used as running example to illustrate the different steps of the methodology and its results. In Section 6.1 the results from the other experiments will be discussed.
3. Sequence Extraction
Simultaneous recordings from the cord dorsum reveal spontaneous potentials of different shapes and amplitudes, as shown in Figure 1. The amplitudes and distributions of these potentials are quite variable, but specific patterns of CDPs simultaneously generated in different spinal segments are also observable during a given time step (see Chávez et al., 2012).
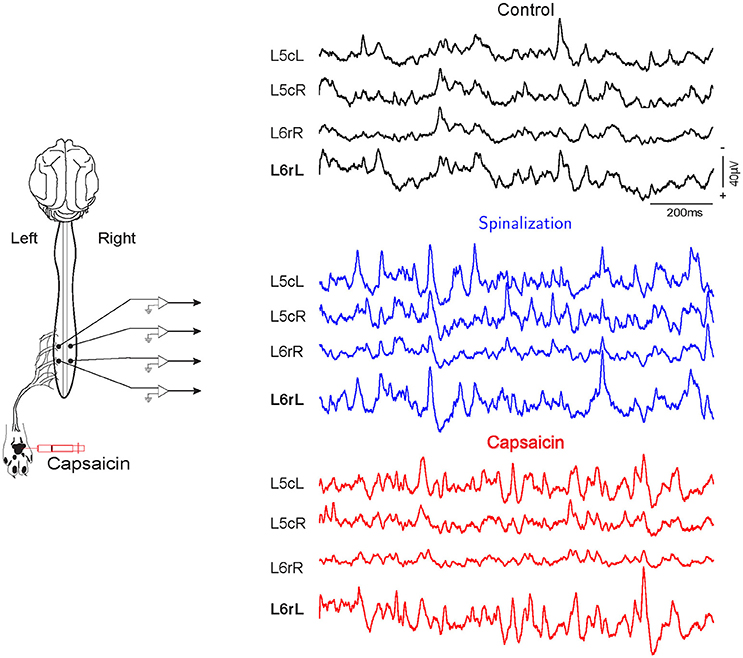
Figure 1. Spontaneous CDPs recorded from L5 to L6 lumbar segments during control, after spinalization and 60 min after the subsequent intradermic injection of capsaicin. Note that the CDPs increased after spinalization and that capsaicin had different effect on the CDPs recorded in the left and right side of the spinal cord. L, left; R, right; c caudal; r, rostral. Data obtained from experiment e130221 (negative voltages plotted upward).
In order to extract a sequence of CDPs from the recordings, we use the methodology for the analysis of populations of neuronal signals described in Martín et al. (2015) and Béjar et al. (2015). This methodology comprises several phases, from the extraction of the events in the signal to the analysis of the events behavior at different levels of granularity in the spatial and temporal dimensions.
The first three phases of the methodology aim to build dictionaries of the events relevant for the analysis. In our domain, the relevant events are the CDPs. As an initial step, we apply an automated and unsupervised CDPs detection method assuming smoothness in the definition of the CDPs candidates and considering that they appear as peaks in the signal. It is assumed that the background noise in the recordings is stationary, essentially Gaussian and also independent from the neuronal signals. Under these assumptions, an automatic event extraction algorithm detects peaks on the signal using a sliding window large enough to contain the events. The signal inside the window is smoothed and selected as CDP candidate if there is a peak at its center and holds some shape constraints. The smoothing is used only to detect the position of the maximum of the window, and it also allows to maximize the ratio noise signal so it is minimized the amount of spurious CDPs detected. We have determined experimentally that a filter that eliminates all frequencies higher that 70 Hz is a good value for this parameter (see Martín et al., 2015 for more details). This process is done for all the recorded signals, so after this, we have the positions of all CDPs candidates for all the experiment.
After these candidates have been identified, the steps before the generation of the basic set or dictionary of events proceed as follows. The time of the maximum value within each selected signal window is considered the time-stamp of the CDPs. Using experts' knowledge, a suitable time window around the identified event maximum was defined. After extracting the time window, data is preprocessed in order to prepare it for clustering. Selected CDPs in time windows of duration Tw (100 ms) are resampled to reduce dimensionality from 10 to 1.6 kHz. To ease the comparison of different CDPs, also a potential offset is removed by subtracting the average of a subset of the initial points of the window corresponding to the beginning of the CDP. Given that the signal must be sufficiently smooth, CDPs are processed using PCA as feature extraction method to compute the most relevant dimensions that describe the whole set of identified CDPs. Finally, only those dimensions are used to reconstruct each CDP. In our experiments we use the components that explain 98% of the variance that is enough to obtain a good reconstuction of the CDPs and eliminates all the high frequency variations in the signal. After this step we have a collection of CDPs for each sensor smoothed and with their initial baseline aligned.
To build the dictionary for CDPs extracted from each sensor, the k-means algorithm is used. To select the size of the dictionaries (number of symbols), different methods for the estimation of the number of clusters are used to assure the consistency of the result. Figure 2 shows a shape dictionary obtained from potentials extracted from a specific segment in one of the experiments analyzed. This procedure was introduced in Martín et al. (2015), and shows a good performance to analyze and characterize the changes that the experimental maneuvers cause in the system.
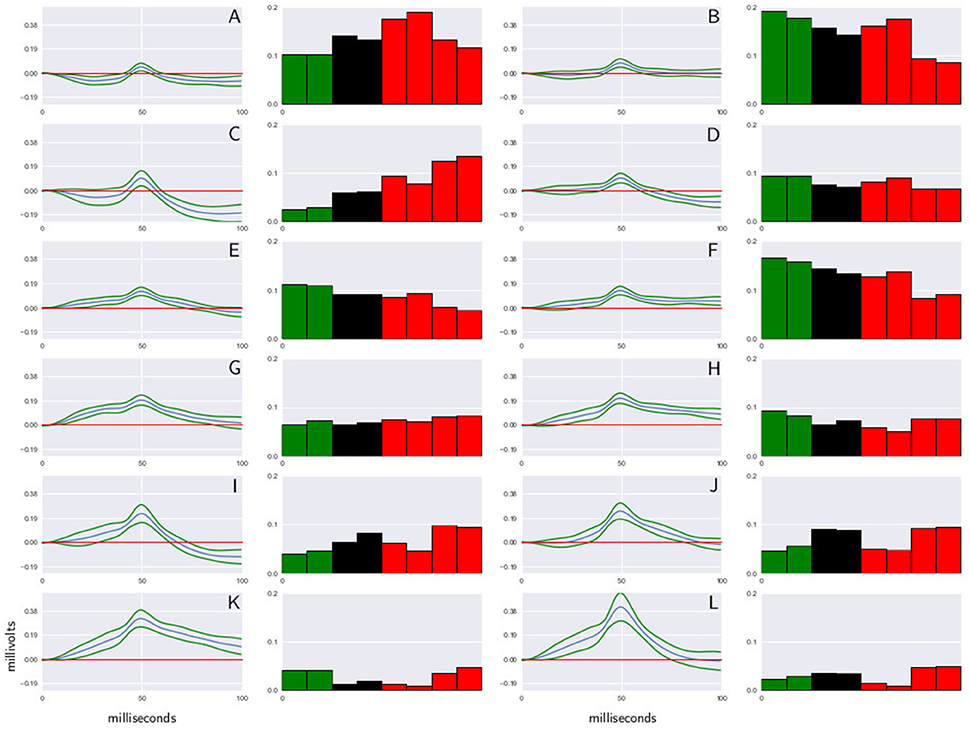
Figure 2. Shape dictionary obtained from recordings made in the L6rL segment, and the probability occurrence for each shape at each time step in experiment e130221. Each shape corresponds to the centroid of a cluster of CDPs and a standard deviation around the prototype. In the histograms green columns indicate the control, red columns the capsaicin, and black columns the spinalization periods. CDPs amplitude is measured in millivolts, time in milliseconds. Further explanations in text. (A–L) Represent the label assigned to each CDP class.
It may be seen that this procedure allowed identification and grouping of twelve different classes of the spontaneous CDPs generated in the rostral half of the L6 segment in the left side (L6rL). This experiment was performed to examine the effects of the intradermic injection of capsaicin produced in a previously spinalized preparation. That is, in a preparation deprived of descending influences known to modulate the functional connectivity between dorsal horn neurons in response to a nociceptive stimulus. As shown by the histograms in Figure 2, the behavior of the different classes of spontaneous CDPs in response to the spinal section and the subsequent injection of capsaicin was not uniform: after spinalization the probabilities of occurrence were reduced in some classes of CDPs and increased in others. Likewise, after capsaicin the probabilities of occurrence of some classes of spontaneous CDPs were transiently increased and were reduced or barely affected in others. This behavior is in contrast with the pronounced changes produced by capsaicin in preparations with intact neuroaxis (e.g., experiments e110906 and e120511; see also Martín et al., 2015) and underscores the role played by the supraspinal control exerted on the capsaicin-sensitive spinal neuronal ensembles that generate the different classes of spontaneous CDPs (see Section 7).
As next step, the signal is discretized using symbols from the dictionary obtained for the experiment. For each sensor and step of the experiment, the sequence of extracted CDPs is labeled using the dictionary. The labels are assigned considering the euclidean distance to the prototypes of the corresponding dictionary. The label of the closest prototype is the label assigned to each CDP. A pause symbol ($ symbol) is introduced representing the lack of identifiable activity for a period of time. Its duration is estimated using the distribution of the time interval between consecutive CDPs. The mean of this distribution is taken as the duration of one pause period. Multiple pauses are included if the distance between consecutive potentials is a multiple of this estimated time. Notice that pause symbols correspond to parts of the signal not selected as CDPs and thus discarded. They do not correspond to periods of lack of activity in the signal. These are considered noise, random fluctuations of the signal or possible CDPs that did not have enough quality to be considered. Consequently, pauses do not have a shared shape.
This discretization yields a string representing the sequence of events for each segment and experimental maneuver. This process is represented in Figure 3. Typically, recordings of 10 min generate sequences of a length of 6,000 symbols at the most.
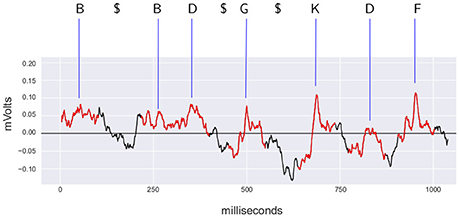
Figure 3. Example of discretization of the signal recorded from L6rL from experiment e130221. In red, the time intervals identified as spontaneous CDPs by the CDP detection algorithm used by the methodology. Each CDP is labeled using the shapes dictionary obtained from the segment L6rL for this experiment using the closest shape according to the euclidean distance. Symbol $ represents a pause in the sequence because the signal was not identified as a CDP (shown in black). The labels for the CDPs and the pause symbols form the discretized sequence. The CDPs in the figure correspond to the 0.3 hz–10 khz filtered signal resampled to 1.6 khz before processing with PCA.
4. Sequential Study of CDPs
In a previous work (Martín et al., 2015) we showed that the set of symbols in the dictionary remains the same along the whole experiment. One possibility is that the generation of particular classes of CDPs results from the activation of different local and relatively stable ensembles of neurons (i.e., to populations restricted to one lumbar segment). It is also possible that some classes of CDPs are produced by a neuronal network distributed along several lumbar segments that acquires different configurations of functionally connectivity depending on the level of neuronal synchronization, as shown in Contreras-Hernández et al. (2015). In either case, the relations between the spontaneous CDPs may provide significant clues on the patterns of functional connectivity between the neuronal sets involved in their generation and on how these patterns change under different experimental situations.
In this context, we will study if the firing of an ensemble of neurons (and so, the appearance of a specific CDP) depends on the last activated ensemble of neurons (the kind of the last appeared CDP). Existence of this dependence would mean that there is a minimal degree of memory in these neuronal networks, so firing of local neuronal groups is not independent from the previous activity, which may well depend on inhibitory interactions between neuronal activity as recently shown in Contreras-Hernández et al. (2015).
As a first step to study the sequential dependence among CDPs and its implications, the raw signal is translated into a sequence of symbols using the method already described in Section 3. Figure 3 provides an example of spontaneous CDPs recorded from segment L6rL during control period (ctrl) and its translation as a sequence of symbols. This exemplifies the kind of sequence of data that will be used for the analysis along this paper.
To study the temporal dependence between CDPs firing, we will start building for every pair of CDPs a transition probability matrix. Position row i and column j of the matrix will contain the conditional probability P(cj|ci) that after appearing CDP of kind ci, the next CDP will be of kind cj. There is a special column that represents the pause ($), that is, the different probabilities that after registering a CDP, no other detectable CDP will appear in 100 ms. Reciprocally, there is a special row that represents the probability that after a pause, another CDP cj appears. The probability values are estimated by counting the pairs of consecutive CDPs appearing in the whole sequence
Figures 4–6 show three transition matrices for the same segment L6rL from different time steps of the experiment: Figure 4 in a control step, Figure 5 after spinalization, and Figure 6 after 60 min of the intradermic injection of capsaicin. A visual inspection of the matrices shows:
1. Not all positions in a column have the same probability values. This finding seems to support the proposal that there is a dependence between CDPs in time firing, because all probabilities of generating a CDP (all values in the column) are different depending on the previous observed one (row in that column).
2. Visually they appear to be quite different: So, we would expect different sequences of CDPs in different steps of the experiment. For instance, sequences belonging to ctrl would be different from those in capsa or esp. This observation suggests that it should be possible to predict from a sequence to which step of the experiment it belongs.
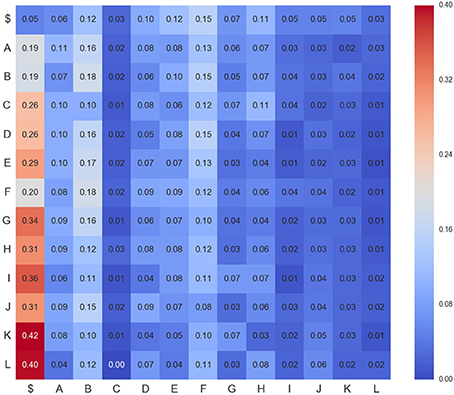
Figure 4. Transition matrix for CDPs recorded from segment L6rL at the beginning of the experiment e130221 (ctr1). Position row i, column j shows probability of transition from CDPi toward CDPj. Compare this figure with Figures 5, 6.
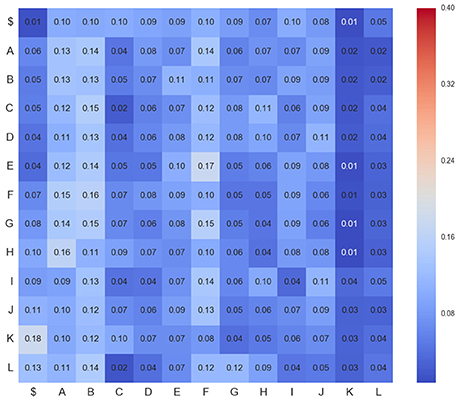
Figure 5. Transition matrix for CDPs recorded from segment L6rL after spinalization (esp1). Same experiment and display as that of Figure 4.
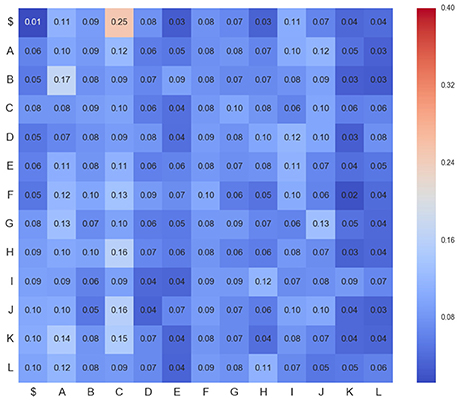
Figure 6. Transition matrix for CDPs recorded from segment L6rL 60 min after the intradermic injection of capsaicin in the already spinalized preparation (capsa3). Same experiment and display as that of Figure 4.
However, these are merely visual observations and a formal analysis of them is needed. In Section 5 we will study the first proposal and in Section 6 we will study the second one.
5. Markovian Analysis
Time dependence between consecutive events can be formalized using Markov chains (Isaacson and Madsen, 1976; Florian et al., 2011). Such formalism allows studying processes with a kind of memory in which the probability of the current event depends only on the last n events occurred. Parameter n is called the order of the Markov chain and describes the degree of memory of the system. Considering the CDPs recorded in the sequence as events, we could model the sequence as a Markov chain of order n where:
We will start proving that the sequence of CDPs recorded in all spinal segments can be modeled as a Markov chain of order one. Later we will show that the sequence is not of order higher than one.
5.1. First Order Tests
The standard way to check the markovian nature of a sequence is to perform a Pearson χ2 hypothesis test (Anderson and Goodman, 1957), which compares the goodness of fit of an observed distribution with respect to an expected distribution with H0 stating that there is no difference between them.
In our case, the test is performed by comparing the observed distribution of consecutive pairs appearing in the recorded sequence, with the expected distribution that should appear assuming independence of a CDP with respect to the previous one. The observed distribution consists in matrix O that contains in position i, j the number of times that CDP cj was preceded by CDPs ci in the recorded sequence. The expected distribution matrix E under the independence hypothesis stores in position i, j the expected number of times CDP cj would be preceded by CDP ci under the independence hypotheses. This number is computed as:
where P(cj) and P(ci) are the frequency of CDPs cj and ci respectively in the whole recording, and n is the number of CDPs recorded. Notice that join probability P(cj, ci) = P(cj)P(ci) under the independence hypothesis. To translate this probability to actual expected events, we multiply this joint probability by n.
Hence, H0 claims that the sequence of CDPs recorded is generated by a renewal stochastic process and thus distribution O is statistically similar to E. H0 holding at a significant p-value would mean that the probability of appearing of a CDPs does not depend on the previous recorded CDP.
Once we have the observed and the expected frequencies, we compute the test-statistic
that follows a χ2 distribution with n(n−1) degrees of freedom. This statistic measures the differences or divergence of the observed distribution O with respected to the H0-expected distribution E. The higher the value, the higher the divergence.
In the experiments shown in Table 1, for all lumbar segments and time steps of the recorded data, resulted that computed value χ2 was larger than expected, returning a p-value [following the distribution]) lower than 0.0001. So H0 is extremely unlikely and, therefore, H0 must be rejected in all cases.
One problem with χ2 test is that it assumes that events follow a normal distribution (χ2 distribution is the sum of squared normal distributions), which has not been proved. So, we did a complementary test that will also be helpful later on to study possible higher orders for the Markov chain.
As in the previous case, we establish a H0 hypothesis stating that the sequence is generated by a renewal stochastic process. H0 now will be tested with a randomized test using surrogate data (van der Heyden et al., 1998). We generate 10,000 random sequences under H0 hypothesis (each sequence with the same length than the original one and definitely not markovian), keeping the frequency of each CDP equal to that of the original sequence. Each sequence is simply generated as a random permutation of the original sequence, so each one maintains the frequency of each CDP but any markovian structure is removed because the previous CDP is randomly changed.
If the original sequence is not markovian, it is expected to find that the divergence of O with respect to E computed using Equation (4) is similar to the divergence of probability matrices obtained from surrogate data to E. So, we computed for each of the 10,000 randomized sequences the divergence in their distribution with respect to the expected matrix.
Results showed that all randomized sequences had divergence smaller than the original sequence. We could expect some of the randomized sequences to have, by chance, a smaller divergence value than the original one. The number of such sequences would determine the p-value for hypothesis H0. None of them had a higher deviation, so we conclude that the p-value for H0 is lower than 1 over 10,000. Thus, as expected, H0 is again rejected.
5.2. Higher Orders Tests
We also tried to test if the markovian process is of order two. That would mean that appearance of one CDP depends on the last two preceding CDPs. Given that we know that the sequence is at least of order one, now hypothesis H0 is that the sequence is not of order two.
In this case, building a χ2 test is difficult as many of the entries in the observation matrix become zero. Notice that now transition matrices are from pairs of CDPs to a single CDP, so the size of matrix O is n3. For our experiment, with 13 symbols we have 2.197 entries in the matrix. With sequences of at the most 6,000 symbols we can not compute a reliable statistic. This, added to the hypothesis of normal distribution, motivated us to use a randomized test. Again, we had to generate randomized sequences following H0, that is, the frequency of each pair of consecutive CDPs is maintained as in the original sequence, but removing possible second order dependencies, thus removing existing dependencies among triplets of consecutive CDPs. This randomization can be done following the Whittle's algorithm (Pethel and Hahs, 2014). We reduced the number of randomized sequences from 10,000 to 1,000. With that number of surrogate examples, we have enough power to estimate a significant p-value of 0.001.
In all experiments described in the paper, we had an average p-value of 0.34, which is not enough to reject H0, so we must conclude that most probably the sequences are not of order two.
We don't have sufficient data to produce a statistically significant test for higher orders of dependence, so conclusion should be that sequences of CDPs cannot be explained by a renewal stochastic process and that they should be modeled by a markov process at least of order 1.
6. Predicting Sequences
Once we know that CDPs sequences are markovian of order one, we wonder if we can take advantage of this effect to recognize, given a short sequence of raw recording, to which step of the experiment it belongs.
We explore this possibility by building a transition matrix (ml, s) for each lumbar segment l in step s of the experiment. This matrix represents our model of the sequence. Such models consist in the set of transition probabilities between each pair of CDPs:
where probabilities of transitions P(ci|cj) are estimated from the sequence Cl, s of CDPs recorded in lumbar segment l and step s. This set of probabilities corresponds to the observed transition matrix, used in previous markovian tests and depicted in Figures 4, 6. Table 2 contains a description of the notation.
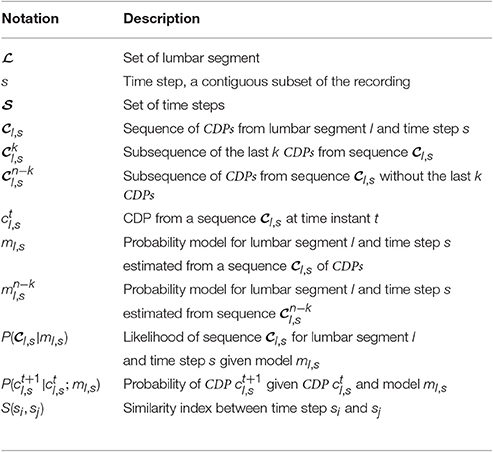
Table 2. Description of major symbols.
The complete experiment is modeled by set :
where is the set of studied lumbar segments, and is the set of recorded temporal steps. Remember that a temporal step consist in data recorded that spans for several minutes, usually 10, during the experiment.
The Markovian property of conditional dependence limited to only the last CDP, allows us to easily compute from a model ml,si the likelihood to generate data Cl,sj recorded in another time step sj.
Given that we have a markov process of order one, the probability for a CDP ct+1 depends only on the previous CDP ct, so for a lumbar segment l and time step si and model ml,si its probability can be defined as:
For a sequence of CDPs Cl,sj, the probability of each individual CDP is dependent only on the previous CDP, and so independent of the other ones. In this case, the probability of the sequence P(Cl,sj|ml,si) can be factorized as the product of the individual conditional probabilities:
where P(Cl,sj|ml,si) is the probability for model ml,si to generate sequence Cl,sj, n is the length of sequence Cl,sj, and is the probability in model ml,si of occurring in position t+1 of sequence Cl,sj given that in position t of the same sequence appeared .
Instead of working with probability values, we will work (for numerical stability reasons) with the logarithm of the probabilities:
6.1. Experiments
To test if likelihood can help to recognize for a sequence of recorded data the type of time step it belongs to, we performed the following experiment (see Figure 7): for each lumbar segment l and time step s, we extracted sequences consisting of its last 100 CDPs. This corresponds roughly to 12 s of recorded data. We call this sequences . The task will be to recognize the source sequence from which a sequence of 100 CDPs was extracted. Using the remaining data in the sequence (), we built a model . Notice that the probabilities are now computed using a shorter sequence of data (all data recorded except the last 100 CDPs). This is done with the purpose of implementing a cross-validation procedure, avoiding the use of the testing sequence to build the model. After this procedure is performed, we have for each step s and lumbar segment l, a sequence of 100 CDPs () and a model .
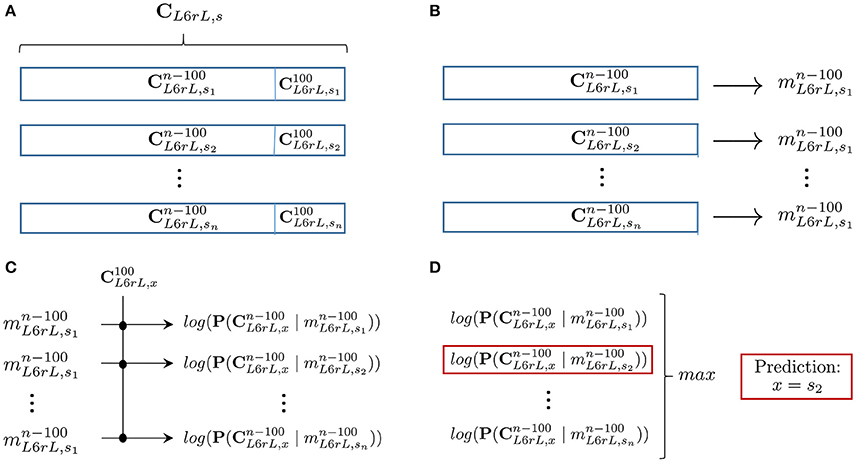
Figure 7. Summary of the prediction process described in Section 6.1 for segment (L6rL): (A) For each 10 min step, we remove the last 100 CDPs of the recorded sequence (). (B) Building, for each step of the experiment, the model with the remaining data (). (C) Given an unknown sequence of 100 CDPs, computation of the log-likelihood of each model for that particular sequence. (D) Obtaining the model with maximum log-likelihood and return prediction of membership. Average prediction accuracy for all segments in several experiments is shown in Table 3.
Subsequently: for a given lumbar segment l, we randomly selected a sequence of last 100 CDPs of unknown origin. The task consisted in trying to predict the time step s from which it was extracted. In order to do so we computed, using equation 8, the likelihood of each model to generate . The model with higher likelihood should belong to the time step that originated the sequence. However, notice that there may be several recordings, each one 10 min long, for each step of the experiment.
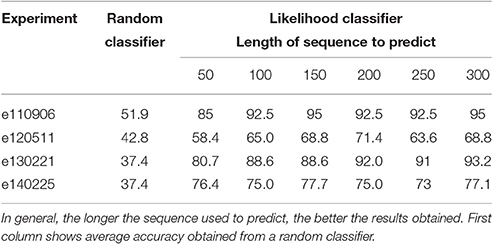
Table 3. Average percentage of success in membership prediction for all experiments with respect to the length of the sequence.
For instance, we have in experiment e130221 two control recordings, two more spinalization recordings and, finally, four capsaicin recordings. Trying to predict for that experiment where the sequence of the last 100 CDPs of sensor L6rL of ctrl1 () belongs, returns the following log-likelihood values for each model:
Likelihood for model ctrl1: -217.56
Likelihood for model ctrl2: -216.50
Likelihood for model esp1: -253.80
Likelihood for model esp2: -247.84
Likelihood for model capsa1: -252.60
Likelihood for model capsa2: -360.21
Likelihood for model capsa3: -261.66
Likelihood for model capsa4: -267.26
Notice that log-likelihood values are always negative (given that probabilities are lower or equal than 1) and that the higher the value of the log-likelihood is, the higher the likelihood. We will consider a success when the predicted sequence belongs to the right time step. In the example shown above, the most likely model to generate the sequence is ctrl2, because it has the highest log-likelihood. We take it a success in prediction because it corresponds to a control step recording.
This procedure has been repeated for all testing sequences of each state s for all lumbar segment l, and success in prediction was averaged. For instance, in experiment e130221, the average of success in prediction is 88.6%. A random classifier would have a success rate of 37.4% in this case.
Table 3 shows average prediction accuracy among all segments and time steps in all the considered experiments. It also shows how accuracy changes as the length of the sequence used to predict also varies. For larger sequences the success rate is higher. For comparison, the table also shows accuracy of a random classifier for each experiment. Each one has a different result for the random classifier because each experiment has a different number of time steps for each kind (see Table 1). Values for the random classifier have been obtained through a standard Montecarlo estimation.
6.2. Results
Notice that predictions are not always 100% successful. However, instead of considering that as an error, we think that it also could explain something about the inner structure of the spinal neuronal connectivity.
For instance, in experiment e110906 100% accuracy is consistently achieved in all segments except in segments L6rR, L5rR, L5cR, all of them from the right side of the cat's spinal cord. In all experiments, the injection of capsaicin was applied in the left hindlimb, and this explains the different effect in the right side of the spinal cord (see also Figure 1).
Nevertheless, though prediction results of a particular recording of a given time step for a lumbar segment could not be always accurate, the consensus of all lumbar segments it is very accurate as shown in Table 4 that provides a detailed view of results for experiment e130221. Notice that considering the most common prediction for all lumbar segments in a given time step, results are 100% correct in all experiments (Rokach, 2010).
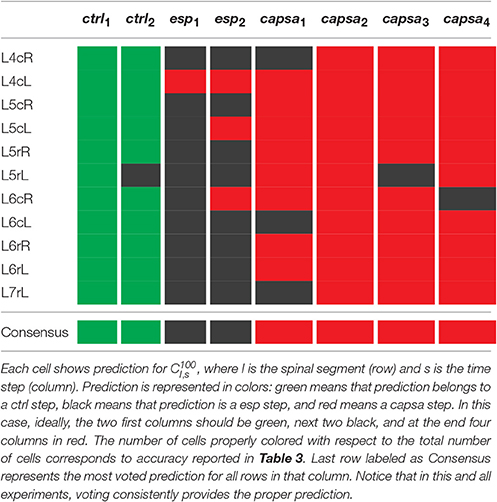
Table 4. This table details the prediction results in experiment e130221.
Finally, by examining the errors in prediction, we can see that in most cases the right prediction has the second highest log-likelihood, and it is very close to the highest one. This can be observed in Table 5 where we change the successful prediction criteria to have the right prediction among the k models with higher log-likelihood. Notice how precision is increased as we are more permissive in this criteria.
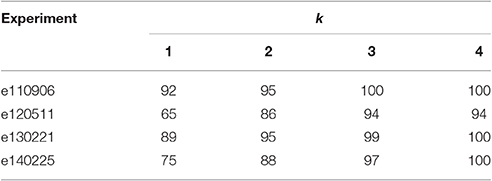
Table 5. Percentage of success defined as proper prediction among the set of k models with higher log-likelihood.
These results suggest that the likelihood approach used allows a valid prediction of the step where data were originated, even for small sequences of data. It also encourages us to try to build a similarity index between different steps of the experiment in order to understand the high level behavior of the neural networks during an experiment.
7. Discussion
7.1. About the Method
In this paper we used data from four experiments (see Table 1) to identify a class of Markov processes that describe the local interactions between the populations of dorsal horn neurones which generate the spontaneous CDPs examined by Contreras-Hernández et al. (2015) and Béjar et al. (2015).
We found that in these experiments the spontaneous CDPs recorded from a particular spinal segment are markovian and have order one, as shown in Section 5. That is, the generation of a particular type of CDP depends on the type of the preceding CDP. In addition, we also found that this markovian property can be used to build a procedure to identify portions of signal as belonging to a specific functional state of the connectivity between the neuronal networks involved in the generation of the CDPs. The functional implications of these findings are discussed in Section 7.2. Although, our results agree with the findings reported by Contreras-Hernández et al. (2015), the functional organization of the ensembles of neurons that produce this information has to be further investigated. To this end, and based on the idea that the studied processes are markovian (see Section 6), we introduced a method to predict the membership of a sequence of the last 100 CDPs of a time step red (see Figure 7). In Table 3, we show the accuracy of this method applied to the four selected experiments to validate the hypothesis.
The log-likelihood of a subsequence given a model can also be used as a similarity criterion among time steps (s ∈ S). This allows to partition the time steps according to their similarity and to define a set of classes characterizing the different behaviors during an experiment. These classes are still to be characterized and further studied. We believe that this analysis will contribute to understand how the patterns produced by ensembles of neurons change during different experimental situations such as nociceptive stimulation (capsa) or acute spinal lesions (esp).
Some concerns could arise about the impact of the preprocessing of raw signal on the obtained results. Specifically there are few parameters that could impact on the extracted sequences used to test the markov properties of the signal. First of all, for the extraction of the CDPs we work on the raw signal (at 10 kHz frequency) filtering frequency only to detect the position of the signal maximum in the selected windows. Filtering involves the elimination of frequencies higher than 70 Hz, enough to filter out most of the noise. In Martín et al. (2015) we provide details about the effect of different frequency cutoffs and the relative signal-to-noise ratio.
Another parameter affecting the sequences is represented by the data denoising. To this end PCA is performed allowing to reconstruct signals using PCA components accounting up to 98% of the variance. As a result, a large portion of the high frequency noise is eliminated without significantly compromising the shapes of the selected CDPs.
Finally, last parameter affecting the sequences selection is represented by the number of clusters used to compute the symbols dictionary. We implemented an optimal methodology for selecting the best suited number of clusters for the set of CDPs (Martín et al., 2015). The proposed methodology generates the optimal number of clusters also yielding other suboptimals with smaller or larger number of clusters. Using these subobtimal could in principle affect the markovian properties of the signal. However, to prove that even in these cases the markovian property still holds, we did some experiments with the same raw data but using a suboptimal number of clusters for building the CDPs dictionaries. In particular, we applied the randomized methodology described in Section 5.1 to test whether sequences show the markovian property of order 1. The p-values obtained for each experiment are reported in Table 6. Eventually each p-value shown is the maximum obtained in all sequences (with different segment and step) of the experiment. The results show that even in those cases the significance of the markov property is high.
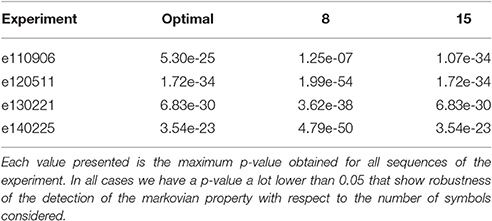
Table 6. Obtained p-values testing markov behavior of degree 1 for each experiment varying the number of symbols considered in raw signal.
In conclusion, we can see that the detection of the phenomena is robust when changing the parameters of the pre-processing steps of the methodology. Notice also that the effect of introducing false CDPs in our analysis, given that noise is not markovian, would only add difficulty in detecting the markovian property. However, our analysis shows clearly, with a p-value very close to zero for all experiments, that the markovian property of degree at least one is fullfilled by all the sequences studied.
7.2. Some Functional Implications
Previous studies in the spinal cord of the anesthetized cat have been addressed to examine the functional organization of the dorsal horn neurons contributing to the generation of the spontaneous negative and negative-positive CDPs (nCDPs and npCDPs, respectively). During low levels of dorsal horn neuronal synchronization, the network would generate nCDPs and activate the pathways mediating non reciprocal post-synaptic inhibition. In contrast, during high levels of neuronal synchronization, npCDPs would be mostly generated and would preferentially activate the pathways mediating presynaptic inhibition.
These studies showed in addition that the spontaneous nCDPs and npCDPs were followed by a silent phase during which no other spontaneous CDPs were generated. Since the CDPs evoked by stimulation of a cutaneous nerve were also depressed when preceded by spontaneous nCDPs and npCDPs, it was concluded that the silent phase was due to the concurrent activation of GABAergic and glycinergic inhibitory pathways (Chávez et al., 2012; Contreras-Hernández et al., 2015). Yet, the analytic methods available at that time provided limited information on the functional organization and possible selectivity of these inhibitory interactions.
We now used Markov processes to describe the interactions between spontaneous CDPs recorded in a particular spinal segment. As shown in Section 5, we found in all experiments that the generation of the CDPs could be described by a Markov order one process, which means that the network had memory and that generation of a particular kind of CDP depended on which CDP was previously generated. We also found that these interactions were non-random, a situation consistent with the proposal that individual CDPs are followed by a structured activation of a segmentally distributed and rather selective inhibitory networks that contribute to the shaping of the sensory information arriving from the periphery.
The main outcome of the markovian analysis was the finding that the time sequence of the spontaneous CDPs extracted from the potentials recorded from a given segment was also non-random and had a specific structure that could be associated with a particular functional state of the network. That is, the temporal sequences of the spontaneous CDPs obtained from control (ctrl) recordings were basically different from those sequences recorded after spinalization (esp) that is on spinal segments devoid of supraspinal control or after capsaicin (capsa). We would be dealing here with a signature like process that characterizes the configuration of the neuronal connectivity of the whole neuronal ensemble during a particular functional state.
From a functional point of view, it is clear that in a chain of in series interconnected sets of neurones the activation of each set will affect the responses of the next set in the chain and so on a situation that could lead to Markov processes of different orders. In the case of the spontaneous CDPs presently analyzed we are dealing with ensembles of mutually interconnected sets, where each set is influenced by the activity of the other sets. Therefore, it is quite feasible that the effects of a particular class of CDP on the subsequent CDP will be probably stronger than interaction with more remote events.
Although, discussion on the functional implications of these findings is beyond the scope of this publication, it should be noted that at present time we have limited information pertaining the kind of dorsal horn neurons involved in the generation of the different classes of CDPs except for the negative and negative positive CDPs (see Contreras-Hernández et al., 2015) where it was shown that depending on the magnitude of the correlation between the neurons the same ensemble may generated nCDPs and npCDPs. So the question remains on whether the same set of neurons generates the different classes of CDPs or whether each of them is generated by a specific set of tightly coupled neurons. Nevertheless, it is tempting to suggest that the segmentally correlated sequences of neuronal activity might be acting as a dynamic functional switch, directing the flow of sensory information arriving to the spinal cord. They might be acting by introducing, via presynaptic mechanisms, a specific signature to the ensemble of sensory fibers to inform the supraspinal structures on the functional state of the spinal cord, which may in turn modulate the state of neuronal sensitization induced by nociception.
7.3. Relation with Other Previous Works
Our observations indicate that CDP sequences cannot be generated by a renewal (memoryless, or Markov order zero) stochastic process, but rather by a Markov order one stochastic process. Other previous works in neuronal activity also found temporal dependences in neuron firing. For instance, Ratnam and Nelson (2000), based on the analysis of the time sequences of the action potentials transmitted by single sensory fibers of the electric organs of the Apteronotus leptorhynchus, concluded that a Markov process of at least fourth-order is required to adequately describe spike activity.
This could seem to be in contradiction with our work. Yet it must be pointed out that this situation is completely different from the CDPs presently analyzed because they are produced by populations of interconnected neurons whose activity is determined, in addition to the intrinsic patterns of neuronal connectivity, and by excitatory and inhibitory influences generated at segmental and supraspinal level.
As demonstrated in a preceding paper (Contreras-Hernández et al., 2015), the CDPs are followed by an inhibitory period attributed to the activation of GABAergic and glycinergic pathways. The duration of this inhibitory phase is quite variable and we believe it plays a significant role in setting up the probabilities of occurrence of the next CDP. This by itself could impose a non-renewal Markov one process in the network. It is clear to us that the preceding events could also exert some influence on the final outcome. But in this sense we must keep in mind that we are dealing here with networks of interconnected neurons where it is really difficult (but not impossible) to establish causal relations. We believe that our inability of detect higher order Markovian processes is more a consequence of the properties of these networks rather than a limitation of the employed computational procedures.
7.4. Future Work
At this point, two lines of research emerge from this work.
First, we have seen that our method is able to predict the maneuver from which a data sequence was registered (see Section 6). However, our method can introduce a bias in some cases. For instance, it may happen that the behavior of sequences from different maneuvers could correspond to the same functional state of the spinal cord. An example could be when, after some time, the effect of capsaicin injection disappears and the state of the spinal cord returns to something similar to control, or when the application of some drug cancels the effect of capsaicin. In those cases time steps belonging to different maneuvers can be confused. We plan to extend this study in an unsupervised manner so the method could be able to detect changes in behavior of the state not defined by the label of last maneuver made on the cat.
Second, we would like to study the role of synchronization of events across all the lumbar segments. The objective of this study will be to enhance the model of the sequential behavior and to cast some light about the functional connectivity among different neural groups generating CDPs in different lumbar segments. This analysis is complementary to the presented here. Markovian analysis could be considered as a horizontal analysis (considering time dimension in the x-axis) of temporal dependences. Study of synchronizations could be considered a vertical study (synchronization in the same time step) of the signals at the same time. However, for this other study, the markovian analysis does not help because we lose the temporal dimension.
Author Contributions
DC, EC, SG, and PR from the “Centro de Investigaciones y Estudios Avanzados” in Mexico, together with the help of SG, designed and performed the experiments described in the paper. MM, JB, GE, and UC from the “Universitat Politécnica de Catalunya” suggested and performed the Markovian analysis of the experimental data. All of them helped in the interpretation of the results and conclusions.
Ethics Statement
Cats were bred and housed under veterinary supervision at the Centro de Investigaciones y Estudios Avanzados of the Instituto Politécnico Nacional Animal Care unit (SAGARPA permission AUT-B-C-0114-007). All experiments were approved by the Institutional Ethics Committee for Animal Research (protocol no. 126-03) and of the National Institutes of Health (Bethesda, MD, USA; Animal Welfare Assurance no. A5036-01). The Guide for the Care and Use of Laboratory Animals NRC (2010) was followed in all cases.
Conflict of Interest Statement
The authors declare that the research was conducted in the absence of any commercial or financial relationships that could be construed as a potential conflict of interest.
Acknowledgments
This work was partially supported by the FI-DGR programme of AGAUR ECO/1551/2012. It was also partially supported by Rehabilitación personalizada y adaptativa en tratamientos post-ictus: El i-Walker (TEC2014-56256-C2-2-P) by NIH grant NS 09196 and CONACyT grants CB2009–127965, CB2015–255548, and by the Barcelona Supercomputing Center (BSC-CNS) and CINVESTAV agreement. EC was CONACyT fellow. GE was FI-AGAUR fellow. PR and UC are both members of the Sistema Nacional de Investigadores (CONACyT, México).
References
Anderson, T. W., and Goodman, L. A. (1957). Statistical inference about markov chains. Ann. Math. Stat. 28, 89–110.
Béjar, J., Martín, M., Esposito, G., Contreras, E., Chávez, D., Cortés, U., et al. (2015). “A data mining methodology for event analysis in neurophysiological signals,” in Proceedings of the 18th International Conference of the Catalan Association for Artificial Intelligence (Valencia), 80–89.
Chávez, D., Rodríguez, E., Jiménez, I., and Rudomin, P. (2012). Changes in correlation between spontaneous activity of dorsal horn neurons lead to differential recruitment of inhibitory pathways in the cat spinal cord. J. Physiol. 590, 1563–1584. doi: 10.1113/jphysiol.2011.223271
Contreras-Hernández, E., Chávez, D., and Rudomin, P. (2015). Dynamic synchronization of ongoing neuronal activity across spinal segments regulates sensory information flow. J. Physiol. 593, 2343–2363. doi: 10.1113/jphysiol.2014.288134
Florian, B., Sepp, K., Joshua, H., and Richard, H. (2011). “Hidden markov models in the neurosciences,” Hidden Markov Models, Theory and Applications, ed P. Dymarski (Rijeka: IntTech), 169–186.
Isaacson, D. L., and Madsen, R. W. (1976). Markov Chains, Theory and Applications, Vol. 4. New York, NY: Wiley.
Manjarrez, E., Jiménez, I., and Rudomin, P. (2003). Intersegmental synchronization of spontaneous activity of dorsal horn neurons in the cat spinal cord. Exp. Brain Res. 148, 401–413. doi: 10.1007/s00221-002-1303-6
Manjarrez, E., Rojas-Piloni, J., Jiménez, I., and Rudomin, P. (2000). Modulation of synaptic transmission from segmental afferents by spontaneous activity of dorsal horn spinal neurones in the cat. J. Physiol. 529, 445–460. doi: 10.1111/j.1469-7793.2000.00445.x
Martín, M., Contreras-Hernández, E., Béjar, J., Esposito, G., Chávez, D., Glusman, S., et al. (2015). A machine learning methodology for the selection and classification of spontaneous spinal cord dorsum potentials allows disclosure of structured (non-random) changes in neuronal connectivity induced by nociceptive stimulation. Front. Neuroinform. 9:21. doi: 10.3389/fninf.2015.00021
NRC (2010). Guide for the Care and Use of Laboratory Animals, 8th Edn. Washington: National Research Council.
Pethel, S., and Hahs, D. (2014). Exact significance test for markov order. Phys. D 269, 42–47. doi: 10.1016/j.physd.2013.11.014
Ratnam, R., and Nelson, M. E. (2000). Nonrenewal statistics of electrosensory afferent spike trains: implications for the detection of weak sensory signals. J. Neurosci. 20, 6672–6683.
Rokach, L. (2010). Ensemble-based classifiers. Artif. Intell. Rev. 33, 1–39. doi: 10.1007/s10462-009-9124-7
Keywords: machine learning, markovian analysis, nociceptive stimulation, cord dorsum potentials, spinal cord
Citation: Martin M, Béjar J, Esposito G, Chávez D, Contreras-Hernández E, Glusman S, Cortés U and Rudomín P (2017) Markovian Analysis of the Sequential Behavior of the Spontaneous Spinal Cord Dorsum Potentials Induced by Acute Nociceptive Stimulation in the Anesthetized Cat. Front. Comput. Neurosci. 11:32. doi: 10.3389/fncom.2017.00032
Received: 10 November 2016; Accepted: 12 April 2017;
Published: 01 May 2017.
Edited by:
Petr Lansky, Academy of Sciences of the Czech Republic, CzechiaReviewed by:
Alexander Vidybida, Bogolyubov Institute for Theoretical Physics (NAN Ukraine), UkraineFarzad Farkhooi, Technische Universität Berlin, Germany
Copyright © 2017 Martin, Béjar, Esposito, Chávez, Contreras-Hernández, Glusman, Cortés and Rudomín. This is an open-access article distributed under the terms of the Creative Commons Attribution License (CC BY). The use, distribution or reproduction in other forums is permitted, provided the original author(s) or licensor are credited and that the original publication in this journal is cited, in accordance with accepted academic practice. No use, distribution or reproduction is permitted which does not comply with these terms.
*Correspondence: Mario Martin, mmartin@cs.upc.edu