Dynamic Responses in Brain Networks to Social Feedback: A Dual EEG Acquisition Study in Adolescent Couples
 Ching-Chang Kuo
 Thao Ha
 Ashley M. Ebbert
 Don M. Tucker
 Thomas J. Dishion3,5
- 1Electrical Geodesics Inc., Eugene, OR, United States
- 2NeuroInformatics Center, University of Oregon, Eugene, OR, United States
- 3Department of Psychology, Arizona State University, Tempe, AZ, United States
- 4T. Denny Sanford School of Social and Family Dynamics, Arizona State University, Tempe, AZ, United States
- 5Department of Psychology, REACH Institute, Arizona State University, Tempe, AZ, United States
- 6Department of Psychology, University of Oregon, Eugene, OR, United States
Adolescence is a sensitive period for the development of romantic relationships. During this period the maturation of frontolimbic networks is particularly important for the capacity to regulate emotional experiences. In previous research, both functional magnetic resonance imaging (fMRI) and dense array electroencephalography (dEEG) measures have suggested that responses in limbic regions are enhanced in adolescents experiencing social rejection. In the present research, we examined social acceptance and rejection from romantic partners as they engaged in a Chatroom Interact Task. Dual 128-channel dEEG systems were used to record neural responses to acceptance and rejection from both adolescent romantic partners and unfamiliar peers (N = 75). We employed a two-step temporal principal component analysis (PCA) and spatial independent component analysis (ICA) approach to statistically identify the neural components related to social feedback. Results revealed that the early (288 ms) discrimination between acceptance and rejection reflected by the P3a component was significant for the romantic partner but not the unfamiliar peer. In contrast, the later (364 ms) P3b component discriminated between acceptance and rejection for both partners and peers. The two-step approach (PCA then ICA) was better able than either PCA or ICA alone in separating these components of the brain's electrical activity that reflected both temporal and spatial phases of the brain's processing of social feedback.
Introduction
Adolescence is a critical time for developing significant peer and romantic relationships (Steinberg and Morris, 2001). Social rejection is a normal developmental challenge, but it may figure importantly in pathological forms of adolescent anxiety and depression (Masten et al., 2012; Moor et al., 2012; Silk et al., 2012). Previous functional magnetic resonance imaging (fMRI) studies found that the dorsal anterior cingulate cortex (dACC) is activated in social rejection (Eisenberger et al., 2003). The ventral anterior cingulate cortex (vACC) and specifically the subgenual region (subACC) appear sensitive to social feedback, particularly acceptance from unfamiliar peers (Somerville et al., 2006, 2010; Guyer et al., 2012; Masten et al., 2012).
In addition to fMRI studies, event-related potential (ERP) studies have addressed the neural processing of social feedback in adolescents. The P3 component of the ERP (typically the third positive wave) is a particularly sensitive measure of the attention and memory processes related to the cognitive processing of significant information (Polich, 2007; Volpe et al., 2007). In the Cyberball laboratory task, subjects experience rejection when it is their turn to be passed the ball but it is passed to someone else. Using this task Crowley et al. showed that frontal, slow wave activity (580–900 ms post-stimulus) among young adults, which was more negative for participants reporting more distress and more positive for participants reporting less distress (Crowley et al., 2009). This finding was replicated in a sample of children between 8–12 years old, where a similar slow wave was found associated with a larger P3 component in response to exclusion (Crowley et al., 2010). Another study (Gutz et al., 2011) using the Cyberball paradigm found that exclusion influenced both a fronto-central P3a and a more parietal P3b component. The P3a was related to later negative mood and the P3b was involved in processing the intensity of the exclusion itself. A similar study identified a larger P3b, indicating enhanced attentional activation to exclusionary events (Themanson et al., 2014). The P3b activation was associated with self-reported social distress following prolonged social exclusion.
An important question is whether neural responses in laboratory tasks with unfamiliar peers can be generalized to the more emotionally significant responses to acceptance and rejection from romantic partners. Adolescents' relative inexperience with romantic relationships, coupled with the high likelihood of breakups, creates a highly vulnerable context (Ha et al., 2012). Not surprisingly, romantic rejection has been related to problem behavior (Furman et al., 2008) and depression (Monroe et al., 1999; Ha et al., 2014). To the best of our knowledge, adolescent romantic relationships have not been examined before, possibly due to practical challenges of recruiting young dating couples and creating believable paradigms that elicit romantic partner acceptance and rejection.
In the present study, we examined dense array EEG measures associated with events of acceptance and rejection between both romantic partners and unfamiliar peers as they engaged in virtual social feedback. Specifically in the Chatroom Interact Task, the subjects indicted whether they preferred a given person for a planned chat on a specific topic, such as movies or sports. Dual 128-channel dEEG systems were synchronized, so that both romantic partners were recorded simultaneously. We investigated the dEEG measures for neural signs of differential attention to acceptance and rejection, specifically related to responses from the partner versus an unfamiliar peer. To improve the separating of overlapping ERP components (such as P3a and P3b), we employed a two-step temporal principal component analysis (PCA) followed by a spatial independent component analysis (ICA) to separate the underlying neural generators of the superimposed scalp voltage patterns (Dien et al., 2005). Compared to standard ERP component analysis that provides local information of amplitude and time courses for brain signals (Cacioppo et al., 2015), the two-step component analysis approach provides comprehensive information about reliable and distinct components that contribute to the dense-array recordings (Foti et al., 2009). More precisely, the two-step component analysis approach provides component time courses and near-dipolar scalp projections, suggesting the component reflects a coherent neural source (Delorme et al., 2012). To explore the possible neural sources with realistic physical modeling, source estimation was conducted for each component with a linear inverse solution (LORETA; Pascual-Marqui et al., 1994) and a high-resolution of electrical head models (Li et al., 2016).
We hypothesized that the frontal and limbic (anterior cingulate, insula) neural responses during social rejection observed in previous laboratory tasks (Crowley et al., 2009, 2010) would generalize to this more naturalistic virtual social feedback paradigm. Furthermore, we hypothesized that feedback from a romantic partner would be more intense and perhaps engage more immediate emotional and limbic activity than feedback from an unfamiliar peer. These hypotheses were tested with the two-step PCA/ICA component analysis, separating the components underlying the cerebral networks of initial attentional engagement (P3a) and more extended cognitive evaluation (P3b), and then statistically analyzing the component responses as a function of acceptance or rejection by the partner or the peer.
Materials and Methods
Participants
Ninety-nine adolescent couples aged 14 to 18 years participated in the current study (Ha et al., 2016). The majority of these couples were heterosexual (N = 91) and 8 were same sex couples (1 male and 7 female couples). Relationship length was diverse with 34.2% of adolescents reporting being in a relationship less than 6 months, 38.4% between 6 and 12 months, and 27.4% for longer than a year. All participants who had fewer than 10 artifact free trials across all conditions were excluded from further analyses. Our final EEG study sample consisted of 75 subjects with normal or corrected-to-normal vision (51 males and 24 females, M = 16.44 years, SD = 0.83; range 15–18 years). All participants reported no history of neurological disorders nor were they taking medications that are known to affect the EEG (e.g., anticonvulsants). This study was carried out in accordance with the recommendations of The Institutional Review Board of Arizona State University, which approved the study protocol. Parents provided written informed consent and adolescents provided written informed assent prior to participation. Participants each received $40 for the laboratory session.
Stimuli and Experimental Design
Adolescent couples participated in a Chatroom Interact Task, designed to investigate neural reactions to online virtual peer acceptance and rejection (Guyer et al., 2009; Silk et al., 2012). We adapted this task to fit a dyadic context where both romantic partners participated simultaneously to elicit both rejection and acceptance from a romantic partner and unfamiliar peers (Figure 1). Participants were told a cover story explaining that they would be having online video chats with other adolescent players from three different universities. These video chats would be based on each participant's choices to talk with another participant about a variety of topics (e.g., dating, books, future plans, and parties). In reality, these video chats would never occur and we were merely interested in adolescents' neural responses to social feedback (acceptance versus rejection) from peers and their romantic partner. A personalized chat profile was created, providing information about a player's first name, interests, and proposed future career plans along with their picture.
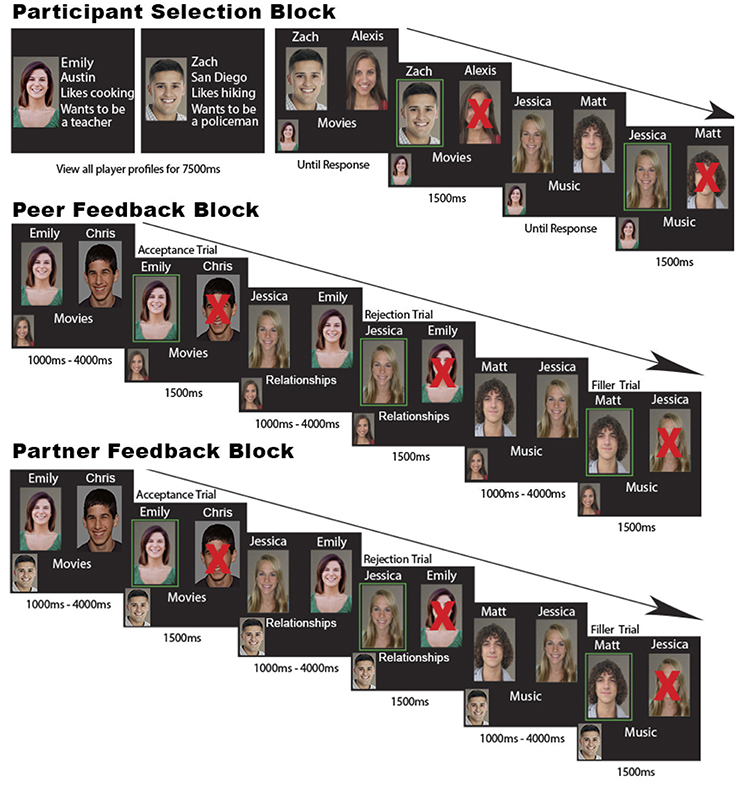
Figure 1. Representation of the Chatroom Interact Task. During the participant SELECTION block, both participants viewed 6 player profiles as an introduction to the task (2 participant profiles; “Emily” and “Zach,” two additional fictive males and females). Then, participants were instructed to choose the person who they would like to talk to regarding the topic displayed under the players' photos. In this particular example, we showed the player timeline of Emily (picture shown in the left corner) who was making selections between 2 players with a “left” or “right” button press. The selected or “accepted” player was subsequently highlighted with a green square on their picture. The unselected or “rejected” player was labeled with a red “X” over their picture. Following the participant selection block, fictitious feedback was provided by peers and the romantic partner in the FEEDBACK blocks, indicating whether the participant was accepted or rejected. Feedback was randomized by the experimenters and believed by the subjects. In the peer FEEDBACK blocks, participants would see their peers making selections. In this particular example, Emily (participant) viewed that Alexis (peer, displayed in the left corner) chose the participant to talk about movies, which was a peer acceptance trial. Then Alexis (peer) chose Jessica (peer) over Emily (participant) to talk about relationships, which was a peer rejection trial. This was followed by a filler trial where the participant, Emily, was not displayed as an option. In the romantic partner FEEDBACK block, participants viewed their romantic partners' selections. In this case, Emily (participant) watched Zach (romantic partner) selecting Emily to talk about movies, which was a romantic partner acceptance trial. However, Zach chose Jessica (peer) over Emily (participant) to talk about relationships, which was a romantic partner rejection trial. Note that only the peer and romantic partner FEEDBACK blocks were analyzed in the current study.
In the first “selection” block, participants selected their conversation partners. They viewed 4 other player profiles (2 males and 2 females) and their partners' profile, each for 7,500 ms. Participants were instructed to choose the person who they would like to talk to about the topic displayed under the players' photos. Two photos were shown and the participant selected with a “left” or “right” button press that corresponded with the picture. The selected or “accepted” player was subsequently highlighted with a green square around their picture. The unselected or “rejected” player was labeled with a red “X” over their picture for 1,500 ms. The selection block consisted of 45 randomized trials on 15 various topics, each repeating three times in a randomized order. Of the 45 trials, 30 trials included the participant's romantic partner as one of the options to choose from when randomly paired with one of the other 4 players.
Data for the current study were obtained from the “feedback” blocks where participants were able to see the other players' choices including one partner selection round and four peer selection rounds. During the peer feedback blocks, the profile picture of the peer player making selections was displayed in the bottom corner of the screen, along with the topic and the pictures of the 2 players being selected. The time it took for the peer player to select was set to a random iteration between 1,000 and 4,000 ms. Feedback was provided to participants by presenting them with their photo highlighted with either a green square (acceptance) or covered by a red cross (rejection), which lasted 1,500 ms. Overall, the peer feedback blocks contained a randomized order of 45 trials, where 30 trials consisted of the participant randomly paired with one of the four peers and 15 trials including either two randomly paired peers. A similar set up was used for partner feedback blocks. However, the only change from the peer feedback blocks was that the participant would receive feedback about their romantic partner's choices. Thus, participants could be either accepted or rejected by their romantic partner. This procedure was repeated with different players for a second round. The order of the partner and peer feedback blocks was randomized. After the Chatroom Interact Task, participants have fully debriefed that all feedback was computer manipulated.
EEG Acquisition
Continuous EEG was acquired with dual 128-channel HydroCel Geodesic Sensor Net (EGI, Eugene, OR, USA; http://www.egi.com/) using Net Station 4.5 software. EEG electrodes were distributed across the whole head surface with an inter-sensor distance of approximately 3 cm (Tucker, 1993). All electrode impedances were below 70 KΩ before recording was started (Ferree et al., 2001). Recordings were referenced to the Cz electrode. The data were digitized with a 24-bit A/D converter at a 250 Hz sample rate.
EEG Data Analysis
Data Preprocessing
The continuous EEG data were digitally filtered between 0.1 and 30 Hz with zero-phase shift finite impulse response (FIR) filters. Trials with time-locked event responses were extracted from filtered data. The data were divided into four conditions: (1) partner acceptance, (2) partner rejection, (3) peer acceptance, and (4) peer rejection. The time period of a single trial was from 200 ms before event onset to 800 ms after event onset. Bad channels (defined as those with EEG max–min >200 μV after smoothing with a moving average of 80 ms long) were identified and replaced using spherical spline interpolation. Epochs with artifacts due to eye blinks or ocular movement were excluded. The remaining epochs for each participant were then averaged and baseline corrected to the first 200 ms period. The data were then re-referenced to the common average signal across all electrodes. In order to examine the latent nature of the N1, P3a and P3b component without the effects of overlapping ERP, the data were subjected to a two-step PCA/ICA component analysis (Luu et al., 2014; Lole et al., 2015).
Principal Component Analysis/Independent Component Analysis
The average ERP data from each subject were entered into a spatiotemporal component analysis using the ERP PCA Toolkit version 2.50 (Dien, 2010, 2012). In this two-step component analysis, a temporal PCA decomposition using promax rotation was first conducted on the data with time point as a variable. The source of variance was accounted over subjects, conditions, and channels. The number of factors retained for temporal PCA decomposition can be guided by the parallel test (Ledesma and Valero-Mora, 2007). Following the temporal PCA, the spatial ICA decomposition was performed. ICA with informax method (Delorme and Makeig, 2004) used the channels as variables and the number of factors retained for the independent component can also be obtained by the parallel test. After this two-step component analysis, many spatiotemporal components were generated (number of temporal components multiplied by spatial components). The components to be considered for further analysis begun with elimination of all components that did not account for at least 0.5% of total variance (Dien, 2012). This removes the majority of junk factors that reveal noise. Next, we explored components of interest based on dipole-like scalp maps, spectral peak at typical frequency range, and identifiable as ERP components (Delorme et al., 2012). Once the spatiotemporal components were identified, repeated measure analysis of variance (ANOVA) without correction for multiple comparisons was tested for statistical significance (Dien, 2010, 2012) and the substantive significance (effect size) was also reported (Sullivan and Feinn, 2012). In this study, P < 0.05 was considered as significant.
Head Model Construction
The electrical head modeling (forward model) was created to include accurate brain tissue segmentation, 128-channel sensor position registration, and specification of conductivity values for each tissue. In the present study, an atlas head model was constructed from whole head MRI and CT images using BrainK software (Li et al., 2016). BrainK included five major steps: (1) Tissue segmentation: The MRI and CT images were co-registered prior to segmentation. Tissue segmentation classified and identified each image voxel into the following tissue types: air, eyeball, scalp, skull, cerebral-spinal fluid (CSF), and brain (gray and white matter). Scalp and skull were identified by CT image and CSF and brain were identified from MRI data. (2) Registration of sensor position: 128-channel sensor positions were registered to the respective scalp surface on the atlas head model. (3) Cortical surface reconstruction. (4) Dipole tessellation. (5) Talairach transformation: The MRI and CT images were then aligned with cortex volume from the MNI305 atlas with Talairach registration (Li et al., 2016). The locations of the dipoles were derived based on the method (Pascual-Marqui et al., 1994) by discretizing the gray matter volume of the MNI305 atlas. The tissue volumes were parceled into 7 mm voxels to form the computational elements; each voxel served as a source dipole location with three orthogonal orientation vectors (triples). This resulted in 1,732 dipole locations and 5,196 dipoles for our atlas head model.
For the complete head model, a lead field matrix (LFM), which describes the projection of current from each dipole source position to each EEG sensor position, was computed using the finite difference method (FDM; Salman et al., 2015). The following conductivity values (in Siemens/meter) assigned to each tissue type are based on previously reported literature values: Eyeball = 1.5, Scalp = 0.44, Skull = 0.018, CSF = 1.8, Brain = 0.25 (Dannhauer et al., 2012; Salman et al., 2015).
Cortical Source Estimation
Estimation of the cortical source was performed using GeoSource 3.0 software (EGI, Eugene, OR, USA). To estimate the activity on the cortex, source localization was performed with a constrained inverse model on each component using the Low Resolution Tomography (LORETA) method (Pascual-Marqui et al., 1994, 1999). The relationship between scalp and source can be stated as generalized linear models:
where Φ(t) is the EEG scalp potential measured at Ne = 128 electrodes, K is the lead field matrix, are the activities of the source dipoles at the cortical surface, and ε(t) is generalized noise with covariance matrix Cε. Since inverse problem is ill-posed (Ne << Nv), mathematical and physical constraints are added to obtain unique solution. Many linear inverse methods can be obtained as the solution of the minimization problem:
where ||Φ − KJ||2 is the data fidelity term, and λ is the regularization parameter which controls the influence of the constrains relative to minimizing the residual of the fit. J is the vector of source amplitudes (as defined above) and W defines the inverse technique (e.g., Minimum Norm, LORETA, sLORETA etc.). The LORETA method (Pascual-Marqui et al., 1994, 1999) employs regularization based on the 3D discrete Laplacian operator and LFM normalization. For LORETA inverse technique, W = ETDTDE where D is the Laplacian operator and E is a diagonal matrix corresponding to the LFM normalization. E=Ẽ ⊗ I3 is constant over three orthogonal orientation vectors to each source dipole and D = ⊗ I3 is the matrix for the Laplacian operator using a 7-point stencil (Hammond et al., 2013).
Results
dEEG Data
Focusing on the results from the participant selection blocks, we analyzed the number of partner acceptance trials, meaning the number of times a participant would choose their romantic partner. Overall, participants chose their partner over an unfamiliar peer on average 65% of the time, indicating participants accepted their romantic partner more often than they rejected them.
The grand average ERP data at Fz and Pz electrode sites from the feedback blocks for all four conditions is depicted in Figure 2. Upon visual inspection of the head surface (scalp) waveform, some typical ERP components, such as the N1 and P3, were clearly identifiable. At mediofrontal sites (channel Fz), no clear waveform difference was seen between conditions during 100–200 ms for the N1, whereas at centroparietal sites (channel Pz), the amplitude during 300–500 ms for both partner and peer acceptance conditions was higher than the partner and peer rejection conditions for the P3.
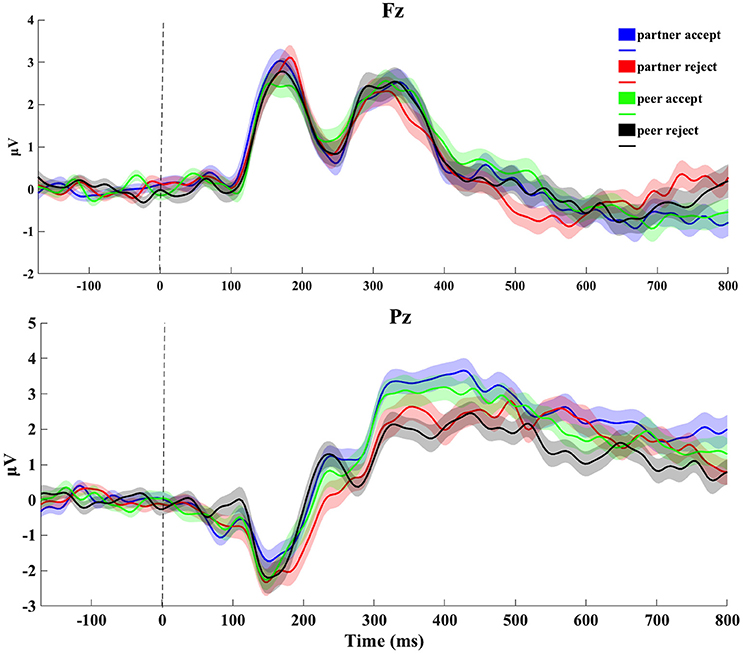
Figure 2. Original grand-average ERP waveforms at Fz and Pz. Signals were averaged across all subjects for four conditions (1,000 ms epoch). Stimulus onset was plotted as vertical dashed line. The thickness of the traces reflects the standard error through from subject-by-subject variations.
Principal Component Analysis/Independent Component Analysis
To decompose the overlapping ERPs, a two-step PCA/ICA was conducted. First, temporal PCA decomposed the individual ERP data into distinct temporal factors based on the parallel test. In this test, a scree plot derived from a fully random dataset was created and then compared with the scree plot obtained from the actual dataset. An intersection point of two datasets (random and actual) in the scree plot indicated the number of factors to be retained for the temporal decomposition. In our parallel test, 17 temporal factors, accounting for 91% of total variance, were retained. For the spatial ICA decomposition, eight discrete spatial factors were suggested to retain (76% of total variance) based on the parallel test. After this two-step component analysis, a total of 136 spatiotemporal components were generated. Based on the rules of component consideration described in PCA/ICA method section, four functionally distinct components were included for further component identification.
Component 1
The waveforms of the first component (C1) are displayed for all four conditions at centroparietal sites (Figure 3A) at the location indicated by a white circle (Channel 79) in the topography map in Figure 3B. The topography map of C1 displayed the peak activity at 364 ms and had positive peak amplitudes over the parietal area on the 3D head voltage distribution image in Figure 3C. This component is similar to late positive component (LPC) or P3b related component (Dien et al., 2004) in its topography and time course in the post-stimulus interval. Statistical analysis was performed on mean amplitudes of C1 (344–384 ms; EGI channels 62, 78, and 79) over each condition and subject. One-way ANOVA analysis revealed significant effects between partner acceptance (M = 4.32 μV) and partner rejection (M = 3.40 μV) conditions, F(1, 74) = 3.99, P < 0.05, effect size = 0.32, and between peer acceptance (M = 4.06 μV) and peer rejection (M = 2.93 μV) conditions, F(1, 74) = 6.82, P < 0.01, effect size = 0.42, resulting in larger amplitudes for both partner and peer acceptance conditions.
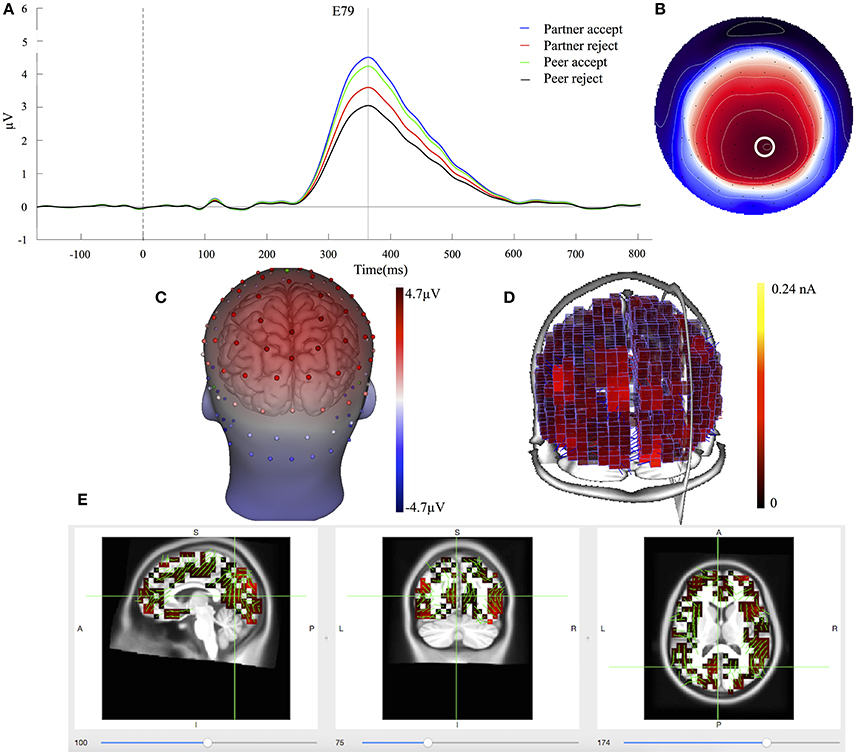
Figure 3. C1 component properties. (A) Component mean waveforms were at parietal sites at electrode E79 for all conditions. (B) Topography map of C1 was showing voltage distribution at 364 ms for partner acceptance condition. The white circle highlighted the location of channel E79 and block dots indicated all the 129 channels. Orientation was top looking down with nose at the top. (C) Scalp voltage distribution was on the atlas head model. (D) Source intensity on the vertical axis was shown in standardized units for component C1. (E) Source data was displayed and projected onto MRI slices. The area within the green border represented the posterior cingulate cortex.
Cortical source estimation was performed using the LORETA constraint and a regulation constant of 10−3 on the averaged component waveform of all 75 subjects. Sources of C1 were obtained for the time point at 364 ms and displayed primary activities in the bilateral inferior temporal lobe (BA20), the bilateral parietal lobe (BA39 and BA7) and the posterior cingulate cortex (BA23 and BA31), as seen in Figure 3D. The C1 component also included activity in the bilateral visual associated lobe (BA17) and the bilateral parahippocampal (BA36). The bilateral inferior temporal lobe was stronger at the right hemisphere. Figure 3E shows the C1 generation in the PCC area on the MRI slices.
Component 2
The mean component waveforms and scalp topography of C2 are illustrated in Figures 4A,B. Mean waveforms are displayed at mediofrontal sites indicated by a white circle in the topography map for all conditions. This component had a positive deflection in the mediofrontal and a negative deflection in the occipital lobe shown in Figure 4C. It was most prominent at approximately 288 ms post-stimulus and resembled a P3a related component (Dien et al., 2004). The mean amplitudes for C2 (268–308 ms; EGI channels 6, 7, and 106) were extracted over each condition and subject. One-way ANOVA demonstrated that the waveforms differed significantly between partner acceptance (M = 2.05 μV) and partner rejection (M = 1.37 μV) conditions, F(1, 74) = 4.18, P < 0.05, effect size = 0.33. No significant effects were found between peer acceptance (M = 1.71 μV) and peer rejection (M = 1.80 μV) conditions, F(1, 74) = 0.11, P < 0.89, effect size = 0.05.
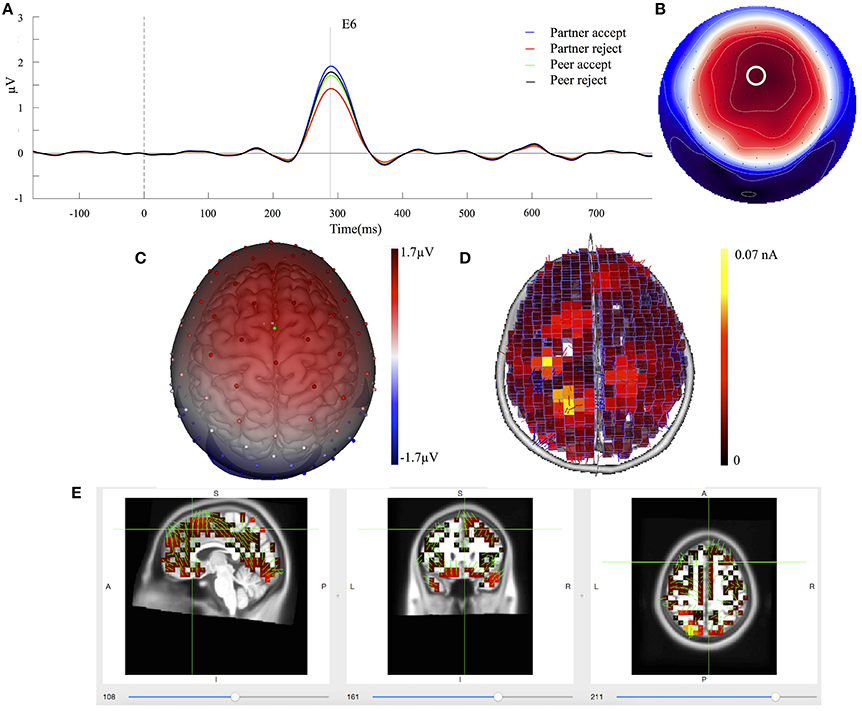
Figure 4. C2 component properties. (A) Component mean waveforms were at midfrontal sites at electrode FCz (E6) for all conditions. (B) Topography map of C2 was showing voltage distribution at 288 ms for partner acceptance condition. The white circle highlighted the location of channel E6. (C) Scalp voltage distribution was on the atlas head model. (D) Source estimation of C2 using LORETA was showed on brain cortex. (E) Source data was displayed and projected onto MRI slices. The area within the green border represented the anterior cingulate cortex.
Source estimation of C2 showed primary activations in the bilateral parietal lobe (BA39 and BA7), the bilateral frontal lobe (BA8 and BA6) and the anterior cingulate cortex (BA32), as seen in Figure 4D. The bilateral inferior temporal lobe (BA20) and the bilateral occipital lobe (BA19) were also activated in the C2 component. Additionally, Figure 4E depicts the C2 generation in the ACC area on the MRI slices.
Component 3 and 4
The C3 component was prominent at 164 ms, displayed in Figure 5A. The topography map had a positive deflection over the frontal lobe and a negative deflection in the occipital lobe, shown in Figures 5B,C. A typical N1 component is observed by its topography and time course in the post-stimulus interval (Poolman et al., 2008). The mean amplitudes of C3 (144–184 ms; EGI channels 70, 75, and 83) were extracted over each condition and subject for the statistical analysis. No significant effects were seen between partner acceptance (M = −3.34 μV) and partner rejection (M = −3.24 μV) conditions, F(1, 74) = 0.05, P < 0.82, effect size = 0.04. Additionally, no significant differences were shown when comparing peer acceptance (M = −3.32 μV) and peer rejection (M = −3.35 μV) conditions, F(1, 74) = 0.01, P < 0.94, effect size = 0.01. Source results displayed activities in the bilateral visual associated and primary visual lobes (BA18 and 17), the bilateral occipital lobe (BA19) and the posterior cingulate cortex (BA31 and BA23), seen in Figure 5D. The C3 component also included activities in the right fusiform area (BA37) and the bilateral inferior temporal lobe (BA20). The visual lobe activity was bilateral but stronger at the right hemisphere. Lastly, Figure 5E depicts the C3 generation in the visual cortex area on the MRI slices.
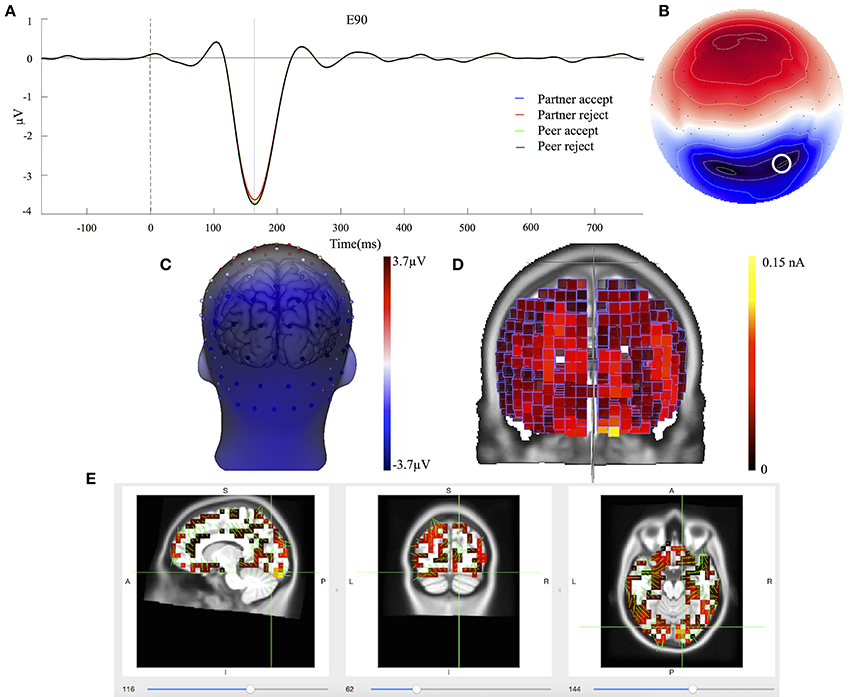
Figure 5. C3 component properties. (A) Component mean waveforms were at occipital sites at electrode E90 for all conditions. (B) Topography map of C3 was showing voltage distribution at 164 ms for partner acceptance condition. (C) Scalp voltage distribution was on the atlas head model. (D) Source estimation of C3 was showed on the brain cortex. (E) Source data was displayed and projected onto MRI slices. The area within the green border represented the visual cortex.
The properties of the C4 component are similar to the C3 component based on its topography map (similar to Figure 5B) and time information (C4 prominent at 124 ms). The mean amplitudes of C4 (104–144 ms; EGI channels 70, 75, and 83) were extracted over each condition and subject. No significant differences were found between partner acceptance (M = −1.37 μV) and partner rejection (M = −1.04 μV) conditions, F (1, 74) = 0.5, P < 0.48, effect size = 0.12. No change was obtained between peer acceptance (M = −1.36 μV) and peer rejection (M = −1.15 μV) conditions, F(1, 74) = 0.19, P < 0.67, effect size = 0.07. Experimental effects for each component and condition are displayed in Figure 6. Source results indicated activations were in the bilateral visual associated and primary visual lobe (BA18 and BA17), the bilateral occipital lobe (BA19), the bilateral parietal lobe (BA39 and BA7), and the PCC (BA31 and BA23).
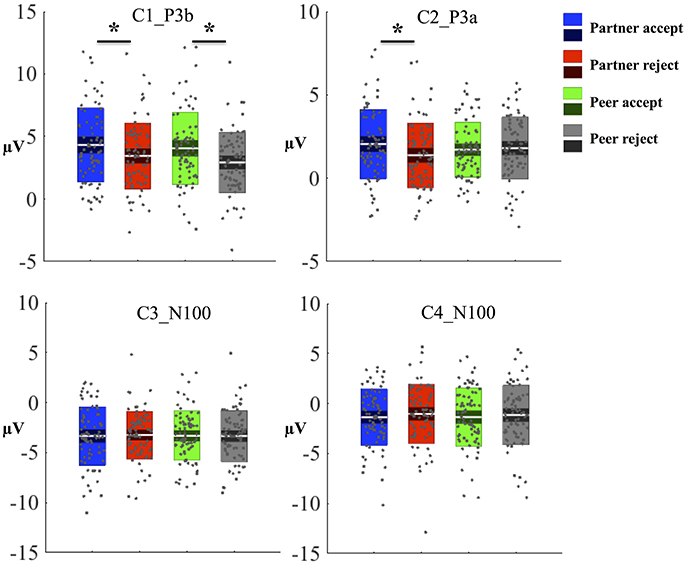
Figure 6. Experimental effects for each component and condition. Amplitude from each subject and condition was plotted as a gray dot and the mean amplitude was indicated as a whit line. The standard error (SEM, 95% confidence interval) and standard deviation (SD) were sub-plotted with white lines as boxes. One-way ANOVA was used to test statistical significant (*P < 0.05) between conditions.
Discussion
C1 and C2 Components
After the two-step PCA/ICA analysis, C1 and C2 are statically separated from overlapping activity, making their quantification more accurate and improving the statistical analysis. C1 has positive peak amplitude at 364 ms post-stimulus over the parietal area on the head surface (Figure 3B), while component C2 peaks at 288 ms post-stimulus and elicits a stronger frontocentral positive going wave (Figure 4B). The patterns of these results indicate that C1 and C2 can be identified respectively, as P3b and P3a related components with different scalp distributions and underlying cortical networks. The P3a has more of an anterior distribution compared to the P3b. A number of findings suggest that the P3a reflects a stimulus driven attention shift or social reward, while the P3b reflects task relevant information processing (Polich, 2007). P3a may be generated from frontal if sufficient attention is involved with task stimuli and P3b appears when information updating activations promote memory operations in the temporal-parietal junction brain area (Brazdil et al., 2001, 2003).
As the adolescents evaluated the response of romantic partners and unfamiliar peers in the Chatroom Interact Task, the initial electrophysiological response (P3a), maximal over frontomedial regions, was enhanced for acceptance (vs. rejection) responses of partners, but not for responses of peers. The implication may be that with strong expectations for the partner's evaluation the initial orienting of attention indexed by the P3a was differentially modulated by the partner's feedback. In contrast, the somewhat later (364 ms) P3b component showed a greater response for acceptance than rejection for both the partner and peer. This suggests that the more extended cognitive evaluation indexed by the P3b is adequately engaged in interpreting the acceptance feedback even from peers. Higher P3a and P3b amplitudes to acceptance are an extension to previous studies (Gunther Moor et al., 2010; van der Veen et al., 2014), implicating initial attention is paid to partner acceptance, whereas later processing is more oriented toward general social acceptance. Overall, these findings support the notion that adolescents' desires for affiliation are high, which are particularly focused on partner acceptance.
In the traditional ERP literature (Polich, 2007), the differentiation between P3a and P3b is made on the basis of their differential latency. However, because they are overlapping, statistical characterization of these components is improved through the statistical decomposition from methods like PCA and ICA. In the present research, the two-step temporal PCA then spatial ICA analysis provided superior separation of these components than either component analysis alone, adding further evidence to the robustness of this analytic method (Dien, 2010, 2012).
Comparison of Cortical Activation of C1/C2 Components with fMRI
Source estimation of the ERP components can be improved by whole head spatial sampling (including sensors over both the superior and inferior head surface) and a high resolution electrical conductivity head model (Song et al., 2015). In addition to its more frontal head surface distribution, source analysis suggests the P3a is generated in frontal, parietal, and anterior cingulate areas in the control of attention. Source analysis of the P3b suggested it is localized in parietal, temporal, and posterior cingulate areas that are engaged in information evaluation. Together, P3a and P3b reveal a widely distributed network pathway engaging both frontal and temporal-parietal areas (Polich, 2003). These source patterns associated with P3a and P3b generation are in line with other EEG studies (Volpe et al., 2007; Li et al., 2015; Lole et al., 2015), which have been carried out with different experimental designs and paradigms. Particularly, these sources are consistent with other reports (Mulert et al., 2004a,b; Volpe et al., 2007) that used the LORETA inverse solution. Furthermore, our source findings are also confirmed by the patterns of fMRI hemodynamic responses in the frontal, temporal, and parietal activations for distractor stimulus (P3a) and target stimulus (P3b) processing (Bledowski et al., 2004a,b).
C3 and C4 Components
In the present study, two more spatiotemporal components were extracted. C3 peaks at 164 ms post-stimulus and displays a positive deflection in the frontal lobe and a negative deflection in the occipital lobe (Figure 5B). Additionally, C4 peaks at 124 ms post-stimulus and presents a similar scalp distribution as C3. The main difference between C3 and C4 is their temporal course (164 vs. 124 ms), which is separated by PCA decomposition. The C3 and C4 can be considered as typical N1 related components, based on their topography maps and time course (Mangun et al., 1994; Senholzi and Ito, 2012). The apparent network patterns of the C3 and C4, including the visual, occipital and PCC areas, are consistent with the major locations of the N1 (Im et al., 2007; Poolman et al., 2008). Interestingly, the differing cortical networks for these similar visual components appear to reflect sources in right fusiform for C3 and bilateral parietal lobe for C4. N1 is elicited by the Chatroom Interact Task in response to visual stimulus change. Nonetheless, no significant differences were observed between partner and unfamiliar peer groups, nor between acceptance and rejection conditions. The absence of condition differences implies that adolescents do not track differences in feedback during this early stage of visual processing.
Limitations and Future Research
Although source analysis provided some suggestions of widespread frontal and posterior networks engaged in attentional orienting and cognitive evaluation, further understanding of the specific anatomy of these networks would require closer comparisons with imaging methods such as fMRI. Furthermore, the averaging of multiple trials in the ERP methodology may limit the understanding of time dynamics of individual trials, such as oscillatory EEG changes. In contrast to conventional ERP and PCA/ICA component analyses, EEG spectral analyses have revealed that EEG oscillations in particular frequency bands are functionally related to cognitive processing and behavior (Pfurtscheller and Lopes da Silva, 1999; Kuo et al., 2014). For example, our motor study has shown that the most robust effects were the beta-band (14–30 Hz) event-related desynchronizations (ERD, power decreases), appearing in all individuals, consistently localized to the hand region of the primary motor cortex, and consistently aligned with fMRI localizations (Kuo et al., 2014). In another study, the task-induced alpha oscillation has specific functional rules where low alpha ERD (8–10 Hz) is linked to attention and high alpha ERD (10–12 Hz) is associated with memory (Klimesch et al., 2003; Schack et al., 2005). Further research using spectral analysis may be useful for determining oscillatory dynamics in the process of understanding social feedback. In addition, the functional connectivity network analysis examines the patterns of coherence or correlations among cerebral networks, which is another approach integrated to EEG-based neuroimaging techniques. In the present study, the temporal-spatial analysis of the ERP separated the major cortical networks, but did not characterize their dynamic interaction. In future research, understanding the connection, communication, and causality among these source areas will be important for understanding social feedback, considering the brain-to-brain resonance in both partner and peer communications (Dumas et al., 2012; Yun et al., 2012; Hassan et al., 2015; Chennu et al., 2016).
Conclusion
The present study suggests that PCA/ICA component analysis can separate functionally distinct components effectively with different time courses and underlying cortical networks that contribute to the perceived social feedback from romantic partners and unfamiliar peers. Adolescents exhibited more attention to partner acceptance early in their processing of the neural communication (P3a) and similar cognitive processing for both partner and peer acceptance in the next stage (P3b) of cognitive evaluation. Our study provides a potentially influential methodological foundation for the development of future research, clinical treatment, and interventions.
Author Contributions
CCK, TH, and TD contributed to the design of the study. TH and AE were responsible for data acquisition. CCK and DT contributed to data analysis. All authors contributed to the interpretation and preparation of the manuscript. All authors approve the version that is currently under consideration and acknowledge that they are accountable for all aspects the work.
Funding
Electrical Geodesics, Inc., provided support in the form of salaries for authors CCK and DT, but did not have any additional role in the study design, data collection and analysis, decision to publish, or preparation of the manuscript. Support for this research was provided by the T. Denny Sanford School of Social and Family Dynamics at Arizona State University, as part of the Lives of Teens Enterprise and the REACH Institute to TH.
Conflict of Interest Statement
The authors declare that the research was conducted in the absence of any commercial or financial relationships that could be construed as a potential conflict of interest.
Acknowledgments
The authors are grateful to Phan Luu for consultation on interpreting ERP components, to Danielle Shore for programming the E-Prime paradigm and to Emily Drake, Adam Rogers, Franklin Poulsen, Katie Panza, Charlie Champion, and Gabrielle Stanley for their assistance in data acquisition.
References
Bledowski, C., Prvulovic, D., Goebel, R., Zanella, F. E., and Linden, D. E. (2004a). Attentional systems in target and distractor processing: a combined ERP and fMRI study. Neuroimage 22, 530–540. doi: 10.1016/j.neuroimage.2003.12.034
Bledowski, C., Prvulovic, D., Hoechstetter, K., Scherg, M., Wibral, M., Goebel, R., et al. (2004b). Localizing P300 generators in visual target and distractor processing: a combined event-related potential and functional magnetic resonance imaging study. J. Neurosci. 24, 9353–9360. doi: 10.1523/JNEUROSCI.1897-04.2004
Brazdil, M., Rektor, I., Daniel, P., Dufek, M., and Jurak, P. (2001). Intracerebral event-related potentials to subthreshold target stimuli. Clin. Neurophysiol. 112, 650–661. doi: 10.1016/S1388-2457(01)00463-1
Brazdil, M., Roman, R., Daniel, P., and Rektor, I. (2003). Intracerebral somatosensory event-related potentials: effect of response type (button pressing versus mental counting) on P3-like potentials within the human brain. Clin. Neurophysiol. 114, 1489–1496. doi: 10.1016/S1388-2457(03)00135-4
Cacioppo, S., Balogh, S., and Cacioppo, J. T. (2015). Implicit attention to negative social, in contrast to nonsocial, words in the Stroop task differs between individuals high and low in loneliness: evidence from event-related brain microstates. Cortex 70, 213–233. doi: 10.1016/j.cortex.2015.05.032
Chennu, S., O'Connor, S., Adapa, R., Menon, D. K., and Bekinschtein, T. A. (2016). Brain connectivity dissociates responsiveness from drug exposure during propofol-induced transitions of consciousness. PLoS Comput. Biol. 12:e1004669. doi: 10.1371/journal.pcbi.1004669
Crowley, M. J., Wu, J., McCarty, E. R., David, D. H., Bailey, C. A., and Mayes, L. C. (2009). Exclusion and micro-rejection: event-related potential response predicts mitigated distress. Neuroreport 20, 1518–1522. doi: 10.1097/WNR.0b013e328330377a
Crowley, M. J., Wu, J., Molfese, P. J., and Mayes, L. C. (2010). Social exclusion in middle childhood: rejection events, slow-wave neural activity, and ostracism distress. Soc. Neurosci. 5, 483–495. doi: 10.1080/17470919.2010.500169
Dannhauer, M., Brooks, D., Tucker, D., and MacLeod, R. (2012). A pipeline for the simulation of transcranial direct current stimulation for realistic human head models using SCIRun/BioMesh3D. Conf. Proc. IEEE Eng. Med. Biol. Soc. 2012, 5486–5489. doi: 10.1109/embc.2012.6347236
Delorme, A., and Makeig, S. (2004). EEGLAB: an open source toolbox for analysis of single-trial EEG dynamics including independent component analysis. J. Neurosci. Methods 134, 9–21. doi: 10.1016/j.jneumeth.2003.10.009
Delorme, A., Palmer, J., Onton, J., Oostenveld, R., and Makeig, S. (2012). Independent EEG sources are dipolar. PLoS ONE 7:e30135. doi: 10.1371/journal.pone.0030135
Dien, J. (2010). The ERP PCA Toolkit: an open source program for advanced statistical analysis of event-related potential data. J. Neurosci. Methods 187, 138–145. doi: 10.1016/j.jneumeth.2009.12.009
Dien, J. (2012). Applying principal components analysis to event-related potentials: a tutorial. Dev. Neuropsychol. 37, 497–517. doi: 10.1080/87565641.2012.697503
Dien, J., Beal, D. J., and Berg, P. (2005). Optimizing principal components analysis of event-related potentials: matrix type, factor loading weighting, extraction, and rotations. Clin. Neurophysiol. 116, 1808–1825. doi: 10.1016/j.clinph.2004.11.025
Dien, J., Spencer, K. M., and Donchin, E. (2004). Parsing the late positive complex: mental chronometry and the ERP components that inhabit the neighborhood of the P300. Psychophysiology 41, 665–678. doi: 10.1111/j.1469-8986.2004.00193.x
Dumas, G., Chavez, M., Nadel, J., and Martinerie, J. (2012). Anatomical connectivity influences both intra- and inter-brain synchronizations. PLoS ONE 7:e36414. doi: 10.1371/journal.pone.0036414
Eisenberger, N. I., Lieberman, M. D., and Williams, K. D. (2003). Does rejection hurt? An fMRI study of social exclusion. Science 302, 290–292. doi: 10.1126/science.1089134
Ferree, T. C., Luu, P., Russell, G. S., and Tucker, D. M. (2001). Scalp electrode impedance, infection risk, and EEG data quality. Clin. Neurophysiol. 112, 536–544. doi: 10.1016/S1388-2457(00)00533-2
Foti, D., Hajcak, G., and Dien, J. (2009). Differentiating neural responses to emotional pictures: evidence from temporal-spatial PCA. Psychophysiology 46, 521–530. doi: 10.1111/j.1469-8986.2009.00796.x
Furman, W., Ho, M. J., and Low, S. M. (2008). “The rocky road of adolescent romantic experience: dating and adjustment,” in Friends, Lovers and Groups: Key Relationships in Adolescence, eds. R. C. M. E. Engels, M. Kerr, and H. Stattin (New York, NY: John Wiley & Sons, Ltd.) 61–80. doi: 10.1002/9780470713211.ch4
Gunther Moor, B., Crone, E. A., and van der Molen, M. W. (2010). The heartbrake of social rejection: heart rate deceleration in response to unexpected peer rejection. Psychol. Sci. 21, 1326–1333. doi: 10.1177/0956797610379236
Gutz, L., Kupper, C., Renneberg, B., and Niedeggen, M. (2011). Processing social participation: an event-related brain potential study. Neuroreport 22, 453–458. doi: 10.1097/WNR.0b013e3283476b67
Guyer, A. E., Choate, V. R., Pine, D. S., and Nelson, E. E. (2012). Neural circuitry underlying affective response to peer feedback in adolescence. Soc. Cogn. Affect. Neurosci. 7, 81–92. doi: 10.1093/scan/nsr043
Guyer, A. E., McClure-Tone, E. B., Shiffrin, N. D., Pine, D. S., and Nelson, E. E. (2009). Probing the neural correlates of anticipated peer evaluation in adolescence. Child Dev. 80, 1000–1015. doi: 10.1111/j.1467-8624.2009.01313.x
Ha, T., Dishion, T. J., Overbeek, G., Burk, W. J., and Engels, R. C. (2014). The blues of adolescent romance: observed affective interactions in adolescent romantic relationships associated with depressive symptoms. J. Abnorm. Child Psychol. 42, 551–562. doi: 10.1007/s10802-013-9808-y
Ha, T., Overbeek, G., Cillessen, A. H., and Engels, R. C. (2012). A longitudinal study of the associations among adolescent conflict resolution styles, depressive symptoms, and romantic relationship longevity. J. Adolesc. 35, 1247–1254. doi: 10.1016/j.adolescence.2012.04.009
Ha, T., Yeung, E. W., Rogers, A. A., Poulsen, F. O., Kornienko, O., and Granger, D. A. (2016). Supportive behaviors in adolescent romantic relationships moderate adrenocortical attunement. Psychoneuroendocrinology 74, 189–196. doi: 10.1016/j.psyneuen.2016.09.007
Hammond, D. K., Scherrer, B., and Warfield, S. K. (2013). Cortical graph smoothing: a novel method for exploiting DWI-derived anatomical brain connectivity to improve EEG source estimation. IEEE Trans. Med. Imaging 32, 1952–1963. doi: 10.1109/TMI.2013.2271486
Hassan, M., Shamas, M., Khalil, M., El Falou, W., and Wendling, F. (2015). EEGNET: an open source tool for analyzing and visualizing M/EEG connectome. PLoS ONE 10:e0138297. doi: 10.1371/journal.pone.0138297
Im, C. H., Gururajan, A., Zhang, N., Chen, W., and He, B. (2007). Spatial resolution of EEG cortical source imaging revealed by localization of retinotopic organization in human primary visual cortex. J. Neurosci. Methods 161, 142–154. doi: 10.1016/j.jneumeth.2006.10.008
Klimesch, W., Sauseng, P., and Gerloff, C. (2003). Enhancing cognitive performance with repetitive transcranial magnetic stimulation at human individual alpha frequency. Eur. J. Neurosci. 17, 1129–1133. doi: 10.1046/j.1460-9568.2003.02517.x
Kuo, C. C., Luu, P., Morgan, K. K., Dow, M., Davey, C., Song, J., et al. (2014). Localizing movement-related primary sensorimotor cortices with multi-band EEG frequency changes and functional MRI. PLoS ONE 9:e112103. doi: 10.1371/journal.pone.0112103
Ledesma, R. D., and Valero-Mora, P. (2007). Determining the number of factors to retain in EFA: An easy-to-use computer program for carrying out parallel analysis. Pract. Assess. Res. Eval. 12, 1–11. Available online at: http://pareonline.net/pdf/v12n2.pdf
Li, K., Papademetris, X., and Tucker, D. M. (2016). BrainK for structural image processing: creating electrical models of the human head. Comput. Intell. Neurosci. 2016:1349851. doi: 10.1155/2016/1349851
Li, Y., Wang, W., Liu, T., Ren, L., Zhou, Y., Yu, C., et al. (2015). Source analysis of P3a and P3b components to investigate interaction of depression and anxiety in attentional systems. Sci. Rep. 5:17138. doi: 10.1038/srep17138
Lole, L., Gonsalvez, C. J., and Barry, R. J. (2015). Reward and punishment hyposensitivity in problem gamblers: a study of event-related potentials using a principal components analysis. Clin. Neurophysiol. 126, 1295–1309. doi: 10.1016/j.clinph.2014.10.011
Luu, P., Caggiano, D. M., Geyer, A., Lewis, J., Cohn, J., and Tucker, D. M. (2014). Time-course of cortical networks involved in working memory. Front. Hum. Neurosci. 8:4. doi: 10.3389/fnhum.2014.00004
Mangun, G. R., Luck, S. J., Plager, R., Loftus, W., Hillyard, S. A., Handy, T., et al. (1994). Monitoring the visual world: hemispheric asymmetries and subcortical processes in attention. J. Cogn. Neurosci. 6, 267–275. doi: 10.1162/jocn.1994.6.3.267
Masten, C. L., Telzer, E. H., Fuligni, A. J., Lieberman, M. D., and Eisenberger, N. I. (2012). Time spent with friends in adolescence relates to less neural sensitivity to later peer rejection. Soc. Cogn. Affect. Neurosci. 7, 106–114. doi: 10.1093/scan/nsq098
Monroe, S. M., Rohde, P., Seeley, J. R., and Lewinsohn, P. M. (1999). Life events and depression in adolescence: relationship loss as a prospective risk factor for first onset of major depressive disorder. J. Abnorm. Psychol. 108, 606–614. doi: 10.1037/0021-843X.108.4.606
Moor, B. G., Guroglu, B., Op de Macks, Z. A., Rombouts, S. A., Van der Molen, M. W., and Crone, E. A. (2012). Social exclusion and punishment of excluders: neural correlates and developmental trajectories. Neuroimage 59, 708–717. doi: 10.1016/j.neuroimage.2011.07.028
Mulert, C., Jager, L., Schmitt, R., Bussfeld, P., Pogarell, O., Moller, H. J., et al. (2004a). Integration of fMRI and simultaneous EEG: towards a comprehensive understanding of localization and time-course of brain activity in target detection. Neuroimage 22, 83–94. doi: 10.1016/j.neuroimage.2003.10.051
Mulert, C., Pogarell, O., Juckel, G., Rujescu, D., Giegling, I., Rupp, D., et al. (2004b). The neural basis of the P300 potential. Focus on the time-course of the underlying cortical generators. Eur. Arch. Psychiatry Clin. Neurosci. 254, 190–198. doi: 10.1007/s00406-004-0469-2
Pascual-Marqui, R. D., Lehmann, D., Koenig, T., Kochi, K., Merlo, M. C., Hell, D., et al. (1999). Low resolution brain electromagnetic tomography (LORETA) functional imaging in acute, neuroleptic-naive, first-episode, productive schizophrenia. Psychiatry Res. 90, 169–179. doi: 10.1016/S0925-4927(99)00013-X
Pascual-Marqui, R. D., Michel, C. M., and Lehmann, D. (1994). Low resolution electromagnetic tomography: a new method for localizing electrical activity in the brain. Int. J. Psychophysiol. 18, 49–65. doi: 10.1016/0167-8760(84)90014-X
Pfurtscheller, G., and Lopes da Silva, F. H. (1999). Event-related EEG/MEG synchronization and desynchronization: basic principles. Clin. Neurophysiol. 110, 1842–1857. doi: 10.1016/S1388-2457(99)00141-8
Polich, J. (2003). Detection of Change: Event-Related Potential and fMRI Findings. Boston: Kluwer Academic Publishers.
Polich, J. (2007). Updating P300: an integrative theory of P3a and P3b. Clin. Neurophysiol. 118, 2128–2148. doi: 10.1016/j.clinph.2007.04.019
Poolman, P., Frank, R. M., Luu, P., Pederson, S. M., and Tucker, D. M. (2008). A single-trial analytic framework for EEG analysis and its application to target detection and classification. Neuroimage 42, 787–798. doi: 10.1016/j.neuroimage.2008.03.031
Salman, A., Malony, A., Turovets, S., Volkov, V., Ozog, D., and Tucker, D. (2015). Concurrency in electrical neuroinformatics: parallel computation for studying the volume conduction of brain electrical fields in human head tissues. Concurr. Comp. Prac. Exp. 28, 2213–2236. doi: 10.1002/cpe.3510
Schack, B., Klimesch, W., and Sauseng, P. (2005). Phase synchronization between theta and upper alpha oscillations in a working memory task. Int. J. Psychophysiol. 57, 105–114. doi: 10.1016/j.ijpsycho.2005.03.016
Senholzi, K. B., and Ito, T. A. (2012). Structural face encoding: how task affects the N170's sensitivity to race. Soc. Cogn. Affect. Neurosci. 8, 937–942. doi: 10.1093/scan/nss091
Silk, J. S., Stroud, L. R., Siegle, G. J., Dahl, R. E., Lee, K. H., and Nelson, E. E. (2012). Peer acceptance and rejection through the eyes of youth: pupillary, eyetracking and ecological data from the Chatroom Interact task. Soc. Cogn. Affect. Neurosci. 7, 93–105. doi: 10.1093/scan/nsr044
Somerville, L. H., Heatherton, T. F., and Kelley, W. M. (2006). Anterior cingulate cortex responds differentially to expectancy violation and social rejection. Nat. Neurosci. 9, 1007–1008. doi: 10.1038/nn1728
Somerville, L. H., Kelley, W. M., and Heatherton, T. F. (2010). Self-esteem modulates medial prefrontal cortical responses to evaluative social feedback. Cereb. Cortex 20, 3005–3013. doi: 10.1093/cercor/bhq049
Song, J., Davey, C., Poulsen, C., Luu, P., Turovets, S., Anderson, E., et al. (2015). EEG source localization: sensor density and head surface coverage. J. Neurosci. Methods 256, 9–21. doi: 10.1016/j.jneumeth.2015.08.015
Steinberg, L., and Morris, A. S. (2001). Adolescent development. J. Cogn. Educ. Psychol. 2, 55–87. doi: 10.1891/194589501787383444
Sullivan, G. M., and Feinn, R. (2012). Using effect size—or why the p value is not enough. J. Grad. Med. Educ. 4, 279–282. doi: 10.4300/JGME-D-12-00156.1
Themanson, J. R., Ball, A. B., Khatcherian, S. M., and Rosen, P. J. (2014). The effects of social exclusion on the ERN and the cognitive control of action monitoring. Psychophysiology 51, 215–225. doi: 10.1111/psyp.12172
Tucker, D. M. (1993). Spatial sampling of head electrical fields: the geodesic sensor net. Electroencephalogr. Clin. Neurophysiol. 87, 154–163. doi: 10.1016/0013-4694(93)90121-B
van der Veen, F. M., van der Molen, M. W., Sahibdin, P. P., and Franken, I. H. (2014). The heart-break of social rejection versus the brain wave of social acceptance. Soc. Cogn. Affect. Neurosci. 9, 1346–1351. doi: 10.1093/scan/nst120
Volpe, U., Mucci, A., Bucci, P., Merlotti, E., Galderisi, S., and Maj, M. (2007). The cortical generators of P3a and P3b: a LORETA study. Brain Res. Bull. 73, 220–230. doi: 10.1016/j.brainresbull.2007.03.003
Keywords: adolescent couples, social interaction, dense-array EEG, principal component analysis, event-related potential, source localization
Citation: Kuo C-C, Ha T, Ebbert AM, Tucker DM and Dishion TJ (2017) Dynamic Responses in Brain Networks to Social Feedback: A Dual EEG Acquisition Study in Adolescent Couples. Front. Comput. Neurosci. 11:46. doi: 10.3389/fncom.2017.00046
Received: 01 February 2017; Accepted: 16 May 2017;
Published: 31 May 2017.
Edited by:
Konstantinos Michmizos, Rutgers University, United StatesReviewed by:
Sheraz Khan, Massachusetts General Hospital, United StatesEleonora Tamilia, Boston Children's Hospital, Harvard Medical School, United States
Copyright © 2017 Kuo, Ha, Ebbert, Tucker and Dishion. This is an open-access article distributed under the terms of the Creative Commons Attribution License (CC BY). The use, distribution or reproduction in other forums is permitted, provided the original author(s) or licensor are credited and that the original publication in this journal is cited, in accordance with accepted academic practice. No use, distribution or reproduction is permitted which does not comply with these terms.
*Correspondence: Ching-Chang Kuo, bkuo@egi.com