Imaging retinal blood flow with laser speckle flowmetry
- Department of Neuroscience, University of Minnesota, Minneapolis, MN, USA
Laser speckle flowmetry (LSF) was initially developed to measure blood flow in the retina. More recently, its primary application has been to image baseline blood flow and activity-dependent changes in blood flow in the brain. We now describe experiments in the rat retina in which LSF was used in conjunction with confocal microscopy to monitor light-evoked changes in blood flow in retinal vessels. This dual imaging technique permitted us to stimulate retinal photoreceptors and measure vessel diameter with confocal microscopy while simultaneously monitoring blood flow with LSF. We found that a flickering light dilated retinal arterioles and evoked increases in retinal blood velocity with similar time courses. In addition, focal light stimulation evoked local increases in blood velocity. The spatial distribution of these increases depended on the location of the stimulus relative to retinal arterioles and venules. The results suggest that capillaries are largely unresponsive to local neuronal activity and that hemodynamic responses are mediated primarily by arterioles. The use of LSF to image retinal blood flow holds promise in elucidating the mechanisms mediating functional hyperemia in the retina and in characterizing changes in blood flow that occur during retinal pathology.
Introduction
Laser speckle flowmetry (LSF) has been successfully employed to measure blood flow in the CNS for three decades. It has the distinct advantage over other methods of monitoring blood flow, such as laser Doppler flowmetry, as it can produce two-dimensional images of blood flow with high spatial and temporal resolution.
The principals underlying LSF have been described in detail elsewhere (Fercher and Briers, 1981; Dunn et al., 2001; Yuan et al., 2005). Briefly, when an optically rough surface is illuminated with coherent light, a speckle pattern is produced as the incident light is reflected off of surfaces lying at different depths. Some areas of the surface appear bright due to constructive interference while other areas appear dark due to destructive interference. If the surface is stationary, the speckle pattern of bright and dark spots will remain stationary as well. However, if the surface moves (e.g., blood cells moving through vessels), the speckle pattern will blur with time. Thus, a stationary region on the surface will have a high speckle contrast while a moving region will have a low speckle contrast when imaged over the appropriate time window (Yuan et al., 2005). In practice, local speckle contrast is calculated by imaging a surface with a digital camera and computing the standard deviation of brightness divided by the mean brightness over a small array of pixels. The resulting speckle contrast value is used to evaluate relative velocity. With modern computational techniques, speckle contrast can be calculated and speckle images analyzed almost instantaneously.
Although LSF has been used in many studies to monitor blood flow in the cortex (Bolay et al., 2002; Ayata et al., 2004; Durduran et al., 2004), the very first use of LSF was to monitor blood flow in the retina. The first studies (Fercher and Briers, 1981; Briers and Fercher, 1982) were conducted in the early 1980s, before it was practical to calculate speckle contrast with digital techniques. Instead, the retina was imaged on film and speckle contrast images were obtained with high-pass spatial filtering optical techniques. The resulting images displayed patterns of blood flow in the human retina, with arterioles and venules highlighted because the velocity of blood flow was greatest in these vessels.
More recently, LSF has been used to monitor blood flow in the retina using digital cameras and computational techniques to calculate speckle contrast images. Retinal vessels have been imaged in rabbit (Tamaki et al., 1994) and rat (Cheng et al., 2008) retinas and changes in blood flow have been monitored in response to varying intraocular pressure and varying levels of inspired oxygen. LSF has also been employed to investigate the effects of glaucoma therapies on retinal circulation in rabbits (Tamaki et al., 1997b), monkeys (Ishii and Araie, 2000), and people (Koseki et al., 2008) and to monitor the choroidal circulation in patients with polypoidal choroidal vasculopathy (Watanabe et al., 2008).
We now describe results obtained using LSF to image blood flow in the in vivo rat retina. The goals of this project were twofold. First, we wanted to develop a technique to combine LSF with laser scanning confocal microscopy of the retina. This would allow us to monitor spatial and temporal patterns of retinal blood flow with LSF while simultaneously monitoring the diameter of retinal vessels with confocal line scans. An added benefit of this technique is that a second channel of the confocal microscope can generate spatially and temporally defined visual stimuli to activate retinal photoreceptors.
The second goal of this project was to determine whether blood flow is regulated at the local level in the retina. In the brain, localized increases in neuronal activity lead to spatially restricted increases in blood flow (Iadecola and Nedergaard, 2007). This hemodynamic response, termed functional hyperemia, supplies active neurons with needed oxygen and nutrients. Previous work using laser Doppler flowmetry and other techniques (Riva et al., 2005) has shown that global stimulation of the retina results in global increases in retinal blood flow. In addition, an fMRI study has demonstrated that when one-half of the retina is stimulated with light, blood flow increases in that half, but not the other half of the retina (Duong et al., 2002). However, fMRI does not currently have the resolution to accurately determine the spatial extent of the functional hyperemia response in the retina. Laser speckle flowmetry, in contrast, is ideally suited to mapping the spatial extent of blood flow increases evoked by focal stimulation (Dunn et al., 2001; Ayata et al., 2004).
We describe in this report methods for successfully combining LSF and laser scanning confocal microscopy to monitor blood flow in the retina of the anesthetized rat. With this combined imaging system, we use confocal microscopy to stimulate photoreceptors in restricted retinal regions while simultaneously monitoring arteriole diameter with confocal line scans. At the same time, we use LSF to visualize spatial patterns of blood flow changes. We find that, as in the brain, focal stimulation of retinal photoreceptors does indeed produce localized increases in blood flow in the retinal circulation. Spatial patterns of functional hyperemia responses suggest that blood flow is regulated primarily by first and second order arterioles in the retina, but not by capillaries or venules.
Materials and Methods
In vivo Retina Preparation
Experiments were performed on male Long-Evans rats (250–350 g). Animals were treated in accordance with the guidelines of the Institutional Animal Care and Use Committee of the University of Minnesota. The initial surgery was performed under isoflurane anesthesia (2%). The femoral vein and artery on the left side were cannulated for drug administration and monitoring of blood pressure. The animal was placed in a modified stereotaxic holder with a three-point head restraint. The cornea and conjunctiva of the right eye were numbed with proparacaine hydrochloride (0.5% solution) and the pupil dilated with atropine sulfate (1% solution). The stereotaxic holder was fixed to a movable stage below an upright microscope that served to image the retina for both LSF and confocal microscopy. An IV bolus of atropine (0.1 mg/kg) was delivered prior to any eye manipulations to counter the oculocardiac reflex, which can reduce blood pressure.
Following surgery, anesthesia was maintained for the duration of the experiment by continuous infusion of α-chloralose (55 mg/kg/h). A soluble form of α-chloralose (α-chloralose-HBC-complex, Sigma) was used. Animals were paralyzed with gallamine triethiodide (initial bolus of 15 mg/kg and continuous infusion at 15 mg/kg/h) to prevent eye movements. Depth of anesthesia was assessed by monitoring heart rate and blood pressure and anesthesia infusion adjusted accordingly. Core body temperature was monitored and maintained at 37°C (TC-1000 Temperature Controller, CWE). Blood oxygen saturation level and heart rate (MouseOx, Starr Life Sciences Corp), arterial blood pressure (Pressure Monitor BP-1, World Precision Instruments), and end-tidal CO2 (microCapStar, CWE) were monitored continuously. Blood gases and pH were sampled periodically (Instrumentation Laboratory Gem Premier 3000). The animal was artificially ventilated (40–50 breaths/min; CWE SAR-830-P) and blood oxygen saturation level, end-tidal CO2 and mean arterial pressure maintained within physiological limits (92–97%, 35–45 mm Hg, and 90–115 mm Hg respectively) by adjusting the ventilator breath rate and pressure and the O2 level of the inspired air.
Retinal Imaging
The retina was viewed through the cornea and lens with an Olympus BX61W1 upright microscope and 4× and 10× dry objectives. The refractive properties of the cornea were neutralized by placing gonioscopic prism solution and a contact lens (5.4 mm fundus laser lens, Ocular Instruments) over the cornea (Figure 1A). A CoolSnap ES digital CCD camera (Photometrics) was attached to the phototube of the microscope for LSF. The retina was imaged simultaneously with an Olympus FluoView 1000 laser scanning confocal microscope. Light from the retina was separated by a dichroic mirror (T600lpxr, Chroma Technology) in the microscope, with 808 nm light passing through to the LSF digital camera and 400–600 nm wavelengths reflected into the confocal scanner (Figure 1B). An 808 nm bandpass filter was placed in front of the LSF camera to block residual visible wavelengths.
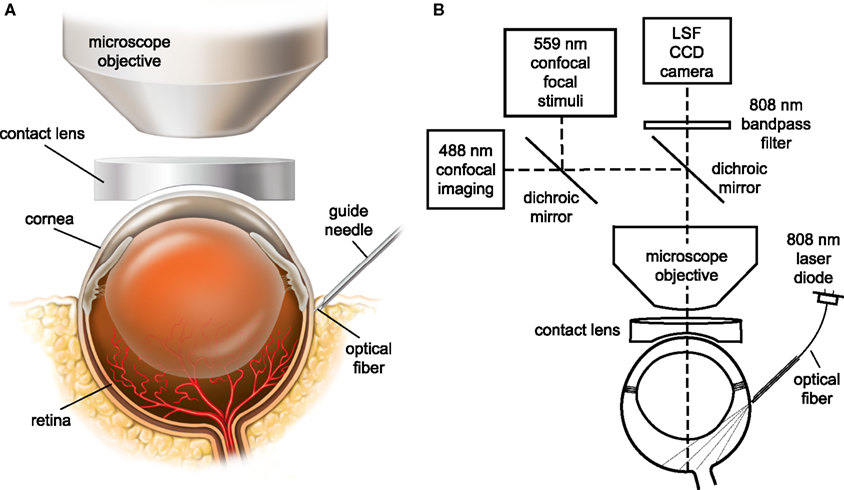
Figure 1. The in vivo rat preparation for monitoring retinal blood flow with simultaneous laser speckle flowmetry (LSF) and confocal microscopy. (A) The retina is imaged through an upright microscope and a contact lens placed over the cornea. A hypodermic needle serves as a guide tube for an optical fiber for LSF illumination. (B) The retina is illuminated for LSF by 808 nm light passing though an optical fiber that is inserted into the hypodermic needle guide tube. The retina is imaged simultaneously for LSF and confocal microscopy. A dichroic mirror directs the appropriate wavelengths of light from the retina to the LSF camera and the confocal microscope. An 808 nm bandpass filter prevents confocal excitation or emission light from entering the LSF camera. The confocal microscope has a primary scanner (488 nm) for imaging retinal vessels and a secondary scanner for generating 559 nm stimulating light.
Laser Speckle Flowmetry
Retinal blood flow was monitored by LSF. The retina was illuminated with 808 nm infrared light from a laser diode (200 mW, L808P200, ThorLabs) and imaged with the digital camera. The retina was illuminated by focusing light from the laser diode onto one end of an optical fiber (240 μm diameter) and placing the other end of the fiber against the globe. The end of the optical fiber was positioned on the eye at a 35° angle from the horizontal, approximately 1.5 mm below the limbus. The precise position of the end of the optical fiber was adjusted to maximize signals from the retinal vasculature and minimize signals from the choroidal circulation. The infrared beam emerging from the optical fiber was sufficiently dim as to not cause damage to the eye and was kept on continuously.
Images of the retina were acquired with a 40 ms exposure time. In preliminary experiments, we found that shorter exposure times reduced the speckle signals in smaller vessels, while longer exposure times decreased the signals in larger vessels (Yuan et al., 2005). Two-dimensional LSF images were calculated using a custom MatLab routine. Raw images were spatially binned into 5 × 5 pixel arrays and speckle contrast values computed using the following relation (Dunn et al., 2001),

LSF ratio images, showing changes in blood flow produced by light stimulation, were computed by first averaging all speckle images acquired before a stimulus and the images acquired during a stimulus and dividing the latter averaged image by the former. Ratio images were low pass filtered to reduce noise. In ratio images, regions with values less than 1 (decreased speckle contrast) indicate areas of stimulus-induced increase in blood flow.
The relative velocity of blood flow can be derived from speckle contrast values using a computationally intensive relation (Fercher and Briers, 1981). However, over the limited range of speckle contrast values that we observed experimentally (0.2–0.4), relative velocity values can be approximated using the following relation (Cheng and Duong, 2007),
We used this relation to compute blood velocity images from speckle contrast images. As above, images showing changes in blood velocity were obtained by computing blood velocity ratio images. Blood velocity images obtained during light stimulation were divided by those obtained during a pre-stimulus period.
Confocal Microscopy
The diameter of retinal arterioles was monitored with laser scanning microscopy. Blood vessels were labeled by IV injection of dextran–fluorescein (2,000,000 MW, 1 ml, 3% solution) and imaged with 488 nm illumination. The luminal diameter of the vessels was assessed with confocal line scans drawn perpendicular to the vessel. In the resulting distance vs. time line scan images (see Figure 4B) vessel dilation is seen as a widening of the bright lumen of the vessel. Luminal diameter vs time graphs were calculated using a custom MatLab routine.
Light Stimulation
Retinal photoreceptors were stimulated by light generated by the secondary (SIM) scanner of the FluoView 1000 laser scanning confocal microscope. Using the SIM scanner, the wavelength, intensity and scanning of a laser beam can be controlled independently of light from the primary scanner, which was used to acquire line scan images of retinal vessels.
We stimulated retinal photoreceptors with a 12 Hz flickering 559 nm light of 15 s duration. The luminous flux of the stimulus was 0.02 lumens. A flicker frequency of 12 Hz was chosen because it produces a maximal functional hyperemia response in many species (Riva et al., 2005). A flicker rate of 12 Hz with a duty cycle of 50% was generated by scanning a 135 by 20 μm region of the retina with the secondary confocal scanner. With a pixel dwell time of 100 μs, this elongated horizontal rectangle was scanned downwards in 42 ms. At the end of the scan, the 559 nm light was blanked and the beam returned to the top of the rectangle. The return scan took an additional 42 ms. When the scan is repeated continuously, a flickering 12 Hz light is produced. Although the dimensions of the scanned rectangle were chosen to generate the appropriate stimulus frequency, the rectangular region is sufficiently small compared to the overall size of the retina to be useful for mapping localized hemodynamic responses.
Retinal photoreceptors were also stimulated with a 12 Hz diffuse white light having a luminous flux of 1.9 lumens falling on the eye. Light from a fiber optic illuminator was gated with an electromechanical shutter and focused onto the eye through a fiber bundle. This light effectively stimulated the entire retinal surface.
Results
Simultaneous Confocal and LSF Imaging of the Retina
We imaged the retina through the cornea and lens using an upright microscope though which confocal and laser speckle images were obtained simultaneously. The refractive properties of the cornea were neutralized with a contact lens placed between the eye and the microscope objective lens (Figure 1A). For LSF, the retina was illuminated with 808 nm infrared light (Figure 1B). This wavelength is well outside the absorption range of photoreceptor photopigments (Jacobs et al., 2001). Thus, retinal photoreceptors and neurons were not stimulated by the LSF illumination light.
Arterioles and venules, which radiate from the optic disc, can be visualized simultaneously by confocal microscopy and LSF. This is illustrated in Figure 2, where a confocal image of retinal vessels is shown in Figure 2A, a raw laser speckle image acquired simultaneously in Figure 2B, a computed laser speckle contrast image in Figure 2C and a computed blood velocity image in Figure 2D. In the confocal image (Figure 2A), primary arterioles and venules, filled with fluorescent dye, radiate from the optic disc at the bottom left. Arterioles can be distinguished from venules by their smaller diameter. Secondary and tertiary arterioles, branching from the primary vessels, are clearly seen in this image, as are retinal capillaries. In the raw speckle image (Figure 2B), the larger vessels are seen as regions of reduced speckle contrast. They appear smoother than surrounding retinal areas, which are more speckled. When a speckle contrast image (Figure 2C) is computed from the raw image, the larger vessels appear darker. This is because blood is flowing more rapidly through the larger vessels, resulting in blurring of the speckles and lowering of the speckle contrast. Computed speckle contrast (Eq. 1) is invariant with incident illumination. Thus, the intensity of the speckle contrast image (excluding the major vessels) is relatively uniform, even though the intensity of the raw speckle image (Figure 2B) varies greatly. When a blood velocity image (Figure 2D) is computed from the speckle contrast image, vessels with high blood velocity appear brighter. Blood velocity is roughly proportional to pixel intensity in this image and is greatest in the primary arterioles and venules.
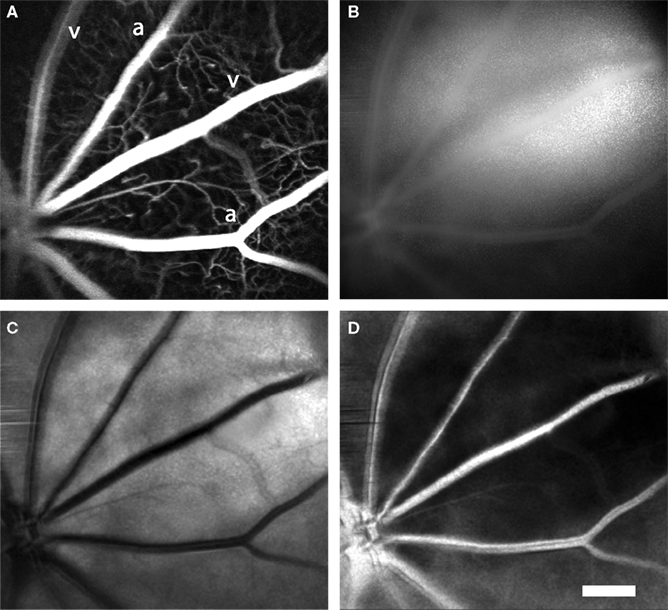
Figure 2. Laser speckle flowmetry of retinal blood vessels. (A) Confocal image of retinal blood vessels labeled with dextran-fluorescein. Primary arterioles and venules are seen radiating from the optic disc (at the lower left). (B) Raw speckle image acquired simultaneously from the same retina as (A). Note that there is less speckling in the regions corresponding to the major vessels. (C) Speckle contrast image calculated from (B). Dark lines indicate regions of reduced speckle contrast, generated by blood flowing rapidly through the primary retinal vessels. (D) Blood velocity image calculated from (C). The brighter areas indicate greater blood velocity. In this and subsequent figures, primary arterioles and venules are labeled “a” and “v,” respectively. Scale bar for all panels, 250 μm.
Illumination of the Retina
The LSF in the retina has previously been achieved using a custom fundus camera that allows on-axis illumination of coherent light that passes through the cornea and lens (Tamaki et al., 1994). However, when using an upright microscope to obtain simultaneous LSF and confocal images, on-axis illumination is difficult to implement in practice. Reflection of the coherent light off of the microscope lenses and the contact lens produces strong interference patterns which obscure portions of the LSF images.
Instead of using on-axis illumination, we have employed an off-axis method of illumination. Light from an 808 nm laser diode is directed through an optical fiber and onto the sclera at the appropriate position and angle to illuminate the retinal area being imaged (Figure 1B). Sufficient light passes through the sclera and the retinal pigment epithelium to illuminate the retina. This trans-scleral illumination pathway is aided by the use of infrared light, which passes through tissue more easily than does visible light. Depending on the precise position of the optical fiber illuminating the globe, either the retinal vasculature or the choroidal circulation is imaged. When the optical fiber is positioned 1–2 mm posterior to the limbus, the retinal circulation is visualized (Figure 3A). The pattern of arterioles and venules corresponds to the fluorescence confocal image of the fluorescein-filled vessels (Figure 3B). In some preparations, indistinct splotches, as well as the retinal vessels, are seen in speckle contrast and blood velocity images (Figure 3A, arrowheads). These splotches are out of focus choroidal vessels. As the focus is shifted to the plane of the choroid and the end of the illuminating fiber is moved towards the posterior pole of the globe, the choroidal circulation becomes more distinct (Figure 3C). The splotches seen in images of the retinal vessels correspond to the larger choroidal vessels (Figure 3C, arrowheads). Although LSF images of choroidal vessels are of reduced quality, one must bear in mind that the vessels are imaged through 350 μm of tissue and a heavily pigmented layer, the retinal pigment epithelium. The size and branching patterns of the choroidal vessels imaged with LSF resemble those seen in corrosion casts of the choroidal vasculature (Figure 3D).
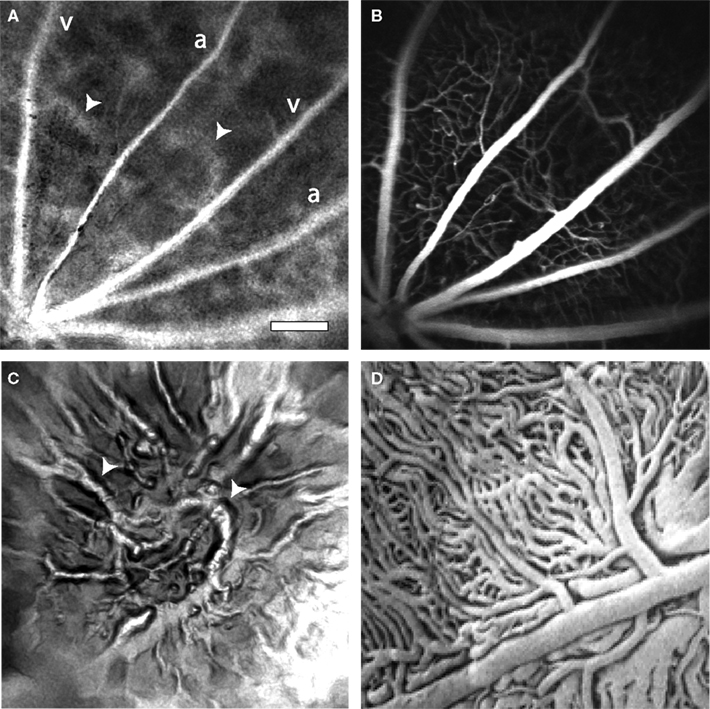
Figure 3. Laser speckle flowmetry of the retinal and choroidal vasculature. (A) A blood velocity image of retinal vessels. In addition to the primary arterioles and venules, indistinct splotches (arrowheads), which are generated by choroidal vessels, are seen. (B) Confocal image of the retinal vasculature from the same retinal region as (A). (C) A blood velocity image of choroidal vessels in the same preparation as (A) and (B). The image was obtained by adjusting the focal plane of the microscope and moving the illuminating optical fiber toward the posterior pole of the globe. The splotches visible in (A) correspond to major choroidal vessels (arrowheads) visible in (C). (D) A corrosion cast of the choroidal vasculature of the rat, reproduced at the same magnification as the other panels. Note that the size and branching patterns of the vessels are similar to those in (C). From Bhutto and Amemiya (2001), used with permission. Scale bar for all panels, 250 μm.
Light-Evoked Changes in Arteriole Diameter
We monitored light-evoked changes in retinal circulation using both confocal microscopy and LSF. Retinal arterioles dilate in response to light stimulation (Riva et al., 2005). This dilation can be quantified with confocal line scans. A line oriented perpendicular to an arteriole (Figure 4A, yellow line) is repeatedly scanned for the duration of a trial. The resulting line scan image (Figure 4B) displays the vessel diameter as a function of time. When retinal photoreceptors are stimulated (Figure 4B, white bar), the vessel dilates. A plot of vessel diameter vs. time (Figure 4D, trace 2) shows that light evokes a rapid increase in vessel diameter with a latency of approximately 1 s. Typically, a flickering light evoked a biphasic response consisting of a transient dilation lasting around 5 s followed by a sustained increase in vessel diameter. In a series of trials, vessel dilation averaged 8.87 ± 0.71% (S.E.M.; n = 60, six animals) of baseline diameter. Latency to the onset of dilation (time to 50% peak amplitude) was 1.51 ± 0.06 s (n = 52, six animals).
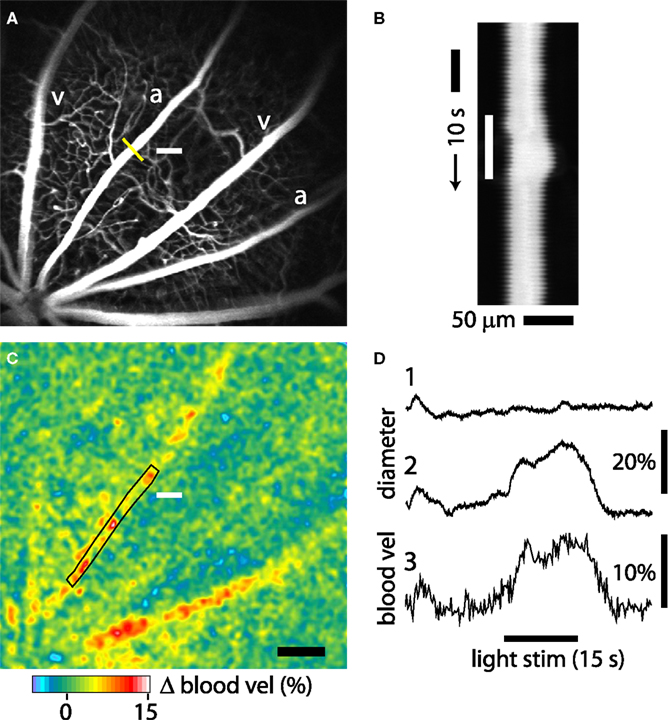
Figure 4. Light-evoked changes in retinal blood flow measured with confocal microscopy and LSF. (A) Confocal image of retinal vessels. The diameter of the upper arteriole was measured with confocal line scans (yellow line). The nearby white bar indicates the location of the flickering light stimulus in panels (A) and (C). Scale bar for panels (A) and (C), 250 μm. (B) Line scan image obtained from the arteriole in (A). Distance [across the yellow line in (A)] is plotted as a function of time. A flickering light [white bar in (B)] evokes vessel dilation, indicated by the widening of the vessel cross section. The uneven edges of the vessel are caused by a respiratory movement artifact. (C) Blood velocity ratio image, showing the light-evoked change in velocity, calculated at 2–5 s after onset of the stimulus. The flickering light evoked large blood velocity increases in the two primary arterioles and smaller increases in the venules. (D) Time course of the light-evoked responses. (Trace 1) Change in arteriole diameter [measured at the yellow line in (A)] evoked by the onset of the 488 nm line scan excitation light, at the beginning of the trace. The flickering light stimulus was not turned on. The small response decayed within 10 s. (Trace 2) The same conditions as trace 1, except that the flickering light stimulus (black bar at bottom) was turned on. (Trace 3) change in blood velocity within the same arteriole, measured in the rectangular region indicated in (C). Changes in light-evoked arteriole diameter and blood velocity were similar.
Changes in blood velocity were monitored simultaneously with vessel diameter using LSF. Hemodynamic responses were analyzed by calculating blood velocity images from raw speckle images using Eqs 1 and 2. Changes in blood velocity were visualized by calculating blood velocity ratio images. Averaged velocity images obtained during the transient phase of the light response (2–5 s following stimulus onset) were divided by the averaged images obtained prior to stimulation. Six to 15 ratio images from sequential trials were averaged together to improve signal to noise. In these averaged pseudocolor ratio images, increased blood velocity is indicated by yellows, reds and white. The velocity ratio image for the trial illustrated in Figure 4C, shows a prominent light-evoked increase in blood velocity in the primary arteriole adjacent to the stimulus as well as in a neighboring primary arteriole. Smaller velocity increases are seen in the primary venules. The time course of velocity within one of the arterioles (measured within the boxed area in Figure 4C) is illustrated in Figure 4D, trace 3. It has a similar time course to the dilation measured in the same vessel (Figure 4D, trace 2).
Line scan measurements of arteriole diameter were made using 488 nm light, which stimulates retinal photoreceptors as well as exciting the dye used to image vessels. Although the intensity of the 488 nm light was far dimmer (typically 400-fold) than the 559 nm light used to stimulate retinal photoreceptors, onset of the line scan light did, in many trials, evoke a vascular response. However, as shown in Figure 4D, both the increase in vessel diameter (trace 2) and the increase in blood velocity (trace 3) evoked by the onset of the line scan light were substantially smaller than the responses evoked by the 559 nm flickering stimulus. In addition, the response to the onset of the line scan light decayed rapidly (Figure 4D, trace 1), well before the flickering stimulus was turned on. It should be noted that the 488 nm light was not turned on when only blood velocity, and not vessel diameter, was monitored (Figure 5).
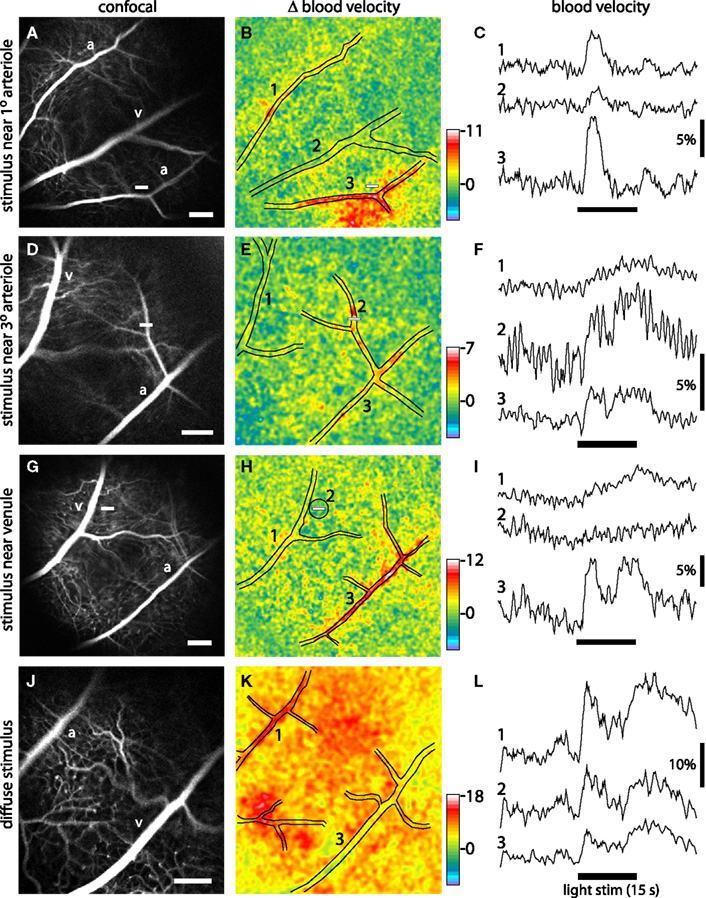
Figure 5. Blood velocity increases evoked by focal and diffuse light stimulation. Each row in the figure represents a different stimulus condition. Top three rows, the retina was stimulated with a focal, 15 s flickering light. Bottom row, the retina was stimulated with a diffuse 15 s flickering light. The left panels of each row show confocal images of the retina. Scale bars (at the bottom right of each panel), 250 μm. The middle panels show blood velocity ratio images for the same retinal regions. The pseudocolor images show the change in blood velocity at 2–5 s after stimulus onset and the pseudocolor scale bars indicates Δ velocity in percent. The locations of the large vessels are indicated by black lines. The small white bars in the left and middle panels indicate the locations of the focal stimulus. The right panels show the time course of blood velocity changes evoked by the light stimulus (black bars below the traces) for selected retinal regions. The region where each measurement was made is indicated by the numbers in the middle panels. Except when otherwise noted, blood velocity was measured within arterioles or venules. (A–C) The retina was stimulated near a branch point of first and second order arterioles. Blood velocity was measured in a non-stimulated arteriole (1), a venule (2), and the stimulated arteriole (3). Increased blood velocity was greatest within and in the regions immediately surrounding the stimulated arteriole. (D–F) The stimulus was near a third order arteriole. Blood velocity was measured in a venule (1), the stimulated third order arteriole (2), and the upstream first order arteriole (3). Increased blood velocity was greatest within the stimulated third order arteriole. (G–I) The stimulus was in a capillary bed, near a first order venule. Blood velocity was measured in the stimulated venule (1), a 200 μm diameter region surrounding the stimulus (2), and a distant arteriole (3). Increased blood velocity was small in the stimulated region and nearby venule but much larger in the arteriole. (J–L) The retina was stimulated uniformly by a diffuse light. Blood velocity was measured in an arteriole (1), across the entire imaged region of the retina (2), and a venule (3). Increased blood velocity was greatest in the primary arterioles and in regions supplied by arteriole branches.
Light-Evoked Changes in Blood Flow
Increases in blood flow evoked by retinal stimulation have been characterized using a number of techniques (Riva et al., 2005). However, the spatial extent of these increases has not previously been determined. It is not known, for instance, whether a spatially restricted light stimulus will evoke a localized increase in blood flow or whether the increase will spread far beyond the illuminated region.
We have now characterized retinal blood flow responses to focal stimulation using a combination of LSF and confocal microscopy. We stimulated retinal photoreceptors with a 559 nm, 12 Hz flickering light generated by the confocal microscope. This stimulus illuminated a 135 × 20 μm region on the retinal surface (see Materials and Methods). Changes in blood velocity evoked by this stimulus were monitored with LSF using 808 nm illumination.
We found that the spatial pattern of blood velocity increase evoked by this focal stimulus varied depending on the location of the stimulus relative to retinal arterioles and venules. When the stimulus was near a primary arteriole, increased blood velocity was greatest in that arteriole and in the region immediately surrounding the vessel (Figure 5B). In many cases, other nearby primary arterioles also showed large velocity increases (Figures 4C and 5B). The time course and amplitude of the velocity increase was calculated for regions corresponding to the stimulated primary arteriole and nearby arterioles and venules. Light-evoked velocity increases in the arterioles and venules typically had similar time courses (Figure 5C), but the velocity increases in the arterioles were larger than were the increases in the venules (Figure 6). The peak velocity increase in the stimulated primary arteriole averaged 7.60 ± 0.83% (n = 10, seven animals) and had a latency of 1.49 ± 0.12 s (n = 9, six animals). The amplitude of the velocity increase in the adjacent primary venule was smaller, averaging 2.44 ± 0.48%, with a latency of 1.95 ± 0.22 s (n = 6, four animals).
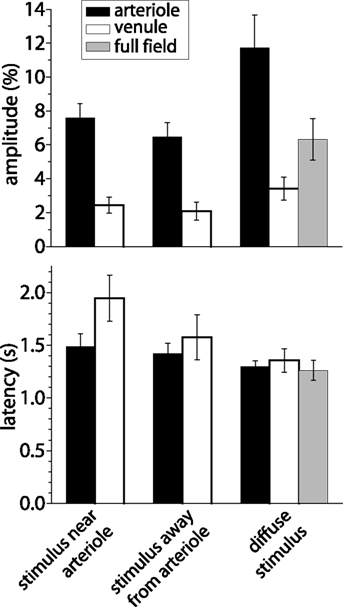
Figure 6. Amplitude and latency of blood velocity increases measured with LSF. Shown are mean response amplitude (peak change in blood velocity) and latency (time to 50% peak amplitude) for responses evoked under three different stimulus conditions: a focal stimulus near a primary arteriole, a focal stimulus far from 1°, 2°, or 3° arterioles, and a diffuse stimulus. Blood velocity was measured within primary arterioles (back bars), within primary venules (open bars), and, for diffuse stimulation, over the entire visible retina (gray bars). Error bars, SEM.
When the focal stimulus was near a second or third order arteriole, increased blood velocity was seen within the stimulated vessel and in upstream arterioles serving the vessel (Figure 5E). The time course of the velocity increase was similar in the stimulated vessel and in upstream vessels. However, the observed temporal similarity of these responses may be due to the fact that our sampling rate (4 Hz) was not fast enough to detect small changes in response latency. It should also be borne in mind that when an increase in blood velocity is observed within a vessel, that increase could be due to active dilation of that vessel or to dilation of upstream arterioles, causing an increase in the pressure head to the vessel.
Blood velocity increases were somewhat smaller when the focal stimulus was distant from first, second, and third order arterioles (Figures 5G and 6). In these cases, the largest velocity increases were seen in primary arterioles, even though they were some distance from the stimulus (Figures 5H,I, trace 3). Responses were smaller in venules and in regions near the stimulus (Figures 5H,I, traces 1 and 2). Peak blood velocity increases in the primary arteriole nearest to the stimulus averaged 6.47 ± 0.85% (n = 10, seven animals) and had a latency of 1.42 ± 0.10 s (n = 10, seven animals). Responses in the nearest primary venule averaged 2.07 ± 0.54% (n = 10, seven animals) and had a latency of 1.58 ± 0.21 s (n = 8, six animals). Responses averaged 2.08 ± 0.59% (n = 10, seven animals) and had a latency of 1.22 ± 0.21 s (n = 5, five animals) in a region 200 μm in diameter centered on the stimulus. We also measured the amplitude of blood velocity increase in an annular region 200–400 μm from the stimulus to determine whether the local response was restricted to the area of stimulation. The velocity increase in this annular region was 2.25 ± 0.60% (n = 10, seven animals), not significantly different from the response in the 200 μm diameter region centered on the stimulus.
Activation of a local region of the cerebral cortex sometimes evokes decreased blood flow in regions distant from the central region of increased blood flow (Harel et al., 2002; Devor et al., 2005). In our retinal experiments, we never observed a consistent decrease in blood velocity in response to focal light stimulation, regardless of the location of the stimulus. However, such a decrease could have occurred outside the field of view of our imaging system.
A diffuse flickering white light also evoked increased retinal blood velocity. As expected, blood velocity increases were more uniformly distributed across the retina (Figure 5K) than were increases evoked by focal stimulation. Velocity increases were larger in some retinal regions than others. These regions were generally associated with second and third order arterioles (Figure 5K). Velocity increases were greatest in primary arterioles (11.74 ± 1.91%; latency; 1.30 ± 0.05 s, n = 8, five animals; Figure 6) as well as in regions near primary and secondary arterioles. Increases were substantially smaller in primary venules (3.41 ± 0.68%, n = 8, five animals; latency; 1.36 ± 0.11 s, n = 6, four animals). Blood velocity increases averaged over the entire viewable retina equaled 6.31 ± 1.23% (n = 8, five animals; latency; 1.26 ± 0.09 s, n = 7, five animals) (Figure 5L, trace 2).
Discussion
We have described methods for combining LSF and laser scanning confocal microscopy to monitor blood flow in the retina. Using this combined imaging system, blood velocity changes were measured with LSF and arteriole diameter monitored with confocal line scans while retinal photoreceptors were stimulated by modulating the laser light from the secondary scanner of the confocal microscope. In contrast to other methods of measuring blood flow, LSF has the distinct advantage of permitting blood velocity to be monitored with high spatial and temporal resolution.
We illuminated the retina for LSF with 808 nm light delivered through an optical fiber pressed against the sclera. This method has several advantages. First, photoreceptors are largely insensitive to this infrared wavelength. Thus, retinal blood flow can be monitored without stimulating retinal neurons. Second, either the retinal vasculature or the choroidal circulation can be imaged with LSF, depending on the position of the illuminating optical fiber. Although LSF has previously been used to monitor choroidal blood flow in patients with polypoidal choroidal vasculopathy (Watanabe et al., 2008) and flow in the sub-foveal region of healthy subjects (Tamaki et al., 1997a), our work is, to our knowledge, the first to image blood flow in an extended network of choroidal vessels in the healthy eye. This technique may prove useful in future studies of the regulation of choroid blood flow under normal and pathological conditions.
Many previous studies have characterized retinal blood flow changes evoked by light stimulation (Riva et al., 2005). However, this is the first study to evaluate the spatial distribution of blood flow increases evoked by focal stimulation. We found that focal retinal stimulation evoked local increases in blood flow. This demonstrates that the retina has the ability to control blood flow at a local level. As in the brain, local control of blood flow in the retina allows needed oxygen and nutrients to be supplied to active neurons efficiently, without increasing the supply to inactive retinal regions.
Activity-dependent increases in blood flow in the brain were first described well over a century ago (Mosso, 1880; Roy and Sherrington, 1890). Yet, the identity of the vessels which mediate this functional hyperemia response remains in question. Earlier studies suggested that a large fraction of hemodynamic resistance in the brain lay within large cerebral arteries (Faraci and Heistad, 1990) or smaller, precapillary arterioles (Zweifach, 1974) and it was thought that dilation of these vessels was responsible for increased blood flow (Iadecola, 2004; Lipowsky, 2005). More recently, it has been suggested that capillaries may contribute to the regulation of blood flow in the brain. A theoretical study suggested that up to 70% of the total hemodynamic resistance in the brain vasculature lies in the capillary bed (Boas et al., 2008). In addition, pericytes, which control capillary diameter, have been shown to contract or relax in response to neurotransmitters and neuronal activity (Kawamura et al., 2003; Wu et al., 2003; Peppiatt et al., 2006).
The LSF results presented here bear on this issue and suggest that in the retina, activity-dependent blood flow changes are controlled largely by arterioles and that capillaries contribute little to the response. If capillary dilation contributed to functional hyperemia, focal stimulation of a region devoid of arterioles would result in increased blood flow to that region. However, we found the opposite to be true. When the retina was stimulated near a primary venule or in a region distant from arterioles, little increase in blood velocity was seen in the stimulated region. Rather, blood velocity increases were largest in the arterioles serving the stimulated region. In addition, blood velocity increases in the stimulated region of the retina were no larger than in an annulus surrounding this region. These results suggest that capillaries do not actively dilate in response to local neuronal activity and that more distant arterioles mediate the functional hyperemia response. The results must be interpreted with caution, however, as our LSF technique may not be sensitive enough to detect small changes in blood velocity in the capillary bed.
Previous studies have demonstrated that local arteriole dilations can be propagated upstream, leading to the dilation of larger arterioles and arteries feeding the stimulated vessels (Iadecola et al., 1997; Erinjeri and Woolsey, 2002). Our LSF results are consistent with this view. When a focal retinal stimulus was near a second or third order arteriole, increased retinal blood velocity was observed, not only near the stimulated arteriole, but also near the primary, upstream arteriole (Figure 5E).
We found that light-evoked velocity increases in primary venules were smaller than those observed in primary arterioles. This result appears at first to be paradoxical, as all blood flowing into the retina through primary arterioles must exit the retina through the venules. We attribute this discrepancy to the fact that primary venules in the retina are significantly larger in diameter than primary arterioles. Thus, for the same increase in total blood flux, velocity would increase to a smaller extent in venules than in arterioles. The differences in observed velocity increases are also attributable to the different time courses of the responses in arterioles and venules. Blood velocity amplitudes were measured during the initial, transient phase of the response (2–5 s after stimulus onset) while, in some cases, responses in venules were larger during the sustained portion of the response (Figure 5I, trace 1).
We believe that the combined use of LSF and confocal microscopy holds great promise for studying the regulation of blood flow, both in the normal retina and in the retina under pathological conditions. A few examples illustrate the potential of this preparation.
• Preliminary experiments from our laboratory demonstrate that retinal glial cells can be labeled with Ca2+ indicator dyes and filled with caged-Ca2+ compounds introduced into the vitreous humor through a hypodermic needle inserted through the sclera. Photolysis of caged-Ca2+ by short wavelength pulses delivered by a confocal microscope generate Ca2+ increases in the labeled glial cells. The role of glial cells in regulating retinal blood flow can be evaluated using this technique (Metea and Newman, 2006; Takano et al., 2006).
• Preliminary studies show that ischemia can be produced in a restricted region of the retina by photothrombosis generated by confocal illumination and bleaching of a photo-labile dye, such as rose bengal (Ding et al., 2009). The effect of the thrombolytic lesion on blood flow in the penumbra can then be studied with LSF.
• Preliminary experiments demonstrate that blood vessels and blood flow in the mouse retina can be imaged with the same LSF/confocal microscopy techniques we describe here for the rat. The potential of this preparation for characterizing mechanisms mediating functional hyperemia in health and disease will be expanded tremendously with the use of transgenic mouse lines.
Conflict of Interest Statement
The authors declare that the research was conducted in the absence of any commercial or financial relationships that could be construed as a potential conflict of interest.
Acknowledgments
We thank Anusha Mishra and Tess Kornfield for comments on the manuscript and Michael Burian for technical assistance. Supported by Fondation Leducq, NIH EY004077, and NIH TRINOD Training Grant.
References
Ayata, C., Dunn, A. K., Gursoy-Ozdemir, Y., Huang, Z., Boas, D. A., and Moskowitz, M. A. (2004). Laser speckle flowmetry for the study of cerebrovascular physiology in normal and ischemic mouse cortex. J. Cereb. Blood Flow Metab. 24, 744–755.
Bhutto, I. A., and Amemiya, T. (2001). Microvascular architecture of the rat choroid: corrosion cast study. Anat. Rec. 264, 63–71.
Boas, D. A., Jones, S. R., Devor, A., Huppert, T. J., and Dale, A. M. (2008). A vascular anatomical network model of the spatio-temporal response to brain activation. Neuroimage 40, 1116–1129.
Bolay, H., Reuter, U., Dunn, A. K., Huang, Z., Boas, D. A., and Moskowitz, M. A. (2002). Intrinsic brain activity triggers trigeminal meningeal afferents in a migraine model. Nat. Med. 8, 136–142.
Briers, J. D., and Fercher, A. F. (1982). Retinal blood-flow visualization by means of laser speckle photography. Invest. Ophthalmol. Vis. Sci. 22, 255–259.
Cheng, H., and Duong, T. Q. (2007). Simplified laser-speckle-imaging analysis method and its application to retinal blood flow imaging. Opt. Lett. 32, 2188–2190.
Cheng, H., Yan, Y., and Duong, T. Q. (2008). Temporal statistical analysis of laser speckle images and its application to retinal blood-flow imaging. Opt. Express 16, 10214–10219.
Devor, A., Ulbert, I., Dunn, A. K., Narayanan, S. N., Jones, S. R., Andermann, M. L., Boas, D. A., and Dale, A. M. (2005). Coupling of the cortical hemodynamic response to cortical and thalamic neuronal activity. Proc. Natl. Acad. Sci. U.S.A. 102, 3822–3827.
Ding, S., Wang, T., Cui, W., and Haydon, P. G. (2009). Photothrombosis ischemia stimulates a sustained astrocytic Ca2+ signaling in vivo. Glia 57, 767–776.
Dunn, A. K., Bolay, H., Moskowitz, M. A., and Boas, D. A. (2001). Dynamic imaging of cerebral blood flow using laser speckle. J. Cereb. Blood Flow Metab. 21, 195–201.
Duong, T. Q., Ngan, S. C., Ugurbil, K., and Kim, S. G. (2002). Functional magnetic resonance imaging of the retina. Invest. Ophthalmol. Vis. Sci. 43, 1176–1181.
Durduran, T., Burnett, M. G., Yu, G., Zhou, C., Furuya, D., Yodh, A. G., Detre, J. A., and Greenberg, J. H. (2004). Spatiotemporal quantification of cerebral blood flow during functional activation in rat somatosensory cortex using laser-speckle flowmetry. J. Cereb. Blood Flow Metab. 24, 518–525.
Erinjeri, J. P., and Woolsey, T. A. (2002). Spatial integration of vascular changes with neural activity in mouse cortex. J. Cereb. Blood Flow Metab. 22, 353–360.
Faraci, F. M., and Heistad, D. D. (1990). Regulation of large cerebral arteries and cerebral microvascular pressure. Circ. Res. 66, 8–17.
Fercher, A. F., and Briers, J. D. (1981). Flow visualization by means of single-exposure speckle photography. Opt. Commun. 37, 326–330.
Harel, N., Lee, S. P., Nagaoka, T., Kim, D. S., and Kim, S. G. (2002). Origin of negative blood oxygenation level-dependent fMRI signals. J. Cereb. Blood Flow Metab. 22, 908–917.
Iadecola, C. (2004). Neurovascular regulation in the normal brain and in Alzheimer’s disease. Nat. Rev. Neurosci. 5, 347–360.
Iadecola, C., and Nedergaard, M. (2007). Glial regulation of the cerebral microvasculature. Nat. Neurosci. 10, 1369–1376.
Iadecola, C., Yang, G., Ebner, T. J., and Chen, G. (1997). Local and propagated vascular responses evoked by focal synaptic activity in cerebellar cortex. J. Neurophysiol. 78, 651–659.
Ishii, K., and Araie, M. (2000). Effect of topical Latanoprost-timolol combined therapy on retinal blood flow and circulation of optic nerve head tissue in cynomolgus monkeys. Jpn. J. Ophthalmol. 44, 227–234.
Jacobs, G. H., Fenwick, J. A., and Williams, G. A. (2001). Cone-based vision of rats for ultraviolet and visible lights. J. Exp. Biol. 204, 2439–2446.
Kawamura, H., Sugiyama, T., Wu, D. M., Kobayashi, M., Yamanishi, S., Katsumura, K., and Puro, D. G. (2003). ATP: a vasoactive signal in the pericyte-containing microvasculature of the rat retina. J. Physiol. (Lond.) 551.3, 787–799.
Koseki, N., Araie, M., Tomidokoro, A., Nagahara, M., Hasegawa, T., Tamaki, Y., and Yamamoto, S. (2008). A placebo-controlled 3-year study of a calcium blocker on visual field and ocular circulation in glaucoma with low-normal pressure. Ophthalmology 115, 2049–2057.
Metea, M. R., and Newman, E. A. (2006). Glial cells dilate and constrict blood vessels: a mechanism of neurovascular coupling. J. Neurosci. 26, 2862–2870.
Mosso, A. (1880). Sulla circolazione del sangue nel cervello dell’uomo. Mem. Real Acc. Lincei 5, 237–358.
Peppiatt, C. M., Howarth, C., Mobbs, P., and Attwell, D. (2006). Bidirectional control of CNS capillary diameter by pericytes. Nature 443, 700–704.
Riva, C. E., Logean, E., and Falsini, B. (2005). Visually evoked hemodynamical response and assessment of neurovascular coupling in the optic nerve and retina. Prog. Retin. Eye Res. 24, 183–215.
Roy, C. S., and Sherrington, C. S. (1890). On the regulation of the blood-supply of the brain. J. Physiol. (Lond.) 11, 85–108.
Takano, T., Tian, G. F., Peng, W., Lou, N., Libionka, W., Han, X., and Nedergaard, M. (2006). Astrocyte-mediated control of cerebral blood flow. Nat. Neurosci. 9, 260–267.
Tamaki, Y., Araie, M., Kawamoto, E., Eguchi, S., and Fujii, H. (1994). Noncontact, two-dimensional measurement of retinal microcirculation using laser speckle phenomenon. Invest. Ophthalmol. Vis. Sci. 35, 3825–3834.
Tamaki, Y., Araie, M., Tomita, K., Nagahara, M., Tomidokoro, A., and Fujii, H. (1997a). Real-time measurement of human optic nerve head and choroid circulation, using the laser speckle phenomenon. Jpn. J. Ophthalmol. 41, 49–54.
Tamaki, Y., Araie, M., Tomita, K., and Tomidokoro, A. (1997b). Effect of topical timolol on tissue circulation in optic nerve head. Jpn. J. Ophthalmol. 41, 297–304.
Watanabe, G., Fujii, H., and Kishi, S. (2008). Imaging of choroidal hemodynamics in eyes with polypoidal choroidal vasculopathy using laser speckle phenomenon. Jpn. J. Ophthalmol. 52, 175–181.
Wu, D. M., Kawamura, H., Sakagami, K., Kobayashi, M., and Puro, D. G. (2003). Cholinergic regulation of pericyte-containing retinal microvessels. Am. J. Physiol. Heart Circ. Physiol. 284, H2083–H2090.
Yuan, S., Devor, A., Boas, D. A., and Dunn, A. K. (2005). Determination of optimal exposure time for imaging of blood flow changes with laser speckle contrast imaging. Appl. Opt. 44, 1823–1830.
Keywords: retina, choroid, blood flow, arterioles, capillaries, functional hyperemia, laser speckle flowmetry
Citation: Srienc AI, Kurth-Nelson ZL and Newman EA (2010) Imaging retinal blood flow with laser speckle flowmetry. Front. Neuroenerg. 2:128. doi: 10.3389/fnene.2010.00128
Received: 03 March 2010;
Paper pending published: 01 April 2010;
Accepted: 06 August 2010;
Published online: 15 September 2010.
Edited by:
Anna Devor, University of California San Diego, USAReviewed by:
Gabriel A. Silva, University of California San Diego, USAChris Shaffer, Cornell University, USA
Copyright: © 2010 Srienc, Kurth-Nelson and Newman. This is an open-access article subject to an exclusive license agreement between the authors and the Frontiers Research Foundation, which permits unrestricted use, distribution, and reproduction in any medium, provided the original authors and source are credited.
*Correspondence: Eric A. Newman, Department of Neuroscience, University of Minnesota, 321 Church St. SE, Minneapolis, MN 55455, USA. e-mail: ean@umn.edu