Modified pulse shapes for effective neural stimulation
- 1 Forschungszentrum Jülich GmbH, Institute of Neuroscience and Medicine – Neuromodulation (INM-7), Forschungszentrum Jülich, Jülich, Germany
- 2 Department of Stereotactic and Functional Neurosurgery, University of Cologne, Cologne, Germany
The electrical stimulation of neuronal structures is used as a treatment for many neurological disorders, e.g., for the treatment of Parkinson’s disease via deep brain stimulation (DBS). To reduce side effects, to avoid tissue or electrode damage, and to increase battery lifetimes, an effective but gentle electrical stimulation is of prime importance. We studied different modified pulse shapes for application in DBS with respect to their efficiency to initiate neuronal activity. Numerical simulations of two mathematical neuron models were performed to investigate the effectiveness of different modified pulse shapes. According to our results, the pulse shapes considered showed a considerably increased efficiency in terms of both activation and entrainment of neural activity. We found that the introduction of a gap with a specific and optimized duration in a biphasic pulse and the reversal of the standard pulse phase order yielded stimulation protocols that could increase the efficiency and therefore reduce the energy consumption of stimulation. The improvements were achieved by simple modifications of existing stimulation techniques. The modification of the pulse shapes resulted in an improvement of up to 50% for both the activation of resting neurons and the entrainment of bursting neurons.
1 Introduction
Deep brain stimulation (DBS) via electrodes in selected brain regions has become a standard therapy for medically refractory movement disorders such as Parkinson’s disease (PD), dystonia, and essential tremor (Benabid et al., 1991; Coffey, 2009). PD is a degenerative disorder of the central nervous system. Necrosis of dopaminergic neurons within the substantia nigra leads to dopamine depletion and thus induces characteristic symptoms such as rigidity, bradykinesia, postural instability, and resting tremor (Fahn, 2008). Parkinsonian resting tremor is caused by an abnormal synchronization of neural populations located in the thalamus and the basal ganglia (Nini et al., 1995; Trottenberg et al., 2007; Tass et al., 2010). Under healthy conditions these populations fire in an uncorrelated manner (Nini et al., 1995). DBS offers a means to break the synchronization by changing the activity of neural elements and therefore of the network itself (Garcia et al., 2003). Although it is clinically effective and already has a long history, the mechanisms of action of DBS at the cell level are still not fully clear (Benabid et al., 2002; Naskar et al., 2010). A recent review of current data regarding the local and network activity changes induced by DBS revealed that electrical stimulation can influence a wide variety of mechanisms at neuronal and system level (Deniau et al., 2010). To date, no single mechanism accounts for the beneficial effects of DBS. In particular, the effects of DBS on information processing need more detailed investigation (Deniau et al., 2010; Hauptmann and Tass, 2010). In order to avoid side effects (Deuschl et al., 2006), tissue or electrode damage caused by biochemical effects (Cogan, 2008), and to increase battery lifetimes, a gentle but effective stimulation is of prime importance. To this day, all implanted stimulators generate a constant high-frequency pulse train of charge-balanced single pulses (Coffey, 2009). Therapeutic benefits of DBS have only been observed for frequencies above 100 Hz (Volkmann et al., 2006). A tradeoff between therapeutic effectiveness and energy consumption leads to a stimulation frequency of 130 Hz and an amplitude in the region of 3.0 V most commonly used for DBS (Moro et al., 2002). In order to develop milder and more efficient stimulation, energy-efficient waveform shapes were designed by means of a genetic algorithm (Wongsarnpigoon and Grill, 2010). Shifted cathodic pulse shapes were identified as most efficient when the anodic charge-balancing pulse part was placed in front of the cathodic pulse part (Wongsarnpigoon and Grill, 2010). We aim to improve the effectiveness of stimulation by using a simpler approach, in terms of a potential hardware realization, introducing a prolonged gap between the two pulse parts of a charge-balanced electrical stimulation pulse. In computer-based simulations on mathematical neuron models (Hodgkin and Huxley, 1952; Morris and Lecar, 1981), we investigated the ability of different pulse shapes to activate or entrain neural activity. An increase in the effectiveness of stimulation thereby implied that lower amplitude values achieve the same activation or entrainment of neural activity as the standard pulse shape. Our pulse shapes showed improvements of up to 50% both for the activation of resting neurons and for the entrainment of bursting neurons.
2 Materials and Methods
The standard pulse shape used today in DBS consists of a first, cathodal, activating pulse part and a second, anodal, charge-balanced pulse part (Lilly et al., 1955). The second part immediately follows the first part but has a longer duration and smaller amplitude (see Coffey, 2009; Hauptmann et al., 2009). A typical stimulation waveform is shown in Figure 1. The ratio of pulse part amplitudes also defines the ratio of pulse part widths, which thus guarantees charge balancing. The standard amplitude ratio throughout this work is 15:1, and the standard pulse width of the cathodal, activating pulse is 200 μs, which defines the anodal pulse width as 3.0 ms. The pulse width parameters of the test pulse used in this study are within the parameter range used in clinical studies for DBS (Rodriguez-Oroz et al., 2005). The numerical realization of the charge-balanced pulse part is idealized compared to the shape of the balancing pulse part of existing implantable pulse generators (IPG), where both active and passive charge balancing is used. A detailed analysis of the stimulation waveforms realized by existing IPGs has been performed in Butson and McIntyre (2007). Test simulations in our study with different shapes showed similar outcomes with respect to the effect of the gap (data not shown). However, it should be noted that we did not consider waveform shapes designed by genetic algorithms as studied in Wongsarnpigoon and Grill (2010). We see great potential to further optimize the effectiveness of the electrical stimulation by combining the genetic algorithm waveform shapes with an additional gap between the two pulse parts. Further study is planned on this issue.
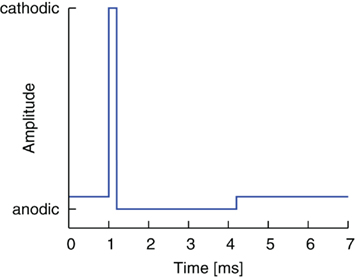
Figure 1. Standard charge-balanced pulse shape. A short cathodic pulse part with high amplitude is directly followed by a longer anodal pulse part of smaller amplitude.
A biphasic, charge-balanced pulse prevents net charge injection into the stimulated tissue. Charge balancing is therefore a necessary requirement to avoid tissue damage (Harnack et al., 2004). On the other hand, the anodic phase of a biphasic pulse counteracts the desired stimulation effect of the cathodic phase. This explains why the anodic pulse has a reduced amplitude and longer pulse duration. However, the amplitude of the anodic pulse must be high enough to allow the charge be recovered from the electrode within an adequate period of time. In particular, the maximal length of the charge-balanced pulse should be chosen so that the whole stimulation pulse fits within the interval between two successive stimulation pulses. For standard DBS parameters, the stimulation period is between 5.4 and 11.1 ms (Rodriguez-Oroz et al., 2005).
The first modification of the pulse shape results from the introduction of a delay or rather a gap between the two pulse parts. A gap of 0.0 ms hence constitutes the standard waveform. By inserting an open circuit interphase delay between the stimulating and reversal pulse parts, we might be able to improve the effectiveness of stimulation. The basic shape of this waveform is shown in Figure 2.
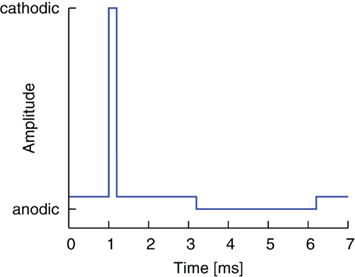
Figure 2. Standard pulse order with a gap between the two pulse parts (cathodic-gap-anodic, CGA).
The second modification of the pulse shape was obtained by reversing the order of cathodic and anodic pulse parts, combined with the introduction of a gap as before, cf. Figure 3. The stimulation thus began with an anodic pulse, which changed the state of the membrane by the time the cathodic, activating pulse part followed. The altered preconditions for the cathodic pulse, which depend on the gap duration, could prove advantageous for an effective stimulation.
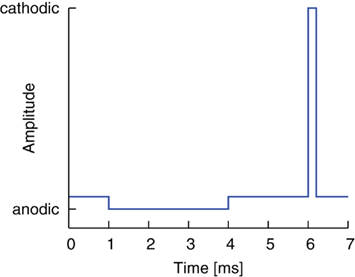
Figure 3. Reversed pulse order with a gap between the two pulse parts (anodic-gap-cathodic, AGC).
The basic, qualitative effect, namely that the activation threshold is influenced by the introduction of a gap in biphasic, charge-balanced pulses, has already been described in Gorman and Mortimer (1983) and Mortimer (1990). In the latter study, both standard and reversed pulse order were investigated. However, the effect was not studied systematically and did not consider a wider range of pulse parameters. For example, in Gorman and Mortimer (1983) only delays of up to 80 μs were considered. The two pulse shapes will mainly be tested here with varying gap lengths. However, to find the optimal configuration, we also have to take into consideration some safety aspects. Electro-chemical processes occur at the interface between electrode and electrolyte (liquor). In Faradaic reactions, namely the reduction or oxidation of chemical species, charge is transferred to the electrolyte (Merrill et al., 2005). The reactions are reversible if the reactants can be recovered upon reversal of the pulse phase. If the reactants diffuse away from the electrode, the reactions become irreversible. The rate of Faradaic reactions depends on the overpotential, which indicates the deviation from the equilibrium potential (Merrill et al., 2005). To a certain extent, overpotentials cannot be avoided in order to carry out an effective stimulation. Normally the electrode is quickly driven back to lower potential ranges by the balancing pulse part. However, during the gap phase, the overpotential persists and only diminishes as a result of Faradaic reactions. As the gap also extends the time span where diffusion processes can take place, it should be as short as possible. Please note, since the charge balancing is finished within the stimulation interval in all cases (between 5.4 and 11.1 ms; Rodriguez-Oroz et al., 2005), the maximally deposited charge equals the charge delivered by one single pulse part, which is relatively small, given the standard pulse parameters. For example, in Scheiner et al. (1990) and Merrill et al. (2005) slightly charge-imbalanced pulse shapes are also considered to be safe with respect to the potential risk for tissue damage. Scheiner et al. (1990) performed an acute in vivo stimulation in cat muscle tissue. They found that greater cathodic charge densities are safer when employed with imbalanced biphasic stimulation than with either monophasic or charge-balanced biphasic stimulation (Scheiner et al., 1990). A forthcoming in vitro investigation of the stimulation effects of the modified pulse shapes on neural tissue will further tackle this issue.
Two models are used in this work: the phenomenological Hodgkin–Huxley model and the reduced, qualitative Morris–Lecar model (these models will be described in detail in the corresponding Sections 2.1 and 2.3). We have chosen these two models because firstly the Hodgkin–Huxley model is widely accepted as a very basic model for axonal processes like action potential initiation, and secondly a model was needed for the entrainment study to show rhythmic low-frequency activity, and this can be easily obtained using the Morris–Lecar model. (The Hodgkin–Huxley model switches from the rest state to a tonic state of high-frequency spiking when the external current is increased.) The computation of the time courses of all time-dependent variables requires numerical methods. A Runge–Kutta algorithm of fourth order with step-size control was used. The integration routine is a freely available Fortran code for a system of first-order delay differential equations, written by Hairer et al. (1993).
2.1 The Hodgkin–Huxley Model
Axonal activation is the most prominent mechanism of neural stimulation during DBS (Benabid et al., 2002; Naskar et al., 2010), thus aspects of soma or dendrite activation can be neglected in this study. The well-established Hodgkin–Huxley model has been developed to model the spike generation and conduction in the giant squid axon (Hodgkin and Huxley, 1952). Important aspects of neural excitability taking place on diverse time scales, such as activation and inactivation of voltage-dependent currents, are implicated by the model (Meunier and Segev, 2002). It reproduces action potential (AP) generation via ion channel dynamics along with threshold behavior. Model parameters can be assessed directly in experiments, because of an adequate biophysical level of abstraction (Meunier and Segev, 2002). A formulation for the four time-dependent variables is given by:

The gating variables m, h, and n are given by the following set of equations (x = m, h, n)
The voltage dependency of αx and βx is approximated by Meunier (1992):
The values for the conductances and reversal potentials were: gK = 36 mS/cm2, gNa = 120 mS/cm2, gL = 0.3 mS/cm2, EK = −77 mV, ENa = 120 mV, EL = −54.402 mV, C = 1 μF/cm2. Parameters and equations for steady states and for time constants were taken from Meunier (1992). The system had a stable rest state, which is the starting point for responses to various stimuli Ist. A small constant input current Ici slightly shifted the resting values of all variables. It was set to 1.0 μA/cm2 with no loss of generality.
2.2 Methods for Calculation of Threshold Values
During simulations concerning the activation of silent neurons, we had to check whether a specific pulse (e.g., with a specific gap length) was successful in generating an AP. As the AP is an all-or-non-event, it is sufficient to raise the amplitude in small steps and to check in every cycle of the simulation if at any time t after the beginning of the pulse the membrane potential V exceeds a certain limit value. The limit value for the Hodgkin–Huxley simulations was set to V = 0 mV (resting value at V ≈ −65 mV, peak value at V ≈ 30 mV). A simple routine monitored V and thereby detected each generated AP. One simulation cycle covered 1000 ms of membrane activity, with the pulses being applied at t = 500 ms. After an AP was detected, the threshold amplitude for the current pulse was saved.
2.3 The Morris–Lecar Model
A simple version of the Morris–Lecar model in dimensionless form was chosen to investigate spontaneously active neurons (Morris and Lecar, 1981). Reductions to a two-variable system can be obtained when time scale differences allow certain approximations (Fitzhugh, 1961; Nagumo et al., 1962). The basic equations read:
with m∞(V) = 0.5(1 + tanh[(V −V1)/V2]), w∞(V) = 0.5·(1 + tanh[(V −V3)/V4]), τw(V) = 1/cosh[(V −V3)/(2·V4)]. The dynamics of this system produce an oscillatory bursting pattern of the membrane potential V, which is in accordance with experimental observations (Beurrier et al., 1999). Slow modulations between a regime of fast spiking and a silent regime are provided by the Ifb term (Rinzel and Ermentrout, 1989), a slow negative feedback current of the form

where ∈, V*, and τfb are parameters. Ici is a constant input current which allows the system to be brought into the state of bursting oscillations and the frequency of the burst oscillations to be controlled. A value of Ici = 0.075 yielded oscillatory bursting with a period T ≈ 180 ms. The associated frequency corresponds to typical frequencies of synchronized activity found in neural populations in PD (Nini et al., 1995; Zirh et al., 1998). An exemplary time course of the simulated membrane potential V is shown in Figure 4. Weak noise by external and internal sources is reflected in the term In. It models an exponentially correlated noise with amplitude Dn and correlation time τn (Dolan et al., 1999). Stimulation pulses were added to the system as Ist. The parameter values used for the simulations were: C = 1.0, gca = 1.0, gK = 2.0, gL = 0.5, Eca = 1.0, EK = −0.7, EL = −0.5, Φ = 1.15, V1 = −0.01, V2 = 0.15, V3 = 0.1, V4 = 0.145, ∈ = 0.002, V* = −0.22, and τfb = 10 ms.
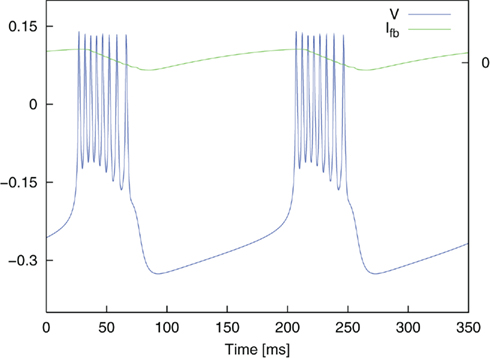
Figure 4. Oscillatory bursting of the dimensionless Morris–Lecar system for a constant input current Ici = 0.075. Simulation without noise (In = 0). Ifb illustrates the course of the feedback current.
2.4 Methods for Calculating the Entrainment Index E
During simulations concerning the entrainment of bursting neurons, we wanted to ascertain whether the neurons’ frequency of oscillatory bursting starts to adapt or to lock to a given stimulation frequency. This situation is especially important for new methods of stimulation, which aim to control the synchronized activity of subpopulations of neurons within a target area. For instance, a delayed entrainment of activity in different subpopulations is performed in coordinated reset stimulation (Tass, 2003a,b). Mathematically speaking, phase entrainment stands for phase synchronization between a periodic force and a driven system in the presence of noise (Stratonovich, 1963). The extent of phase entrainment can be quantified by means of an entrainment index E. The entrainment index detects how strongly the phase of the entrained signal adapts to the phase of the periodic force. This approach is based on the concept of phase synchronization between two oscillators in the presence of random forces, which is defined as the appearance of one or more prominent peaks in the distribution of cyclic phase differences (i.e., the phase difference modulo 2π; Tass et al., 1998). The definition of phase synchronization between two oscillators can also be applied directly to quantify the extent of entrainment between a periodic driving force (here the stimulation) and a (possibly noisy and/or chaotic) oscillator (e.g., the Morris–Lecar system). Accordingly, phase entrainment is then characterized by the appearance of one or more prominent peaks in the distribution of the cyclic phase differences

A particularly suitable first Fourier mode-based phase entrainment index E was introduced:
where M is the number of data points in the time window considered for analysis and tj are the time points at which the signals are sampled (Batschelet, 1981). 0 ≤ E ≤ 1, where complete absence of entrainment corresponds to E = 0, whereas perfect phase-locking is characterized by E = 1. Instead of 1:1 entrainment, n:m entrainment is also possible (n, m integers). However, in our case only the most simple form appeared. The phases Φstim(t) and Φosci(t) in Eq. 14 for phase difference calculation are attributed by an event-based standard interpolation (Pinsky and Rinzel, 1995):
where t ∈ [tk,tk + 1], and tk is the onset of the kth event. In the following, events are defined by the onset of a stimulus or of bursting.
The onset times of stimulation pulses were obvious. Burst detection for the Morris–Lecar model was implemented via a flag and two threshold scans. The flag switched its value when the membrane potential exceeded the null limit and switched back when the potential fell back below a value of −0.25. The lower threshold was chosen in such a way that it could only be reached during the transient period, not during spiking. The two event lists and Eq. 16 were used to determine the interpolated phases Φpulse (i.e., corresponds to Φstim in Eq. 14) and Φburst (i.e., corresponds to Φosci in Eq. 14) at equidistant time points (in 1 ms intervals) within a certain time window. The time window considered began 8 s after the start of stimulation (the stimulation started itself after 2 s of undisturbed system evolution) and ended 0.5 s before the end of stimulation at 10 s, which was also the end of one simulation cycle. The cyclic phase difference ΔΦ = Φpulse − Φburst was calculated for each reading point within this window and subsequently Eq. 15 yielded the entrainment index E.
3 Results
3.1 Activation of Resting Neurons
We investigated the ability of different pulse shapes to excite an AP. The smaller the threshold amplitude for successful AP generation, the more effective the stimulation was. A gap of 0–20 ms duration was introduced between the two pulse parts of a biphasic pulse. The gap duration was increased in steps of 0.1 ms. For each step, the stimulation amplitude was increased in steps of 0.1 μA/cm2 until the threshold value was reached (AP detection according to Section 2.2).
We first started with the standard pulse order (CGA). The result is plotted as threshold amplitude vs. gap length in Figure 5. The threshold value decreased for increasing gap duration until it reached a limit value. This limit corresponded to the threshold value of a monophasic cathodic pulse. The reason for the decrease was the weakening influence of a suppressing effect of the second, anodic pulse part. A cathodic pulse depolarizes the membrane to a certain extent. However, a promptly following anodic pulse will partly reverse the charging of the capacitance, thereby decelerating the depolarizing (activating) effect of the first pulse. The introduction of a gap shifts the restraining effect of the anodic pulse to a phase where the system is less sensitive to the anodic influence, because the self-reinforcing depolarization has already advanced considerably by this time. This factor is reflected in amplitude thresholds. The threshold improved from 43.2 μA/cm2 for a CGA pulse without a gap to 30.1 μA/cm2 for a pulse with 3.5 ms gap length. For a gap length of 1.8 ms an improvement of more than 90% of the maximum possible improvement was already obtained.
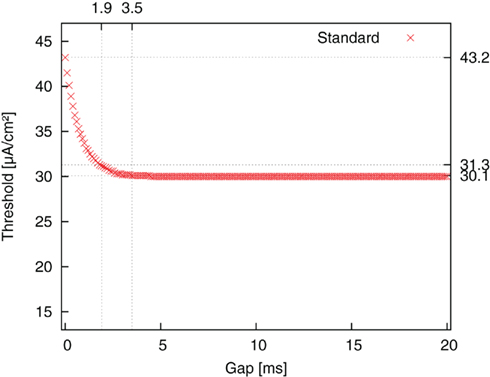
Figure 5. Threshold amplitude for AP generation vs. gap length for stimulation with standard pulse order (CGA).
The same simulations were repeated for the reversed pulse order (AGC) and the results are plotted in Figure 6. Threshold values decreased for increasing gap duration until a minimum was reached. They then increased again up to a local maximum and approached a limit value thereafter. The limit value was again the threshold value of a monophasic cathodic pulse. The approximation to this value followed the course of a damped oscillation. The amplitude threshold for AP generation with an AGC pulse without a gap was 37.9 μA/cm2. The threshold minimum of 20.8 μA/cm2 was found around a gap length of 3.6 ms. Once again, at a gap length of 1.9 ms, an improvement of more than 90% of the maximum possible improvement was already obtained.
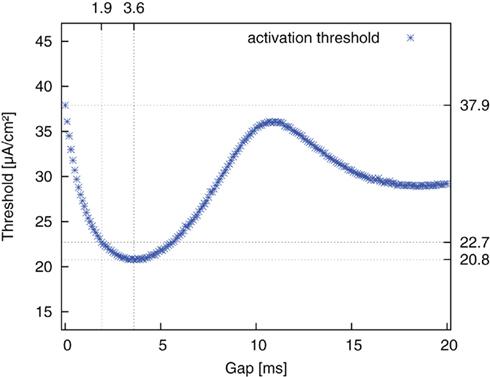
Figure 6. Threshold amplitude for AP generation vs. gap length for stimulation with reversed pulse order (AGC).
The reason for this more complex behavior lies in the dynamics of the three gating (or in-/activation) variables. The gating variables represent the fraction of channels in an open, closed, or inactive state. They are voltage dependent and respond to changes in membrane potential with different time constants. The membrane is hyperpolarized during the anodic pulse part, and the gating variables start to attain their new equilibrium values. During the subsequent gap phase the fast sodium activation m quickly drops back toward its resting value and even overshoots this value. In contrast, the progression of potassium activation n and sodium inactivation h in the previous direction persists at first. This is due to their slower time constants. After a certain time, they move back toward their resting values, too. The complete dynamics of the gating variables during and after an anodic pulse are plotted in Figure 7 (relative deviations from resting values). The threshold curve of Figure 6 is superimposed. The actual states of the gating variables determine the threshold for the second, activating pulse part. We found the threshold minimum in the center of three extrema of the gating variables, which are all favorable for AP excitation: more sodium channels ready for activation, more sodium channels activated and less potassium channels activated than in the resting case. The same considerations hold for an explanation of the local threshold maximum, which lies in the center of three unfavorable local extrema of m, n, h.
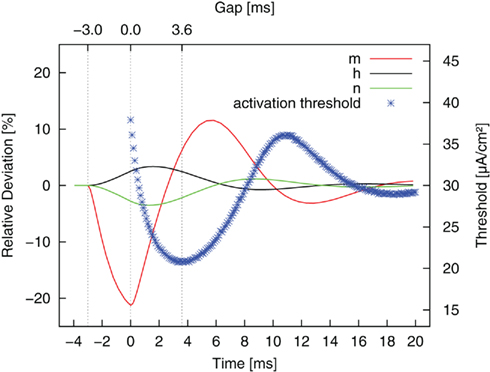
Figure 7. Relative deviation from resting values of the gating variables (m, h, n, cf. Eq. 2) after a monophasic 3 ms anodic pulse (−3 to 0 ms) of typical amplitude. The results for stimulation with reversed pulse order are superimposed. The gap length determines which state the system is in by the time the second, cathodic pulse is applied.
Both the standard and the reversed pulse shape benefited highly from the introduction of a gap between the pulse parts. Both waveforms gained efficiency regarding the excitation of resting neurons, but due to two different mechanisms. When compared to the standard pulse shape without a gap, an improvement in amplitude thresholds of more than a factor of two were achieved. We also tested other pulse shapes (anodic part symmetric to cathodic part; anodic part linearly increasing or decreasing) and different ratios of pulse part lengths (variations in one or both pulse part lengths), while always keeping the charge balanced. Gap durations at which threshold minima occurred differed slightly but the values of the threshold minima were found to be very similar (data not shown).
3.2 Entrainment of Bursting Neurons
We are interested in the capability of different pulse shapes to entrain the neuron activity during stimulation. As a measure of effectiveness of a pulse shape, we used the entrainment index E, which is described in Section 2.4. A gap of 0–4 ms duration was introduced between the two pulse parts of a biphasic pulse. Gap duration was increased in steps of 0.02 ms, and for each step the stimulation amplitude values were between 0 and 0.4, increased by 0.004 after each cycle. The amplitude range covered typical values for successful activation in the dimensionless model. A stimulation frequency of 5 Hz was used. For each pair of parameter values, E was calculated according to Eq. 15. No noise was added at the beginning (In = 0). We again started with the standard pulse order (CGA). The result is shown in Figure 8A, where colors depict the value of E as indicated by the color bar on the right. For low amplitudes (A ≲ 0.12) almost no entrainment occurred. For higher amplitudes (0.12 ≲ A ≲ 0.35), there was still no significant entrainment for pulses without a gap. On the contrary, the introduction of a gap resulted in a much more effective stimulation and very high E values were reached. In this amplitude range, we found a roughly stepwise increase in E from low values (E ≈ 0.2) to values near or at perfect phase entrainment (E ≈ 1.0). The length of the gap at which the step occurred decreased with higher amplitude values, but did not exceed 2 ms. When the amplitude became high enough (A ≳#x02009;0.35) successful entrainment occurred independently of the presence of a gap. The charge-balanced pulse part of our stimulation had a hyper-polarizing effect. If this hyper-polarization acts at the termination of a burst, it can accelerate the relaxation of the neuron to its resting potential. A fast relaxation to the resting potential can shorten the time until the next burst starts. Therefore, hitting the periodically active Morris–Lecar system with a hyper-polarizing pulse with a particular amplitude close to the end of a burst can result in an entrainment of the periodically active neuron as shown in Figure 9A. An additional simulation with a monophasic pulse showed no such behavior (data not shown), further evidencing that the hyper-polarizing pulse part is responsible for the complex structure of the color plot in Figure 8A. The red lines on the left in Figure 9A correspond to a successful entrainment, where the stimulation pulses occur at the end of each burst. The induced slight acceleration of the next pulse results in a locking of the burst pattern with respect to the stimulation pattern. Furthermore, the structure for gap values from 1.6 to 3.5 ms positioned below the large region of entrainment is the result of such a stimulation effect. In contrast, in the large parameter region reaching to the upper right corner in Figure 9B showing entrainment, the stimulation pulse is positioned in front of each burst, resulting in an immediate activation of the subsequent pulse.
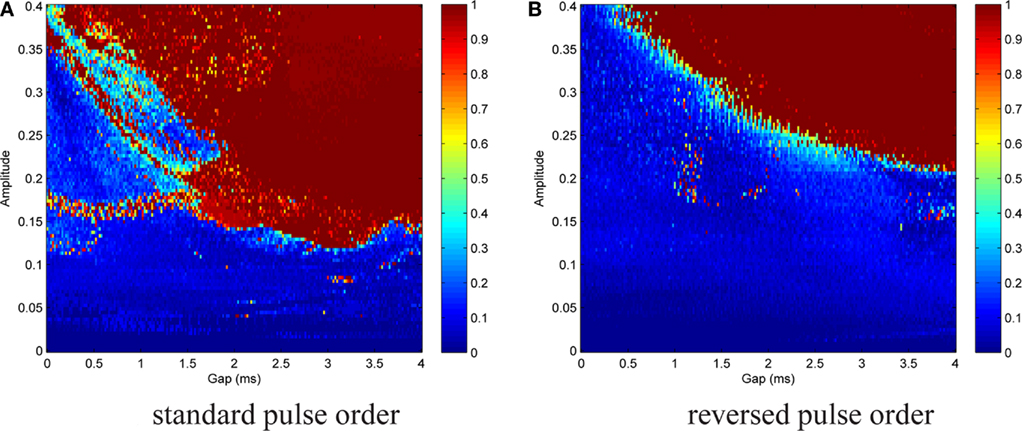
Figure 8. Contour plot of entrainment index E over gap length and stimulation amplitude. Stimulation without noise. (A) Introduction of a gap within the standard pulse order resulted in a much more effective stimulation and very high E values were reached. (B) For the reversed pulse order slightly higher amplitudes and/or longer gap durations were required.
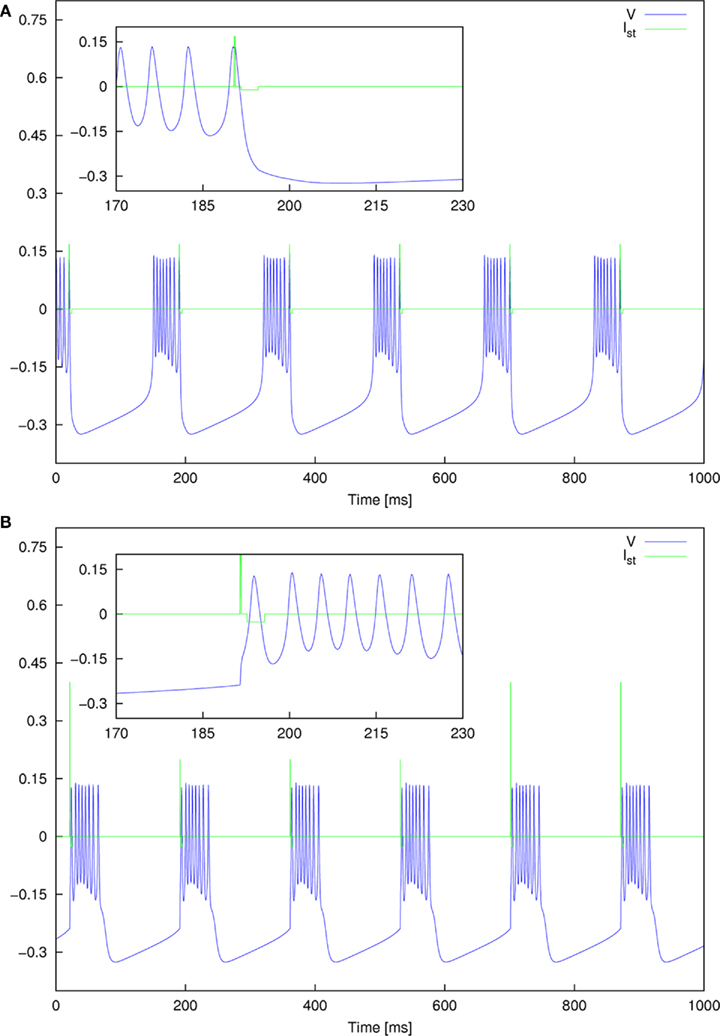
Figure 9. Detailed plot of the entrainment pattern observed for two parameter sets for standard pulse order. (A) A = 0.168 and Gap = 1 ms, and (B) A = 0.4 and Gap = 1 ms.
A similar but less complex outcome was brought about by the reversed pulse order (AGC), cf. Figure 8B. Parameter ranges and step sizes were the same as before. Poor entrainment was found for A ≲ 0.2. For higher amplitudes, there was again a stepwise increase to E values near or at perfect phase entrainment. The gap duration at which the transition occurred decreased with increasing amplitude. As compared to the standard pulse order, successful entrainment required slightly higher amplitudes and/or longer gap durations.
It is apparent from these results that the introduction of a gap between the pulse parts greatly increased the effectiveness of the stimulation (in terms of the strength of the entrainment of the neurons spontaneous oscillatory activity to the superimposed stimulation frequency), both for the standard and the reversed pulse shape. For the reversed pulse shape, with appropriate gap lengths, outstanding entrainment values (E ≈ 1) were already reached with less than half of the amplitude as compared to the standard case without a gap.
We then repeated both simulations, but with In ≠ 0, in order to test the stability of the effect in the presence of noise (noise parameters listed in caption of Figure 10). Figure 10A shows the results for the standard pulse order (CGA), Figure 10B for the reversed pulse order (AGC). The effect was less prominent in the latter case. There was no longer a sharp transition from low to very high E values, and perfect phase entrainment was difficult to achieve. Nevertheless, the introduction of a gap significantly increased effectiveness of the pulses. For CGA pulses with A = 0.3 for instance, entrainment increased from E ≈ 0.2 to E ≈ 0.4 at gap lengths around 1 ms. AGC pulses did not display successful entrainment for a large amplitude range. However, there was a smooth increase in E at high amplitude and large gap values. The more A was increased, the smaller the gap lengths were at which this augmentation started to occur. This is consistent with the results of the simulations without noise. In the simulations with noise, the complex structures observed for the standard pulse order in the simulation without noise caused by the fragile effects of the hyper-polarizing pulse parts placed close to the end of each burst, Figure 8A, were diminished as this fragile effect of the stimulation was more sensitive to noise than to the activating effect of the stimulation.
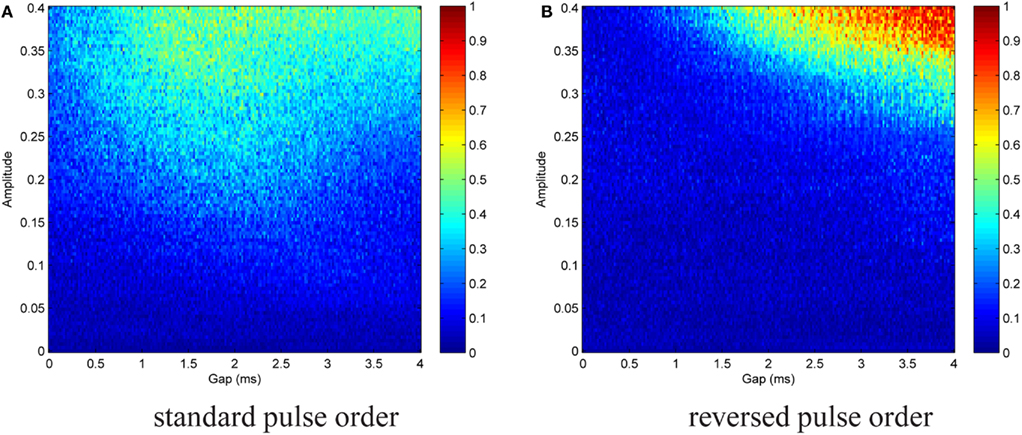
Figure 10. Contour plot of entrainment index E over gap length and stimulation amplitude for standard (A) and reversed (B) pulse order. Stimulation in the presence of noise. Noise parameters: Dn = 0.00001 and τn = 5 ms. The introduction of a gap significantly increased effectiveness of the pulses. Perfect phase entrainment was difficult to achieve and as compared to simulations without noise the sharp transition from low to very high E values disappeared.
4 Discussion
We investigated the ability of modified pulse shapes to excite and to entrain neural activity. The results presented in this work show considerable improvement in the effectiveness of the modified pulse shapes compared to the standard pulse shape. The improvements apply to physiologically and biophysically motivated models and are robust for different parameter and stimulation settings. We therefore support the introduction of a gap between the two pulse parts of charge-balanced pulses for neural stimulation. The length of the gap can be optimized with respect to the effectiveness of stimulation. Gap lengths in the order of 2 ms yielded improvements close to the maximum in all simulations. Gaps between the primary and secondary pulse part have been previously described, but the duration of these gaps was limited to short values, e.g., 0.1 ms in a modeling study by Foutz and McIntyre (2010) or approximately 0.2 ms in a description of pulse forms of existing IPGs (Butson and McIntyre, 2007). For such small gaps, only threshold reductions of less than 10% were observed in our study (see Figure 6). Substantial threshold reduction was observed for a 10- to 20-times longer gap. A significant reduction in the power consumption of the IPG could help realize an extended IPG lifetime, retain the current lifetime and do away with voluminous devices, or it could allow the implementation of new sophisticated functions (Kondziolka et al., 2002; Coffey, 2009). It remains to be verified whether gap lengths in the order of 2 ms meet safety requirements for neural stimulation, taking into consideration the extended time span during which irreversible Faradaic reactions may occur. In particular, in the case of reversed pulse order the electrode potential remains relatively positive during the gap phase. Corrosion of electrode material may occur, but in general, it should be avoided. However, the maximally deposited charge equals the charge of one single monophasic stimulation pulse. Since the charge mismatch is balanced within several milliseconds, toxic effects are unlikely. Even slightly imbalanced pulse shapes are considered to be safe based on results from acute effects in cat muscle tissue (Scheiner et al., 1990; Merrill et al., 2005) and short monophasic pulse patterns (shorter than 1–2 min) or the usage of a larger return electrode showed no tissue damage (Cogan, 2008; Piallat et al., 2009). Furthermore, any increase in effectiveness might allow a decrease in stimulation amplitude, which might result in a reduction of the possibility of electro-chemical reactions (Cogan, 2008). Nevertheless, the risks for the patient must be reduced to an absolute minimum. Therefore, in vitro tests of the proposed pulse pattern are needed before pre-clinical application can be considered. Furthermore, a decision on which pulse order should be preferred cannot only be based on computational investigations, an additional thorough experimental investigation is necessary. In our study we use a computational approach to generate a hypothesis that can be tested experimentally.
The modified pulse shapes studied, might be particularly suitable for application in DBS, where a mild but effective stimulation is of great importance. A further advantage of the proposed modification to the pulse form is its simple technical implementation in existing IPGs since, in contrast to the proposed pulse shapes constructed by genetic algorithms (Wongsarnpigoon and Grill, 2010), no additional active components are needed. We see great potential in combining the findings in Wongsarnpigoon and Grill (2010) using a genetic algorithm with the added gap between the pulse parts proposed by us. Our modeling approach particularly considers axonal excitation, which is discussed as one of the most important mechanisms for DBS (Benabid et al., 2005). The pulse shapes with reversed order and including a delay between the anodic and cathodic pulse parts could have the potential to reduce side effects and the required stimulation current.
Conflict of Interest Statement
Dr. Peter Tass and Dr. Christian Hauptmann have a contractual relationship with Adaptive Neuromodulation GmbH. No biomedical financial interests exist related to the presented results. Lorenz Hofmann and Martin Ebert have no biomedical financial interests or potential conflicts of interest.
Acknowledgments
This study was supported by the EU Network of Excellence in Biosimulation (BioSim LSHB-CT-20004-005137) and by the Helmholtz Alliance on Systems Biology. We thank Jean Delbeke for fruitful discussions.
References
Benabid, A. L., Benazzous, A., and Pollak, P. (2002). Mechanisms of deep brain stimulation. Mov. Disord. 17(Suppl. 3), 73–74.
Benabid, A. L., Pollak, P., Gervason, C., Hoffmann, D., Gao, D. M., Hommel, M., Perret, J. E., and de Rougemont, J. (1991). Long-term suppression of tremor by chronic stimulation of the ventral intermediate thalamic nucleus. Lancet 337, 403–406.
Benabid, A.-L., Wallace, B., Mitrofanis, J., Xia, R., Piallat, B., Charbardes, S., and Berger, F. (2005). A putative generalized model of the effects and mechanism of action of high frequency electrical stimulation of the central nervous system. Acta Neurol. Belg. 105, 149–157.
Beurrier, C., Congar, P., Bioulac, B., and Hammond, C. (1999). Subthalamic nucleus neurons switch from single-spike activity to burst-firing mode. J. Neurosci. 19, 599–609.
Butson, C., and McIntyre, C. (2007). Differences among implanted pulse generator waveforms cause variations in the neural response to deep brain stimulation. Clin. Neurophysiol. 118, 1889–1894.
Coffey, R. J. (2009). Deep brain stimulation devices: a brief technical history and review. Artif. Organs 33, 208–220.
Deniau, J., Degos, B., Bosch, C., and Maurice, N. (2010). Deep brain stimulation mechanisms: beyond the concept of local functional inhibition. Eur. J. Neurosci. 32, 1080–1091.
Deuschl, G., Schade-Brittinger, C., Krack, P., Volkmann, J., Schfer, H., Btzel, K., Daniels, C., Deutschlnder, A., Dillmann, U., Eisner, W., Gruber, D., Hamel, W., Herzog, J., Hilker, R., Klebe, S., Kloss, M., Koy, J., Krause, M., Kupsch, A., Lorenz, D., Lorenzl, S., Mehdorn, H. M., Moringlane, J. R., Oertel, W., Pinsker, M. O., Reichmann, H., Reuss, A., Schneider, G. H., Schnitzler, A., Steude, U., Sturm, V., Timmermann, L., Tronnier, V., Trottenberg, T., Wojtecki, L., Wolf, E., Poewe, W., and Voges, J. (2006). A randomized trial of deep-brain stimulation for Parkinson’s disease. N. Engl. J. Med. 355, 896–908.
Dolan, K., Witt, A., Spano, M. L., Neiman, A., and Moss, F. (1999). Surrogates for finding unstable periodic orbits in noisy data sets. Phys. Rev. E. Stat. Phys. Plasmas Fluids Relat. Interdiscip. Topics 59, 5235–5241.
Fahn, S. (2008). The history of dopamine and levodopa in the treatment of Parkinson’s disease. Mov. Disord. 23, 497–508.
Fitzhugh, R. (1961). Impulses and physiological states in theoretical models of nerve membrane. Biophys. J. 1, 445–466.
Foutz, T., and McIntyre, C. (2010). Evaluation of novel stimulus waveforms for deep brain stimulation. J. Neural Eng. 7, 066008.
Garcia, L., Audin, J., D’Alessandro, G., Bioulac, B., and Hammond, C. (2003). Dual effect of high-frequency stimulation on subthalamic neuron activity. J. Neurosci. 23, 8743–8751.
Gorman, P., and Mortimer, J. (1983). The effect of stimulus parameters on the recruitment characteristics of direct nerve stimulation. IEEE Trans. Biomed. Eng. 30, 407–414.
Hairer, E., Norsett, S. P., and Wanner, G. (1993). Solving Ordinary Differential Equations I: Non-stiff Problems. Berlin: Springer-Verlag.
Harnack, D., Winter, C., Meissner, W., Reum, T., Kupsch, A., and Morgenstern, R. (2004). The effects of electrode material, charge density and stimulation duration on the safety of high-frequency stimulation of the subthalamic nucleus in rats. J. Neurosci. Methods 138, 207–216.
Hauptmann, C., and Tass, P. (2010). Restoration of segregated, physiological neuronal connectivity by desynchronizing stimulation. J. Neural Eng. 7, 056008.
Hauptmann, C., Roulet, J. C., Niederhauser, J. J., Doell, W., Kirlangic, M. E., Lysyansky, B., Krachkovskyi, V., Bhatti, M. A., Barnikol, U. B., Sasse, L., Buehrle, C. P., Speckmann, E. J., Goetz, M., Sturm, V., Freund, H.-J., Schnell, U., and Tass, P. A. (2009). External trial deep brain stimulation device for the application of desynchronizing stimulation techniques. J. Neural Eng. 6, 066003.
Hodgkin, A. L., and Huxley, A. F. (1952). A quantitative description of membrane current and its application to conduction and excitation in nerve. J. Physiol. (Lond.) 117, 500–544.
Kondziolka, D., Whiting, D., Germanwala, A., and Oh, M. (2002). Hardware-related complications after placement of thalamic deep brain stimulator systems. Stereotact. Funct. Neurosurg. 79, 228–233.
Lilly, J. C., Hughes, J. R., Alvord, E. C., and Galkin, T. W. (1955). Brief, non-injurious electric waveform for stimulation of the brain. Science 121, 468–469.
Merrill, D. R., Bikson, M., and Jefferys, J. G. (2005). Electrical stimulation of excitable tissue: design of efficacious and safe protocols. J. Neurosci. Methods 141, 171–198.
Meunier, C. (1992). Two and three dimensional reductions of the Hodgkin-Huxley system: separation of time scales and bifurcation schemes. Biol. Cybern. 67, 461–468.
Meunier, C., and Segev, I. (2002). Playing the devil’s advocate: is the Hodgkin-Huxley model useful? Trends Neurosci. 25, 558–563.
Moro, E. E., Esselink, R. J., Xie, J., Hommel, M., Benabid, A. L., and Pollak, P. (2002). The impact on Parkinson’s disease of electrical parameter settings in STN stimulation. Neurology 59, 706–713.
Morris, C., and Lecar, H. (1981). Voltage oscillations in the barnacle giant muscle fiber. Biophys. J. 35, 193–213.
Mortimer, J. T. (1990). “Electrical excitation of nerve,” in Neural Prosthesis: Fundamental Studies, eds W. F. Agnew, and D. B. McCreery (Englewood Cliffs, NJ: Prentice Hall), 67–84.
Nagumo, J., Arimoto, S., and Yoshizawa, S. (1962). An active pulse transmission line simulating nerve axon. Proc. IRE 50, 2061–2070.
Naskar, S., Sood, S., Goval, V., and Dhara, M. (2010). Mechanism(s) of deep brain stimulation and insights into cognitive outcomes in Parkinson’s disease. Brain Res. Rev. 65, 1–13.
Nini, A., Feingold, A., Slovin, H., and Bergman, H. (1995). Neurons in the globus pallidus do not show correlated activity in the normal monkey, but phase-locked oscillations appear in the MPTP model of parkinsonism. J. Neurophysiol. 74, 1800–1805.
Piallat, B., Chabrades, S., Devergnas, A., Torres, N., Allain, M., Barrat, E., and Benabid, A. (2009). Monophasic but not biphasic pulses induce brain tissue damage during monopolar high-freqeuncy deep brain stimulation. Neurosurgery 64, 156–162.
Pinsky, P. F., and Rinzel, J. (1995). Synchrony measures for biological neural networks. Biol. Cybern. 73, 129–137.
Rinzel, J., and Ermentrout, G. B. (1989). “Analysis of neural excitability and oscillations,” in Methods in Neural Modeling: From Synapses to Networks, eds C. Koch, and I. Segev (Cambridge, MA: MIT Press), 135–169.
Rodriguez-Oroz, M. C., Obeso, J. A., Lang, A. E., Houeto, J. L., Pollak, P., Rehncrona, S., Kulisevsky, J., Albanese, A., Volkmann, J., Hariz, M. I., Quinn, N. P., Speelman, J. D., Guridi, J., Zamarbide, I., Gironell, A., Molet, J., Pascual-Sedano, B., Pidoux, B., Bonnet, A. M., Agid, Y., Xie, J., Benabid, A. L., Lozano, A. M., Saint-Cyr, J., Romito, L., Contarino, M. F., Scerrati, M., Fraix, V., and Van Blercom, N. (2005). Bilateral deep brain stimulation in Parkinsons disease: a multicentre study with 4 years follow-up. Brain 128, 2240–2249.
Scheiner, A., Mortimer, J., and Roessmann, U. (1990). Imbalanced biphasic electrical stimulation: muscle tissue damage. Ann. Biomed. Eng. 18, 407–425.
Tass, P. (2003a). Desynchronization by means of a coordinated reset of neural sub-populations – a novel technique for demand-controlled deep brain stimulation. Prog. Theor. Phys. Suppl. 150, 281–296.
Tass, P. (2003b). A model of desynchronizing deep brain stimulation with a demand-controlled coordinated reset of neural subpopulations. Biol. Cybern. 89, 81–88.
Tass, P., Rosenblum, M. G., Weule, J., Kurths, J., Pikovsky, A., Volkmann, J., Schnitzler, A., and Freund, H. J. (1998). Detection of n:m phase locking from noisy data: application to magnetoencephalography. Phys. Rev. Lett. 81, 3291–3294.
Tass, P., Smirnov, D., Karavaev, A., Barnikol, U., Barnikol, T., Adamchic, I., Hauptmann, C., Pawelcyzk, N., Maarouf, M., Sturm, V., Freund, H., and Bezruchko, B. (2010). The causal relationship between subcortical local field potential oscillations and Parkinsonian resting tremor. J. Neural Eng. 7, 16009.
Trottenberg, T., Kupsch, A., Schneider, G. H., Brown, P., and Khn, A. A. (2007). Frequency-dependent distribution of local field potential activity within the subthalamic nucleus in Parkinson’s disease. Exp. Neurol. 205, 287–291.
Volkmann, J., Moro, E., and Pahwa, R. (2006). Basic algorithms for the programming of deep brain stimulation in Parkinson’s disease. Mov. Disord. 21, 284–289.
Wongsarnpigoon, A., and Grill, W. (2010). Energy-efficient waveform shapes for neural stimulation revealed with a genetic algorithm. J. Neural Eng. 7, 046009.
Keywords: computational neuroscience, deep brain stimulation, entrainment, pulsatile stimulation
Citation: Hofmann L, Ebert M, Tass PA and Hauptmann C (2011) Modified pulse shapes for effective neural stimulation. Front. Neuroeng. 4:9. doi: 10.3389/fneng.2011.00009
Received: 07 June 2011; Accepted: 09 August 2011;
Published online: 28 September 2011.
Edited by:
Stefano Ferraina, Sapienza University of Rome, ItalyReviewed by:
Anja Kunze, École Polytechnique Fédérale de Lausanne, SwitzerlandGordon Arbuthnott, Okinawa Institute of Science and Technology, Japan
Copyright: © 2011 Hofmann, Ebert, Tass and Hauptmann. This is an open-access article subject to a non-exclusive license between the authors and Frontiers Media SA, which permits use, distribution and reproduction in other forums, provided the original authors and source are credited and other Frontiers conditions are complied with.
*Correspondence: Christian Hauptmann, Institute of Neuroscience and Medicine – Neuromodulation (INM-7), Forschungszentrum Jülich, 52425 Jülich, Germany. e-mail: c.hauptmann@fz-juelich.de