Modeling of a segmented electrode for desynchronizing deep brain stimulation
- 1 Institute of Neuroscience and Medicine – Neuromodulation, Research Center Jülich, Jülich, Germany
- 2 Department of Stereotactic and Functional Neurosurgery, University of Cologne, Cologne, Germany
Deep brain stimulation (DBS) is an effective therapy for medically refractory movement disorders like Parkinson’s disease. The electrodes, implanted in the target area within the human brain, generate an electric field which activates nerve fibers and cell bodies in the vicinity. Even though the different target nuclei display considerable differences in their anatomical structure, only few types of electrodes are currently commercially available. It is desirable to adjust the electric field and in particular the volume of tissue activated around the electrode with respect to the corresponding target nucleus in a such way that side effects can be reduced. Furthermore, a more selective and partial activation of the target structure is desirable for an optimal application of novel stimulation strategies, e.g., coordinated reset neuromodulation. Hence we designed a DBS electrode with a segmented design allowing a more selective activation of the target structure. We created a finite element model (FEM) of the electrode and analyzed the volume of tissue activated for this electrode design. The segmented electrode activated an area in a targeted manner, of which the dimension and position relative to the electrode could be controlled by adjusting the stimulation parameters for each electrode contact. According to our computational analysis, this directed stimulation might be superior with respect to the occurrence of side effects and it enables the application of coordinated reset neuromodulation under optimal conditions.
1. Introduction
Deep brain stimulation (DBS) is the standard therapy for medically refractory movement disorders including Parkinson’s disease (Benabid et al., 2009) and essential tremor (Lyons and Pahwa, 2004). For DBS, depth electrodes are chronically implanted in target structures, such as the subthalamic nucleus (STN) and the globus pallidus internus (GPi; Limousin et al., 1995; Krause et al., 2001). Commercially available DBS leads have a cylindrical shape and consist of four ring-shaped electrode contacts (Medtronic Inc., St. Jude Medical Inc.). In the case of standard DBS (Limousin et al., 1995; Krause et al., 2001; Lyons and Pahwa, 2004; Benabid et al., 2009) a high-frequency (HF) pulse train is delivered to the brain via the implanted electrodes. Typical DBS parameter settings used for HF stimulation depend on the patient’s status and range from 1 to 3.5 V for the voltage, from 60 to 210 μs for the pulse duration and from 130 to 185 Hz for the frequency (Rizzone et al., 2001; Volkmann et al., 2002; O’Suilleabhain et al., 2003; Kuncel and Grill, 2004). Despite effective clinical applications, the therapeutic mechanisms of DBS are still not completely understood (Benabid et al., 2002). Undesired activation of neighboring structures might be responsible for the side effects occurring including dysarthria, dysesthesia, cerebellar ataxia, memory decline, and depression (Volkmann, 2004; Rodriguez-Oroz et al., 2005; Deuschl et al., 2006). Several strategies are discussed to achieve a more effective and gentle stimulation including novel stimulation strategies like coordinated reset (CR) neuromodulation (Tass, 2003; Tass and Majtanik, 2006; Tass and Hauptmann, 2007; Tass et al., 2009). During CR stimulation short sequences of high-frequency pulse trains are delivered to the brain in a coordinated way, i.e., at different sites at different times (Tass, 2003). The primary goal of this study was to design and computationally test a depth electrode that enables a directed stimulation. On the one hand directed stimulation will likely be anatomically more specific and might, hence, help to avoid side effects of HF DBS. On the other hand such a depth electrode enables to selectively stimulate neuronal subpopulations within a target area and, hence, enable to realize CR neuromodulation (Tass, 2003) in an optimal manner. The goal of the CR approach is to perform a desynchronization and, in turn, an unlearning of pathological connectivity and synchrony and, thus, long-lasting therapeutic effects (Tass and Majtanik, 2006; Tass and Hauptmann, 2007; Tass et al., 2009).
Complex electrode designs allowing spatial steering are recently discussed in the context of DBS (Martens et al., 2010; Toader et al., 2010) and are already used in the area of spinal cord stimulation (Fogel et al., 2003). We focus on the optimization of the potential distribution of DBS and the selective application of current to the target structure. To achieve this goal we have modeled a segmented electrode design consisting of 16 electrode contacts, which turns out to be a promising strategy for the application of CR neuromodulation (Tass, 2003). We compared the electric field distribution of the standard and segmented electrode in finite element models (FEM) in homogenous and isotropic tissue during voltage-controlled stimulation. The potential values of the electric field were used to predict the volume of tissue activated (VTA) by applying the methods proposed by Rattay (1986). Rattay investigated the stimulation of an axon by a point source based on the model of McNeal (1976). He showed that the second derivative of the extracellular potential (activating function) along the fiber axis is responsible for changes in the transmembrane potential and thus for the initiation of action potentials in the axon. In order to determine the action potential threshold, Butson and McIntyre (2006) used an array of 17 × 7 multicompartment axon models lying perpendicular to the electrode shaft. In contrast, we used the simpler Hodgkin-Huxley model and defined a threshold which is independent on the orientation of the axons surrounding the electrode. Our results suggest that already four segmented electrode contacts may enable to generate a VTA adaptively covering the target in an appropriate way.
2. Materials and Methods
The mostly used DBS leads (Medtronic, Inc.: No. 3389 and 3387) have a diameter of 1.27 mm and consist of a polyurethane outer jacket and four ring-shaped electrode contacts (C0–C3) with a length of 1.5 mm composed of platinum-iridium alloy located near the electrode tip. Each contact can be controlled separately depending on the location of the electrode in the target nucleus. The contact spacing is either 1.5 mm (lead No. 3387) or 0.5 mm (lead No. 3389). The electrode with the smaller contact spacing is predominantly used for DBS in the STN (Coffey, 2009). The herein proposed segmented electrode geometry results from a vertical segmentation of each contact C0–C3 of the Medtronic lead No. 3389 into four electrode contact panels a–d electrically isolated by the gap d1 (Figure 1). The properties of the segmented lead with respect to the Medtronic lead are shown in Table 1.
Table 1. Dimensions of DBS leads.
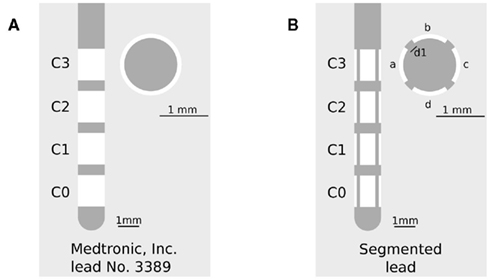
Figure 1. (A) Medtronic lead No. 3389 in side view (left) and cross-section (right), C0–C3 denotes the ring-shaped electrode contacts. (B) Segmented lead in side view (left) and cross-section (right), a–d denotes the segmented contact panels of each contact C0–C3, d1 denotes the electrically isolated gap between each contact panel.
Each contact panel can be individually controlled to enable the application of several stimulation patterns. Due to this fragmentation we may be able to reach a more selective activation and improve the effectiveness of stimulation. The effect of an electrode contact segmentation was previously investigated by Wei and Grill (2005), who focused on a axial segmentation of the contacts and investigated the effects in terms of changes of the current density, the activating function and the impedance of the electrode. They discovered an increased magnitude of the activating function for the segmented electrodes, which in turn results in a reduction of the required stimulation intensity (Wei and Grill, 2005). Our intention is to propose a technically feasible solution which might easily be used in a proof of concept study. The herein presented electrode design is much more simple compared to the design presented by Martens et al. (2010), while reaching the goals of a directed stimulation and a proper application of the complex stimulation strategies (Tass, 2003). This issue will addressed by the investigation of the electric potential field distribution and the volume of tissue activated generated by the segmented electrode.
We calculated the volume of tissue activated for both DBS leads shown in Figure 1. The VTA is calculated to investigate the steering of the activation field and the possibility to apply CR neuromodulation through the segmented electrode design. It has been shown that the approach of the activating function provides a general measure for neuronal activation (Rattay, 1986). Due to a high curvature of the external potential field (activating function) an ionic current occurs in the axon and induces an action potential. This approach is computationally fast as it simply uses electric field data, in contrast to the usage of field neuron models (Butson and McIntyre, 2006). In this study we neglect the orientation of axons around the electrode. Thus the second derivative of the potential field has to be calculated in every possible direction (Section 2.4). The activating function threshold is determined by means of the required current to initiate an action potential. This current was derived by using the Hodgkin-Huxley model. The Hodgkin-Huxley model and the computation of the activating function threshold will be described in detail in the corresponding sections (Sections 2.2 and 2.3).
2.1. The Finite Element Model
The Medtronic lead No. 3389 (standard electrode) and the segmented electrode were reproduced in Comsol 3.5 (Comsol Inc., Burlington, MA, USA). The electrodes were embedded into an axially symmetrical cylinder with a radius of 10 mm and a height of 30 mm, which represents the surrounding brain tissue in this model. The tissue medium was modeled homogeneously and isotropically with a conductivity of 0.2 S/m representing gray matter (Geddes and Baker, 1967; Yousif et al., 2008). The outer boundary was set to 0 V. Dirichlet boundary conditions were used to control voltage values at the contacts. The electrode shaft and the non-active contacts were modeled as electrically isolated. The three-dimensional model was subdivided into triangular mesh elements and the Laplace equation (Eq. 1) was solved (UMFPACK solver) to determine the potential distribution within the tissue medium.

Ve describes the extracellular potential measured in volt and σ represents the conductivity of the surrounding tissue measured in Siemens per meter.
2.2. The Hodgkin-Huxley Model
The activation of neuronal tissue was investigated with the Hodgkin-Huxley model (Hodgkin and Huxley, 1952). The Hodgkin-Huxley model has been developed to simulate the action potential generation in a giant squid axon. The spike generation is modeled via dynamical ion channels which are activated and inactivated depending on gating variables derived from experiments. The direct experimental assessment of the parameters of the Hodgkin-Huxley model is enabled by the proper biophysical levels of abstraction (Meunier and Segev, 2002). Parameters and time constants were taken from Meunier (1992). The response of an axon was explored by applying various input stimuli. The pulse shape and the duration of the stimulation pulse affect the initiation of an action potential. The relationship between the current strength required to initiate an action potential in the axon and the duration of the pulse is expressed in the strength-duration curve. This curve for a rectangular pulse and monophasic cathodic stimulation based on the Hodgkin-Huxley model is shown in Figure 2.
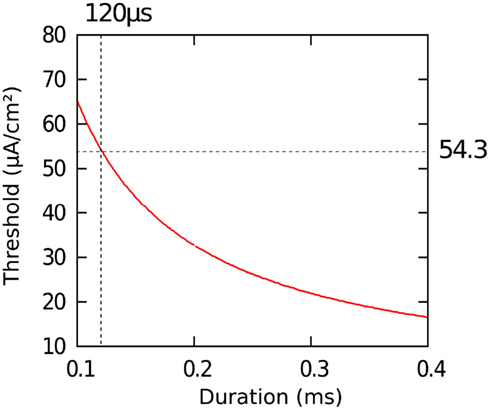
Figure 2. Strength-duration curve calculated with the Hodgkin-Huxley model. We obtained an action potential threshold of 54.3 μA/cm2 assuming an impulse duration of 120 μs.
For a pulse duration of 120 μs we evaluated a current strength threshold of 54.3 μA/cm2 to initiate an action potential.
2.3. Method for Calculating the Activating Function Threshold Value
Rattay showed the influence of an extracellular electric field on a myelinated and unmyelinated axon (Rattay, 1986) in his model for external suprathreshold stimulation. For this purpose, he used a model of the axon consisting of voltage sources, capacities, and resistances. The second derivative of the transmembrane potential in the direction of the axon is responsible for current flow into the axon and is defined as the activating function S = δ2Ve/δx2 (Rattay, 1986). Due to the curvature of the extracellular potential Ve the axon is excited, and excitation propagates both orthodromically and antidromically. In the case of the Hodgkin-Huxley voltage-clamped experiments (δ2V/δx2 = 0), Rattay formulated Eq. 2.
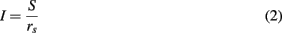
I represents the induced current per square centimeter and rs contains the diameter of the axon and the axoplasmic resistivity.
We calculated the activating function threshold S with Eq. 2 by applying the current threshold I of 54.3 μA/cm2 (Section 2.2). Furthermore, we assumed a value of 5.7 μm to be the diameter of the axon and 70 Ωcm to be the axoplasmic resistivity (McIntyre et al., 2002; Butson and McIntyre, 2006). This results in an activating function threshold of 26.67 V/cm2.
2.4. Method for Calculation of the Volume of Tissue Activated
The calculation of the activating function for our finite element model was realized in Matlab 6.5 (Mathworks, Natick, MA, USA). The potential values around the electrode, given by the solution of the Laplace equation, were written in a matrix with a spatial resolution of 0.1 mm. This matrix is partially derived twice in the x, y, and z direction to define one Hessian matrix H for each point in space. To prevent unrealistically high values at the border of the electrode we omitted the electrically isolated electrode shaft during the calculation of the first and second derivative. In order to specify the maximal second derivative in any direction we determined the eigenvectors  of each Hessian matrix and the corresponding eigenvalues λ:
 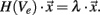 The greatest eigenvalue with the corresponding eigenvector gives the amount and the direction of the maximum curvature of the potential field and is considered to be the value of the activating function. If the maximal eigenvalue λ exceeds the calculated threshold of 26.67 V/cm2 we expect that unmyelinated passing axons will be stimulated with a high probability.
3. Results
3.1. Electric Potential Field Distribution
The finite element models described above provide a basis for investigating the electric potential field generated by the Medtronic electrode No. 3389 and the segmented electrode design presented in this work. Figure 3 shows the electric potential field of the standard and the segmented electrode geometry in monopolar and bipolar stimulation in side view (y, z-plane) and as a cross-section (x, y-plane) in the middle of C0 for the standard electrode and in the middle of C1 for the segmented electrode.
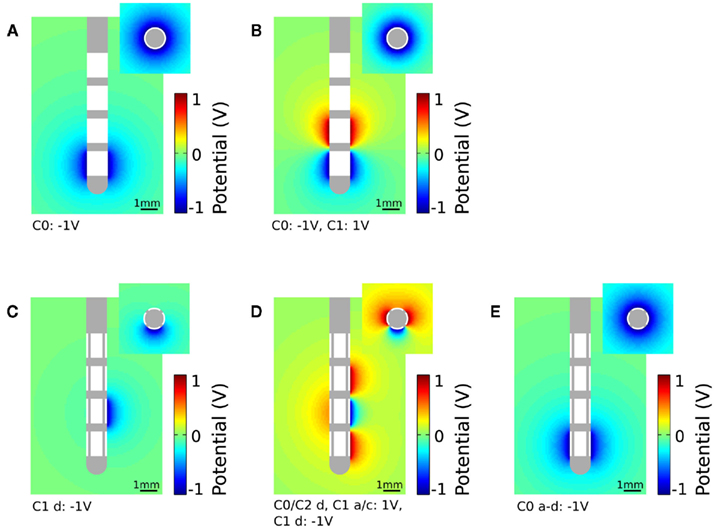
Figure 3. Plot of the electric potential field distribution as a solution of the Laplace equation during voltage-controlled stimulation. The electric potential field is shown in side view (large figures, y, z-plane) and as a cross-section (small figures, x, y-plane). (A) Standard electrode with monopolar settings (C0: −1 V), cross-section in the middle of C0. (B) Standard electrode with bipolar settings (C0: −1 V, C1: 1 V), cross-section in the middle of C0. (C) Segmented electrode with monopolar settings (C1 d: −1 V), cross-section in the middle of C1. (D) Segmented electrode with bipolar settings (C1 d: −1 V, C0/C2 d and C1 a/c: 1 V), cross-section in the middle of C1. (E) All segmented contact panels within the first contact (C0 a–d) are set to −1 V, cross-section in the middle of C0.
To apply monopolar stimulation contact C0 was set to −1 V for the standard electrode (Figure 3A) and contact panel C1 d to −1 V for the segmented electrode geometry (Figure 3C). For bipolar stimulation we additionally set contact C1 to 1 V for the standard electrode (Figure 3B). The segmented electrode offers different configurations for the application of bipolar stimulation. As we intend to gain a restricted stimulation close to the cathodic electrode we additionally set the surrounding four contact panels C0/C2 d and C1 a/c to 1 V (Figure 3D). Assuming homogeneous and isotropic tissue, the standard electrode produces an axially symmetrically distributed electric field around the activated contacts during stimulation. This is in contrast to the segmented electrode which forms an aligned electric potential field in the direction of the activated contact panel. In Figure 3E all contact panels a-d of the stimulation contact C0 are set to the same potential value. Depending on the size of the gap d1 and the distance to the activated contact different distributions of the electric potential field are generated (Figure 4). Close to the electrode (radius: 0.7 mm) the potential values fluctuate by 21.04% considering a gap of 16.6% of the perimeter of the lead shaft. Relatively small fluctuations within the range of 6.84% can be realized setting d1 smaller than 10%. At a distance of 1.5 mm to the electrode the potential field is relatively constant around the activated contact considering gap sizes up to 16.6% of the electrode perimeter (Figure 4).
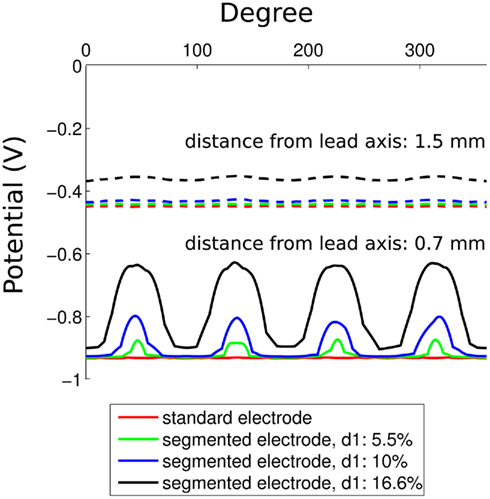
Figure 4. Potential field around the activated contact for the standard and segmented electrode design. Parameter d1 is set to 5.5, 10, and 16.6% of the perimeter of the lead. The distance from the electrode is 0.7 and 1.5 mm.
3.2. Neuronal Tissue Activation
We are interested in the dimension and orientation of the VTA during stimulation using the standard and the segmented electrode geometry. The distribution of the activated volume, calculated using the methods described in Section 2 for monopolar and bipolar stimulation, is shown in Figure 5. The red points indicate the areas in which passing axons will be stimulated with high probability.
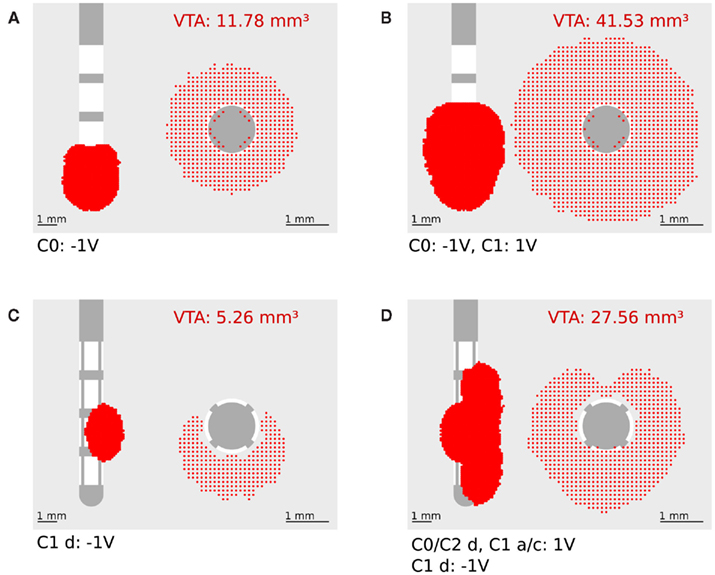
Figure 5. Plot of the volume of tissue activated in side view (y, z-plane, left) and frontal view (x, y-plane, right, all activation in z direction is summarized). (A) Standard electrode with monopolar settings (C0: −1 V). (B) Standard electrode with bipolar settings (C0: −1 V, C1: 1 V). (C) Segmented electrode with monopolar settings (C1 d: −1 V). (D) Segmented electrode with bipolar settings (C0/C2 d and C1 a/c: 1 V, C1 d: −1 V).
Based on the concept of the activating function the second derivative of the extracellular potential has to be positive to depolarize a resting neuron. For monopolar stimulation a strong positively curved extracellular potential field near the cathode is responsible for depolarization of passing fibers (Roth, 1994). In bipolar stimulation the activation is generated at both the cathode and the anode (Kuncel and Grill, 2004). At this, the activation at the anodic contacts can be explained with the effect of the virtual cathode (Roth, 1994). The VTA produced by the standard electrode for both monopolar and bipolar stimulation is axially symmetrical around the activated contacts (Figures 5A, B). The activation extends to a radial distance of 0.8 mm from the activated contact (C0: −1 V) for monopolar stimulation (Figure 5A). In contrast to the standard electrode, the segmented electrode exhibits an activation which is not axially symmetrical and extends to a greater radial distance of 1.06 mm at the middle of the activated contact panel (C1 a: −1 V; Figure 5C). This is caused by the different size of the contact panels resulting in a larger magnitude of the activating function for the segmented electrode (Wei and Grill, 2005). Especially during monopolar stimulation, precise activating fields are generated and a steered stimulation can be realized as shown in Figure 5C. Since the neuronal target nuclei exhibit a small size – for instance the subthalamic nucleus has a mean anterior-posterior dimension of 9.4 mm and a mean lateral-medial dimension of 9.1 mm (Daniluk et al., 2010) – only two or at most three electrode contacts of the standard electrode will be situated in the target structure during stimulation. Figure 6A shows the standard lead and the VTA for monopolar stimulation (C0: −1 V) overlaid on a sagittal section of the Schaltenbrand-Wahren brain atlas (sl 9.0 mm). When the electrode is situated in the middle of the target structure (STN) the axially symmetrical VTA produced by the standard electrode covers the target structure. When the electrode is not placed in the middle of the target structure (Figure 6B) the segmented electrode could prevent activation of neuronal tissue going beyond the area of the target structure so that side effects could possibly be alleviated. Furthermore, the expansion of the activating field can be modified by stimulation through two or more contact panels simultaneously. Moreover, it is possible to stimulate a population of pathological neurons at different sites independently so that CR stimulation can be applied in an optimal manner (Tass, 2003). One strategy of a CR protocol through the segmented electrode is shown in Figure 7.
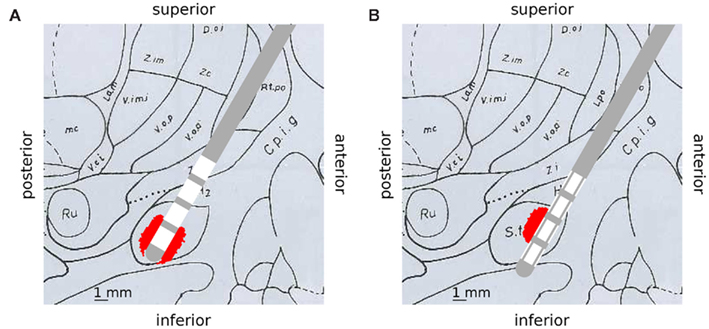
Figure 6. Deep brain stimulation lead and calculated VTA distributions are overlaid on a sagittal slice displayed in the Schaltenbrand-Wahren brain atlas (sl 9.0 mm) to illustrate selective stimulation of the segmented electrode. (A) Standard electrode and VTA (C0: −1 V), the electrode is placed in the middle of the target structure (STN), activation is symmetrically distributed around the standard electrode and covers the target structure. (B) Segmented electrode and VTA (C1 a: −1 V), the electrode is shifted to the border of the target structure (STN), selective stimulation with the segmented electrode could prevent activation of unwanted structures.
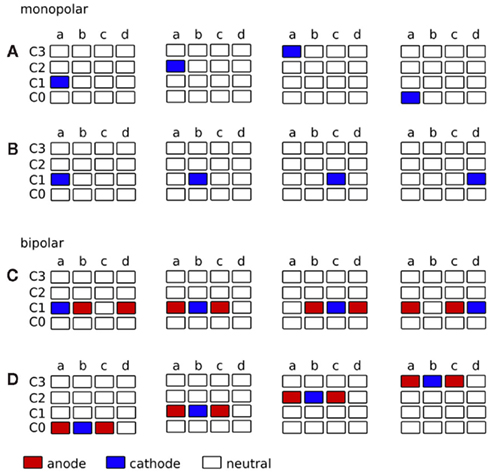
Figure 7. Strategy for the application of complex stimulation protocols, such as CR neuromodulation (Tass, 2003), through the segmented electrode. The contact panels are displayed in a two-dimensional matrix. (A–D) represent the contact panels of each contact C0–C3. Contact panels charged as cathode are colored in blue and contact panels charged as anode are colored in red. Each matrix out of the four matrices indicates the voltage distribution at consecutive time points (from left to right). (A) Monopolar stimulation, cathode rotates vertically along the contact panels. Target structure for CR in front of panel a. (B) Monopolar stimulation, cathode rotates horizontally along the contact panels. Target structure for CR surrounding electrode contact C1. (C) Bipolar stimulation, cathode and anode rotate horizontally along the contact panels. Target structure for CR surrounding electrode contact C1. (D) Bipolar stimulation, cathode and anode rotate vertically along the contact panels. Target structure for CR in front of panel b.
The contact panels are displayed in a two-dimensional matrix, where sub-plots a–d represent the segmented contact panels of each contact C0–C3. Contact panels which are used as cathode are colored in blue and contact panels which are used as anode are colored in red. In monopolar settings, the activated cathodal contact panel can rotate vertically (Figure 7A) or horizontally (Figure 7B) along the contact panels. In bipolar settings similar sequences can be carried out, where additional adjacent contact panels, for instance neighbors in the same row (Figure 7C) or in the same column (Figure 7D), are used as shielded anodes. During stimulation, signals can be delivered in a time-coordinated manner to different groups of neurons to optimize the application of coordinated reset stimulation (Tass, 2003; Tass and Majtanik, 2006; Tass and Hauptmann, 2007; Tass et al., 2009). As a result of activating the contact panels consecutively, multiple activation of certain areas might occur. When applying monopolar stimulation by consecutively activating contact panels a–d (Figure 7B) VTAs will overlap. The amount of the VTA overlap depends on the stimulation amplitude and is shown in Figure 8.
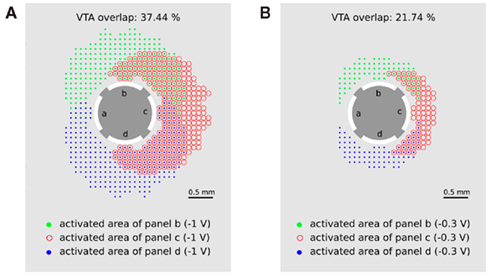
Figure 8. Multiple activation of neuronal target structures by applying the activity pattern of monopolar stimulation as consecutively activating contact panels b–d with (A) −1 V and (B) −0.3 V. Green points (red circles, blue points) represent the activated area when contact panel b (c, d) is set to −1 V. Multiple stimulated regions are indicated by overlapping symbols of the activated areas (green points together with red circles or blue points together with red circles).
The green points (red circles and blue points) represent the areas in which passing axons will be activated when contact panel b (c or d) are activated with −1 V, respectively. Overlap of these regions is indicated by an overlap of the corresponding symbols and indicates a multiple activation of neuronal target structures during consecutive activation of contact panels b, c, and d. The overlap of 37.44% for a stimulation amplitude of −1 V seems to be acceptable for the application of CR neuromodulation. If smaller overlaps are required for an optimal CR protocol, the stimulation amplitude has to be reduced. In the case of a stimulation amplitude of 0.3 V the double stimulated region is reduced to 21.74%.
4. Discussion
We designed a segmented electrode geometry and investigated the ability of directed stimulation and its application to CR neuromodulation. Our results suggest that the segmented electrode geometry enables stimulation of particular regions of neuronal tissue. The VTA produced by the standard electrode encompasses the activated electrode completely, and it is not possible to excite neuronal tissue in a defined direction during stimulation. Due to the multiplicity of electrode contact panels of the segmented lead it is not only possible to create a volume of tissue activated differing in its expansion but also differing in its direction. The segmented electrode enables defined volumes to be stimulated by activating several segmented contact panels (Figure 5). Furthermore, an activation of neighboring structures could be reduced, which is of particular importance if the electrode is not located in the center of the target structure (Figure 6B). Moreover, charging several segmented contact panels with different potential values would modify the shape of the electric field resulting in a customized VTA. This enables more selective and controlled effects on neuronal elements to be realized. Hence, such an electrode may enable to apply CR neuromodulation (Tass, 2003) which aims at an unlearning of pathological weights, in this way leading to long-lasting desynchronization as shown both computationally (Tass and Majtanik, 2006; Tass and Hauptmann, 2007) and in animal experiments (Tass et al., 2009). The observation, that a reduction of the amplitude can reduce the overlap is in accordance with previous theoretical findings showing that weak CR stimulation can have better effects than stronger CR stimulation (Hauptmann and Tass, 2009; Lysyansky et al., 2011). In the investigation of the segmented electrode, we showed that close to the activated contact panels small fluctuations of the potential field can be realized by setting the isolation gap d1 to less than 10% of the perimeter of the lead. In a radial distance of 1.5 mm to the activated contact panel relatively small changes in the potential field are generated (Figure 4). Small fluctuations close to the electrode and minor changes of the electric potential in the near field have the advantage of a backward compatibility for the segmented electrode.
The charge density over the activated electrode is, among other things, responsible for tissue damage during stimulation. Stimulating with the standard electrode generates a charge density of 1.67 μC/cm2 assuming an impulse duration of 100 μs and a current strength of 1 mA resulting from a voltage of −1 V at 1000 Ω resistance. Due to the smaller electrode surface the charge density of the segmented electrode amounts to 8.6 μC/cm2. With these assumptions, the charge density remains below 26 μC/cm2, which is considered to be safe (Harnack et al., 2004). Therefore, we think that an electrode like the one presented here with a contact surface of 0.0116 cm2 is less critical to be used for clinical application than electrodes with very small contact surfaces of 0.002 cm2 which might result in harmful charge densities of up to 120 μC/cm2 (using the stimulation parameters documented in Martens et al., 2010) or 50 μC/cm2 (if 100 μs, −1 V, and 1000 Ω is used) (Martens et al., 2010).
The quantitative estimation of the VTA during stimulation is a complex task, since only limited information is available concerning the detailed structure and physical properties of the tissue (Butson et al., 2007; Moffitt, 2011). We used the approach of the activating function for determining the activated area around the electrode during stimulation. This simplification of estimating the effect that the potential will have on neurons causes a spatial underestimation of the volume of tissue activated for different reasons. We did not take into consideration that the action potential threshold of the activating function decreases with greater distance from the electrode as described in (Butson and McIntyre, 2006). Furthermore, the antidromic and orthodromic activation is not incorporated in our calculation. However, this approach is computationally fast and enables a reasonable estimation of the VTA. Patient specific anisotropies and inhomogeneities are neglected in the electric field model, but we expect that these features can improve the quantitative correctness of the VTA estimation significantly (McIntyre et al., 2004; Chaturvedi et al., 2010). Electrode capacitance and an encapsulation layer which simulates the accumulation of fibroblasts, collagen, and giant cells surrounding the electrode will be incorporated in subsequent studies (Grill and Mortimer, 1994; Butson and McIntyre, 2005; Yousif et al., 2007). A more accurate prediction of the VTA can be achieved by placing neurons in the potential field generated by the electrode (Butson and McIntyre, 2006).
Nevertheless, our approach shows that already a subdivision into four contact panels of each electrode contact would allow an optimized application of DBS stimulation, in particular if complex stimulation patterns like CR neuromodulation (Tass, 2003) are considered. The VTA can be shaped with respect to the particular position of electrode and target structure, which might improve the therapeutic outcome of the stimulation while reducing potential side effects.
Conflict of Interest Statement
The authors declare that the research was conducted in the absence of any commercial or financial relationships that could be construed as a potential conflict of interest.
Acknowledgments
This study was supported by the project KFO219 of the Deutsche Forschungsgemeinschaft and by the Helmholtz Alliance on Systems Biology.
References
Benabid, A. L., Benazzous, A., and Pollak, P. (2002). Mechanisms of deep brain stimulation. Mov. Disord. 17(Suppl. 3), S73–S74.
Benabid, A. L., Chabardes, S., Mitrofanis, J., and Pollak, P. (2009). Deep brain stimulation of the subthalamic nucleus for the treatment of Parkinson’s disease. Lancet Neurol. 8, 67–81.
Butson, C. R., Maks, C. B., and McIntyre, C. C. (2007). System and methods for determining volume of activation for deep brain stimulation. US Patent 2007/0288064 A1.
Butson, C. R., and McIntyre, C. C. (2005). Tissue and electrode capacitance reduce neural activation volumes during deep brain stimulation. Clin. Neurophysiol. 116, 2490–2500.
Butson, C. R., and McIntyre, C. C. (2006). Role of electrode design on the volume of tissue activated during deep brain stimulation. J. Neural Eng. 3, 1–8.
Chaturvedi, A., Butson, C. R., Lempka, S. F., Cooper, S. E., and McIntyre, C. C. (2010). Patient-specific models of deep brain stimulation: influence of field model complexity on neural activation predictions. Brain Stimul. 3, 65–67.
Coffey, R. J. (2009). Deep brain stimulation devices: a brief technical history and review. Artif. Organs 33, 208–220.
Daniluk, S., Davies, K. G., Ellias, S. A., Novak, P., and Nazzaro, J. M. (2010). Assessment of the variability in the anatomical position and size of the subthalamic nucleus among patients with advanced Parkinson’s disease using magnetic resonance imaging. Acta Neurochir. (Wien) 152, 201–210; discussion 210.
Deuschl, G., Schade-Brittinger, C., Krack, P., Volkmann, J., Schfer, H., Btzel, K., Daniels, C., Deutschlnder, A., Dillmann, U., Eisner, W., Gruber, D., Hamel, W., Herzog, J., Hilker, R., Klebe, S., Kloss, M., Koy, J., Krause, M., Kupsch, A., Lorenz, D., Lorenzl, S., Mehdorn, H. M., Moringlane, J. R., Oertel, W., Pinsker, M. O., Reichmann, H., Reuss, A., Schneider, G.-H., Schnitzler, A., Steude, U., Sturm, V., Timmermann, L., Tronnier, V., Trottenberg, T., Wojtecki, L., Wolf, E., Poewe, W., Voges, J., and German Parkinson Study Group, Neurostimulation Section. (2006). A randomized trial of deep-brain stimulation for Parkinson’s disease. N. Engl. J. Med. 355, 896–908.
Fogel, G. R., Esses, S. I., and Calvillo, O. (2003). Management of chronic limb pain with spinal cord stimulation. Pain Pract. 3, 144–151.
Geddes, L. A., and Baker, L. E. (1967). The specific resistance of biological material – a compendium of data for the biomedical engineer and physiologist. Med. Biol. Eng. 5, 271–293.
Grill, W. M., and Mortimer, J. T. (1994). Electrical properties of implant encapsulation tissue. Ann. Biomed. Eng. 22, 23–33.
Harnack, D., Winter, C., Meissner, W., Reum, T., Kupsch, A., and Morgenstern, R. (2004). The effects of electrode material, charge density and stimulation duration on the safety of high-frequency stimulation of the subthalamic nucleus in rats. J. Neurosci. Methods 138, 207–216.
Hauptmann, C., and Tass, P. A. (2009). Cumulative and after-effects of short and weak coordinated reset stimulation: a modeling study. J. Neural Eng. 6, 1–13.
Hodgkin, A. L., and Huxley, A. F. (1952). A quantitative description of membrane current and its application to conduction and excitation in nerve. J. Physiol. (Lond.) 117, 500–544.
Krause, M., Fogel, W., Heck, A., Hacke, W., Bonsanto, M., Trenkwalder, C., and Tronnier, V. (2001). Deep brain stimulation for the treatment of Parkinson’s disease: subthalamic nucleus versus globus pallidus internus. J. Neurol. Neurosurg. Psychiatr. 70, 464–470.
Kuncel, A. M., and Grill, W. M. (2004). Selection of stimulus parameters for deep brain stimulation. Clin. Neurophysiol. 115, 2431–2441.
Limousin, P., Pollak, P., Benazzouz, A., Hoffmann, D., Bas, J. F. L., Broussolle, E., Perret, J. E., and Benabid, A. L. (1995). Effect of parkinsonian signs and symptoms of bilateral subthalamic nucleus stimulation. Lancet 345, 91–95.
Lyons, K. E., and Pahwa, R. (2004). Deep brain stimulation and essential tremor. J. Clin. Neurophysiol. 21, 2–5.
Lysyansky, B., Popovych, O. V., and Tass, P. A. (2011). Desynchronizing anti-resonance effect of m: n ON-OFF coordinated reset stimulation. J. Neural Eng. 8, 036019.
Martens, H. C. F., Toader, E., Decr, M. M. J., Anderson, D. J., Vetter, R., Kipke, D. R., Baker, K. B., Johnson, M. D., and Vitek, J. L. (2010). Spatial steering of deep brain stimulation volumes using a novel lead design. Clin. Neurophysiol. 122, 558–566.
McIntyre, C. C., Mori, S., Sherman, D. L., Thakor, N. V., and Vitek, J. L. (2004). Electric field and stimulating influence generated by deep brain stimulation of the subthalamic nucleus. Clin. Neurophysiol. 115, 589–595.
McIntyre, C. C., Richardson, A. G., and Grill, W. M. (2002). Modeling the excitability of mammalian nerve fibers: influence of after potentials on the recovery cycle. J. Neurophysiol. 87, 995–1006.
McNeal, D. R. (1976). Analysis of a model for excitation of myelinated nerve. IEEE Trans. Biomed. Eng. 23, 329–337.
Meunier, C. (1992). Two and three dimensional reductions of the Hodgkin-Huxley system: separation of time scales and bifurcation schemes. Biol. Cybern. 67, 461–468.
Meunier, C., and Segev, I. (2002). Playing the devil’s advocate: is the Hodgkin-Huxley model useful? Trends Neurosci. 25, 558–563.
Moffitt, M. (2011). System and method for estimating volume of activation in tissue. US Patent 2011/0093045 A1.
O’Suilleabhain, P. E., Frawley, W., Giller, C., and Dewey, R. B. (2003). Tremor response to polarity, voltage, pulse width and frequency of thalamic stimulation. Neurology 60, 786–790.
Rattay, F. (1986). Analysis of models for external stimulation of axons. IEEE Trans. Biomed. Eng. 33, 974–977.
Rizzone, M., Lanotte, M., Bergamasco, B., Tavella, A., Torre, E., Faccani, G., Melcarne, A., and Lopiano, L. (2001). Deep brain stimulation of the subthalamic nucleus in Parkinson’s disease: effects of variation in stimulation parameters. J. Neurol. Neurosurg. Psychiatr. 71, 215–219.
Rodriguez-Oroz, M. C., Obeso, J. A., Lang, A. E., Houeto, J.-L., Pollak, P., Rehncrona, S., Kulisevsky, J., Albanese, A., Volkmann, J., Hariz, M. I., Quinn, N. P., Speelman, J. D., Guridi, J., Zamarbide, I., Gironell, A., Molet, J., Pascual-Sedano, B., Pidoux, B., Bonnet, A. M., Agid, Y., Xie, J., Benabid, A.-L., Lozano, A. M., Saint-Cyr, J., Romito, L., Contarino, M. F., Scerrati, M., Fraix, V., and Blercom, N. V. (2005). Bilateral deep brain stimulation in Parkinson’s disease: a multicentre study with 4 years follow-up. Brain 128(Pt 10), 2240–2249.
Roth, B. J. (1994). Mechanisms for electrical stimulation of excitable tissue. Crit. Rev. Biomed. Eng. 22, 253–305.
Tass, P. A. (2003). A model of desynchronizing deep brain stimulation with a demand-controlled coordinated reset of neural subpopulations. Biol. Cybern. 89, 81–88.
Tass, P. A., and Hauptmann, C. (2007). Therapeutic modulation of synaptic connectivity with desynchronizing brain stimulation. Int. J. Psychophysiol. 64, 53–61.
Tass, P. A., and Majtanik, M. (2006). Long-term anti-kindling effects of desynchronizing brain stimulation: a theoretical study. Biol. Cybern. 94, 58–66.
Tass, P. A., Silchenko, A. N., Hauptmann, C., Barnikol, U. B., and Speckmann, E.-J. (2009). Long-lasting desynchronization in rat hippocampal slice induced by coordinated reset stimulation. Phys. Rev. E Stat. Nonlin. Soft Matter Phys. 80(Pt 1), :011902.
Toader, E., Decre, M. M. J., and Martens, H. C. F. (2010). Steering deep brain stimulation fields using a high resolution electrode array. Conf. Proc. IEEE Eng. Med. Biol. Soc. 2010, 2061–2064.
Volkmann, J. (2004). Deep brain stimulation for the treatment of Parkinson’s disease. J. Clin. Neurophysiol. 21, 6–17.
Volkmann, J., Herzog, J., Kopper, F., and Deuschl, G. (2002). Introduction to the programming of deep brain stimulators. Mov. Disord. 17(Suppl. 3), S181–S187.
Wei, X. F., and Grill, W. M. (2005). Current density distributions, field distributions and impedance analysis of segmented deep brain stimulation electrodes. J. Neural Eng. 2, 139–147.
Yousif, N., Bayford, R., Bain, P. G., and Liu, X. (2007). The peri-electrode space is a significant element of the electrode-brain interface in deep brain stimulation: a computational study. Brain Res. Bull. 74, 361–368.
Keywords: deep brain stimulation, electrode, finite element model
Citation: Buhlmann J, Hofmann L, Tass PA and Hauptmann C (2011) Modeling of a segmented electrode for desynchronizing deep brain stimulation. Front. Neuroeng. 4:15. doi: 10.3389/fneng.2011.00015
Received: 19 August 2011;
Paper pending published: 13 September 2011;
Accepted: 21 November 2011;
Published online: 08 December 2011.
Edited by:
Ulrich G. Hofmann, University of Lübeck, GermanyReviewed by:
Christian K. E. Moll, University Clinic Hamburg-Eppendorf, GermanyDavid J. Anderson, University of Michigan, USA
Thilo Bernhard Krueger, Inomed Medizintechnik GmbH, Germany
Copyright: © 2011 Buhlmann, Hofmann, Tass and Hauptmann. This is an open-access article distributed under the terms of the Creative Commons Attribution Non Commercial License, which permits non-commercial use, distribution, and reproduction in other forums, provided the original authors and source are credited.
*Correspondence: C. Hauptmann, Institute of Neuroscience and Medicine – Neuromodulation, Research Center Jülich, 52425 Jülich, Germany. e-mail: c.hauptmann@fz-juelich.de