Mobile robots for localizing gas emission sources on landfill sites: is bio-inspiration the way to go?
- 1 Center for Applied Autonomous Sensor Systems, School of Science and Technology, Örebro University, Örebro, Sweden
- 2 BAM Federal Institute for Materials Research and Testing, Berlin, Germany
Roboticists often take inspiration from animals for designing sensors, actuators, or algorithms that control the behavior of robots. Bio-inspiration is motivated with the uncanny ability of animals to solve complex tasks like recognizing and manipulating objects, walking on uneven terrains, or navigating to the source of an odor plume. In particular the task of tracking an odor plume up to its source has nearly exclusively been addressed using biologically inspired algorithms and robots have been developed, for example, to mimic the behavior of moths, dung beetles, or lobsters. In this paper we argue that biomimetic approaches to gas source localization are of limited use, primarily because animals differ fundamentally in their sensing and actuation capabilities from state-of-the-art gas-sensitive mobile robots. To support our claim, we compare actuation and chemical sensing available to mobile robots to the corresponding capabilities of moths. We further characterize airflow and chemosensor measurements obtained with three different robot platforms (two wheeled robots and one flying micro-drone) in four prototypical environments and show that the assumption of a constant and unidirectional airflow, which is the basis of many gas source localization approaches, is usually far from being valid. This analysis should help to identify how underlying principles, which govern the gas source tracking behavior of animals, can be usefully “translated” into gas source localization approaches that fully take into account the capabilities of mobile robots. We also describe the requirements for a reference application, monitoring of gas emissions at landfill sites with mobile robots, and discuss an engineered gas source localization approach based on statistics as an alternative to biologically inspired algorithms.
1. Introduction
Gas-sensitive mobile robots are valuable instruments for addressing tasks like detection of gas leaks, search for explosives, surveillance, or exploration of areas where hazardous gases might be present. A concrete example of these application fields that is gaining particular interest among the EU authorities is monitoring of gaseous emissions in landfill sites (Scharff, 2008). Landfill emissions account for 2% of the total greenhouse gases (GHG) released by human activity (Bogner et al., 2007). The GHG released from landfill sites are mainly methane (CH4) and carbon dioxide (CO2), and to a minor extent mixtures of oxygen (O2), nitrogen (N2), and hydrogen (H2). Also, poisonous gases like hydrogen sulfide (H2S) can be released in landfills. In particular, methane produced from solid waste is a biogas that can be used as an alternative energy source (Scharff, 2008). According to Atleverket, the agency responsible of waste management in the province of Örebro, Sweden, 18000 MWh are produced yearly from the biogas that is obtained from the landfill sites in Örebro. It is important to notice that methane leaks occur frequently even in landfills that have been closed for decades. These leaks are difficult to detect and with current monitoring technologies it can take weeks before a leak is detected and localized. Ultimately, this turns into a waste of resources and in a substantial emission of GHG. The delay and inaccuracy in the leak detection are mainly due to the sparsity, both spatial and temporal, of collected samples. Currently, a landfill operator is required by law to collect one sample a month for a few predetermined locations. Mobile robotics can make a significant contribution in this area by providing versatile systems for autonomous monitoring of diverse environments. Robotic solutions can adaptively collect sensor measurements, cooperate with other systems, and provide useful indications to landfill operators. Compared to human operators, mobile robots have the advantage to carry out the required repetitive measurement procedure without suffering from fatigue and therefore, they can perform measurements with a much denser spatio-temporal granularity. Moreover, the use of an automated monitoring platform can minimize the exposure of human operators to hazardous compounds like, for example, H2S. In addition, the mobile robots that carry the sensors offer the required accurate localization and computational resources to compute for example, on-line gas distribution models. This enables the possibility to decide which locations to observe next based on the current model (Neumann et al., 2012).
A landfill monitoring robot should be able to perform two major tasks. (1) Serve as an autonomous and flexible system that can explore large areas in order to measure biogas concentrations (e.g., CO2 and CH4). (2) From the acquired measurements, it should be able to provide the landfill operators with useful information such as gas distribution maps and locations of possible gas leaks. Strictly, for none of the two tasks there is a direct biological example to mimic. However, these two complex tasks can be broken down into specific subtasks like discriminating among the different gases, estimating the location of multiple gas sources and building gas distribution maps. For what concerns odor discrimination, many works can be found in literature that formulate mathematical models of the olfactory pathways that process the signal coming from the olfactory receptors (Cleland and Linster, 2005). While, to the knowledge of the authors, the construction of a gas distribution map has no direct biological counterpart, insects have an outstanding ability to find distant sources of odors (Cardé and Willis, 2008). Insects locate odor sources by tracking wind-borne odor plumes to their emission source. The majority of robots that have been proposed for gas source localization take inspiration from insects and try to track an odor plume up to its source, where they declare the end of their task (Lilienthal and Duckett, 2003; Lilienthal et al., 2003, 2006b; Kowadlo and Russell, 2008). The animals that have inspired most of the robotics research for odor plume tracking are:
Moths, which use odor localization to find mates (Kuwana et al., 1999; Ishida et al., 2001; Pyk et al., 2006).
Lobsters, which use odor localization to locate food (Grasso et al., 1998).
Escherichia Coli, which use odor localization to locate nutrients (Russell et al., 2003).
Dung Beetles, which use odor localization to find hatching niches, habitation, and food (Russell et al., 2003).
The bio-inspired gas source tracking algorithms that have been implemented on mobile robots are based on two principles, namely chemotaxis and anemotaxis. Chemotaxis refers to a mechanism in which the movement of an organism (or robot) is determined by the distribution of chemical compounds, most often by the concentration gradient of one or more volatiles. Anemotaxis instead refers to a mechanism in which the movement of an organism (or robot) is determined by the perceived airflow (air can be generalized to fluid).
More recently Vergassola et al. (2007) proposed infotaxis, which is a search strategy based on probability and information theory. It was designed for addressing the gas source localization problem in uncontrolled indoor or outdoor environments characterized by a high Reynolds number and thus dominated by turbulence (Roberts and Webster, 2002). Instead of using concentration and flow gradients, infotaxis models the location of the source as a probability distribution derived from previously collected measurements and the next actions of the robot (i.e., move to a neighboring location or standing still) are decided based on a minimum entropy criterion.
To the knowledge of the authors, only two works have evaluated the concepts presented by infotaxis with physical experiments. In Moraud and Martinez (2010), the authors assess the robustness and reliability of infotaxis for localizing a heat source, arguing that heat has dispersion properties very similar to chemical compounds. However, temperature sensors have a much faster dynamics than gas sensors. In addition, an artificial airflow was induced with a fan, which simplifies the gas source localization problem even further. In Lochmatter (2010), the authors evaluated, among other source location algorithms, a statistical approach that follows the same principles as infotaxis. The authors performed their experiments inside a 18 m × 4 m wind tunnel with an ethanol gas source and a robot equipped with a commercial gas sensor. The experiments were carried out under laminar flow conditions.
In general, most of the work in mobile robot olfaction has been developed under simplified assumptions. The most common assumptions on which works in literature are based are steady constant airflow and the presence of a single gas source emitting a known chemical compound at a constant rate. Moreover, in most of the cases the exploration area is of limited size, the airflow is artificially modified and the robot’s starting position is located downwind with respect to the gas source, making it easy for the robot to collect odor cues. Obviously, those assumptions do not hold in a scenario like a landfill. First of all, a landfill is an area of considerable size, where finding gas traces that can initiate a plume tracking algorithm is difficult. Therefore, initial exploration strategies for gas finding cannot be trivially formulated. Moreover, more than one gas leak emitting different compounds (at variable rates) may be present at the same time. Finally, the airflow in an open outdoor environment like a landfill is dominated by turbulent advection (Shraiman and Siggia, 2000). Turbulent airflow disperses the gas plume creating a complex structure of gas patches with different concentration levels. Furthermore, advection can create areas of high concentration away from the location where the gas was released.
The main contribution of this paper is to highlight the weaknesses of state-of-the-art bio-inspired algorithms for gas source localization that aim to directly reproduce insect behavior. The argumentation brought at support is twofold: first, the sensing mechanisms available to robotic systems are completely different from biological receptors, and second, the chaotic environmental properties of natural environments do not allow the formation of a steady odor plume that would lead a robot that implements a form of bio-inspired anemotaxis to the gas source. Moreover, for localizing a gas source a mobile robot does not necessarily need to travel toward it tracking the odor plume. Indeed, the robot can collect measurements in locations far away from the gas source and still be able to infer the position of the emission source.
We provide observations collected in four different experimental areas with three different platforms in order to support our claims. We then use an engineered approach as an alternative to biologically inspired gas localization algorithms. To conclude, we argue that isolated principles of animal behavior can help us to understand the task of gas source localization better, provided that we carefully take into account the limited mobility of a robot and the difference between biological receptors and the sensors that are available to a robot.
2. Materials and Methods
In order to investigate the characteristics of measurements collected by mobile robots in natural environments, we perform experiments in four different locations with three different robotic platforms. The different locations have been chosen in order to have a wide spectrum of possible environmental conditions, ranging from a closed isolated room, to a long corridor with open ends and two different courtyards. Also, the selection of the robotic platform aims at investigating different sensor configurations imposed by the constraints of the different platforms. In particular, the experiments were performed with two wheeled robots and one flying quadrocopter. Wheeled robots have a high payload, a long battery life, and they can have large computational resources on-board. On the other hand flying platforms have less restrictions regarding mobility compared to wheeled robots but typically they have limited payload and battery life. Another shortcoming of helicopter platforms is that the action of their rotors can influence significantly the airflow, modifying the original gas distribution. In all the experiments the robots were following a predefined trajectory that covered the area of inspection. The robots were stopping at regular intervals in order to collect series of measurements. No attempt was made to move the robot toward the location of the gas source but instead, data have been collected over all the area of inspection and then, gas distribution maps have been produced at the end of the experiments. As we will see in Section 3, gas distribution maps can provide good indications on the location of the gas source. In the next subsections we will first introduce the robotics platforms (Section 2.1), then describe the experimental environments (Section 2.2), and finally illustrate the sensing modalities employed for chemical (Section 2.3) and airflow (Section 2.4) sensing.
2.1. Robotic Platforms
2.1.1. Outdoor wheeled robot
The first robot, shown in Figure 1A is an ATRV-JR all terrain robot equipped with a laser range scanner (SICK LMS 200) used for localization, an electronic nose, and an anemometer. The electronic nose comprises six gas sensors (five metal oxide and one electrochemical) enclosed in an aluminum tube. This tube is horizontally mounted at the front side of the robot at a height of 0.1 m over the ground. The electronic nose is actively ventilated through a fan that creates a constant airflow toward the gas sensors. Thus, it lowers the effect of external airflow and the movement of the robot on the sensor response and guarantees a continuous exchange of gas in situations with very low external airflow. The gas sensors used in the electronic nose are listed in Table 1. The ultrasonic anemometer used to measure the airflow is a Young 81000 with a range from 0.02 up to 40 m/s and a resolution of 0.01 m/s. The placement of the anemometer had to be a compromise between the desire to measure the airflow as close to the gas sensors and as undisturbed as possible. It was finally placed above the top of the robot in order to minimize the influence of the fan of the electronic nose and the body of the robot itself. The robot software is based on the Player robot server (Gerkey et al., 2003), a control interface that simplifies access to standard robot sensors and actuators and provides implementations of standard algorithms. In particular, adaptive Monte Carlo localization (amcl driver), VFH+ obstacle avoidance (vfh driver), and the wavefront path planner (wavefront driver) were used for localization, local, and global path planning, respectively. The localization module implemented in the amcl driver uses the odometry and the laser scanner readings in order to localize the robot on a map provided to the algorithm at the startup.
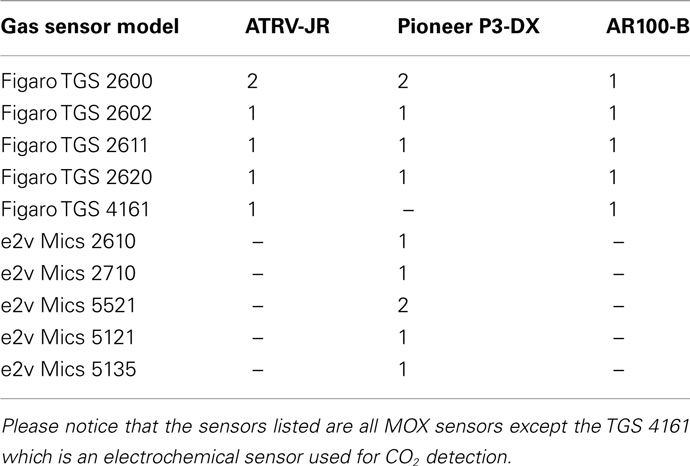
Table 1. Gas sensors used in the electronic noses mounted on the three robotic platforms.
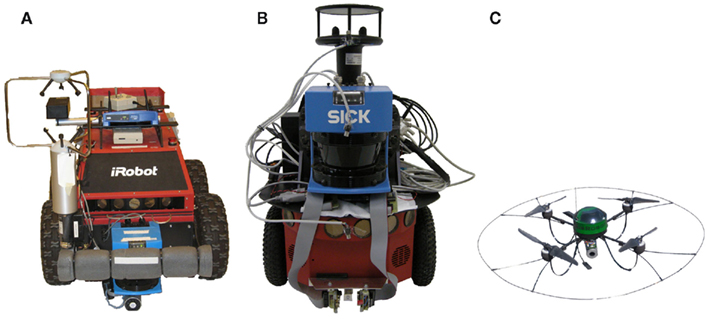
Figure 1. Robots used in the presented experiments. Notice that the three pictures are not in scale. (A) Outdoor wheeled robot (B) indoor wheeled robot (C) outdoor flying robot.
2.1.2. Indoor wheeled robot
The second robot used in our experiments is a Pioneer P3-DX (MobileRobots), shown in Figure 1B. The Pioneer P3-DX is a smaller platform compared to the ATRV-JR. It has been selected due to its better maneuverability, a desirable characteristic while performing experiments in a small room. As in the case of the ATRV-JR, the robot is equipped with a laser scanner and it runs the Player robot server for performing localization and navigation tasks. For what concerns gas sensing devices, the robot was equipped with three MOX gas sensors (TGS2620, Figaro Engineering) positioned at different heights (0.571, 0.393, and 0.199 m on the ground). Moreover, the robot was equipped with two e-noses containing the 11 sensors listed in Table 1 and a photo ionization (PID) gas detector (ppbRAE 3000, RAE Systems). The e-noses and the PID inlet were mounted 0.065 m over the ground. The photo ionization gas detector shows quick response to a wide range of gases, and provides calibrated readings of the gas concentration (given that the chemical compound is known). The responses of the metal-oxide gas sensors are slower and the sensors are not calibrated, but enable selective gas detection. The robot is also equipped with a two-dimensional ultrasonic anemometer (WindSonic, Gill). The device can measure the airflow velocity from 0 to 60 m/s with 0.01 m/s resolution. The specifications of the Gill WindSonic anemometer are very similar to the ones of the Young 81000, and the only major difference is that the WindSonic provides a 2-D reading instead of 3-D, and is much smaller.
2.1.3. Outdoor flying robot
The third robot that we used for our tests is the AR100-B micro-drone developed by AirRobot GmbH & Co. The micro-drone was modified by the Federal Institute for Materials Research and Testing (BAM, Germany) to incorporate gas-sensitive devices as payload. The sensors mounted on the micro-drone are listed in Table 1. The AR100-B (Figure 1C) is a highly maneuverable and compact platform. With a diameter of 1 m and a weight of approx. One kilogram, it supports up to 200 g of payload and its LiPo battery can provide a maximum flight time of about 20–30 min. The flight control relies on an on-board Inertial Measurement Unit (IMU) that comprises a three axis accelerometer and a three axis rotation rate sensor. The IMU is also used along with a GPS unit and a compass for localization purposes. Communication with the ground station is established through a 2.4-GHz RF link in which the data packets sent can include steering instructions or data coming from the payload and micro-drone sensors. Due to the restrictions imposed by the platform, the micro-drone doesn’t carry an anemometer. Instead, wind measurements are estimated by fusing the different on-board sensing modalities using the wind triangle approach explained later in Section 2.4. By using this wind sensing approach, it is possible to measure windflows in the range of 0–8 m/s.
2.2. Experimental Environments
A first set of three experiments was conducted in a 5-m × 5-m × 5-m × 2-m closed room shown in Figure 2A. Although no artificial airflow was induced, a weak circulating airflow field (0.01–0.03 m/s) was formed in the room by natural convection. Ethanol and 2-propanol vapors were used as detection targets, and were released from two tubes at a constant flow rate (0.2 l/min). In this set of experiments, the robot was programmed to move along a predefined spiral path that covered the whole experimental area. The robot was stopping at regular intervals for data collection. The reason for stopping the robot at each waypoint to collect wind measurements is due to the difficulty in compensating for the movement of the robot on the anemometer readings. At each measurement point, the sensor data were recorded for 30 s and the sensors were sampled at 4 Hz. A total of three experimental trials were conducted in this scenario.
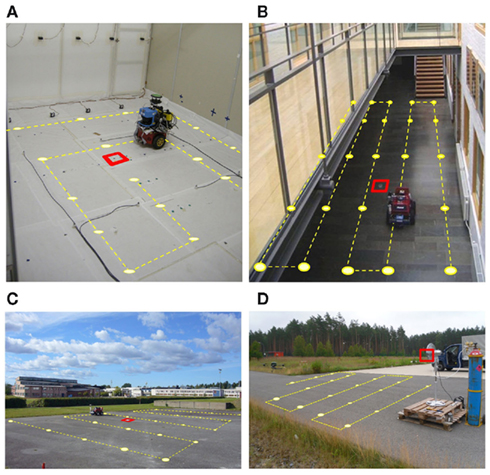
Figure 2. Experimental locations considered in this work. The dashed line displays the path followed by the robot and the dots indicate the points where the robot was stopping for collecting measurements. The squares denote the actual location of the gas sources. (A) Closed room (B) Orebro University corridor (C) Orebro University courtyard (D) BAM courtyard.
Once the experiments in the closed room have been completed, experiments in less controlled environments have been carried out. The second location chosen was a section of a long corridor with open ends and a high ceiling, shown in Figure 2B. The area covered by the trajectory of the robot was approximately 14 m × 2.0 m. There was more disturbance in this scenario caused by people passing by and the opening of doors and windows during the run of the experiment. The gas source was a cup full of ethanol placed on the floor in the middle of the investigated corridor segment. A total of five trials were carried out in this experimental configuration. Moreover, the outdoor scenario shown in Figure 2C was considered. Here, four experimental trials were carried out in an 8-m × 8-m region that is part of a much bigger open area. Again, the gas source was a cup of ethanol placed in the middle of this area. In these two experimental locations, the robot followed a predefined sweeping trajectory covering the area of interest, using a fixed starting point. Along its path, the robot stopped at predefined positions and carried out a sequence of measurements on the spot for 10 s (outdoors) and 30 s (for both indoor locations). The predefined sweeping motion was performed once in each directions and the robot was driven at a maximum speed of 0.05 m/s in between the stops. In these two scenarios the measurements were recorded at a frequency of 1 Hz.
A set of five additional trials were conducted in the outdoor environment shown in Figure 2D, with an electronic nose mounted on the micro-drone previously described in Section 2.1. A CH4 (99.5%-pure methane) gas cylinder was placed in a 14-m × 14-m area and at each trial, the valve of the cylinder was let open to release CH4 in the environment. In order to spread the analyte away from the cylinder, an AC fan was placed near the odor outlets. The air current introduced by the fan also prevented the CH4 to immediately rise up to the atmosphere when released. The micro-drone was programmed to explore the experimental area following a sweeping trajectory, starting from a remote location and moving at 1 m/s toward the gas cylinder. Data samples were acquired at a sampling frequency of 8 Hz and transmitted down to the ground stating using the micro-drone’s RF link. At each measuring position the micro-drone stopped to take gas concentration measurements for about 20 s.
2.3. Chemo Sensing
The metal-oxide (MOX) gas sensors are by far the most widely used in electronic nose applications as well as in mobile robotics olfaction. The most prominent reasons for this are that they are commercially available, have a relatively fast response and a higher sensitivity than most other sensing technologies. MOX gas sensors are conductometric sensors, that means that a change in the conductance of the oxide is measured when a gas interacts with the sensing surface. The logarithm of the change in resistance over a certain range is approximately linearly proportional to the logarithm of the concentration of the gas (Ihokura and Watson, 1994). There are two types of MOX sensors: n-type (SnO2, ZnO), which respond to reducing gases like H2, CH4, CO, C2H5, C2H5OH, (CH3)2CHOH, or H2S and p-type (NiO, CoO) which respond to oxidizing gases like O2, NO2, and Cl2 (Janata, 2009). The response of a MOX sensor results from chemosorption and redox reactions at the surface. Since the rate of such reactions is dependent on the temperature, it is clear that the temperature of the sensing surface considerably affects the sensor characteristics (Ihokura and Watson, 1994). Typical temperatures for the sensing surface of MOX sensors lie between 300 and 500°C. Selectivity is obtained either by doping the sensing surface with different additives or by setting different operating temperatures. It has also been demonstrated that introducing a dynamic operating temperature further enhances the selectivity of the sensor (Ihokura and Watson, 1994). In addition, Gas discrimination with MOX sensors on a mobile robot has been analyzed in Trincavelli et al. (2009) and Trincavelli (2011). Figure 3 shows a schematic of a MOX sensor. RH and Rs are respectively the heater and the sensor resistances, while RL is the load resistance that is applied in series to Rs in order to be able to read it. VH is the voltage applied to the heating resistance and it is proportional to the operating temperature, VC is the reference voltage for the measurement, while VL is the voltage drop on RL. In order to calculate the value of the sensor resistance (inverse of the sensor conductance – the quantity that changes when the sensor responds) the following formula is applied:

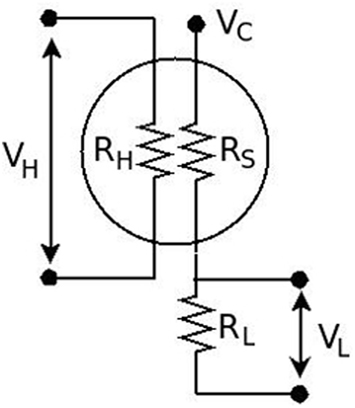
Figure 3. Electrical schema of a MOX gas sensor.
Another gas sensor that is gaining popularity in the mobile robotics olfaction community is the photo ionization detector (PID). A PID is an ion detector which uses high-energy photons, typically in the ultraviolet range (UV), to break gas molecules into positively charged ions. As a compound enters the PID it is ionized when it absorbs high-energy UV light. In commercial PID detectors the UV light is normally provided with a 10.6-eV UV lamp. The UV light excites the molecules, which temporarily lose an electron, and thus become positively charged ions. The ions produce an electric current, which is the signal output from the detector. According to the manufacturer of the PID used in our experiments (ppbRAE 3000: Portable VOC Monitor for ppb Measurement, Available at: http://www.raesystems.com/products/ppbrae-3000), the output signal is linearly proportional to the concentration of the chemical compound being analyzed. As a standalone detector PIDs are broad band detectors and are not selective, as these may ionize everything with an ionization energy less than or equal to the lamp output. Unlike MOX gas sensors, if the chemical compound is known, PIDs provide true concentration measurements. Moreover the response dynamics of PIDs is much quicker compared to the one of MOX sensors. Two of the main drawback of PID gas sensors compared to MOX gas sensors are the high price and the considerable weight (738 g for the ppbRAE that we use in our experiments), that makes them unsuitable for platforms with a limited payload. A viable solution, that we adopt for our indoor wheeled robot is to use both sensor modalities in order to try to combine the advantages of both while limiting the shortcomings.
2.4. Wind Sensing
Wind information can be of high importance for gas-sensitive robots. For example, the steering trajectories of anemotaxis plume tracking algorithms are based on wind measurements. Moreover, more accurate gas distribution models can be obtained by considering the advective influence of local airflow (Reggente and Lilienthal, 2009). Anemometers based on ultrasonic measurements are a convenient solution for robotics applications due to of their high resolution, wide measurement range and their relatively compact size compared to anemometers based on mechanical principles (e.g., windmill and cup anemometers).
The basic operational principle of an ultrasonic anemometer can be explained with the schematic shown in Figure 4A. Pairs of piezoelectric transmitters and transducers are placed at locations s1 and s2 separated by a distance L. The oscillator at s1 produces a sonic pulse that reaches the transducer at s2 in a time of flight t12 while a second pulse travels from s2 to s1 in t21. From Equation 2, the wind speed and direction can be estimated. When wind conditions are negligible, t12 ≈ t21 and therefore |u|≈0. If wind is blowing toward a location i, the sonic pulse emitted from a location j will travel faster than the pulse emitted from i and therefore tji < tji. The wind direction is then inferred from the sign of u. By placing additional orthogonal arrays of transducers/oscillators, 2-D and 3-D wind information can be acquired.
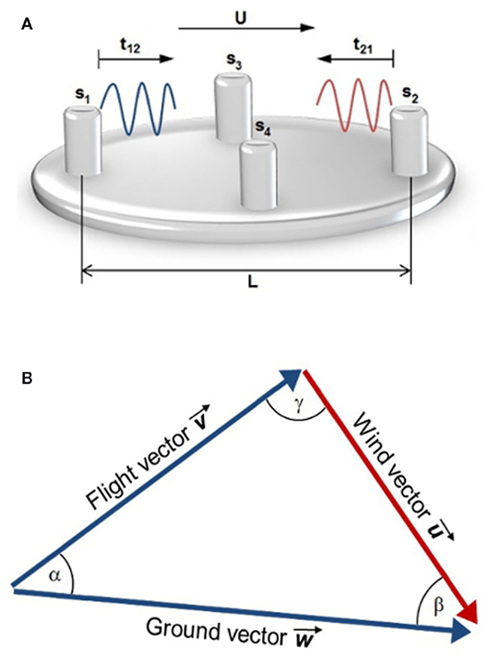
Figure 4. Schematic diagrams of the wind measurement principles considered in this work. (A) Ultrasonic measurement principle (B) wind triangle measurement principle.

While ultrasonic anemometers are a reliable means to acquire wind information, alternative approaches have been developed for platforms with particular restrictions. Specifically, the micro-drone described in Section 2.1 has a limited payload capacity which imposes weight and size constraints for on-board equipment and furthermore, the turbulence and vibrations caused by the micro-drone’s rotors can disrupt the anemometer readings.
By fusing different sensing modalities, it is nevertheless possible to estimate the wind information. Neumann et al. (2010) proposed a method that can be used by aerial robots to estimate the wind vector  . The authors used data coming from the embedded sensors of their micro-drone to compute the parameters of the wind triangle shown in Figure 4B. The ground vector
  and its direction wdir were directly obtained from the GPS readings while the flight vector
  was calculated using a reference function computed from a set of wind tunnel measurements. Additionally, the orientation information coming from the on-board compass was used to compute the flight direction vdir and finally, the wind vector
  and direction udir were computed from the wind triangle by applying the law of cosines.
3. Results
In this section, we analyze the data recorded with the three robotic platforms in the four experimental locations summarized in Table 2. We characterize the wind measurements to describe the environmental conditions that prevailed during the data collection in the four locations. In addition, we analyze the response dynamics in the frequency domain of a PID sensor and two MOX sensors that are commonly used in robotic olfaction. To conclude this section, we explore a non-biological approach to gas source localization.
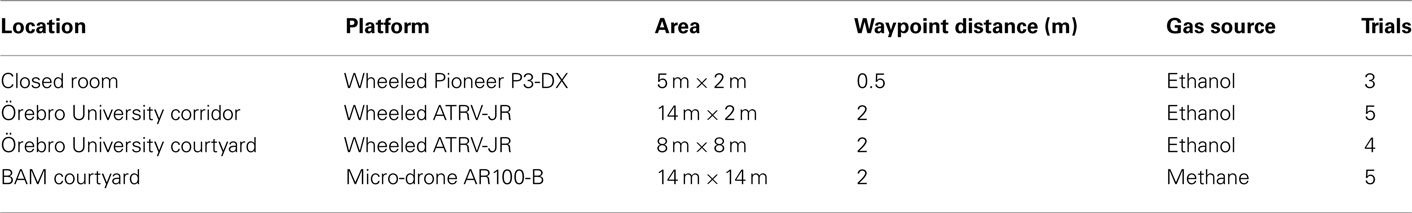
Table 2. Measurement configurations used in the four experimental locations considered in this work.
For each of the four experimental locations, we generated a typical airflow map using the data from one of the trials. At each waypoint where the robot was stopped, a mean wind vector was computed. The size of the exploration area and the distance between consecutive waypoints are listed in Table 2. Figures 5A–8A show the exploration trajectories and the computed airflow maps. The arrow’s length represents the average wind speed and the circular mean direction is represented by the arrow’s orientation. Although the explored areas are not of considerable size and the measurement points are spatially dense, regularity in the wind flow direction is hardly observed. This clearly indicates that the assumption of laminar air flow does not hold in any of the four environments. Large directional fluctuations were also observed between measurements taken at a single waypoint. Figures 5B–8B show polar plots, which were computed from a selected waypoint (denoted by red squares in the corresponding figures) on the robot’s trajectory. Each arrow in the plot is a measurement taken at the waypoint. The length is proportional to the wind speed and the arrow’s direction represents the wind angle. The polar wind measurement plots show an irregular distribution of the measured wind direction, which is certainly non-Gaussian. Accordingly, the circular mean direction (denoted by a dashed red line) is not a good indicator of the wind conditions present at the waypoint. The wind distribution is further characterized by wind speed histograms that can be seen in Figures 5C–8C. Again, uneven speed distributions were sensed even in the indoor experimental set-ups where one might expect less distinct fluctuations.
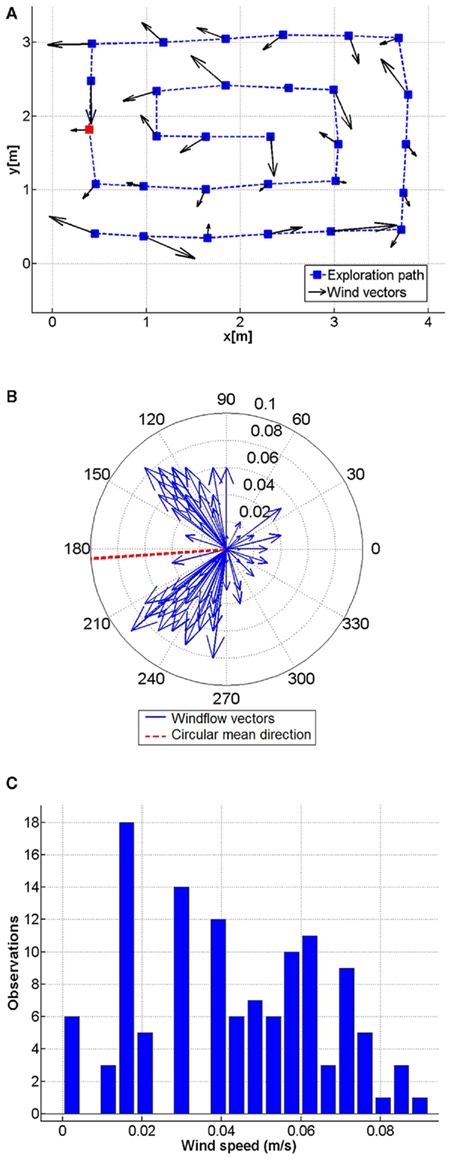
Figure 5. Wind measurements collected during one experimental trial, closed room set-up. (A) Airflow map. The squares denote the points where the robot stopped to collect measurements. The dashed line denotes the robot trajectory. (B) Polar plot of the measurements acquired at the waypoint denoted by a red square in the airflow map. (C) Wind speed histogram for the measurements acquired at the waypoint denoted by a red square in the airflow map.
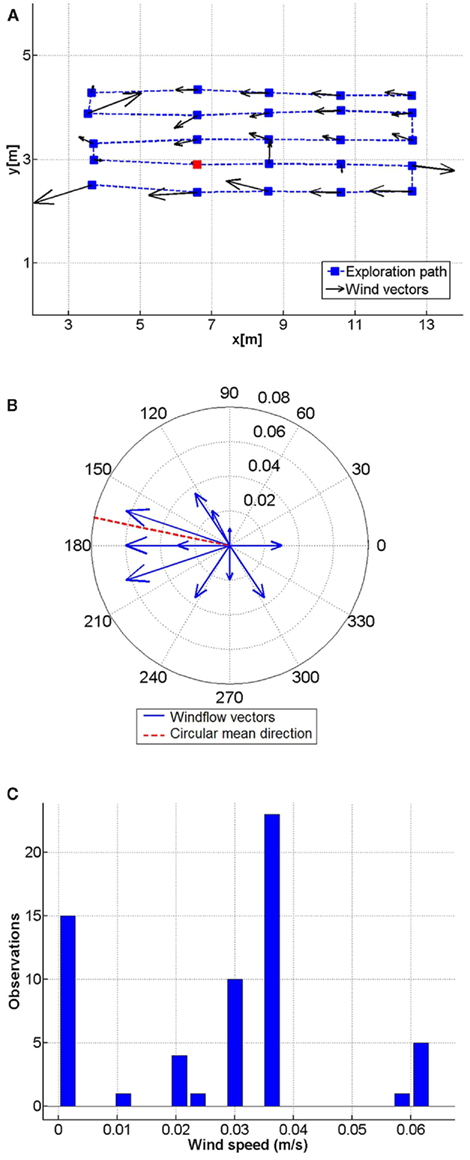
Figure 6. Wind measurements collected during one experimental trial, Örebro University corridor set-up. (A) Airflow map. The squares denote the points where the robot stopped to collect measurements. The dashed line denotes the robot trajectory. (B) Polar plot of the measurements acquired at the waypoint denoted by a red square in the airflow map. (C) Wind speed histogram for the measurements acquired at the waypoint denoted by a red square in the airflow map.
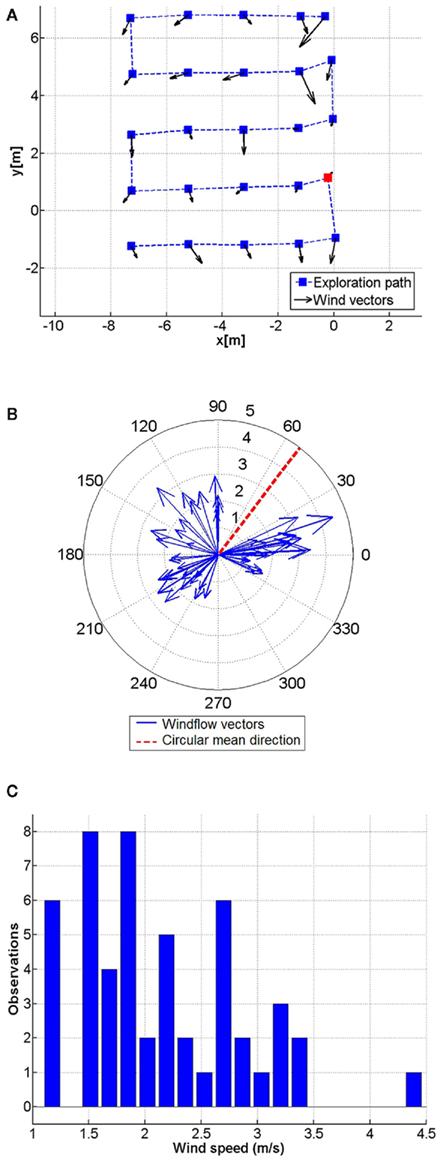
Figure 7. Wind measurements collected during one experimental trial, Örebro University courtyard set-up. (A) Airflow map. The squares denote the points where the robot stopped to collect measurements. The dashed line denotes the robot trajectory. (B) Polar plot of the measurements acquired at the waypoint denoted by a red square in the airflow map. (C) Wind speed histogram for the measurements acquired at the waypoint denoted by a red square in the airflow map.
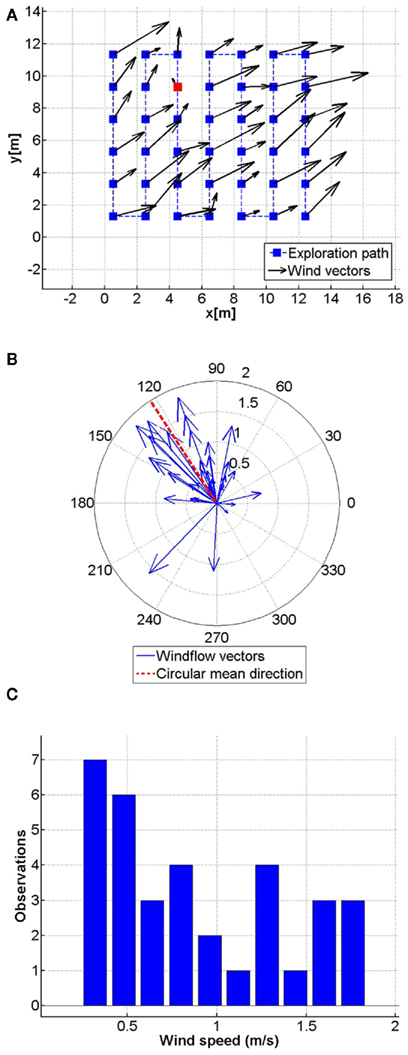
Figure 8. Wind measurements collected during one experimental trial, BAM courtyard set-up. (A) Airflow map. The squares denote the points where the robot stopped to collect measurements. The dashed line denotes the robot trajectory. (B) Polar plot of the measurements acquired at the waypoint denoted by a red square in the airflow map. (C) Wind speed histogram for the measurements acquired at the waypoint denoted by a red square in the airflow map.
Figure 9A displays an example of the response of the chemosensors employed in our experiments, namely a MOX gas sensors and a PID. The response of the PID is linear with respect to the chemical compound concentration and the rise and decay time constants of this sensor are symmetric and much smaller than of the MOX sensors. The PID response thus provides a good reference of the concentration the MOX gas sensor was exposed to. The plot in Figure 9A shows the non-linearity in the response of the MOX gas sensor, and most importantly, the slow dynamics of the MOX gas sensor. The asymmetric low-pass filtering performed by the MOX sensor is evident, especially during the long recovery of the MOX sensors. The spectra of the measurements collected with the MOX sensors and the PID are plotted in Figure 9B. As expected the frequency content of the signal collected with MOX sensors is much smaller than the one of a signal collected with the PID.
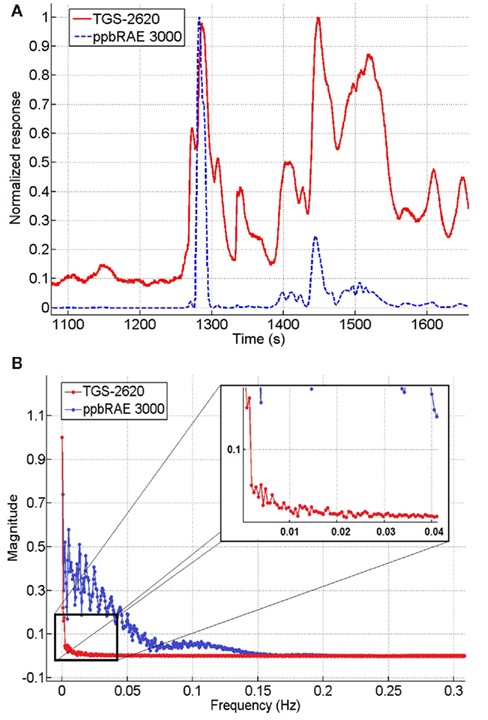
Figure 9. Responses in time domain and frequency domain of a TGS2620 and a PID ppbRAE 3000. The responses were recorded with the robot stopped at a fixed position in the Closed room experimental set-up. (A) Time domain responses of the TGS2620 and the PID (ppbRAE 3000) normalized to be between 0 and 1. (B) Frequency spectra computed from the response of the TGS2620 and the ppbRAE 3000 in the Closed room experimental set-up.
It has been previously reported that statistical moments can be used as indicators of gas source proximity (Lilienthal and Duckett, 2004). More specifically, the variance of a set of gas concentration measurements has been suggested as a feature that can identify the location of a source of gas (Lilienthal et al., 2006a). From the collected sensor measurements, we explored the feasibility of inferring the location of a gaseous source through the use of a gas distribution model generated by the Kernel DM + V algorithm proposed by Lilienthal et al. (2009). This algorithm is a non-parametric estimation approach that neither makes strong assumptions about the particular form of the modeled gas distribution, nor relies on expensive fluid dynamics computations to generate the model. Instead, Kernel DM + V takes a set of spatially located measurements and computes a discretized grid model where, for each cell k, a confidence value as well as distribution mean and predictive variance are computed. The model is computed by extrapolating from neighboring measurements weighted by a Gaussian function 𝒩 of width σ. Thus, the parameters that regulate the Kernel DM + V algorithm are kernel width σ and cell size c. Furthermore, the authors proposed a method to learn the parameters of the algorithm from the measurements by minimizing the average negative log predictive density (NLPD), which is a standard criterion to evaluate distribution models.
For each experimental location, a single sensor was selected according to its sensitivity to generate a gas distribution model. For the three experiments were ethanol was used as the target source, the TGS2620 was selected, while the TGS2611 was used for the experiment conducted with a methane source. The maps were generated using the sensor conductance values recorded while the robot was following the exploration path. The obtained mean and variance maps are shown in Figure 10. The learned parameters σ and c are listed in Table 3. In order to estimate the gas source locations, we used the variance maps as indicators of the source proximity. It can be noticed that the cells adjacent to the actual source location have a higher variance value, which is represented by brighter color shades in the figures.
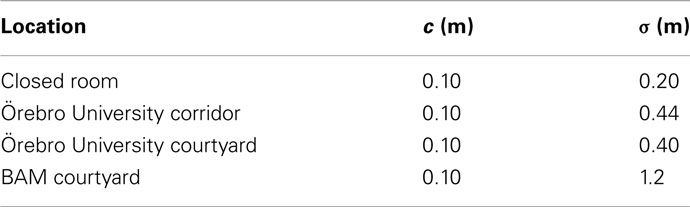
Table 3. Kernel DM + V learned parameters used in the four test locations. c Stands for grid cell size and σ is the kernel width.
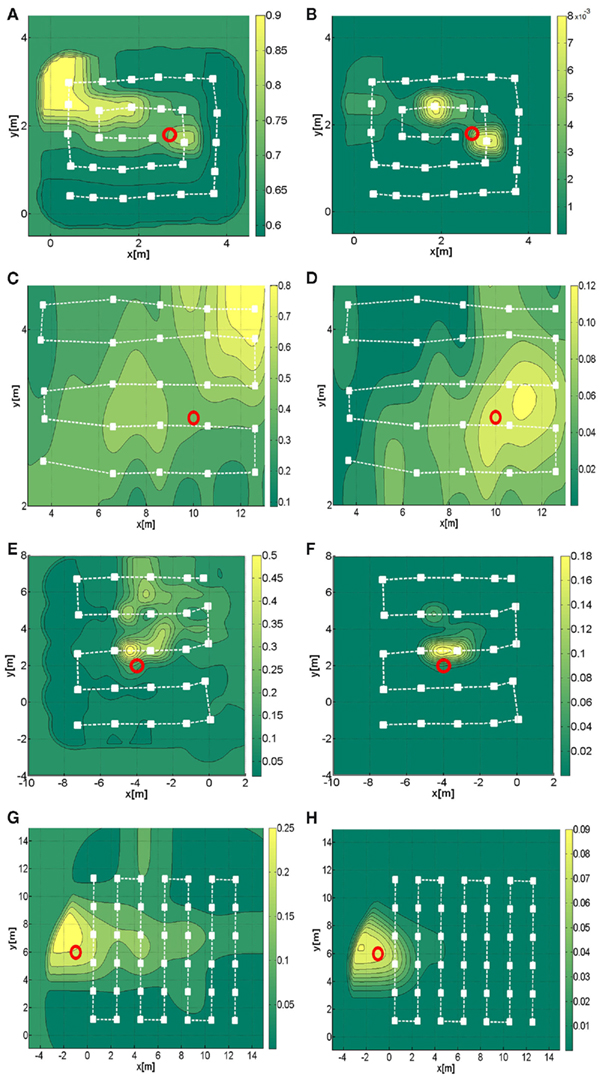
Figure 10. Predictive variance and mean distribution maps obtained with the Kernel DM + V algorithm in the four experimental locations considered in this work. The dashed lines represent the exploration path followed by the robot and the red circle represents the actual gas source location. (A) Mean distribution map, closed room. (B) Variance distribution map, closed room. (C) Mean distribution map, OU corridor. (D) Variance distribution map, OU corridor. (E) Mean distribution map, OU courtyard (F) Variance distribution map, OU courtyard. (G) Mean distribution map, BAM courtyard. (H) Variance distribution map, BAM courtyard.
4 Discussion
Probably one of the most crucial aspects of research in mobile robot olfaction is the design of the experiments that enable to study and develop systems for airborne chemical monitoring. A major technical difficulty is that the dispersion of chemicals in natural environments is difficult to observe since most chemicals produce an invisible plume. In a non-artificial environment, the plume evolution is also difficult to predict a priori due to the chaotic dispersal of gas. A second major difficulty is that environmental conditions are often very variable and therefore experiments are hard to repeat. Thus it is difficult to obtain ground truth that can be used to validate experimental results. In order to overcome this limitation, experiments are often carried out under controlled conditions that limit variations from the expected ground truth plume behavior and thus increase repeatability of the experiments. On the other hand, it is hard to predict how the results obtained in such experiments extend to uncontrolled environments. It is very important in the mobile robot olfaction domain that great care is used in describing the experimental set-up in which the claimed results are obtained, and it should be avoided to state that results obtained in an environment with, e.g., steady and controlled airflow trivially extend to more general and complex environments.
In this paper we showed results obtained in four experimental scenarios ranging from a closed room to outdoor areas. In the presented experiments different experimental platforms have been used in order to try to minimize the effect of the choice of a specific robotic system on the presented results. Moreover, the different platforms posed different constraints to the sensors that could be mounted. Given the observed irregularity of the airflow, it is hard to imagine that strategies like casting, surge-spiral, and surge-cast, that try to mimic insect behavior that is adaptive to the up-stream direction, can work reliably. While these strategies have obtained excellent results in a laminar airflow setting, the extension to a turbulent environment is not clear (Lochmatter and Martinoli, 2009). In an attempt to identify possible reasons why the clearly successful reactive tracking behavior of animals cannot be mimicked by current mobile robots, we make two observations: the chemosensing mechanisms currently available are much slower than the biological receptors and mobile robots do not have the same maneuvering capabilities of animals.
According to Justus et al. (2005) the filtering applied by moth antennae is a linear, noise-free representation of odorant concentration in the range of 1–10 Hz, while the gain is reduced for frequencies below 1 Hz. It is argued that the most likely cause for this effect is the adaptation of the receptor cells, a common feature of biological sensory receptors that is most often seen as a slowing or cessation of response to a constant stimulus. According to the data we collected in the four different scenarios mentioned in this paper the bandwidth of the signal collected with MOX gas sensors contains frequencies in the range of 0–0.04 Hz while the signal collected with a PID contains frequencies between 0 and 0.015 Hz. It is striking that currently available chemical sensors stop filtering out the signal in the bandwidth that insects actually can perceive and use for tracking an odor plume. On the other hand, chemical sensors capture the signal in a bandwidth that insects filter out through the adaptation process. Therefore, the perception of the chemical stimulus is totally different for insects compared to state-of-the-art gas-sensitive robots.
Regarding the maneuvering capabilities of animals we consider the moth as an example that has been a predominant source of inspiration for the construction of gas source tracking with mobile robots. According to Kuenen and Cardé (1993) moths fly at a speed of roughly 0.5 m/s and with an average turning rate of roughly 3.5 turns/s. Gas-sensitive mobile robots were instead typically operated at speeds between 0.05–0.1 m/s and can perform much less than 1 turn/s. The limitation in linear speed is mostly to avoid spatial averaging over large areas, which occurs because the gas sensors act as a low-pass filter. (Note, however, that spatial averaging might even help to better localize a gas source in a corridor environment; Lilienthal et al., 2001.) On the other hand, the angular speed is mainly limited by the actuation principles. Based on these differences it seems possible that current gas-sensitive mobile robots are just too slow to perform insect-like reactive steering strategies that allow successful plume tracking in a highly dynamic environment with turbulent airflow.
To conclude, the design of gas-sensitive mobile robots should take into account the limitations of the sensors and robotic platforms currently available. This does not imply that the design of olfactory mobile robots can not be biologically inspired but that mobile robots should not try to directly replicate the movements of insects without a deep understanding how the underlying principles depend on the sensing and actuation capabilities of animals. Instead of mimicking “zigzagging” and “casting” paths, for example, the underlying principles, e.g., the importance of mechanisms to recover from situations in which the animal or robot looses contact with the plume, should be applied when developing gas source tracking approaches. A very interesting example in this regard is the infotaxis algorithm which minimizes an entropy function but is nevertheless observed to produce “zigzagging” and “casting” paths similar to those observed in the flight of moths and other animals. Here the underlying principle is probably that the information gain is highest close to the boundary of the plume and this principle could also be used in approaches that do not attempt to zigzag toward a gas source.
In addition to non-biological algorithms that take inspiration from the successful principles reflected in animal behavior, the mobile robot olfaction community should also consider emerging gas sensing technologies like methane laser sensors or infrared cameras that can provide valuable inputs for locations that are meters away from the actual position of the robot.
Conflict of Interest Statement
The authors declare that the research was conducted in the absence of any commercial or financial relationships that could be construed as a potential conflict of interest.
References
Bogner, J., Ahmed, M. A., Diaz, C., Faaij, A., Gao, Q., Hashimoto, S., Mareckova, K., Pipatti, R., and Zhang, T. (2007). Climate Change 2007: Mitigation. Contribution of Working Group III to the Fourth Assessment Report of the Intergovernmental Panel on Climate Change. Cambridge: Cambridge University Press.
Cardé, R., and Willis, M. (2008). Navigational strategies used by insects to find distant, wind-borne sources of odor. J. Chem. Ecol. 34, 854–866.
Cleland, T. A., and Linster, C. (2005). Computation in the olfactory system. Chem. Senses 30, 801–813.
Gerkey, B., Vaughan, R. T., and Howard, A. (2003). “The player/stage project: tools for multi-robot and distributed sensor systems,” in Proceedings of the IEEE International Conference on Advanced Robotics (ICAR), Coimbra, 317–323.
Grasso, F. W., Basil, J. A., and Atema, J. (1998). “Toward the convergence: robot and lobster perspectives of tracking odors to their source in the turbulent marine environment,” in Intelligent Control (ISIC), 1998. Held Jointly with IEEE International Symposium on Computational Intelligence in Robotics and Automation (CIRA), Intelligent Systems and Semiotics (ISAS), Proceedings, Gaithersburg, 259–264.
Ishida, H., Nakamoto, T., Moriizumi, T., Kikas, T., and Janata, J. (2001). Plume-tracking robots: a new application of chemical sensors. Biol. Bull. 200, 222–226.
Justus, K. A., Cardé, R. T., and French, A. S. (2005). Dynamic properties of antennal responses to pheromone in two moth species. J. Neurophysiol. 93, 2233–2239.
Kowadlo, G., and Russell, R. A. (2008). Robot odor localization: a taxonomy and survey. Int. J. Rob. Res. 27, 869–894.
Kuenen, L. P. S., and Cardé, R. T. (1993). Effects of moth size on velocity and steering during upwind flight toward a sex pheromone source by Lymantria dispar; (lepidoptera lymantriidae). J. Insect Behav. 6, 177–193.
Kuwana, Y., Nagasawa, S., Shimoyama, I., and Kanzaki, R. (1999). Synthesis of the pheromone-oriented behaviour of silkworm moths by a mobile robot with moth antennae as pheromone sensors. Biosens. Bioelectron. 14, 195–202.
Lilienthal, A. J., and Duckett, T. (2003). “Experimental analysis of smelling braitenberg vehicles,” in Proceedings of the IEEE International Conference on Advanced Robotics, Coimbra, 375–380.
Lilienthal, A. J., and Duckett, T. (2004). Building gas concentration gridmaps with a mobile robot. Robot. Auton. Syst. 47, 3–16.
Lilienthal, A. J., Duckett, T., Werner, F., and Ishida, H. (2006a). “Indicators of gas source proximity using metal oxide sensors in a turbulent environment,” in Proceedings of the IEEE/RAS-EMBS International Conference on Biomedical Robotics and Biomechatronics (Biorob), Pisa.
Lilienthal, A. J., Loutfi, A., and Duckett, T. (2006b). Airborne chemical sensing with mobile robots. Sensors 6, 1616–1678.
Lilienthal, A. J., Reggente, M., Trincavelli, M., Blanco, J. L., and Gonzalez, J. (2009). “A statistical approach to gas distribution modelling with mobile robots – the kernel dm+v algorithm,” in Proceedings of the IEEE/RSJ International Conference on Intelligent Robots and Systems (IROS), St. Louis.
Lilienthal, A. J., Reiman, D., and Zell, A. (2003). “Gas source tracing with a mobile robot using an adapted moth strategy,” in Proceedings of the Autonome Mobile Systeme 18. Fachgespräch (Karlsruhe: GDI), 150–160.
Lilienthal, A. J., Wandel, M. R., Weimar, U., and Zell, A. (2001). “Sensing odour sources in indoor environments without a constant airflow by a mobile robot,” in Proceedings of the IEEE International Conference on Robotics and Automation (ICRA), Seoul.
Lochmatter, T. (2010). Bio-Inspired and Probabilistic Algorithms for Distributed Odor Source Localization Using Mobile Robots. Ph.D. thesis, Lausanne.
Lochmatter, T., and Martinoli, A. (2009). “Tracking odor plumes in a laminar wind field with bio-inspired algorithms,” in 11th International Symposium on Experimental Robotics 2008 (ISER 2008), Vol. 54 (Athens: Springer), 473–482.
Moraud, E. M., and Martinez, D. (2010). Effectiveness and robustness of robot infotaxis for searching in dilute conditions. Front. Neurorobotics 4:1. doi:10.3389/fnbot.2010.00001
Neumann, P., Asadi, S., Lilienthal, A. J., Bartholmai M., and Schiller J. H. (2012). Micro-drone for wind vector estimation and gas distribution mapping. IEEE Robot. Autom. Mag. (to appear).
Neumann, P., Bartholmai, M., Schiller, J. H., Manolov, M., and Wiggerich, B. (2010). “Self optimizing search and characterization of gaseous hazardous substance sources using a micro-drone: a new approach to determine wind speed and direction,” in IEEE International Workshop on Robotic and Sensors Environments (ROSE), Phoenix.
Pyk, P., Badia, S. B. I., Bernardet, U., Knüsel, P., Carlsson, M., Gu, J., Chanie, E., Hansson, B., Pearce, T., and Verschure, P. J. (2006). An artificial moth: chemical source localization using a robot based neuronal model of moth optomotor anemotactic search. Auton. Robots 20, 197–213.
Reggente, M., and Lilienthal, A. J. (2009). “Using local wind information for gas distribution mapping in outdoor environments with a mobile robot,” in Sensors, 2009 IEEE, Christchurch, 1715–1720.
Roberts, P., and Webster, D. (2002). Turbulent Diffusion. Environmental Fluid Mechanics Theories and Application. Reston, VA: ASCE Press.
Russell, R. A., Bab-Hadiashar, A., Shepherd, R. L., and Wallace, G. (2003). A comparison of reactive robot chemotaxis algorithms. Rob. Auton. Syst. 45, 83–97.
Scharff, H. (2008). Achieving Adequate Control of Landfill Gas in Europe. Waste Management World. Available at: http://www.waste-management-world.com
Trincavelli, M., Coradeschi, S., and Loutfi A. (2009). Odour classification system for continuous monitoring applications. Sens. Actuat. B Chem. 139, 265–273.
Keywords: mobile robotics, mobile robot olfaction, landfill surveillance, biologically inspired robots
Citation: Hernandez Bennetts V, Lilienthal AJ, Neumann PP and Trincavelli M (2012) Mobile robots for localizing gas emission sources on landfill sites: is bio-inspiration the way to go? Front. Neuroeng. 4:20. doi: 10.3389/fneng.2011.00020
Received: 05 October 2011;
Paper pending published: 07 November 2011;
Accepted: 17 December 2011;
Published online: 12 January 2012.
Edited by:
Ramon Huerta, University of California San Diego, USAReviewed by:
Sandro Carrara, Ecole Polytechnique Fédérale de Lausanne, SwitzerlandFrancisco B. Rodriguez, Universidad Autonoma de Madrid, Spain
Copyright: © 2012 Hernandez Bennetts, Lilienthal, Neumann and Trincavelli. This is an open-access article distributed under the terms of the Creative Commons Attribution Non Commercial License, which permits non-commercial use, distribution, and reproduction in other forums, provided the original authors and source are credited.
*Correspondence: Marco Trincavelli, Center for Applied Autonomous Sensor Systems, School of Science and Technology, Örebro University, Örebro SE-70182, Sweden. e-mail: marco.trincavelli@oru.se