 Juan Luis Méndez-Gómez1
 Marie-Bénédicte Rougier1,2
 Laury Tellouck1,2
 Jean-François Korobelnik1,2Cédric Schweitzer1,2Marie-Noëlle Delyfer1,2
 Hélène Amieva1Jean-François Dartigues1,3Cécile Delcourt1
 Catherine Helmer1*
- 1University Bordeaux, INSERM, Bordeaux Population Health Research Center, Team LEHA, UMR 1219, Bordeaux, France
- 2University Hospital, Ophthalmology, Bordeaux, France
- 3University Hospital, Memory Consultation, CMRR, Bordeaux, France
Retinal nerve fiber layer (RNFL) thickness is reduced in Alzheimer’s patients. However, whether it is associated with early evolution of cognitive function is unknown. Within 427 participants from the Three-City-Alienor longitudinal population-based cohort, we explored the relationship between peripapillary RNFL thicknesses and the evolution of cognitive performance. RNFL was assessed at baseline by spectral domain optical coherence tomography; cognitive performances were assessed at baseline and at 2 years, with the Mini–Mental State Examination, the Isaacs’ set test, and the Free and Cued Selective Reminding Test (FCSRT). Multivariate linear mixed models were performed. The RNFL was not associated with initial cognitive performance. Nevertheless, a thicker RNFL was significantly associated with a better cognitive evolution over time in the free delayed recall (p = 0.0037) and free + cued delayed recall (p = 0.0043) scores of the FCSRT, particularly in the temporal, superotemporal, and inferotemporal segments. No associations were found with other cognitive tests. The RNFL was associated with changes in scores that assess episodic memory. RNFL thickness could reflect a higher risk of developing cognitive impairment over time.
Introduction
Alzheimer’s disease (AD) is associated with brain neurodegeneration, particularly in the medial temporal area, which leads to cognitive decline and dementia. These lesions occur several years before the clinical phase of dementia (1, 2). Detection of this neurodegenerative process at an early stage could allow prediction of cognitive decline in subsequent years.
The retina and brain are intimately linked as a result of common embryonic origin. The eye is a sensory organ that is truly part of the central nervous system, with neuronal cells that could be susceptible to degeneration, directly or indirectly. Thus, the condition of nerve fibers in the eye could reflect the condition of nerve fibers in the brain (3). Spectral domain optical coherence tomography (SD-OCT) allows easy and accurate evaluation of the peripapillary retinal nerve fiber layer (RNFL), by measuring the thickness of this layer containing ganglion cell axons in a circle around the optic nerve. This RNFL could thus enable evaluation of neurodegeneration in mild cognitive impairment (MCI) and AD pathology (4).
Abnormality in RNFL thickness has been described in several neurodegenerative conditions, in particular multiple sclerosis, AD, and Parkinson’s disease (5–7). Regarding MCI and/or AD, several previous studies have demonstrated reduced RNFL thickness compared to that of a healthy control population, initially in histological studies (8) and then in OCT studies (4, 9, 10); these studies were, however, mostly cross-sectional case–control studies. Additionally, we previously found an association between glaucoma pathology, which has reduced RNFL thickness, and the occurrence of dementia 3 years later (11). However, except for one study with a small sample (12), the association between RNFL and the evolution of cognitive function has not yet been studied in a general elderly population.
Our study aims to explore the relationship between peripapillary RNFL thickness measured by SD-OCT and the evolution of cognitive function in several cognitive domains measured over a 2-year period in the elderly population.
Materials and Methods
Study Population
The Three-City (3C) study is a prospective population-based cohort, which aims to estimate the risk of dementia and cognitive impairment attributable to vascular factors. At baseline (1999–2001), 9,294 community-dwelling French adults aged ≥65 years in three French cities (Bordeaux, Dijon, Montpellier) were enrolled, including 2,104 from Bordeaux. The methodology has been described elsewhere (13). Data regarding sociodemographic characteristics, lifestyle, physical and mental health, medications, disability, and cognitive functions were assessed at baseline and subsequently 2, 4, 7, 10, and 12 years later. At the 7-year follow-up (in 2006–2008), 963 participants from Bordeaux agreed to participate to the Alienor study (Antioxydants, Lipides Essentiels, Nutrition et maladies OculaiRes), consisting of an ophthalmological examination (14). These participants were then followed-up every two years with eye examinations concurrent with cognitive evaluations. In 2009–2010, a SD-OCT examination of the optic nerve was included in the eye examination; 624 participants were evaluated. Our population consists of participants with (i) valid RNFL measurements at that time, i.e., without any segmentation problem and without ocular pathology that could influence RNFL measurement (vitreomacular traction, myelinated retinal nerve fibers, peripapillary choroidal neovascularization, or myopic chorioretinopathy), (ii) concurrent cognitive evaluations, (iii) without prevalent dementia in 2009–2010, and (iv) without missing data for confounders. Because glaucoma is a degenerative disease of the optic nerve that could have common pathophysiological mechanisms with AD, participants with this disease were retained in the study population, and glaucoma was included as a covariate in the analyses (11). Finally, participants without cognitive evaluation at 2 years were excluded, with thus 427 participants considered for the present study (Figure 1).
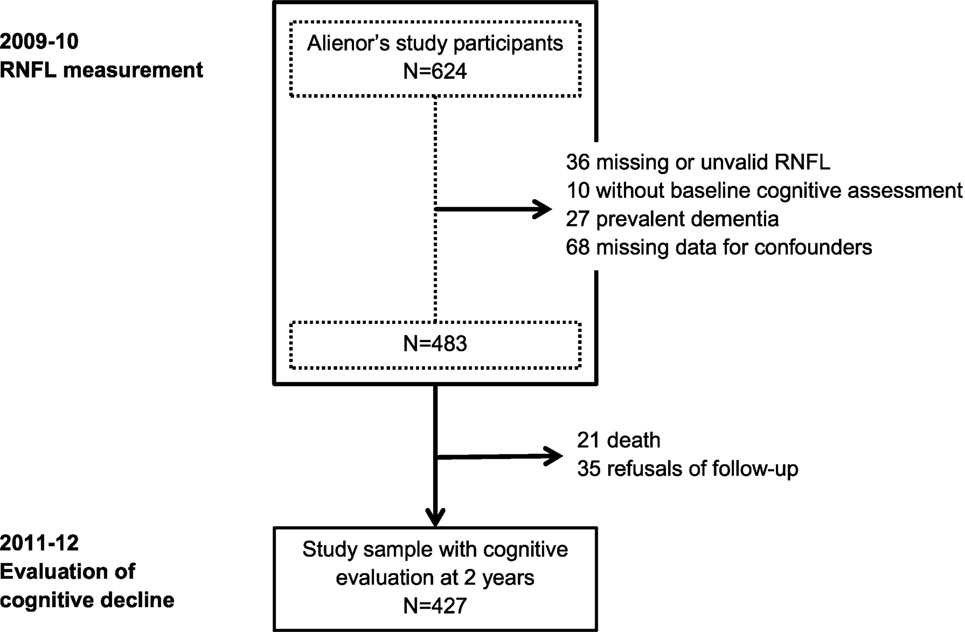
Figure 1. Flow chart of the population. RNFL, retinal nerve fiber layer.
Approvals were obtained from the Ethical Committee Sud-Ouest et Outre-Mer III for the Alienor study and from the Ethical Committee of the University Hospital of Kremlin-Bicêtre and Sud-Mediterranée III for the 3C study. All participants signed an informed consent.
Cognitive Assessment
At each follow-up visit, trained psychologists assessed the cognitive function of each participant during face-to-face visits using the Mini–Mental State Examination (MMSE) (15), the Isaacs’ set test at 30 s (16) and the Free and Cued Selective Reminding Test (FCSRT) (17). After the neuropsychological examination, participants suspected of having dementia were visited by a neurologist or a geriatric specialist, to confirm the diagnosis. Finally, an independent committee of neurologists reviewed all potential cases of dementia with all available information in order to obtain a consensus on the diagnosis, according to the DSM-IV criteria for dementia (18). For this study, we analyzed RNFL measurement in relation to cognitive performance assessed at the same baseline time as RNFL and 2 years later.
The MMSE is a composite scale from 0 to 30 points that evaluates the global cognitive state. The Isaacs’ set test evaluates categorical verbal fluency by measuring the ability to generate word lists from four semantic categories (animals, fruits, colors, and cities) in 30 s. Finally, the FCSRT evaluates episodic memory using a list of 16 words belonging to 16 semantic categories. This test assesses episodic memory processes by controlling the encoding and retrieval conditions. It starts with an initial phase of categorical semantic learning, followed by three notation steps (immediate recall, three free/cued recalls, and delayed free/cued recalls). We used four variables in our study: the three free recalls score, the added score of three free plus cued recalls, the delayed free recalls, and finally the added score of delayed free plus cued recalls. Other details of the procedure have been previously described (19). None of the staff involved in cognitive testing had access to ophthalmologic data.
Ophthalmologic Assessments
SD-OCT Measures
The OCT examination was performed using SPECTRALIS (Software Version 5.4.7.0; Heidelberg Engineering, Heidelberg, Germany) without pupil dilation by one experienced technician. The device acquisition rate of OCT images was 40,000 A-scans/s. The OCT provides an automatic real-time (ART) function that adjusts for eye movement and increases image quality. Details of our OCT measures have been previously described (20). The peripapillary RNFL thickness was acquired using the following conditions (14): resolution mode: high speed; circle diameter: 3.5 mm; size X: 768 pixels (10.9 mm); size Z: 496 pixels (1.9 mm); scaling X: 14.14 lm/pixel; scaling Z: 3.87 lm/pixel; and ART mode: 16 images. The minimum reliable value of global RNFL thickness was retained for analysis when the measure was present in both eyes; otherwise, data from the eye with the only reliable value were retained. RNFL thicknesses in the six segments measured by the device (superotemporal, temporal, inferotemporal, inferonasal, nasal, and superonasal) were retained for the same eye (Figure 2).
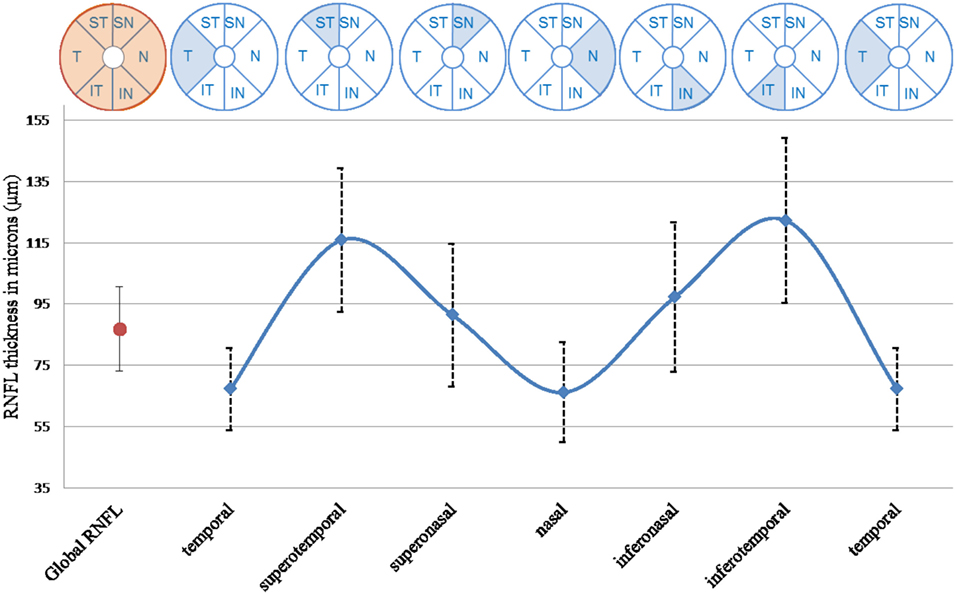
Figure 2. Global and six segments thicknesses of RNFL, n = 427. T, temporal segment; ST, superotemporal segment; SN, superonasal segment; N, nasal segment; IN, inferonasal segment; IT, inferotemporal segment.
Other Ophthalmologic Variables
As previously described (14), the diagnosis of glaucoma was established according to the classification proposed by Foster et al. (21). Cataract surgery was assessed during eye examination. Optic disc size (vertical disc diameter) was measured using optic disc photography in duplicate by two trained graders and by a glaucoma specialist if there was inconsistency between the first two interpretations. Finally, axial length was measured during a subsequent visit in a subsample of participants using non-contact partial coherence laser interferometry (IOL Master; Carl Zeiss Meditec AG, Jena, Germany). Five measurements were taken per eye, and the mean was calculated. None of the staff involved in eye examination had access to the cognitive data.
Other Variables
The following covariates were assessed: age, sex, education level (elementary school, secondary school vs higher level), the presence of Apolipoprotein ε4 allele and diabetes (antidiabetic treatment and/or a fasting glucose level ≥7 mmol/L or a non-fasting glucose level ≥11 mmol/L).
Data Analysis
Baseline characteristics of the study sample were first described. To study the relationship between the RNFL thickness and the cognitive scores at baseline and cognitive change over time we built linear mixed models to account for the correlations due to repeated cognitive measures (22). We first analyzed the relationship between global RNFL thickness (continuous variable) and each cognitive test to avoid multiplicity of statistical analyses. We further analyzed all six RNFL segments only when the result was significant for global RNFL. Due to ceiling and floor effects and curvilinearity (unequal interval scaling) for MMSE and FCSRT scores, we used a previously published procedure that corrects the metrological properties to normalize the score distributions (23). First, models were adjusted for age, sex, time, education level, ApoE4, diabetes, cataract surgery, optic disc size, and glaucoma in multivariable linear mixed models (Model A). The interaction between each variable and time was systematically tested and retained in the model when p < 0.10. Next, given the knowledge that RNFL thickness decreases with increasing axial length (24), a second model (Model B) was built including axial length as a covariate; this measure was available for only a subset (n = 204) of the study population. Sensitivity analyses excluding participants with glaucoma were performed. In complementary analyses, we re-ran the analyses for global RNFL considering RNFL as a binary variable, according to the classification provided by the Spectralis software: outside normal limits (lowest 1% of the distribution), borderline (bottom 1–5% of the distribution), and within normal (above 5%) based on the age-matched comparison with an internal normative database of 201 healthy eyes of Caucasian patients. Thus, we analyzed the evolution of cognitive performance for participants with borderline value or value outside normal limits, compared to value within normal.
The normalization procedure of cognitive scores was performed using R software (version 2.14.1, 2011© The R Foundation for Statistical Computing). All other statistical procedures were performed using SAS software (version 9.3, SAS Institute Inc., Cary, NC, USA).
Results
Population characteristics of the 427 participants are described in Table 1. The mean age was 81.6 (SD: 4.2) years and 62.3% were women. The mean global RNFL thickness was 86.8 μm (SD: 13.7). As expected, the inferotemporal (122.3 μm) and superotemporal (115.9 μm) segments were thickest. Mean MMSE score at baseline was 27.8 (SD: 1.9). Cognitive performance significantly declined over the 2-year follow-up, irrespective of the test considered (Table S1 in Supplementary Material).
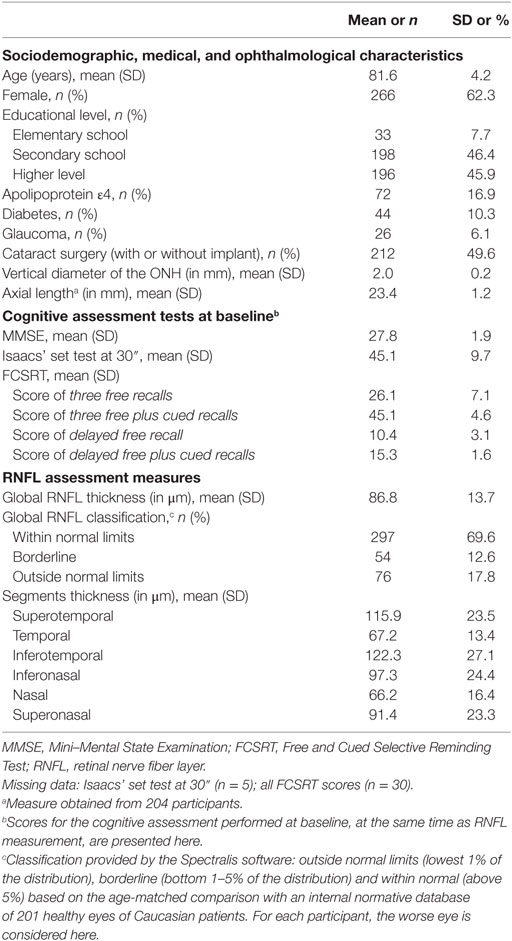
Table 1. Characteristics of the study population at inclusion, N = 427.
The global RNFL was not associated with initial cognitive performance regardless of cognitive test considered (Table 2). Global RNFL was not associated with cognitive evolution based on the MMSE or the Isaacs’ set test at follow-up (RNFL × time term). However, global RNFL was associated with the two FCSRT scores of delayed recall. Specifically, a thicker global RNFL was associated with a lower decline of delayed free recall (β = 0.015; 95% CI, 0.005 to 0.025; p = 0.004 for 1 μm RNFL thickness) and delayed free plus cued recalls (β = 0.007; 95% CI, 0.002 to 0.011; p = 0.004) (Table 2, model A).
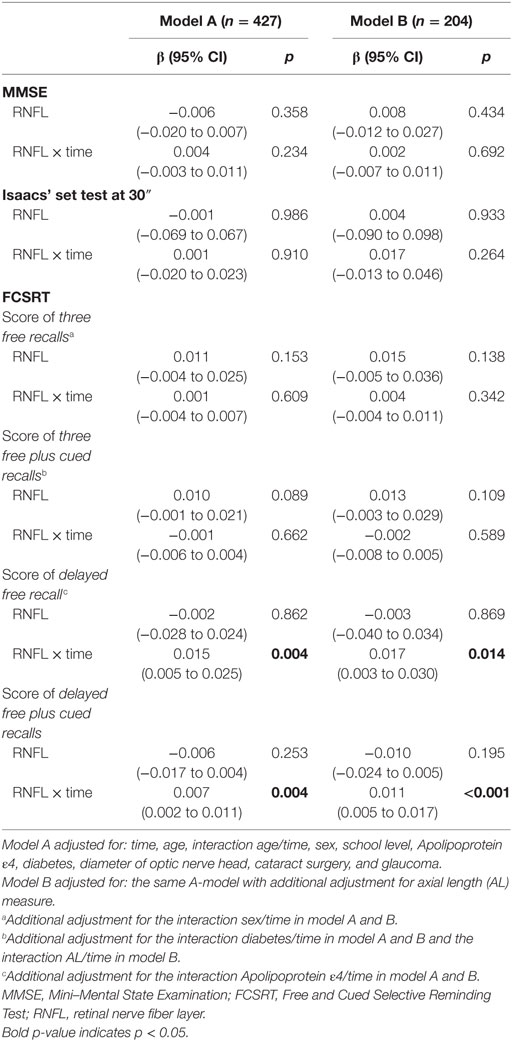
Table 2. Initial differences and evolution over time of the neuropsychological tests according to the global thickness of the RNFL.
These associations remained unchanged after additional adjustment for axial length in the subset which had this measure (Table 2, model B). Mean delayed FCSRT scores, at baseline and at the follow-up, are graphically represented in Figure S1 in Supplementary Material according to baseline RNFL value.
For FCSRT scores showing significant association with global RNFL, the relationships with each of the six RNFL segments were analyzed (Table 3). The temporal segments had the strongest association with the two FCSRT delayed recall scores. Thicker RNFL of the temporal, inferotemporal, and superotemporal segments was significantly associated with a lower decline in the delayed free recall score during follow-up (β = 0.013; 95% CI, 0.003 to 0.023; p = 0.011; β = 0.007; 95% CI, 0.002 to 0.012; p = 0.005; and β = 0.007; 95% CI, 0.002 to 0.013; p = 0.013, respectively) in model A. The same trends were observed in model B after additional adjustment for axial length; although, the associations were only borderline significant for the temporal and inferotemporal segments. Surprisingly, the temporal segment also showed an association with a lower initial score (β = −0.029; 95% CI, −0.054 to −0.005; p = 0.020), but this association was no longer significant after adjustment for axial length.
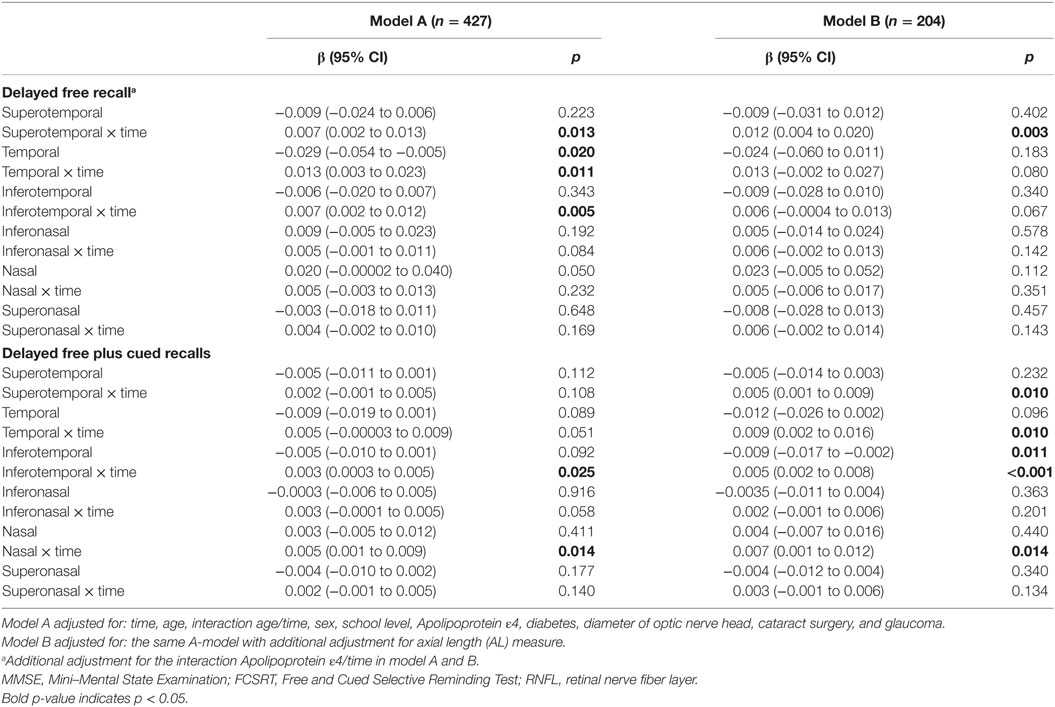
Table 3. Initial differences and evolution over time of the FCSRT score of delayed free recall and delayed free plus cued recalls according to the segments of the RNFL.
For delayed free plus cued recalls, the decline over the follow-up was also associated with RNFL thickness in the “temporal side”; this association was significant only for the inferotemporal segment in model A (β = 0.003; 95% CI, 0.0003 to 0.005; p = 0.025). It was also significant for the three temporal segments in the subset with axial length measured (Model B; β = 0.009; 95% CI, 0.002 to 0.016; p = 0.010; β = 0.005; 95% CI, 0.002 to 0.008; p < 0.001; and β = 0.005; 95% CI; 0.001 to 0.009; p = 0.010, for temporal, inferotemporal and superotemporal segments, respectively). Additionally, thicker RNFL of the nasal segment was also associated with lower decline of the cognitive score (Models A and B). Surprisingly, in model B, an association was also demonstrated between inferotemporal segment thickness and a lower initial score (β = −0.009; 95% CI, −0.017 to −0.002; p = 0.011).
Results were globally unchanged in sensitivity analyses excluding participants with glaucoma.
Similar results were also observed in complementary analyses. Participants classified as borderline (12.6%) or outside normal limits (17.8%) for their global RNFL value (i.e., with thin RNFL) according to the Spectralis software classification had a higher decline for the two FCSRT scores of delayed recall (β = −0.40; 95% CI, −0.71 to −0.10; p = 0.009 for delayed free recall and β = −0.20; 95% CI, −0.34 to −0.05; p = 0.007 for delayed free plus cued recalls).
Discussion
We found that, whereas global RNFL thickness was not associated with initial cognitive scores, a thicker RNFL was associated with a lower decline of cognitive performances based on the delayed recall scores of the FCSRT. None of the other cognitive functions were associated with RNFL thickness. These findings suggest that reduced RNFL thickness may reflect a higher risk of episodic memory deterioration over time.
The reduction of RNFL thickness in patients with MCI and/or AD, compared to controls, has been previously reported in several studies (4, 9, 10). These previous studies support a systematic and cumulative reduction of the RNFL thickness with the progression of the cognitive impairment. The association between RNFL and cognition at an earlier stage is largely unknown; yet, cognitive decline is a very long process (25). Thus, our results may fit into a very early stage of cognitive impairment. Moreover, our study takes place within a general elderly population, using a longitudinal design, thus adding complementary knowledge compare to previous studies, which are mostly cross-sectional in clinical settings.
The association shown in our results was specific to episodic memory, which is a cognitive domain strongly implicated in AD process. A previous study evaluating the relationship between RNFL and cognition also found an association between RNFL and episodic memory (word list learning and story recall) among participants with normal cognition (26). However, this was a cross-sectional study with a small sample size (n = 52).
No association was found with MMSE score, which reflects global cognition. However, our population is mainly a well-functioning population without dementia at baseline; the MMSE test may be not sensitive enough to detect subtle changes in the early phase of cognitive deterioration (27). Similarly, no correlations between MMSE and peripapillary thickness were found in most previous studies comparing peripapillary RNFL in AD patients and healthy controls (28, 29). Only 1 previous study comparing 35 AD, 35 MCI, and 35 healthy controls reported a significant correlation between peripapillary RNFL and MMSE in an analysis combining all the participants (30).
More surprisingly, we also found no association with Isaacs’ verbal fluency test, even though this test has detected changes during very early cognitive decline, as many as 15 years before the clinical diagnosis of Alzheimer’s dementia (25). However, among elderly people, dementia is the result of several processes including neurodegeneration and vascular damage (31). Cognitive impairment due to vascular processes is believed to preferentially manifest through impaired attention and executive function rather than memory function (32). Therefore, verbal fluency could reflect the global vascular process more than the neurodegenerative process. This may explain the lack of association with RNFL thickness, which may be more strongly related to neurodegeneration.
Our SD-OCT device automatically calculates RNFL thickness both globally and in each of the six segments. This offers the advantage of providing data for the superotemporal and inferotemporal segments, which are the thickest zones in the peripapillary area and the most sensitive zones to early age-related defects (20, 33). As previously reported, the highest RNFL values in our data were found in the inferotemporal and superotemporal segments, which, together with the temporal segment, are also associated with cognitive decline (20).
Our results showing cognitive test alterations reflecting episodic memory changes are consistent with previous reports stating that the primary degenerative process leading to MCI and/or AD is marked by an early deterioration of episodic memory (27, 34, 35). In normal elderly subjects, the evaluation of this deterioration can even predict the time of progression to MCI as well as the time of progression from MCI to AD (36). Furthermore, even though “recall measures” are cited more often as good cognitive markers of future AD, “delayed recall measures” are excellent predictors of progression to AD (37, 38) and can even increase the sensitivity of recall scores used in AD identification (39). Therefore, our findings may be relevant to the specific brain changes found in the hippocampus and temporal regions of people in the preclinical stage of AD (40–42). Previous imaging data showing a correlation between RNFL and cerebral volumes in the temporal and occipital lobes are concordant with these findings (43). In addition to RNFL, future studies should explore the ganglion cell-body layer in relationship with cognitive performance and brain alteration.
Glaucoma was taken into account in our analyses by adjusting for this pathology and by performing sensitivity analyses excluding participants with glaucoma. Glaucoma is a degenerative disease of the optic nerve, and we previously found an increased risk of dementia among participants with glaucoma (11). The inferotemporal and superotemporal segments are the first segments damaged in glaucoma. These segments (and the temporal segment) are also the ones associated with cognitive decline. Therefore, similar neurodegenerative processes could lead to both glaucoma and cognitive decline. Axial length was also adjusted for in our analyses. However, supplementary analyses comparing results with and without adjustment for axial length in the subsample of 204 participants with available axial length data showed that this adjustment did not materially change our results (data not shown); thus, even if axial length is associated with RNFL, it seems not confound the relation between RNFL and cognition.
Our study has several limitations. First, our follow-up period of 2 years may be too short to demonstrate larger effects on other cognitive functions. However, to our knowledge, this is the first longitudinal study with a large cohort in this field. Second, our study included well-functioning subjects who consented to eye examination and who therefore may have a lower decline of cognitive performance over time than the general population. Thus, despite our large study population compared to previous case-control studies in this field, we cannot exclude a possible lack of power. Third, as race was not available in our cohort, we could not adjust for in the analyses; however, our population was mostly from a Caucasian origin. Fourth, data on refractive error, another ocular variable known to influence RNFL (44) was not included in our analyses; but given our findings on axial length it is unlikely to have affected results. Finally, as RNFL measurement was not available at the baseline time of the Alienor study, the effect of the RNFL evolution over time on cognition could not be studied; further follow-ups of our cohort will allow studying this.
Our study has some strengths. It is based on a longitudinal design with a large population-based cohort including nearly 430 elderly participants. It includes a systematic eye examination that allows the identification and the exclusion of ocular pathologies likely to influence RNFL measurement (vitreomacular traction, myelinated retinal nerve fibers, peripapillary choroidal neovascularization, or myopic chorioretinopathy). The OCT assessments were performed on the same OCT machine by the same experienced technician following a standardized protocol. Moreover, the spectral domain technique provided the best quality and reproducibility currently available (45). Cognitive functions were systematically assessed by trained psychologists blinded to ophthalmologic data using standardized procedures and evaluating several cognitive domains. The association between RNFL and delayed episodic memory was found with both RNFL as a continuous variable and using the threshold provided by the device to classify participants as borderline or outside normal limits for RNFL. Finally, numerous potential confounding factors were taken into account.
Conclusion
Our findings enrich the literature on the potential utility of RNFL in cognitive deterioration. Although there are still gaps in detailed knowledge of the early association between neurodegeneration in the retina and in the brain, our findings could lead to the next steps of knowledge in that domain. However, these results should be corroborated with larger populations and longer follow-ups. Moreover, cerebral imaging studies should be implemented to better understand the association between retinal and brain neurodegeneration.
Author Contributions
JM-G analyzed the data and draft the first version of the manuscript. CH, CD, J-FD, J-FK, and JM-G designed the study. M-BR, J-FK, CS, M-ND, HA, J-FD, CD, and CH acquired the data. All the co-authors contributed to the interpretation of the results, critically revised the manuscript, and approved the final version.
Conflict of Interest Statement
JM-G, LT, and HA disclose no conflict of interest. M-BR is consultant for Allergan, Bausch & Lomb. She has received funding for conferences from Biogen, Thea, Novartis. CS has received funding for travel from Alcon, Allergan, AMO. M-ND has received funding from laboratoires Théa (advisory board, travel funding) and Novartis (advisory board, travel funding). J-FK is consultant for Alcon, Allergan, Bayer, Carl Zeiss Meditec, Novartis, Théa. J-FD serves on a scientific advisory board for and has received funding for travel from Janssen-Cilag; received a gift worth more than US$500 from Novartis; holds a corporate appointment with Merck Serono; and has received research support from Novartis and Ipsen. CD has received funding from laboratoires Théa (grant, advisory board, travel funding), Novartis (consultant), and Bausch & Lomb (consultant). CH has received honoraries from Novartis.
Funding
The Three-City study is conducted under a partnership agreement between the Institut National de la Santé et de la Recherche Médicale (INSERM), the University Bordeaux 2 Victor Segalen and Sanofi-Aventis. The Fondation pour la Recherche Médicale funded the preparation and initiation of the study. The Three-City study is also supported by the Caisse Nationale Maladie des Travailleurs Salariés, Direction Générale de la Santé, MGEN, Institut de la Longévité, Conseils Régionaux d’Aquitaine et Bourgogne, Fondation de France, Ministry of Research-INSERM Programme “Cohortes et collections de données biologiques,” Agence Nationale de la Recherche ANR PNRA 2006 and LongVie 2007, and the “Fondation Plan Alzheimer” (FCS 2009-2012). The Alienor study is supported by laboratoires Théa (Clermont-Ferrand, France), Fondation Voir et Entendre (Paris, France), Association Retina France (Colomiers, France), Conseil Régional d’Aquitaine (Convention no. 20091301029, Bordeaux, France) and Fondation pour la Recherche Médicale, France (FRM). The present study has also been supported by France Alzheimer (AAP SM 2012). Role of the Sponsors: The Laboratoires Théa participated in the design of the Alienor study, but none of the sponsors participated in the collection, management, statistical analysis, and interpretation of the data, not in the preparation, review or approval of the present manuscript. All authors are independent of financial supports. JM-G and CH had full access to all of the data in the study and take responsibility for the integrity of the data and the accuracy of the data analysis.
Supplementary Material
The Supplementary Material for this article can be found online at http://journal.frontiersin.org/article/10.3389/fneur.2017.00093/full#supplementary-material.
References
1. Bernard C, Helmer C, Dilharreguy B, Amieva H, Auriacombe S, Dartigues JF, et al. Time course of brain volume changes in the preclinical phase of Alzheimer’s disease. Alzheimers Dement (2014) 10:143–51.e1. doi:10.1016/j.jalz.2013.08.279
2. Jack CR Jr, Knopman DS, Jagust WJ, Shaw LM, Aisen PS, Weiner MW, et al. Hypothetical model of dynamic biomarkers of the Alzheimer’s pathological cascade. Lancet Neurol (2010) 9:119–28. doi:10.1016/S1474-4422(09)70299-6
3. London A, Benhar I, Schwartz M. The retina as a window to the brain – from eye research to CNS disorders. Nat Rev Neurol (2013) 9:44–53. doi:10.1038/nrneurol.2012.227
4. Garcia-Martin ES, Rojas B, Ramirez AI, de Hoz R, Salazar JJ, Yubero R, et al. Macular thickness as a potential biomarker of mild Alzheimer’s disease. Ophthalmology (2014) 121:1149–51. doi:10.1016/j.ophtha.2013.12.023
5. Jindahra P, Hedges TR, Mendoza-Santiesteban CE, Plant GT. Optical coherence tomography of the retina: applications in neurology. Curr Opin Neurol (2010) 23:16–23. doi:10.1097/WCO.0b013e328334e99b
6. Klistorner A, Sriram P, Vootakuru N, Wang C, Barnett MH, Garrick R, et al. Axonal loss of retinal neurons in multiple sclerosis associated with optic radiation lesions. Neurology (2014) 82:2165–72. doi:10.1212/WNL.0000000000000522
7. Petzold A, de Boer JF, Schippling S, Vermersch P, Kardon R, Green A, et al. Optical coherence tomography in multiple sclerosis: a systematic review and meta-analysis. Lancet Neurol (2010) 9:921–32. doi:10.1016/S1474-4422(10)70168-X
8. Sadun AA, Bassi CJ. Optic nerve damage in Alzheimer’s disease. Ophthalmology (1990) 97:9–17. doi:10.1016/S0161-6420(90)32621-0
9. Cheung CY, Ong YT, Hilal S, Ikram MK, Low S, Ong YL, et al. Retinal ganglion cell analysis using high-definition optical coherence tomography in patients with mild cognitive impairment and Alzheimer’s disease. J Alzheimers Dis (2015) 45:45–56. doi:10.3233/JAD-141659
10. Coppola G, Di Renzo A, Ziccardi L, Martelli F, Fadda A, Manni G, et al. Optical coherence tomography in Alzheimer’s disease: a meta-analysis. PLoS One (2015) 10:e0134750. doi:10.1371/journal.pone.0134750
11. Helmer C, Malet F, Rougier M-B, Schweitzer C, Colin J, Delyfer M-N, et al. Is there a link between open-angle glaucoma and dementia? The three-city-alienor cohort. Ann Neurol (2013) 74:171–3. doi:10.1002/ana.23926
12. Shi Z, Zhu Y, Wang M, Wu Y, Cao J, Li C, et al. The utilization of retinal nerve fiber layer thickness to predict cognitive deterioration. J Alzheimers Dis (2015) 49:399–405. doi:10.3233/JAD-150438
13. 3C Study Group. Vascular factors and risk of dementia: design of the three-city study and baseline characteristics of the study population. Neuroepidemiology (2003) 22:316–25. doi:10.1159/000072920
14. Delcourt C, Korobelnik JF, Barberger-Gateau P, Delyfer MN, Rougier MB, Le Goff M, et al. Nutrition and age-related Eye diseases: the ALIENOR (antioxydants, lipides essentiels, nutrition et maladies oculaires) study. J Nutr Health Aging (2010) 14:854–61. doi:10.1007/s1260-010-0131-9
15. Folstein MF, Folstein SE, McHugh PR. “Mini-mental state”: a practical method for grading the cognitive state of patients for the clinician. J Psychiatr Res (1975) 12:189–98. doi:10.1016/0022-956(75)90026-6
16. Isaacs B, Kennie AT. The set test as an aid to the detection of dementia in old people. Br J Psychiatry (197) 123:467–70. doi:10.1192/bjp.123.4.467
17. Grober E, Buschke H. Genuine memory deficits in dementia. Dev Neuropsychol (1987):13–36. doi:10.1080/87565648709540361
18. American Psychiatric Association. Diagnostic and Statistical Manual of Mental Disorders, Fourth Edition (DSM IV). Washington, DC: APA (1994).
19. Amieva H, Carcaillon L, Rouze L, Alzit-Schuermans P, Millet X, Dartigues JF, et al. Test de rappel libre/rappel indicé à 16 items: normes en population générale chez des sujets âgés issues de l’étude des Cités. Rev Neurol (2007) 16:205–21. doi:10.1016/S0035-3787(07)90392-6
20. Rougier M-B, Korobelnik J-F, Malet F, Schweitzer C, Delyfer M-N, Dartigues J-F, et al. Retinal nerve fibre layer thickness measured with SD-OCT in a population-based study of French elderly subjects: the Alienor study. Acta Ophthalmol (2015) 9:539–45. doi:10.1111/aos.12658
21. Foster PJ, Buhrmann R, Quigley HA, Johnson GJ. The definition and classification of glaucoma in prevalence surveys. Br J Ophthalmol (2002) 86:28–42. doi:10.1136/bjo.86.2.238
22. Laird NM, Ware JH. Random-effects models for longitudinal data. Biometrics (1982) 8:963–74. doi:10.2307/2529876
23. Proust-Lima C, Philipps V, Liquet B. Estimation of extended mixed models using latent classes and latent processes: the R package lcmm. J Stat Softw [Internet]. (2016). (in press). Available from: http://arxiv.org/abs/1503.00890
24. Savini G, Barboni P, Parisi V, Carbonelli M. The influence of axial length on retinal nerve fibre layer thickness and optic-disc size measurements by spectral-domain OCT. Br J Ophthalmol (2012) 96:57–61. doi:10.116/bjo.2010.196782
25. Amieva H, Mokri H, Le Goff M, Meillon C, Jacqmin-Gadda H, Foubert-Samier A, et al. Compensatory mechanisms in higher-educated subjects with Alzheimer’s disease: a study of 20 years of cognitive decline. Brain (2014) 17:1167–75. doi:10.1093/brain/awu035
26. Shen Y, Liu L, Cheng Y, Feng W, Shi Z, Zhu Y, et al. Retinal nerve fiber layer thickness is associated with episodic memory deficit in mild cognitive impairment patients. Curr Alzheimer Res (2014) 11:259–66. doi:10.2174/156720501166614011114418
27. Small BJ, Fratiglioni L, Viitanen M, Winblad B, Backman L. The course of cognitive impairment in preclinical Alzheimer disease: three- and 6-year follow-up of a population-based sample. Arch Neurol (2000) 57:89–44. doi:10.1001/archneur.57.6.839
28. Iseri PK, Altinas Ö, Tokay T, Yüksel N. Relationship between cognitive impairment and retinal morphological and visual functional abnormalities in Alzheimer disease. J Neuroophthalmol (2006) 26:18–24. doi:10.1097/01.wno.0000204645.5687.26
29. Kesler A, Vakhapova V, Korczyn AD, Naftaliev E, Neudorfer M. Retinal thickness in patients with mild cognitive impairment and Alzheimer’s disease. Clin Neurol Neurosurg (2011) 11:523–6. doi:10.1016/j.clineuro.2011.02.014
30. Oktem EO, Derle E, Kibaroglu S, Oktem C, Akkoyun I, Can U. The relationship between the degree of cognitive impairment and retinal nerve fiber layer thickness. Neurol Sci (2015) 6:1141–6. doi:10.1007/s10072-014-2055-3
31. Schneider JA, Arvanitakis Z, Leurgans SE, Bennett DA. The neuropathology of probable Alzheimer disease and mild cognitive impairment. Ann Neurol (2009) 66:200–8. doi:10.1002/ana.21706
32. O’Brien JT, Erkinjuntti T, Reisberg B, Roman G, Sawada T, Pantoni L, et al. Vascular cognitive impairment. Lancet Neurol (200) 2:89–98. doi:10.1016/S1474-4422(0)00305-3
33. Feuer WJ, Budenz DL, Anderson DR, Cantor L, Greenfield DS, Savell J, et al. Topographic differences in the age-related changes in the retinal nerve fiber layer of normal eyes measured by Stratus optical coherence tomography. J Glaucoma (2011) 20:13–8. doi:10.1097/IJG.0b013e3181e079b2
34. Fox NC, Warrington EK, Seiffer AL, Agnew SK, Rossor MN. Presymptomatic cognitive deficits in individuals at risk of familial Alzheimer’s disease. A longitudinal prospective study. Brain. (1998) 121:161–9. doi:10.1093/brain/121.9.1631
35. Murphy KJ, Troyer AK, Levine B, Moscovitch M. Episodic, but not semantic, autobiographical memory is reduced in amnestic mild cognitive impairment. Neuropsychologia (2008) 46:116–23. doi:10.1016/j.neuropsychologia.2008.07.004
36. Blacker D, Lee H, Muzikansky A, Martin EC, Tanzi R, McArdle JJ, et al. Neuropsychological measures in normal individuals that predict subsequent cognitive decline. Arch Neurol (2007) 64:862–71. doi:10.1001/archneur.64.6.862
37. Bastin C, Salmon E. Early neuropsychological detection of Alzheimer’s disease. Eur J Clin Nutr (2014) 68:1192–9. doi:10.108/ejcn.2014.176
38. Fichman-Charchat H, Miranda CV, Fernandes CS, Mograbi D, Oliveira RM, Novaes R, et al. Brief cognitive screening battery (BCSB) is a very useful tool for diagnosis of probable mild Alzheimer’s disease in a geriatric clinic. Arq Neuropsiquiatr (2015) 74:1–6. doi:10.1590/0004-282X20150202
39. Vogel A, Mortensen EL, Gade A, Waldemar G. The category cued recall test in very mild Alzheimer’s disease: discriminative validity and correlation with semantic memory functions. Eur J Neurol (2007) 14:102–8. doi:10.1111/j.1468-11.2006.01568.x
40. den Heijer T, van der Lijn F, Koudstaal PJ, Hofman A, van der Lugt A, Krestin GP, et al. A 10-year follow-up of hippocampal volume on magnetic resonance imaging in early dementia and cognitive decline. Brain (2010) 13:1163–72. doi:10.1093/brain/awq048
41. Frisoni GB, Ganzola R, Canu E, Rub U, Pizzini FB, Alessandrini F, et al. Mapping local hippocampal changes in Alzheimer’s disease and normal ageing with MRI at Tesla. Brain (2008) 131:3266–76. doi:10.1093/brain/awn280
42. West MJ, Coleman PD, Flood DG, Troncoso JC. Differences in the pattern of hippocampal neuronal loss in normal ageing and Alzheimer’s disease. Lancet (1994) 44:769–72. doi:10.1016/S0140-6736(94)92338-8
43. Ong Y-T, Hilal S, Cheung CY, Venketasubramanian N, Niessen WJ, Vrooman H, et al. Retinal neurodegeneration on optical coherence tomography and cerebral atrophy. Neurosci Lett (2015) 584:12–6. doi:10.1016/j.neulet.2014.10.010
44. Alasil T, Wang K, Keane PA, Lee H, Baniasadi N, de Boer JF, et al. Analysis of normal retinal nerve fiber layer thickness by age, sex, and race using spectral domain optical coherence tomography. J Glaucoma (2012) 22:52–41. doi:10.1097/IJG.0b01e318255bb4a
Keywords: retinal nerve fiber layer, episodic memory, cognition, elderly, optical coherence tomography
Citation: Méndez-Gómez JL, Rougier M-B, Tellouck L, Korobelnik J-F, Schweitzer C, Delyfer M-N, Amieva H, Dartigues J-F, Delcourt C and Helmer C (2017) Peripapillary Retinal Nerve Fiber Layer Thickness and the Evolution of Cognitive Performance in an Elderly Population. Front. Neurol. 8:93. doi: 10.3389/fneur.2017.00093
Received: 13 November 2016; Accepted: 27 February 2017;
Published: 21 March 2017
Edited by:
Piero Barboni, Studio Oculistico d’Azeglio, ItalyReviewed by:
Heather Mack, Eye Surgery Associates, AustraliaHeather Moss, University of Illinois at Chicago, USA
Copyright: © 2017 Méndez-Gómez, Rougier, Tellouck, Korobelnik, Schweitzer, Delyfer, Amieva, Dartigues, Delcourt and Helmer. This is an open-access article distributed under the terms of the Creative Commons Attribution License (CC BY). The use, distribution or reproduction in other forums is permitted, provided the original author(s) or licensor are credited and that the original publication in this journal is cited, in accordance with accepted academic practice. No use, distribution or reproduction is permitted which does not comply with these terms.
*Correspondence: Catherine Helmer, catherine.helmer@u-bordeaux.fr