 Kathleen Ingenhoven1
 Daniel Kramer2Poul Erik Jensen3
 Christina Hermanrud4
 Malin Ryner4Florian Deisenhammer5
 Marc Pallardy6Til Menge1
 Hans-Peter Hartung1Bernd C. Kieseier1
 Elisa Bertotti7
 Paul Creeke8
 Anna Fogdell-Hahn4
 Clemens Warnke1,9* On Behalf of the ABIRISK Consortium†
- 1Medical Faculty, Department of Neurology, Heinrich-Heine-University, Duesseldorf, Germany
- 2Sanofi-Aventis, Deutschland GmbH, Frankfurt am Main, Germany
- 3Neuroimmunology Laboratory, DMSC, Department of Neurology, Rigshospitalet, Copenhagen, Denmark
- 4Department of Clinical Neuroscience, Karolinska Institutet, Stockholm, Sweden
- 5Department of Neurology, Innsbruck Medical University, Innsbruck, Austria
- 6INSERM 996, University Paris-Sud, Paris, France
- 7Merck NBE Bioanalytics, Torino, Italy
- 8Centre for Neuroscience and Trauma, Blizard Institute, Queen Mary, University of London, London, United Kingdom
- 9Department of Neurology, University Hospital of Cologne, Cologne, Germany
Objective: To develop and validate a method for the detection of binding anti-drug antibodies (ADAs) against interferon beta (IFN-β) in human serum as part of a European initiative (ABIRISK) aimed at the prediction and analysis of clinical relevance of anti-biopharmaceutical immunization to minimize the risk.
Method: A two-tiered bridging enzyme-linked immunosorbent assay (ELISA) format was selected and validated according to current recommendations. Screening assay: ADA in serum samples form complexes with immobilized IFN-β and biotinylated IFN-β, which are then detected using HRP labeled Streptavidin and TMB substrate. Confirmation assay: Screen “putative positive” samples are tested in the presence of excess drug (preincubation of sera with 0.3 µg/mL of soluble IFN-β) and percentage of inhibition is calculated.
Results: The assay is precise, and the sensitivity of the assay was confirmed to be 26 ng/mL using commercially available polyclonal rabbit antihuman IFN-β in human sera as the positive control.
Conclusion: An ultrasensitive ELISA for IFN-β-binding ADA testing has been validated. This will form the basis to assess anti-biopharmaceutical immunization toward IFN-β with regards to its clinical relevance and may allow for the development of predictive tools, key aims within the ABIRISK consortium.
Introduction
Biopharmaceuticals (BPs) are increasingly used for therapy of multiple diseases, including inflammatory and autoimmune disorders. Unwanted immunogenic responses to BPs, including anti-drug antibodies (ADAs), can potentially affect clinical safety and efficacy. In patients with multiple sclerosis (MS), different interferon beta (IFN-β) formulations have been approved as disease modifying therapeutics for more than two decades and experience from historical clinical ADA testing is available (1–3). Despite the increasing number of drugs that recently became available for therapy of MS, owing the well-established long-term safety profile and some concerns with alternative treatments such as the occurrence of progressive multifocal leukoencephalopathy (4), IFN-β treatment still remains one of the first-choice options for mild-to-moderate forms of relapsing MS (5). Accurate assays for screening for ADA formation in patients treated with IFN-β thus may be important and clinically relevant tools in the evolving field of precision medicine. Consensus has been reached that patients with persistent detection of ADA with high neutralizing capacity should switch therapy to a non-IFN-β alternative (6). However, frequency of ADA positivity with neutralizing capacity can vary depending on the IFN-β formulation used and the test applied, as illustrated by a wide range of positivity spanning from 2.8 to 13.8% for IFN-β 1a i.m., and 13.3 to 68.3% for IFN-β 1b s.c. depending on the testing site in Europe (3). The varying data on positivity across countries are in part explained by a limited level of harmonization of the terms and definitions of immunogenicity at the time when the data were obtained, and by a limited standardization of the assays used for ADA testing. This also refers to the data available from pivotal clinical studies relevant for drug registration (6). Within the “Innovative Medicines Initiative” (IMI1) funded ABIRISK consortium [Anti-Biopharmaceutical (BP) Immunization Prediction and Clinical Relevance to Reduce the Risk2], formed by clinicians, academic scientists, and European Federation of Pharmaceutical Industries and Associations (EFPIA) members, standardized terms and definitions have recently been published (7). The aim of this study was to develop and validate a method for the detection of ADA toward IFN-β in human serum, following the published ABIRISK recommendations. These recommendations include a typical three-tiered approach, in which the samples are first screened and confirmed for binding ADA in a two-step analysis as described in this manuscript, and then further analyzed for neutralizing capacity and titers in a bio-assay recently published (8). The assay validation set forth in this article followed established industry and regulatory guidelines (9–13).
Materials and Methods
Origin of Human Serum
A human serum mixed gender pool from 50 healthy individuals (Sera Laboratories International Ltd., UK) was used (neat sera). Individual human serum samples for cut-point determination were obtained from 10 healthy donors and 40 IFN-β treatment naïve MS patients. All sera were stored at −20°C until use.
Statistical Analysis
Assay data reflecting variability are expressed in mean, sample variances or SD, and coefficient of variation (CV). A CV of ≤30% was selected as the maximum acceptable intra-plate variation between duplicates. Curve fitting and statistical analyses were performed using Excel software (Microsoft®), GraphPad Prism version 6 (GraphPad Software Inc., USA), and JMP (SAS, USA).
Assay Principle
A two-tiered bridging enzyme-linked immunosorbent assay (ELISA) format is selected. All “putative positive” samples from the screening assay (tier 1) are tested in the presence of excess of drug in the confirmatory assay (tier 2). The standard assay procedure is illustrated in Table 1 and the assay principle in Figure 1.
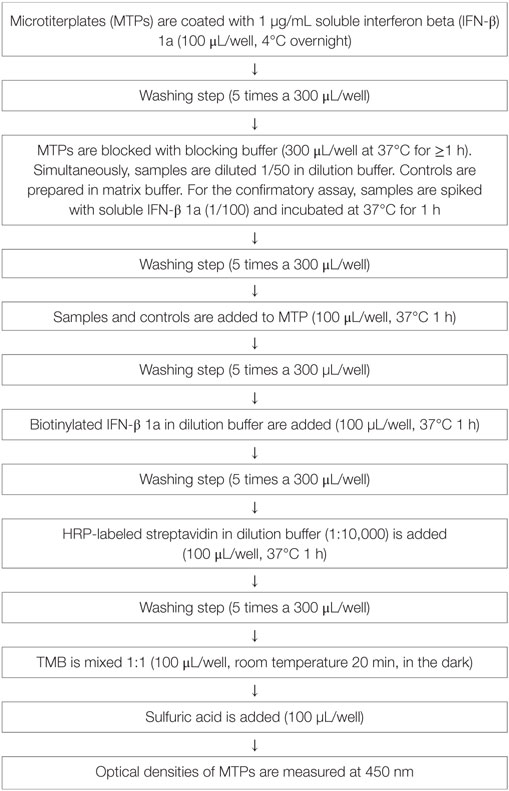
Table 1. Standard assay procedure.
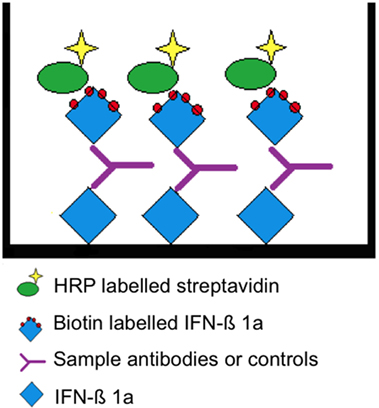
Figure 1. Assay principle. Interferon beta (IFN-β) 1a is non-specifically bound to the surface allowing the presentation of multiple epitopes. A “bridge” is formed by the subsequent addition of a positive serum sample or rabbit antihuman IFN-β and biotin-labeled IFN-β 1a. The latter is detected by HRP-conjugated streptavidin.
The assay is performed in 96-well microtiterplates (MTPs, costar EIA/RIA Plates, Thermo Scientific Inc., USA). These plates are coated with 1 µg/mL IFN-β 1a (Avonex, Biogen, USA) in blocking buffer (0.05 M bicarbonate buffer, Pierce Perbio, USA) and incubated overnight at 4°C. MTPs are then washed five times with 300 µL PBS-tween 20 (PBS-T, Calbiochem by Merck KGaA, Germany). For all washing steps, a plate washer (Columbus plus, Tecan Group LTC, Switzerland) is used. Non-specific binding is prevented by blocking buffer (PBS-T plus 3% Albumin fraction V, Carl Roth GmbH, Germany) applying 300 µL/well for 1 h at 37°C. Samples, or positive control (PC, rabbit antihuman IFN-β, PeproTech Inc., USA) are prepared by diluting them to minimal required dilution (MRD, 1 in 50) in dilution buffer (1% BSA in PBS-Tween) or matrix buffer (1% BSA in PBS-T + neat sera 1 in 50). Non-specific binding and false positive samples are eliminated in the confirmatory assay (tier 2): samples are spiked with excess drug (IFN-β 1a 0.3 mg/mL, freeze-dried Avonex, Biogen, USA Idec Ltd., UK) and incubated for 1 h at 37°C. After washing off the blocking solution, native samples at MRD and spiked samples are added to the plate (100 μL/well) and incubated for 1 h at 37°C. After another washing step, biotinylated IFN-β 1a (Avonex, Biogen, USA; degree of labeling 8 molecules of biotin to 1 molecule IFN-β at Microcoat Biotechnologie GmbH, Germany) is added in a dilution of 1 in 1,000 at 100 µL/well and incubated for 1 h at 37°C. After washing, 100 µL/well of horseradish peroxidase-conjugated streptavidin (Strep-HRP, 1 in 10,000, Thermo Fisher Scientific Pierce Technology, USA) is added. The reagent is incubated for 1 h at 37°C. In a final washing step, unbound reagent is washed off and the substrate tetramethylbenzidine (TMB, KPL, Kirkegaard & Perry Laboratories Inc., USA) 100 µL/well is added. The TMB is incubated for 20 min at room temperature (RT); the reaction is stopped by addition of sulfuric acid 0.5 mol/L (Carl Roth GmbH, Germany). Optical densities of formed complexes are measured at 450 nm.
Assay Development and Optimization
The optimal assay conditions and key assay parameters were established prior to starting the validation. Key reagents such as IFN-β coating concentration, biotinylated IFN-β concentrations, and streptavidin-labeled HRP dilutions were tested. The rabbit antihuman IFN-β used as PC was assessed in dose–response curves. In addition, the MRD was set up. The MRD is the minimum dilution necessary for the detection of ADA in biological matrix with least interference. To determine the MRD, five serum samples from healthy individuals were serially diluted to achieve different serum backgrounds and spiked with high PC (HPC, rabbit antihuman IFN-β at 1 µg/mL) and low PC (LPC, rabbit antihuman IFN-β at 26 ng/mL). Subsequently, the mean signal and SD for each serum dilution (S) and assay blank (B) were determined, and the Z factor for the HPC and LPC in each serum dilution was calculated according to the following equation (14):
The Z factor is an estimate of the signal to noise ratio with an accepted range from 0.5 to 1.0 (14), where higher values are preferred. Based on optimal Z factor for the HPC and LPC the MRD was selected.
Assay Validation
Screening Cut-Point
The screening cut-point is defined as the level of response at or above which an unknown sample is defined as “putative positive” for the presence of anti-IFN-β antibodies and below which it is defined as negative. The screening cut-point was established by analyzing 50 individual human sera samples at the defined MRD, studied by two operators in duplicates on at least three different days. OD values of duplicates with a CV above 30% were eliminated. Biological outliers were identified using the “box plot” method: all samples above the upper bound [75th percentile + 1.5 × (75th–25th percentile)] or below the lower bound [25th percentile−1.5 × (75th–25th percentile)] were removed. Additionally, analytical outliers, evaluated for each single assay run as described above, were removed from the individual run, and not considered for the cut-point calculation. Linear data and log-transformed data were analyzed for distribution and skewness using the Shapiro–Wilk normality and skewness test.
During this specific validation, a total of nine runs (operator 1 five runs, operator 2 four runs) were analyzed. Out of nine runs six passed the normality test and eight showed a skewness below 1.0. Therefore, a parametric approach (one sided, 95% confidence level) was selected to calculate the cut-point, using the following equation (11):
As outliers were removed and different sample numbers applied for each run, the SD was calculated from the weighted variance. To decide if a fixed or a floating cut-point could be used, two statistical tests were performed using the nine runs of the cut-point determination (after outlier removal): single factor ANOVA (analysis of variation) to evaluate if the means of the cut-point runs were significantly different or not; precision (CV%) of each run to assess if the CV% was equal to or below 15% (in this case, the variances were considered not to be significantly different). The ANOVA analysis illustrated that the means were significantly different when comparing all cut-point runs (p < 0.05). According to the precision calculations, the variances of the nine runs were not significantly different. These results indicated that a floating cut-point could be used. The negative control (NC, matrix at the MRD) was used to normalize the cut-point. Suitability of the NC was assessed by plotting the mean response of the NCs of each run versus the mean of the 50 corresponding individual sera tested in each cut-point run. The normalization factor (NF) was then calculated by applying the following equation applied to the log-transformed data:
Specificity Cut-Point
Due to the 5% false-positive rate built into the screening cut-point, the confirmation of “true positives” among the “putative positive” samples requires the demonstration of specific binding to the drug. A putative positive sample is re-tested in the presence and absence of an excess of drug in solution. The specificity cut-point is defined as the “percent (%) inhibition” at or above which a sample is considered as “confirmed positive.” In order to establish the specificity cut-point, the 50 drug naïve serum samples used for the determination of the screening cut-point were spiked with an excess of IFN-β (0.3 µg/mL) and tested along with the corresponding non-spiked samples on at least three different days by two operators. The % inhibition for each sample relative to its non-spiked counterpart was calculated according to the following formula (11):
% inhibition data were assessed for biological and analytical outliers as described above. Shapiro–Wilk test analysis showed that the linear data were closer to a Gaussian distribution and was more symmetrically distributed in comparison with the log-transformed data. Therefore, all calculations were performed with linear data. Seven out of nine runs passed the normality test and eight out of nine runs showed a skewness below 1. Therefore, a parametric approach was used to calculate the cut-point. The following equation was applied, accepting 1% false positivity (11):
Specificity
To assess the specificity of the assay, varying IFN-β concentrations (ranging from 100 to 60,000 IU) were added to the HPC and tested until a signal at assay background was reached. Specificity was also shown by testing the inhibitory potentials of similar molecules such as IFN-alpha, IFN-gamma, and IL-2.
Sensitivity
The limit of detection (LOD) of the assay is defined by the lowest concentration of the PC yielding consistently a positive assay response. It was determined by testing a calibration curve (serial dilutions of the PC in pooled human serum ranging from 1,000 to 0.005 ng/mL) spanning the screening cut-point in six assay runs by two operators. The concentration of the PC yielding an assay response at the cut-point was interpolated using a 4PL-fitting model. The LOD was calculated with the following equation (aiming for a 1% failure rate):
Sensitivity Confirmation and Recovery
In order to confirm sensitivity, the concentration of the LPC (slightly below the calculated LOD) and higher concentrations of the PC were spiked into ten individual serum samples. In addition, all samples were tested in the confirmatory assay. The lowest concentration that was tested positive and showed a reduction above or at the specificity cut-point was defined as the sensitivity of the assay. In addition, recovery was evaluated by spiking the LPC and the HPC in ten different individual serum samples, assay buffer, and pool serum. In sample matrix, a recovery (relative to assay buffer) between 70 and 130% was accepted.
Assay Precision and Acceptance Criteria
The NC, the HPC, and the LPC were tested on three different days with three plates per day by two operators (in summary, 18 plates). Each plate included three independent batches of the controls. Mean response, SD, intra-, and inter-batch precision were calculated for each control. Based on the results of the intra- and inter-batch, precision acceptance criteria (aiming at a 1% failure rate) for the controls were determined. An upper acceptance limit for the NC was calculated to avoid that an unusual high response impairs the assay sensitivity (as the NC is used to normalize the screening cut-point) according to the following formula:
For the HPC and the LPC, an upper and a lower acceptance limit were calculated according to the following formula:
Drug Interference
Drug interference was tested by spiking both the HPC and the LPC with increasing amounts of IFN-β until a signal below the screening cut-point was achieved. The highest amount of IFN-β that still led to a positive response of the LPC and the HPC was defined as drug tolerance level (one for the LPC and the HPC, respectively).
Robustness
Robustness is an indication of the reliability of an assay, assessed by the capacity of the assay to remain unaffected by small but deliberate variations in method parameters. The response of the NC, the LPC, and the HPC were assessed, and relevant assay steps (coating, blocking, sera spiking with soluble IFN-β, sample incubation, incubation with biotinylated IFN-β, incubation with Streptavidin-HRP) of the presented ELISA were tested by varying incubation times and measuring their influence. Optical densities were compared and analyzed (expressed in %) with reference to the results obtained under the standard conditions given in Table 1. Variations below 30% were accepted.
Stability
Short-term stability (4 and 24 h at RT), freeze–thaw stability (up to five freeze thaw cycles), and long-term stability (up to 6 months) were tested using the LPC and the HPC. For all the conditions tested and for each control, three individual batches were prepared. All data were measured in triplicates.
Results
Assay Development and Optimization
Optimization experiments defined optimal coating condition, reagent concentrations, and the MRD. The results are listed in Table 2.
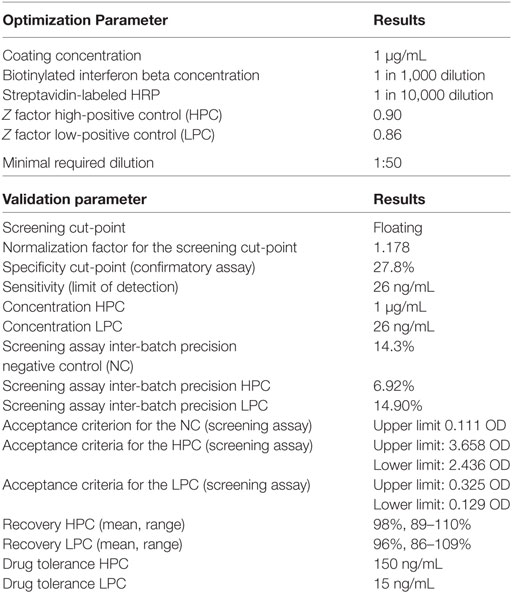
Table 2. Overview of key assay parameters.
Validation Results
Screening Cut-Point
The log-transformed values of the nine cut-point runs were more symmetric when compared with the linear data (linear: mean w value: 0.93, mean skewness absolute: 0.65; log-tranformed: mean w value: 0.95, mean skewness absolute: 0.50), thus calculations were performed on the log-scale. The mean OD in these runs was 0.064 (−1.191 for log-transformed data) (Figure 2). The pooled weighted variance was calculated to be 0.0025, resulting in a SD for cut-point calculation of 0.0503. Consequently, the cut-point was calculated as follows:
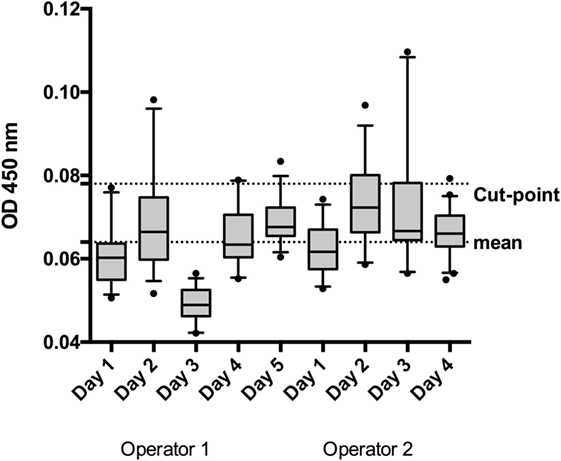
Figure 2. To establish the screening cut-point, 50 individual normal human sera (individual sera) were analyzed by 2 operators on 5 or 4 days, depending on the operator. The box and whisker represent the mean and 95% CI for each run.
The mean response for the NC (2 operators, 5 or 4 runs depending on the operator, 3 plates per run) was determined to be an OD of 0.0662. Linear fit of the mean response of the independent NCs of each run versus the mean of the individual sample response showed the suitability of the NC for use as a NF (Figure 3, R2 = 0.88). The NF was calculated to be 1.178 (0.078/0.0662). The NF multiplied by the response for the NC is used to set the plate specific, screening cut-point.
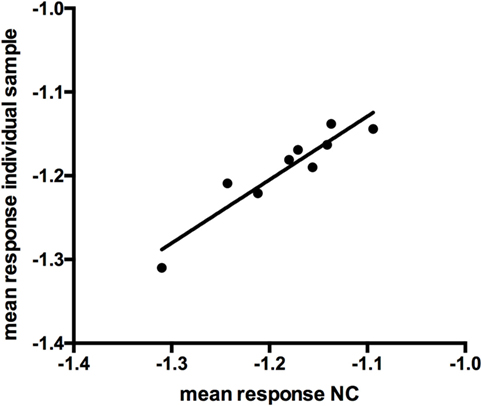
Figure 3. Linear fit of log-transformed OD values at negative control (NC) and individual sample response (r = 0.876).
Specificity Cut-Point
When assessing the total mean of the percentage of inhibition in the 50 individual sera on 4/5 different days (depending the operator), linear data were more symmetric [linear: mean w value: 0.95, mean skewness (absolute): 0.45; log-transformed: mean w value: 0.87, mean skewness (absolute): 1.19], thus, all calculations were performed on the linear scale. The total mean of the percentage of inhibition was determined to be −2.52% (Figure 4). The pooled weighted variance was calculated to be 169.97%, resulting in a SD for cut-point calculation of 13.04%. Consequently, the specificity cut-point was calculated as follows:
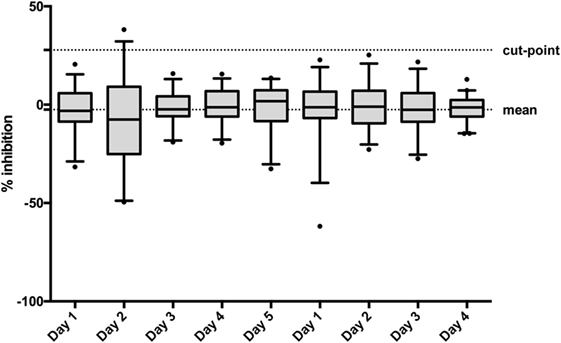
Figure 4. To establish the confirmatory assay cut-point, 50 individual normal human sera (individual sera) were analyzed on 5 or 4 days by two operators. The box and whisker represents the mean and 95% CI for each run.
Specificity
The specificity of the assay was confirmed since the soluble unlabeled concentrations of IFN-β were able to significantly inhibit the response of the HPC, while related molecules such as IFN-alpha, IFN-gamma, and IL-2 did not show a relevant inhibitory effect (Table 3).
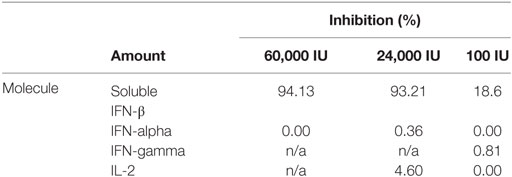
Table 3. Specificity demonstrated by inhibition potential of interferon beta (IFN-β) and similar molecules.
Sensitivity
Six serial dilutions of the PC ranging from 1,000 to 0.005 ng/mL spanning the assay cut-point in six assay runs by two operators revealed a mean concentration at assay cut-point of 12.15 ng/mL, with a SD of 7.76 ng/mL. Consequently, the LOD (aiming at a 1% failure rate) was calculated to be 12.12 ng/mL + (2.718 × 7.76 ng/mL) = 33.20 ng/mL (Figure 5).
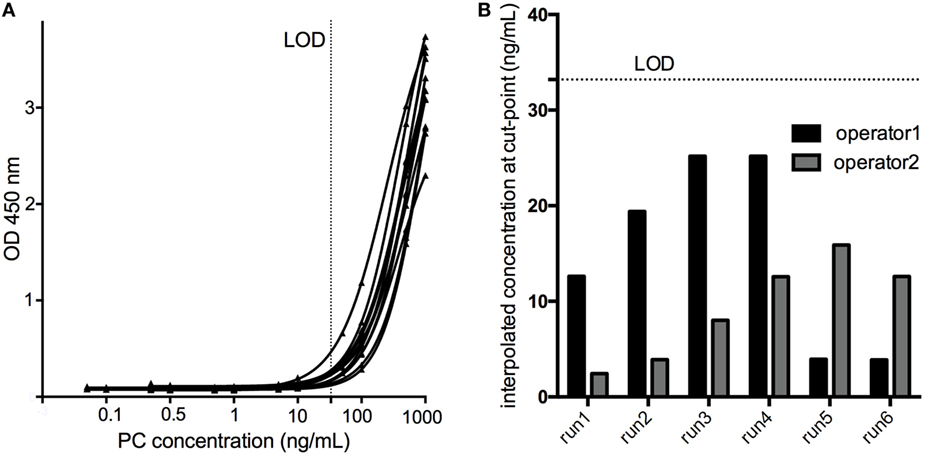
Figure 5. The limit of detection (LOD) of the assay was determined by testing a calibration curve [serial dilutions of the positive control (PC) in pooled human serum ranging from 1000 to 0.005 ng/mL] spanning the cut-point in six assay runs by two operators (A). The concentration of the PC yielding an assay response at the cut-point was interpolated using a 4PL fitting model (B), and the LOD calculated to be 33.20 ng/mL.
Sensitivity Confirmation and Recovery
The response of the LPC with a PC concentration slightly below the calculated LOD (selected at 26 ng/mL during assay optimization) was above the assay cut-point (screening and confirmation) in all individual sera tested, confirming an assay sensitivity at the level of the LPC. This was also shown for concentrations of the PC of 40 and 60 ng/mL (Figure 6). Furthermore, the LPC was detected positive during all the precision runs (54 values). In addition, the mean recovery tested for the HPC and the LPC did fulfill the anticipated range of 70–130% (Table 2), again supporting the determined assay sensitivity. The results also confirmed the selected MRD at 1 in 50 of the samples to be appropriate to minimize matrix effects.
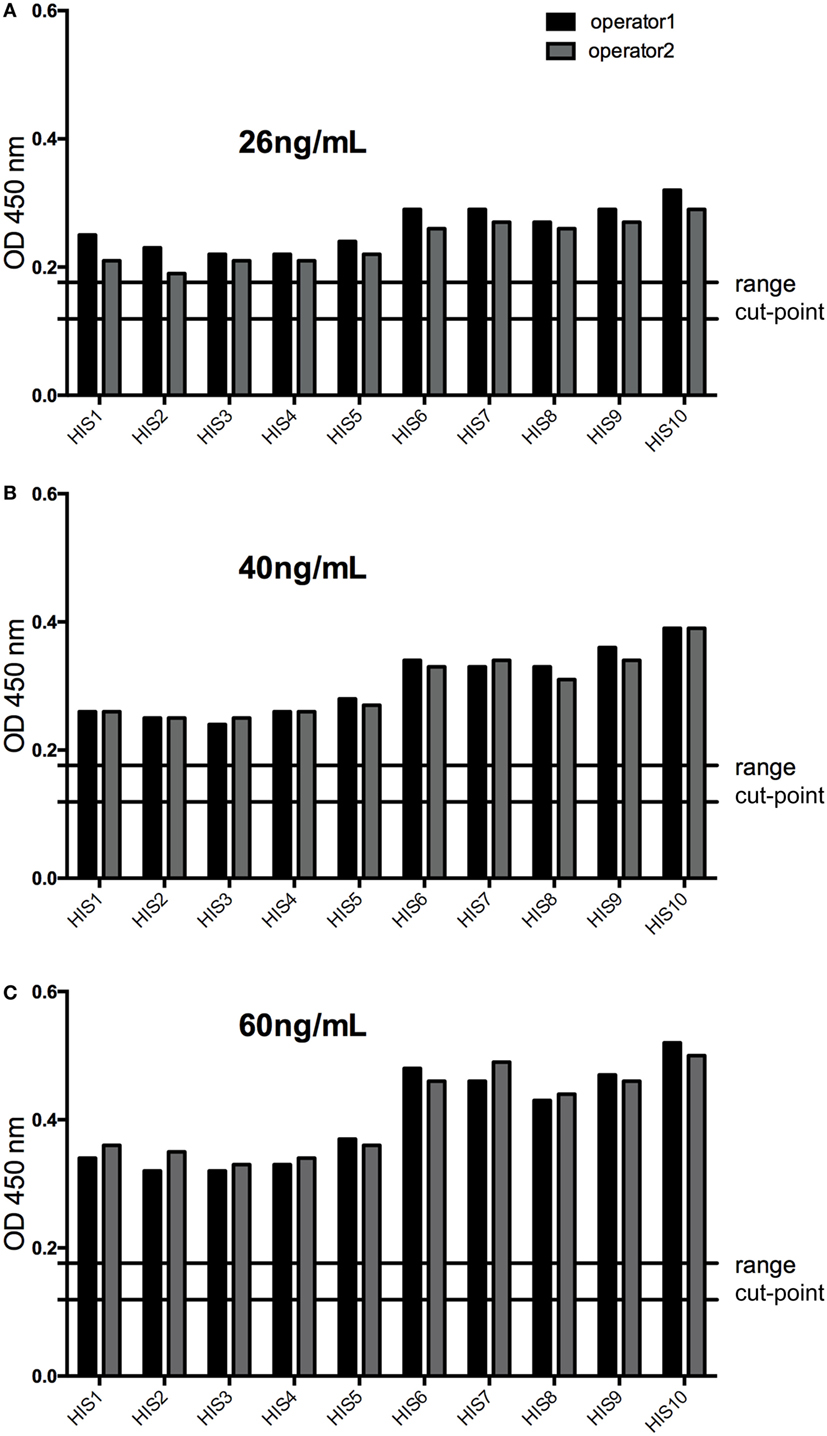
Figure 6. The response of low-positive control (LPC) at 26 ng/mL (A) was above the assay cut-point (screening and confirmation) in all individual sera tested confirming an assay sensitivity at the level of the LPC (slightly below the calculated limit of detection), as well as at 40 ng/mL, (B) and at 60 ng/mL (C) of the positive control antibody. HIS, human individual serum; cut-point range: maximal and minimal floating cut-point of the runs of this experiment.
Assay Precision and Acceptance Criteria
Precision and acceptance criteria for the controls used were assessed. For the NC, the intra-batch precision of the screening assay ranged from 2.8 to 32.0%. The inter-batch precision and the upper limit for the NC were calculated as listed in Table 2. The intra-batch precision of the screening assay for the HPC ranged from 2.1 to 17.6%, and for the LPC, from 9.8 to 31.3%. The inter-batch and the upper and lower limits of the PCs are found in Table 2. The precision of the confirmatory assay for the HPC ranged from 0.14 to 3.19%, and the acceptance criteria were calculated at 94.54–98.62% inhibition for the HPC. The precision of the confirmatory assay for the LPC ranged from 6.38 to 18.23%, and the acceptance criteria were calculated at 53.65–76.58% inhibition for the LPC.
Drug Interference
For the HPC, the assay can tolerate the presence of 150 ng/mL IFN-β, for the LPC, 15 ng/mL (Figure 7).
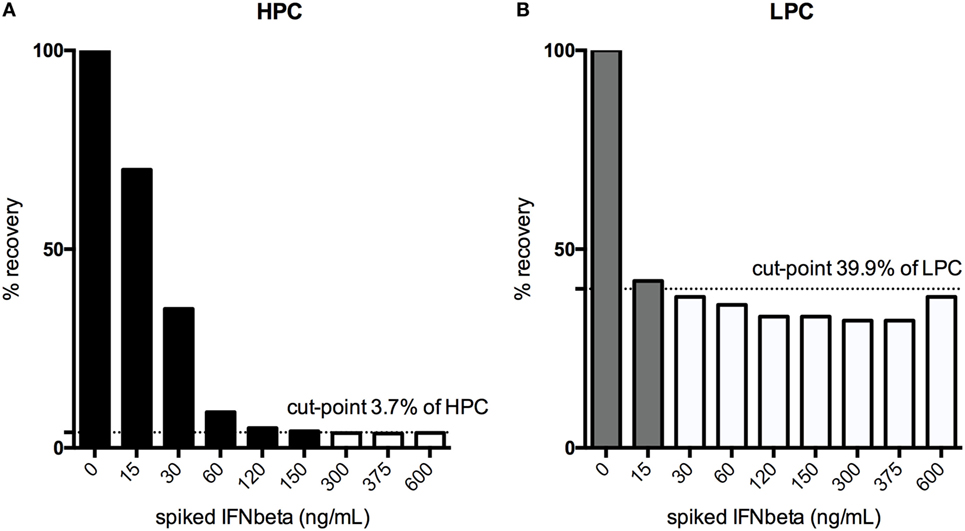
Figure 7. Drug interference was tested by spiking both the high-positive control (HPC), (A) and the low-positive control (LPC), (B) with increasing amounts of interferon (IFN)-β until a signal below the floating cut-point was achieved. % recovery relative to the unspiked HPC or LPC is illustrated. Black bars indicate drug concentrations that lead to a positive response, while the white bars show the drug concentrations that result in negative testing results.
Robustness
Variations in coating and blocking conditions, or sample incubation times resulting in changes to OD values below 30%, were judged acceptable. Coating times were tested overnight at 4°C (standard) and 12 days at −20°C, blocking times were extended from 60 (standard) to 90 or 120 min. Spiking times with IFN-β (0.3 µg/mL) were tested from 45, 60 (standard), and 65 min at 37°C, sample incubation times and incubation of HRP-labeled streptavidin at 55, 60 (standard), and 70 min. Incubation with biotinylated IFN-β was assessed for 55, 60 (standard), and 75 min, with optimal results for the standard time. All variations resulted in OD changes below 30%, supporting robustness of the assay.
Stability
The storage of samples at −20°C for a period of 3 and 6 months did not result in any significant changes of OD values compared to freshly prepared samples confirming stability of the samples for up to 6 months at −20°C.
Conclusion
A method for the detection of binding anti-IFN-β antibodies in human serum was validated according to published recommendations (7). To reduce the false positive rate and to increase specificity, a two-tiered approach including a second confirmatory immune competition step has been developed. The assay is considered to be ultrasensitive, as it can reliably detect 26 ng/mL of the polyclonal PC of rabbit origin in human serum, which exceeds generally accepted ranges of 250–500 ng/mL in serum for antibody assays in clinical studies (15). The calculated drug tolerance for the polyclonal non-human PC antibody in this assay of 15–150 ng/mL is far above the peak serum concentration of 0.4 ng reached after an injection of, e.g., IFN-β i.m. in healthy volunteers,3 suggestive of the assay being insensitive to residual amounts of drug in clinical samples. Nonetheless, further studies may be warranted, as a drug tolerance assessment using the polyclonal non-human PC antibody can only partly mimic drug interference in true clinical samples, in particular, since the individual ADA repertoire may vary (11).
Overall, this assay has appropriate performance characteristics, which should be further assessed for suitability in clinical trials and clinical routine testing. Within the ABIRISK consortium, this assay will be used for testing for the development of anti-IFN-β antibodies in patient samples prospectively collected after start of therapy with IFN-β and compared with the results from bioassays used for the detection of antibodies with neutralizing capacity (8). Furthermore, newly developed and unique monoclonal anti-IFN-β antibodies of human origin will be tested, and the assay sensitivity and drug tolerance reassessed for this PC. The assay will also help to address genetic regulation of ADA responses (16–19) and prediction of immunogenicity (20, 21). The unique setting of ABIRISK, a study group that spans across different indications, will allow the comparison, for instance, of ex vivo phenotyping patterns with regards to their predictive value for ADA formation in several diseases, including MS, rheumatoid arthritis, and hemophilia (see text footnote 2). Improvement in methods and a deeper understanding of immunogenicity may ultimately enable us to link ADA formation to a clinical loss of response (6, 22–25), thus improving clinical care, and reducing socioeconomic costs (26, 27). We believe that ADA testing in MS may be of growing relevance, considering the recent registration of numerous alternative drugs with a varying mode of action. While these alternative treatments, such as monoclonal antibodies daclizumab, alemtuzumab, and ocrelizumab may also elicit ADA responses not yet sufficiently been studied with regards to loss of efficacy or safety, a proportion of patients with mild to moderate forms of MS will continue to be treated with IFN-β despite the occurrence of ADA and the loss of bioactivity of the drug. Considering the therapeutic alternatives that have recently become available, this should be avoided by applying reliable methods, such as the one presented here, to screen for ADA formation as part of good routine clinical practice, representing a first step toward precision medicine in MS. Such an approach is also highly relevant to the other BPs currently under development for the treatment of MS (28).
Ethics Statement
A human serum mixed gender pool has been purchased from Sera Laboratories International Ltd., UK. Individual human serum samples derived from 10 healthy donors, and 40 IFN-β treatment naïve MS patients. The Regional Ethical Review Boards approved the use of MS patient samples, and all blood donors gave written informed consent.
Author Contributions
Study concept and design: KI, DK, PJ, MP, BK, MR, CH, FD, PC, AF-H, and CW. Acquisition and analysis of data: KI, PJ, PC, and CW. Statistical analysis: KI, DK, and CW. Drafting of manuscript: KI and CW. Critical revision of the manuscript for important intellectual content: all authors.
Conflict of Interest Statement
KI, PJ, CH, and MP: nothing to disclose. DK: employee of Sanofi-Aventis. MR: has received funding and speaking honoraria from Biogen Idec. FD: has participated in meetings sponsored by or received honoraria for acting as an advisor/speaker for Bayer Healthcare, Biogen Idec, Genzyme-Sanofi, Merck, Novartis Pharma, Roche, Seaton, and Teva-Ratiopharm. He is section editor of the MSARD Journal (Multiple Sclerosis and Related Disorders). TM: has received speaker honoraria from Bayer Healthcare, Biogen, Genzyme, Merck Serono, Novartis, Roche and Teva and has received travel grants from Biogen and Teva. H-PH: has received honoraria for consulting and speaking at symposia from Bayer, Biogen Idec, Genzyme, Merck Serono, Novartis Pharma, Roche, and Teva Sanofi-Aventis. BK: has received honoraria for lecturing, travel expenses for attending meetings, and financial support for research from Bayer Health Care, Biogen, Genzyme/Sanofi Aventis, Grifols, Merck Serono, Mitsubishi Europe, Novartis, Roche, Talecris, and TEVA. He is currently also an employee of Biogen. EB: an employee of Merck. PC: currently employed by UCB. AF-H: has received funding and speaking honoraria from Biogen Idec and Pfizer. CW: consulting and/or research funding: Bayer, Biogen, Novartis, TEVA.
Funding
The study was performed as part of the Innovative Medicines Initiative Joint Undertaking under grant agreement No. 115303, resources of which are composed of financial contribution from the European Union’s Seventh Framework Program (FP7/2007–2013) and EFPIA companies’ in kind contribution. CW received additional research support from the Hertie foundation (P1150063) and the Charcot foundation. We highly appreciate the technical support provided by Annette Hess and Marcia Gasis with this work.
Footnotes
References
1. Bachelet D, Hässler S, Mbogning C, Link J, Ryner M, Ramanujam R, et al. Occurrence of anti-drug antibodies against interferon-beta and natalizumab in multiple sclerosis: a collaborative cohort analysis. PLoS One (2016) 11:e0162752. doi:10.1371/journal.pone.0162752
2. Hartung HP, Kieseier B, Goodin DS, Arnason BG, Comi G, Cook S, et al. Variability in detection and quantification of interferon β-1b-induced neutralizing antibodies. J Neuroinflammation (2012) 9:129. doi:10.1186/1742-2094-9-129
3. Link J, Ramanujam R, Auer M, Ryner M, Hässler S, Bachelet D, et al. Clinical practice of analysis of anti-drug antibodies against interferon beta and natalizumab in multiple sclerosis patients in Europe: a descriptive study of test results. PLoS One (2017) 12:e0170395. doi:10.1371/journal.pone.0170395
4. Warnke C, Olsson T, Hartung HP. PML: the dark side of immunotherapy in multiple sclerosis. Trends Pharmacol Sci (2015) 36:799–801. doi:10.1016/j.tips.2015.09.006
5. Warnke C, Kieseier BC, Hartung HP. Biotherapeutics for the treatment of multiple sclerosis: hopes and hazards. J Neural Transm (Vienna) (2013) 120(Suppl 1):S55–60. doi:10.1007/s00702-013-1055-4
6. Polman CH, Bertolotto A, Deisenhammer F, Giovannoni G, Hartung HP, Hemmer B, et al. Recommendations for clinical use of data on neutralising antibodies to interferon-beta therapy in multiple sclerosis. Lancet Neurol (2010) 9:740–50. doi:10.1016/S1474-4422(10)70103-4
7. Rup B, Pallardy M, Sikkema D, Albert T, Allez M, Broet P, et al. Standardizing terms, definitions and concepts for describing and interpreting unwanted immunogenicity of biopharmaceuticals: recommendations of the Innovative Medicines Initiative ABIRISK consortium. Clin Exp Immunol (2015) 181:385–400. doi:10.1111/cei.12652
8. Hermanrud C, Ryner M, Luft T, Jensen PE, Ingenhoven K, Rat D, et al. Development and validation of cell-based luciferase reporter gene assays for measuring neutralizing anti-drug antibodies against interferon beta. J Immunol Methods (2016) 430:1–9. doi:10.1016/j.jim.2016.01.004
9. Gupta S, Indelicato SR, Jethwa V, Kawabata T, Kelley M, Mire-Sluis AR, et al. Recommendations for the design, optimization, and qualification of cell-based assays used for the detection of neutralizing antibody responses elicited to biological therapeutics. J Immunol Methods (2007) 321:1–18. doi:10.1016/j.jim.2006.12.004
10. Gupta S, Devanarayan V, Finco D, Gunn GR, Kirshner S, Richards S, et al. Recommendations for the validation of cell-based assays used for the detection of neutralizing antibody immune responses elicited against biological therapeutics. J Pharm Biomed Anal (2011) 55:878–88. doi:10.1016/j.jpba.2011.03.038
11. Shankar G, Devanarayan V, Amaravadi L, Barrett YC, Bowsher R, Finco-Kent D, et al. Recommendations for the validation of immunoassays used for detection of host antibodies against biotechnology products. J Pharm Biomed Anal (2008) 48:1267–81. doi:10.1016/j.jpba.2008.09.020
12. FDA. Guidance for Industry. Immunogenicity Assessment for Therapeutic Protein Products. (2014). p. 1–39. Available from: https://www.fda.gov/downloads/drugs/guidances/ucm338856.pdf
13. European Medicines Agency. Guideline on Immunogenicity Assessment of Biotechnology-Derived Therapeutic Proteins. (2015). p. 1–23. Available from: http://www.ema.europa.eu/docs/en_GB/document_library/Scientific_guideline/2015/10/WC500194507.pdf
14. Zhang J, Chung T, Oldenburg K. A simple statistical parameter for use in evaluation and validation of high throughput screening assays. J Biomol Screen (1999) 4:67–73. doi:10.1177/108705719900400206
15. Mire-Sluis AR, Barrett YC, Devanarayan V, Koren E, Liu H, Maia M, et al. Recommendations for the design and optimization of immunoassays used in the detection of host antibodies against biotechnology products. J Immunol Methods (2004) 289:1–16. doi:10.1016/j.jim.2004.06.002
16. Hoffmann S, Cepok S, Grummel V, Lehmann-Horn K, Hackermüller J, Hackermueller J, et al. HLA-DRB1*0401 and HLA-DRB1*0408 are strongly associated with the development of antibodies against interferon-beta therapy in multiple sclerosis. Am J Hum Genet (2008) 83:219–27. doi:10.1016/j.ajhg.2008.07.006
17. Lundkvist M, Greiner E, Hillert J, Fogdell-Hahn A. Multiple sclerosis patients lacking oligoclonal bands in the cerebrospinal fluid are less likely to develop neutralizing antibodies against interferon beta. Mult Scler (2010) 16:796–800. doi:10.1177/1352458510373112
18. Link J, Lundkvist Ryner M, Fink K, Hermanrud C, Lima I, Brynedal B, et al. Human leukocyte antigen genes and interferon beta preparations influence risk of developing neutralizing anti-drug antibodies in multiple sclerosis. PLoS One (2014) 9:e90479. doi:10.1371/journal.pone.0090479
19. Buck D, Cepok S, Hoffmann S, Grummel V, Jochim A, Berthele A, et al. Influence of the HLA-DRB1 genotype on antibody development to interferon beta in multiple sclerosis. Arch Neurol (2011) 68:480–7. doi:10.1001/archneurol.2011.65
20. De Groot AS, Scott DW. Immunogenicity of protein therapeutics. Trends Immunol (2007) 28:482–90. doi:10.1016/j.it.2007.07.011
21. Shankar G, Pendley C, Stein KE. A risk-based bioanalytical strategy for the assessment of antibody immune responses against biological drugs. Nat Biotechnol (2007) 25:555–61. doi:10.1038/nbt1303
22. Hartung H-P, Freedman MS, Polman CH, Edan G, Kappos L, Miller DH, et al. Interferon β-1b-neutralizing antibodies 5 years after clinically isolated syndrome. Neurology (2011) 77:835–43. doi:10.1212/WNL.0b013e31822c90d7
23. Gibbs E, Karim ME, Oger J; Steering Committee of the BENEFIT Study. Antibody dissociation rates are predictive of neutralizing antibody (NAb) course: a comparison of interferon beta-1b-treated Multiple Sclerosis (MS) patients with transient versus sustained NAbs. Clin Immunol (2015) 157:91–101. doi:10.1016/j.clim.2014.12.005
24. Kappos L, Clanet M, Sandberg-Wollheim M, Radue EW, Hartung H-P, Hohlfeld R, et al. Neutralizing antibodies and efficacy of interferon beta-1a: a 4-year controlled study. Neurology (2005) 65:40–7. doi:10.1212/01.wnl.0000171747.59767.5c
25. Polman C, Kappos L, White R, Dahlke F, Beckmann K, Pozzilli C, et al. Neutralizing antibodies during treatment of secondary progressive MS with interferon beta-1b. Neurology (2003) 60:37–43. doi:10.1212/WNL.60.1.37
26. Walter E, Deisenhammer F. Socio-economic aspects of the testing for antibodies in MS-patients under interferon therapy in Austria: a cost of illness study. Mult Scler Relat Disord (2014) 3:670–7. doi:10.1016/j.msard.2014.09.003
27. Paolicelli D, Iannazzo S, Santoni L, Iaffaldano A, Di Lecce V, Manni A, et al. The cost of relapsing-remitting multiple sclerosis patients who develop neutralizing antibodies during interferon beta therapy. PLoS One (2016) 11:e0159214. doi:10.1371/journal.pone.0159214
28. Song A, Hendricks R, Chung S, Wang Q, Chin P, Garren H. Immunogenicity with repeated dosing of ocrelizumab in patients with multiple sclerosis (P2.087). Neurology (2016) 86(16). Available at: neurology.org/content/86/16_Supplement/P2.087.abstract
Keywords: multiple sclerosis, anti-drug antibodies, interferon beta, enzyme-linked immunosorbent assay, biotherapy
Citation: Ingenhoven K, Kramer D, Jensen PE, Hermanrud C, Ryner M, Deisenhammer F, Pallardy M, Menge T, Hartung H-P, Kieseier BC, Bertotti E, Creeke P, Fogdell-Hahn A and Warnke C (2017) Development and Validation of an Enzyme-Linked Immunosorbent Assay for the Detection of Binding Anti-Drug Antibodies against Interferon Beta. Front. Neurol. 8:305. doi: 10.3389/fneur.2017.00305
Received: 02 December 2016; Accepted: 13 June 2017;
Published: 06 July 2017
Edited by:
Robert Weissert, University of Regensburg, GermanyReviewed by:
Mark Stettner, University Hospital Essen, GermanyJennifer Maynard, University of Texas at Austin, United States
Copyright: © 2017 Ingenhoven, Kramer, Jensen, Hermanrud, Ryner, Deisenhammer, Pallardy, Menge, Hartung, Kieseier, Bertotti, Creeke, Fogdell-Hahn, Warnke. This is an open-access article distributed under the terms of the Creative Commons Attribution License (CC BY). The use, distribution or reproduction in other forums is permitted, provided the original author(s) or licensor are credited and that the original publication in this journal is cited, in accordance with accepted academic practice. No use, distribution or reproduction is permitted which does not comply with these terms.
*Correspondence: Clemens Warnke, clemenswarnke@googlemail.com
†The list of participants can be found online: http://www.abirisk.eu/participants.html