 Alba Ayala1
 José Matías Triviño-Juárez2
 Maria João Forjaz3*
 Carmen Rodríguez-Blázquez4
 José-Manuel Rojo-Abuin5
 Pablo Martínez-Martín4 On Behalf of the ELEP Project Members
- 1Centre for Human and Social Sciences, Spanish Scientific Research Council (CCHS, CSIC) and Red de Investigación en Servicios de Salud en Enfermedades Crónicas (REDISSEC), Madrid, Spain
- 2West Health District, Primary Care Center Francia, Madrid Health Service, Madrid, Spain
- 3Epidemiology and Biostatistics Department, National School of Public Health, Institute of Health Carlos III and Red de Investigación en Servicios de Salud en Enfermedades Crónicas (REDISSEC), Madrid, Spain
- 4National Center of Epidemiology and Centro de Investigación Biomédica en Red sobre Enfermedades Neurodegenerativas (CIBERNED), Institute of Health Carlos III, Madrid, Spain
- 5Institute of Economics, Geography and Demography, Centre for Human and Social Sciences, Spanish National Research Council (CSIC), Madrid, Spain
Objective: The aim of this study is to present a predictive model of Parkinson’s disease (PD) global severity, measured with the Clinical Impression of Severity Index for Parkinson’s Disease (CISI-PD).
Methods: This is an observational, longitudinal study with annual follow-up assessments over 3 years (four time points). A multilevel analysis and multiple imputation techniques were performed to generate a predictive model that estimates changes in the CISI-PD at 1, 2, and 3 years.
Results: The clinical state of patients (CISI-PD) significantly worsened in the 3-year follow-up. However, this change was of small magnitude (effect size: 0.44). The following baseline variables were significant predictors of the global severity change: baseline global severity of disease, levodopa equivalent dose, depression and anxiety symptoms, autonomic dysfunction, and cognitive state. The goodness-of-fit of the model was adequate, and the sensitive analysis showed that the data imputation method applied was suitable.
Conclusion: Disease progression depends more on the individual’s baseline characteristics than on the 3-year time period. Results may contribute to a better understanding of the evolution of PD including the non-motor manifestations of the disease.
Introduction
Parkinson’s disease (PD) is a neurodegenerative, chronic, progressively disabling, and incurable disease, which occurs in about 2% of the population over 65 years old (1). From a clinical perspective, it is characterized by the onset of motor symptoms such as tremor, rigidity, bradykinesia, postural instability, and gait alterations (2).
In addition, PD presents a broad range of non-motor symptoms, which are equally or even more disabling than motor symptoms, appearing early stages of the disease or even in before diagnosis (3). Some non-motor symptoms are sleep alterations, mood and perception changes, attention and memory problems, cardiovascular and gastrointestinal disorders, fatigue, urinary, and sexual function disorders (3).
Scales have been developed to measure specific aspects of PD, focusing on motor and non-motor symptoms. However, there are less global indices that provide a general view of the patient’s condition (4). A clinimetric index, the Clinical Impression of Severity Index of Parkinson’s Disease (CISI-PD) was published in 2006 (4). This index provides information about the degree of severity of the patient which completes and summarizes the data obtained from other scales (5). Moreover, its simplicity and ease of use make it a very helpful tool in both clinical practice and research (5).
The CISI-PD may be considered an appropriate assessment of PD global severity. A recent study has demonstrated that this index performed better than other frequently used global evaluations coming from clinicians (CGIS) and patients (PGIS) (6). In comparison with the Hoehn and Yahr (HY), the CISI-PD correlated at a similar level with other measures of PD severity but offers specific information on four important aspects of the disease and is more precise (range of score: 0–24).
An international and multicenter study carried out to validate the CISI-PD showed that the main cross-sectional determinant factors of disease severity were the patient’s motor condition, disease duration, depression and, to a lesser extent, age and comorbidity (5). However, there is a lack of longitudinal studies using the CISI-PD that would allow finding its main predictors.
To address this deficit, we conducted a longitudinal study to assess how the evaluation of PD global severity, measured by the CISI-PD, changed over time. In addition, we developed a model of global severity to know which motor and non-motor baseline variables could predict PD global severity at 1, 2, and 3 years.
Materials and Methods
Design
This was a multicenter, national, observational, and longitudinal study, with a baseline assessment and annual evaluations over 3 years, and a total of four time points. The data collection involved a total of 23 neurologists from 21 hospitals distributed all over Spain.
Participants
A sample was selected from patients seen consecutively in the neurology or movement disorder departments of various hospitals in Spain. The following inclusion criteria were applied: age equal or above 30 years; idiopathic PD diagnosis carried out by neurologists’ expert in movement disorders, according to the modified criteria of the Brain Bank of the UK Parkinson’s Disease Society (7); and having signed informed consent. Exclusion criteria were the presence of medical or psychiatric comorbidity that would hinder an adequate assessment of PD.
This study was carried out in accordance with the recommendations of Research Ethics Committee of the Carlos III Health Institute and the Clinical Research Ethics Committee of the La Princesa Hospital, Madrid. All subjects gave written informed consent in accordance with the Declaration of Helsinki.
The baseline evaluation included 389 patients with idiopathic PD and 205 completed the follow-up. The causes for case loss at follow-up were as follows: 52 due to inability of researchers to continue; 21 patients refused to remain in the study; 12 patients died; 10 patients moved; 7 patients changed diagnosis; 9 patients dropped out for other reasons (2 could not attend the visits; 2 developed a cognitive impairment; 2 and other comorbidities that prevented follow-up; 2 were impossible to contact; 1 and changed specialist). In 73 cases, there were missing values in some questionnaire items.
Assessments
All assessment instruments were specific for PD, except for the Hospital Anxiety and Depression Scale (HADS) (8) and the questionnaire EQ-5D with three response levels (EQ-5D-3L) (9), which are generic scales. Sociodemographic and clinical characteristics were also recorded, including levodopa equivalent dose (LED) (9). Table S1 in Supplementary Material summarizes the scales applied in the study.
Self-assessment Instruments
The HADS is made of 14 items grouped into two subscales that evaluate the presence of anxiety and depression (8). Items are scored from 0 (no problem) to 3 (severe problem), and a score above 10 in each sub-scale indicates the presence of anxiety or depression, respectively. It can be used in the hospital and community environments, and its validity has been confirmed in patients with PD (10).
The SCales for Outcomes in PArkinson’s disease SCOPA-Sleep (11) is a scale comprising two sections that evaluate night-time sleep (SCOPA-NS) and daytime sleepiness (SCOPA-DS). The SCOPA-Autonomic (SCOPA-AUT) measures autonomic dysfunction in the following areas: gastrointestinal; urinary; cardiovascular; thermoregulatory; pupillomotor; and sexual dysfunction (male or female) (12). It is composed by 25 items, with score ranging from 0 (“never”) to 3 (“often”) and a maximum total score of 69, and the higher score, the worse autonomic dysfunction (13).
The EQ-5D-3L questionnaire is a tool that evaluates health-related quality of life and health status (9). It provides an index whose value may range from 0, representing death, and 1, representing the best health status, and it may have negative values that would represent a state “worse than death.” In addition, the EQ-5D-3L questionnaire contains a visual analog scale (EQ-VAS) assessing current health status. It is a useful scale in patients with PD (14, 15).
Instruments Administered by the Neurologist
The SCOPA-Cognition (SCOPA-COG) assesses four cognitive domains that are typically affected by the disease: memory (four items); attention (two items); executive function (three items); and visuospatial function (one item) (16). The maximum total score is 43, and a higher score reflects a better performance (16). The Parkinson’s Psychosis Rating Scale modified (PPRSm) is a scale that assesses the presence of psychotic symptoms in PD and comprises six items. Each item scores from 0 (“absent”) to 3 (“severe”), and the higher score, the more severe the symptoms (17–19). The SCOPA-Motor is a tool that assesses the motor aspects of the disease and contains 21 items grouped in 3 sections (20): motor exploration (SCOPA-Motor EM), with 10 items; ADL (SCOPA-Motor ADL), made up of 7 items; and motor complications (SCOPA-Motor COMP) that contains 4 items. All items score range from 0 (“normal”) to 3 (“severe”), and the higher score, the greater the severity (20).
The CISI-PD is a clinimetric index that reflects the neurologist’s impression of the patient’s severity. It comprises four items (motor signs, disability, motor complications, and cognitive state) that are assessed by the neurologist after interview and clinical exam (4, 5). Each item ranges from 0 (“normal”) to 6 (“severe”); an index is obtained from the sum of these scores, ranging 0–24. Values of 1–7 represent mild disease, 8–14 moderate, and 15 or above severe PD (5).
The HY classification assesses motor alteration and disability in five stages. Stage 1 is mild, with unilateral symptoms and stage 5 is the most severe, when the patient is bedridden or confined to a wheelchair (21).
Data Analysis
First, we assessed whether there were important differences between individuals with and without missing data at follow-up (22). For this purpose, chi-square and t-tests were applied comparing the groups that did and did not complete the study. The difference in the scores between time 0 (baseline) and time 3 (third follow-up), taking only these two time points, was analyzed using paired-sample t-test or the Wilcoxon test (depending on whether or not they followed a normal distribution, respectively). Tables 1 and 2 list all variables assessed.
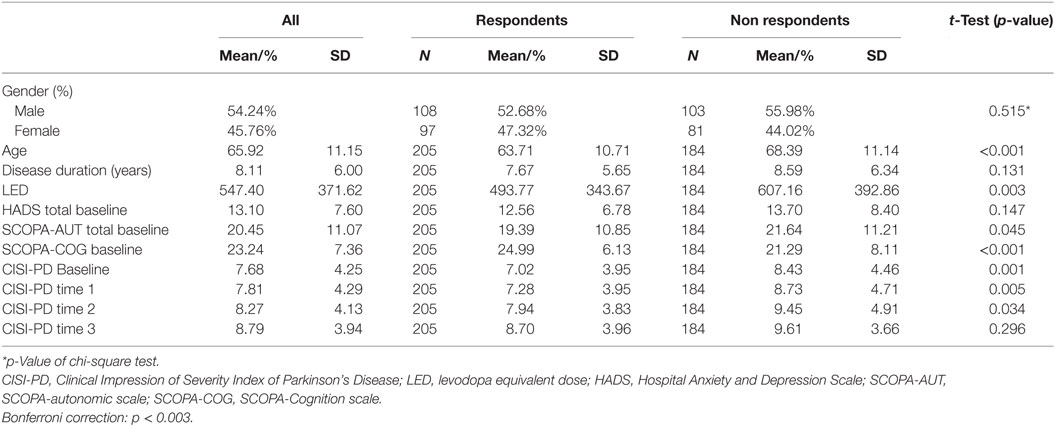
Table 1. Descriptive analysis: complete vs. incomplete cases.
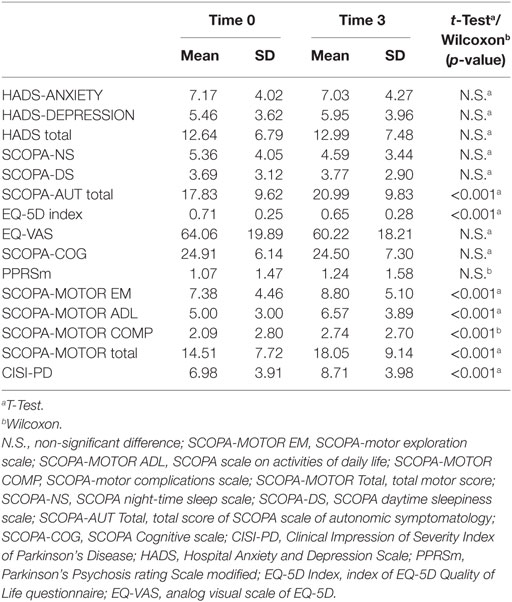
Table 2. Changes in clinical variables between baseline and time 3 (n = 205).
The changes in CISI-PD scores were studied with analysis of variance for repeated measures, taking time as a factor. All previous analysis were adjusted for multiple comparisons using the Bonferroni method (statistical significance p < 0.003). In addition, the effect size (d) was calculated to describe the magnitude of change of the CISI-PD throughout the study period. It was defined as the mean difference divided by the SD of baseline scores. In accordance with Cohen’s criteria, the magnitude of change was considered small if, when expressed as an absolute value, it fell between 0.2 ≤ d < 0.5; moderate, 0.5 ≤ d < 0.8; and large, d ≥ 0.8 (23).
To analyze the individual change in PD global severity (CISI-PD score), and taking into consideration the two-level hierarchical structure of the data, we performed a multilevel linear regression with random effects. Level 1 was made up of repeated measures and described each individual’s evolution over time, based on the following categories: T0 = baseline; T1 = 1 year; T2 = 2 years; T3 = 3 years of follow-up. Level 2, made up of individuals, described the change in the trajectories between individuals and identified factors, which explain the differences between them (24). The first step entailed performance of a non-conditional or empty multilevel model, which contained no predictors. The second step involved the creation of a predictive model including the following variables measured at baseline: global severity status of the disease (CISI-PD), neuro-psychiatric measurements (HADS Total, PPRSm, SCOPA-COG, SCOPA-Sleep), psychosocial measurements (EQ-5D-3L index), sociodemographic variables (age and sex), and clinical variables (disease duration; LED; EQ-VAS; SCOPA-Motor EM items bradykinesia, rigidity, tremor, and axial; and SCOPA-AUT). Since there were only three separate follow-up points in time, time was introduced in the model as a discrete variable.
We calculated the intraclass correlation coefficient (ICC) for both the empty and the predictive model, providing information on the proportion of variance due to differences across individuals. A stepwise backward regression (criterion: p < 0.05) was applied to remove the non-significant variables from the predictive model to get a model that meets the principle of parsimony, while ensuring absence of collinearity. This regression model presented 30.30% of losses in the outcome variable and 3.12% in the rest of variables with missing values. Missing data on CISI-PD at each of the follow-up time point was: time 1, 17.2%; time 2, 32.4%; and time 3, 41.4%.
To deal with the possible bias resulting from patients lost to follow-up, data imputation was used on 33.42% of the cases (25). Due to the missing values that were found in the outcome variable (CISI-PD at follow-up), a “multiple imputation, then deletion” (MID) procedure was developed (26, 27). In this method, the cases with imputed outcome variable are excluded. In addition, a sensitivity analysis was performed to assess the suitability of the imputation models. For this purpose, MID was compared with a model with missing values and a multiple imputation by chained equations, expecting similar results in the three models.
The predictions were obtained through Monte Carlo simulation. Also, the mean absolute error and the mean square error between observed and predicted values were calculated, using the same sample size, to measure the accuracy of the models. The adjusted coefficient of determination (adjusted R2) assessed the fit of the data to the statistical analysis. We also compared the predicted and observed values through visual inspection of the scatter-plot for the three time points.
Finally, we calculated the estimated means of CISI-PD in the time points and observed the linear trend through an analysis of co-variance for repeated measures, adjusting for the variables selected in the multilevel stepwise regression.
Table S2 in Supplementary Material summarizes the steps followed in data analysis. The SPSS version 22 was used for data analysis and Stata version 14 for predictive and multiple imputation models.
Results
In the baseline sample (n = 389), 54.20% (n = 211) of patients were male, the mean age was 65.92 (SD: 11.15) years, and 80.50% (n = 313) were married. The mean years of education were 10.06 (SD: 5.63), and 54% (n = 208) were retired. The average PD duration was 8.11 (SD: 6.00) years. About 5.9% of patients (n = 23) were treated with only levodopa, 20.4% (n = 79) with a dopamine agonist and 7.06% (n = 29) took both; the mean of LED was 547.4 (SD: 371.62). The median HY staging was 2, and the distribution of the sample was as follows: stage 1, 25.20% (n = 97); stage 2, 50.10% (n = 193); stage 3, 19.50% (n = 75); stage 4, 4.70% (n = 18); and stage 5, 0.50% (n = 2).
There were significant differences in age, baseline CISI-PD, and SCOPA-COG values between patients with complete or missing values (Table 1). Table 2 shows the changes in the clinical variables from baseline to time 3 experienced by the group that completed the study. The CISI-PD effect size between times 0 and 3 was 0.44.
The non-conditional or empty multilevel model of the CISI-PD dependent variable showed an ICC of 0.816. The MID model (Table 3) was established to estimate the disease global severity (as expressed by the CISI-PD) in times 1, 2, and 3. In addition to CISI-PD at baseline, the following baseline measures were statistical significant CISI-PD predictors: HADS, SCOPA-AUT, and SCOPA-COG. Disease duration, PPRSm, SCOPA-Sleep, EQ-VAS, EQ-5D index, SCOPA-Motor EM items bradykinesia, rigidity, tremor, and axial, age, and sex did not reach statistical significance.
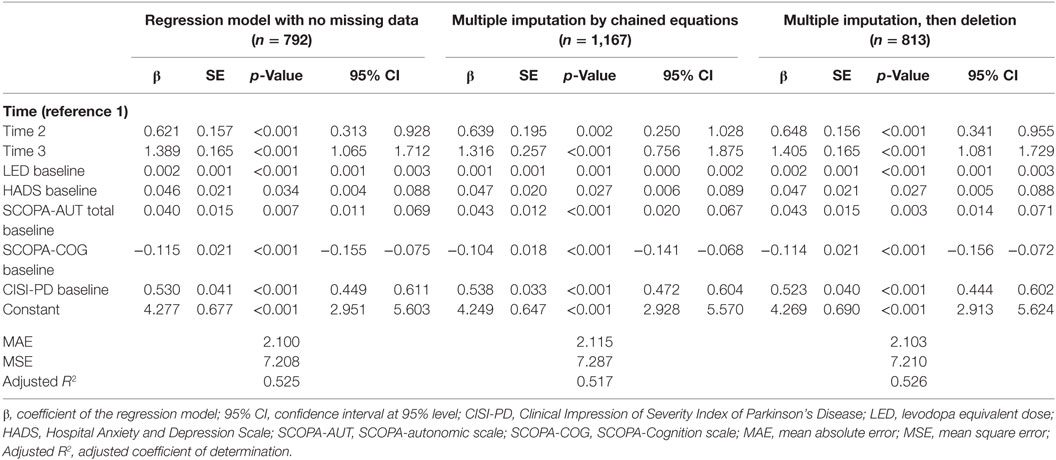
Table 3. Predictive models to estimate the patient’s degree of severity (expressed by the CISI-PD) at times 1, 2, and 3, from baseline values.
The following formula describes the prediction model:
This equation may be used to estimate the CISI-PD value of a person at follow-up. Take the example of a patient with a value of 550 of LED, HADS value of 13, SCOPA-AUT of 20, SCOPA-COG of 25, and CISI-PD at baseline of 8. The value of CISI-PD, after 1 year would be 8.589 (CISI-PDtime 1 = 0 × 0.648 + 0 × 1.405 + 550 × 0.002 + 13 × 0.047 + 20 × 0.043 − 25 × 0.114 + 8 × 0.523 + 4.684); at 2 years 9.237 (CISI-PDtime 2 = 1 × 0.648 + 0 × 1.405 + 550 × 0.002 + 13 × 0.047 + 20 × 0.043 − 25 × 0.114 + 8 × 0.523 + 4.684); and at 3 years 9.994 (CISI-PDtime 3 = 0 × 0.648 + 1 × 1.405 + 550 × 0.002 + 13 × 0.047 + 20 × 0.043 − 25 × 0.114 + 8 × 0.523 + 4.684).
When the covariables described in this formula were entered into the empty model, the ICC was 0.563. All models showed comparable results in the sensitive analysis (Table 3). Figure 1 shows similar results when comparing the prediction of the model and the data obtained, especially for CISI-PD values ranging 5–10 (mild to moderate).
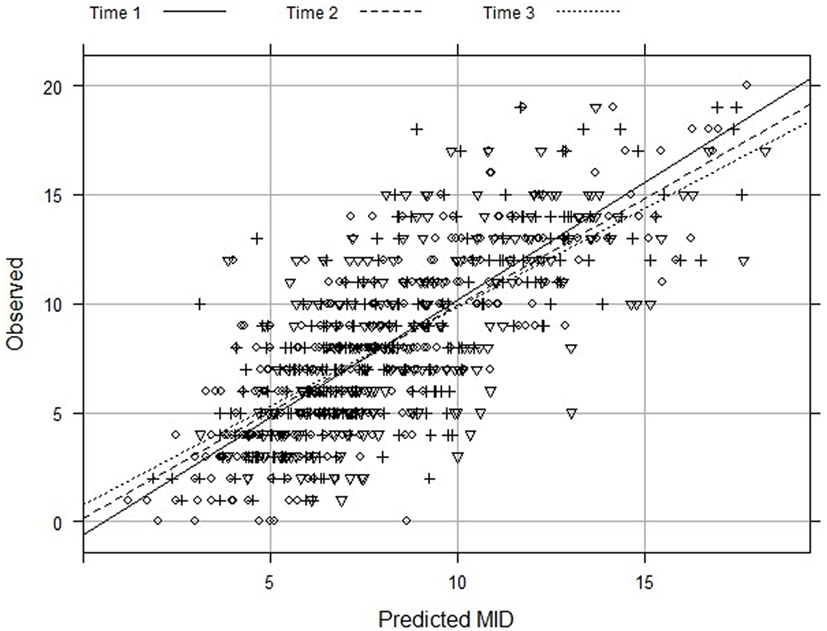
Figure 1. Observed and predicted values of Clinical Impression of Severity Index of Parkinson’s Disease from multilevel regression with multiple imputation, then deletion (MID).
The estimated means of CISI-PD scores increased significantly between all yearly assessments (p < 0.001), following a significant linear trend (Figure 2).
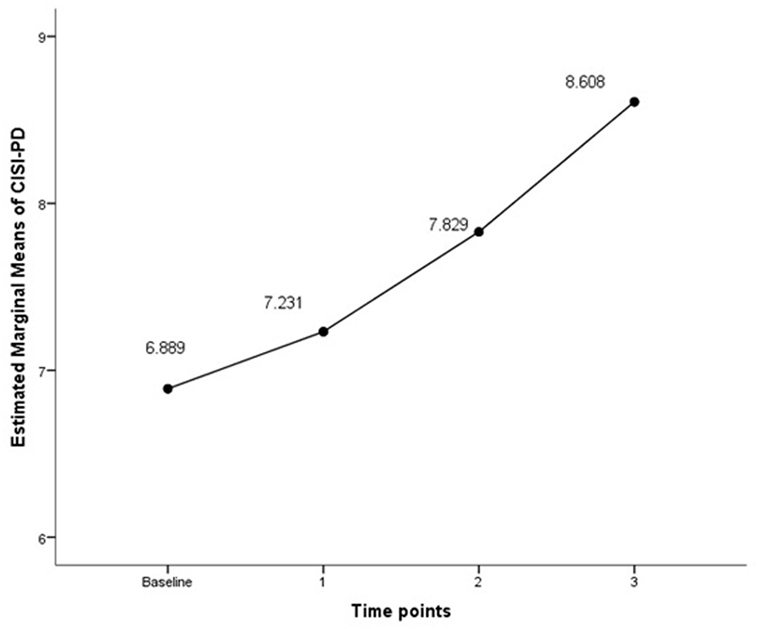
Figure 2. CISI-PD scores throughout the follow-up (3 years). Covariates at baseline appearing in the model are evaluated at the following values: LED = 496.77, HADS = 12.47, SCOPA-AUT = 19.24, and SCOPA-COG = 25.07. CISI-PD, Clinical Impression of Severity Index of Parkinson’s Disease; LED, levodopa equivalent dose; HADS, Hospital Anxiety and Depression Scale; SCOPA-AUT, SCOPA-autonomic scale; SCOPA-COG, SCOPA-Cognition scale. Significant linearity test (F statistic = 11.176, p-value = 0.001).
Discussion
The CISI-PD is a measure of global PD severity; it is easy to apply, valid, reliable, accurate, and useful in both clinical practice and research. It provides a comprehensive assessment of important manifestations of PD not included in other global rating scales, for example, HY staging (4). The main objective of this study was to design a predictive model of the global severity of PD over 3 years using the CISI-PD, based on the clinical data obtained at baseline from a sample of patients with idiopathic PD. The model can complement knowledge about the evolution of PD progression over 3 years.
Our study showed that at the baseline, patients who completed the study were younger, with better baseline CISI-PD and cognitive function. These characteristics were similar to those of patients in another longitudinal study (28). To account for the sample loss, data imputation was used, with good results.
A PD global severity (CISI-PD) worsening of small magnitude was observed over the 3-year follow-up. On the one hand, this small experienced deterioration may be due to the fact that PD worsening is slowed by the effect of anti-Parkinsonian medication (2, 29). On the other hand, it might indicate that the follow-up period was not long enough to detect larger changes in a disease with a slow and long progression.
In a previous study, the main cross-sectional determinants of CISI-PD were motor status (SCOPA-Motor Total), disease duration, depression and, to a lesser extent, age and comorbidity (5). In our longitudinal study, baseline values of PD global severity (CISI-PD), depression and anxiety symptoms (HADS), cognitive function (SCOPA-COG), autonomic symptoms (SCOPA-AUT), and LED were predictors of CISI-PD at 1, 2, and 3 years. A different study design (cress-sectional vs. longitudinal) might explain the differences found in the factors associated to CISI-PD in both studies.
Several studies highlighted the importance of non-motor symptoms, such as cognitive impairment and autonomic dysfunction, in PD severity and progression. One study concluded that PD was associated with significantly higher morbidity rates associated with conditions such as mental and psychiatric, nervous system, gastrointestinal, genitourinary problems, among others (30). The presence of cognitive impairment was also associated with increased mortality (31) and a longer duration of disease increased the prevalence of dementia (32).
According to our results, the presence of the treatment as a predictor indicates its importance in Parkinson’s disease clinical management (2, 33). In early stages of the disease, patients may not need anti-Parkinsonian treatment. In fact, although the l-DOPA is the most effective for the symptomatic treatment of PD, the presence of motor complications associated with this treatment, such as motor fluctuations and dyskinesias, is a limitation that has led some physicians to advocate that the initiation of this treatment must be delayed (34). However, this treatment is necessary as PD progresses, which may partly account that its presence is associated with a higher score overall severity of PD.
The non-conditional or empty multilevel model of the CISI-PD yielded an ICC of 0.816. In other words, 81.6% of the variability observed in the CISI-PD was attributable to differences between individuals at baseline, and the remaining 18.4% was due to each individual’s evolution over time. The ICC dropped to 0.563 when the predictive model was adjusted by the significant covariables, which means that the 56.3% of the observed variability was attributable to differences between individuals at baseline and the remaining 43.7% was due to each individual’s evolution over time. These results imply that the disease progression depends more on the individual’s baseline characteristics than on the passage of time. Previous studies suggest that the rate of progression of PD symptoms and signs vary widely between different patients, according to their baseline characteristics (31). For instance, the presence of cognitive impairment at baseline has been associated with a faster progression of motor impairment (35).
The assessment of our results is subject to a number of limitations. First, a loss of almost half of the patients over a period of only 3 years may result in less precise estimates. However, bias was minimized with the use of multiple imputation techniques, with good results in sensitivity analysis (36). Second, the development of new concomitant diseases, expected in older age groups, was not taken into account. The third limitation is the relative short length of follow-up for a chronic condition as PD, which in our case lasted 3 years. Taken into account that some PD symptoms may appear later, new longitudinal studies over extended time span would be necessary (37). Fourth, we did not apply the predictive model in a different sample of our study, so we do not know how good are the predictions under real live conditions and in what extent the predictions could be superior to expert assumptions. For this reason, it would be appropriate to design new longitudinal prospective studies with a similar follow-up and compare the results of the assessments of each time point and the assumptions of the experts with those obtained with the predictive model. In addition, other studies could be carried out using different endpoints focused, for instance, on non-motor complications such as cognitive impairment or impulse control disorders.
Despite such limitations, our results identify factors that influence PD progression. This might be of great value for clinicians for planning, implementation, and evaluation of intervention strategies to promote comprehensive rehabilitation and social inclusion of people with PD.
From our study, we can conclude that after the 3-year follow-up, a relatively short period, there was a PD global severity worsening of small magnitude. This study also showed that the baseline values of the overall degree of PD severity, cognitive function, depression and anxiety symptoms, autonomic symptoms, and LED were significant predictors of overall severity of PD at 1, 2, and 3 years. Our results can help toward a better understanding of the disease evolution in a short, 3-year period of PD global severity and to understand the role of non-motor symptoms such as depression, anxiety, autonomic, and cognitive symptoms, in the progression of the disease (30–32, 37).
ELEP Project Members
ELEP (Longitudinal Study of PD) project members are as follows:
M. Aguilar and P. Quilez-Ferrer (Mutua de Terrassa, Barcelona); M. Alvarez Sauco (Elche General Hospital, Alicante); A. Bayes (Teknon Clinic, Barcelona); M. Blazquez (Asturias Central Hospital, Oviedo); A. Bergareche (Bidasoa Hospital, Guipuzcoa); V. Campos (Xanit International Hospital, Benalmadena, Malaga); M. Carballo (Virgen del Rocío Hospital, Sevilla); M. J. Catalan (San Carlos Hospital, Madrid); J. Chacon (Virgen de la Macarena Hospital, Sevilla); E. Cubo (Burgos Hospital); J. M. Fernandez-Garcia (Basurto Hospital, Bilbao); B. Frades-Payo (CIEN Foundation, Carlos III Institute of Health, Madrid); P. Garcia-Ruiz-Espiga (Jimenez-Diaz Foundation Hospital, Madrid); J. Kulisevsky (Sant Pau Hospital, CIBERNED, Barcelona); G. Linazasoro (Gipuzkoa Polyclinic, San Sebastian);J. Lopez del Val (Lozano Blesa Hospital, Zaragoza);J. C. Martinez-Castrillo (Ramón y Cajal Hospital, Madrid); P. Martinez-Martin, M. J. Forjaz, and C. Rodriguez-Blazquez (Carlos III Institute of Health, Madrid); A. Mendoza (Segovia Hospital); P. Mir (Virgen del Rocio Hospital, CIBERNED, Sevilla); I. Posada (Doce de Octubre Hospital, CIBERNED, Madrid);F. Valldeoriola (Clinical Hospital, CIBERNED, Barcelona); L. Vela (Alcorcon Hospital Foundation, Madrid); and F. Vivancos and I. Ybot (La Paz Hospital, Madrid).
Ethics Statement
This study was carried out in accordance with the recommendations of Research Ethics Committee of the Carlos III Health Institute and the Clinical Research Ethics Committee of the La Princesa Hospital, Madrid with written informed consent from all subjects. All subjects gave written informed consent in accordance with the Declaration of Helsinki.
Author Contributions
PM-M and MJF conceived and designed the study. AA, JMT-J, and J-MR-A run the statistical analyses. AA and JMT-J wrote the first drafts of the paper. All the authors including CRB, reviewed and critiqued the manuscript. All the authors were responsible for the decision to submit the manuscript for publication.
Disclaimer
This study presents independent results and research. The views expressed are those of the authors and not necessarily those of the Instituto de Salud Carlos III.
Conflict of Interest Statement
JMT-J, MJF, AA, CR-B, and J-MR-A report no disclosures. PM-M received honoraria from speaking engagements at scientific meetings of Italfarmaco and Teva, and from serving in a scientific advisory board of AbbVie; grants from Carlos III Institute of Health [FIS], Reina Sofia Foundation, and Michael J. Fox Foundation; and his employment is at Carlos III Institute of Health.
Funding
The Spanish Longitudinal PD Patient Study (Estudio longitudinal de pacientes con enfermedad de Parkinson) was supported by an Intramural Research Programme grant from the Carlos III Institute of Health (Code: EPY1271/05). Partial funding was also obtained from the following grants: ENVACES (MINECO/FEDER/UE, ref. CSO2015-64115-R) and ENCAGE-CM (Comunidad de Madrid, ref. S2015/HUM-3367).
Supplementary Material
The Supplementary Material for this article can be found online at http://www.frontiersin.org/article/10.3389/fneur.2017.00551/full#supplementary-material.
References
1. Visser M, Verbaan D, van Rooden S, Marinus J, van Hilten J, Stiggelbout A. A longitudinal evaluation of health-related quality of life of patients with Parkinson’s disease. Value Health (2009) 12(2):392–6. doi:10.1111/j.1524-4733.2008.00430.x
2. Vu TC, Nutt JG, Holford NHG. Progression of motor and nonmotor features of Parkinson’s disease and their response to treatment. Br J Clin Pharmacol (2012) 74(2):267–83. doi:10.1111/j.1365-2125.2012.04192.x
3. Martinez-Martin P, Rodriguez-Blazquez C, Abe K, Bhattacharyya KB, Bloem BR, Carod-Artal FJ, et al. International study on the psychometric attributes of the non-motor symptoms scale in Parkinson disease. Neurology (2009) 73(19):1584–91. doi:10.1212/WNL.0b013e3181c0d416
4. Martínez-Martín P, Forjaz MJ, Cubo E, Frades B, de Pedro Cuesta J, ELEP Project Members. Global versus factor-related impression of severity in Parkinson’s disease: a new clinimetric index (CISI-PD). Mov Disord (2006) 21(2):208–14. doi:10.1002/mds.20697
5. Martínez-Martín P, Rodríguez-Blázquez C, Forjaz MJ, de Pedro J, Spanish-American Longitudinal PD, Patient Study Group. The clinical impression of severity index for Parkinson’s disease: international validation study. Mov Disord (2009) 24(2):211–7. doi:10.1002/mds.22320
6. Martínez-Martín P, Rojo-Abuin JM, Rodríguez-Violante M, Serrano-Dueñas M, Garretto N, Martínez-Castrillo JC, et al. Analysis of four scales for global severity evaluation in Parkinson’s disease. NPJ Parkinsons Dis (2016) 2:16007. doi:10.1038/npjparkd.2016.7
7. Gibb WR, Lees AJ. The relevance of the Lewy body to the pathogenesis of idiopathic Parkinson’s disease. J Neurol Neurosurg Psychiatry (1988) 51(6):745–52. doi:10.1136/jnnp.51.6.745
8. Zigmond AS, Snaith RP. The hospital anxiety and depression scale. Acta Psychiatr Scand (1983) 67(6):361–70. doi:10.1111/j.1600-0447.1983.tb09716.x
9. van Reene M, Oppe M. Basic Information on How to Use the EQ-5D-3L Instrument. EQ-5D-3L User Guide Version 5.1 [Internet]. (2015). Available from: https://euroqol.org/wp-content/uploads/2016/09/EQ-5D-3L_UserGuide_2015.pdf
10. Marinus J, Leentjens AFG, Visser M, Stiggelbout AM, van Hilten JJ. Evaluation of the hospital anxiety and depression scale in patients with Parkinson’s disease. Clin Neuropharmacol (2002) 25(6):318–24. doi:10.1097/00002826-200211000-00008
11. Marinus J, Visser M, van Hilten JJ, Lammers GJ, Stiggelbout AM. Assessment of sleep and sleepiness in Parkinson disease. Sleep (2003) 26(8):1049–54. doi:10.1093/sleep/26.8.1049
12. Martinez-Martin P, Visser M, Rodriguez-Blazquez C, Marinus J, Chaudhuri KR, van Hilten JJ, et al. SCOPA-sleep and PDSS: two scales for assessment of sleep disorder in Parkinson’s disease. Mov Disord (2008) 23(12):1681–8. doi:10.1002/mds.22110
13. Visser M, Marinus J, Stiggelbout AM, Van Hilten JJ. Assessment of autonomic dysfunction in Parkinson’s disease: the SCOPA-AUT. Mov Disord (2004) 19(11):1306–12. doi:10.1002/mds.20153
14. Delgado-Sanz MC, Prieto-Flores M-E, Forjaz MJ, Ayala A, Rojo-Perez F, Fernandez-Mayoralas G, et al. [Influence of chronic health problems in dimensions of EQ-5D: study of institutionalized and non-institutionalized elderly]. Rev Esp Salud Publica (2011) 85(6):555–68. doi:10.1590/S1135-57272011120000005
15. Siderowf AD, Werner RM. The EQ-5D – a generic quality of life measure – is a useful instrument to measure quality of life in patients with Parkinson’s disease. J Neurol Neurosurg Psychiatry (2001) 70(6):817. doi:10.1136/jnnp.70.6.817
16. Marinus J, Visser M, Verwey NA, Verhey FRJ, Middelkoop HA, Stiggelbout AM, et al. Assessment of cognition in Parkinson’s disease. Neurology (2003) 61(9):1222–8. doi:10.1212/01.WNL.0000091864.39702.1C
17. Virués-Ortega J, Rodríguez-Blázquez C, Micheli F, Carod-Artal FJ, Serrano-Dueñas M, Martínez-Martín P. Cross-cultural evaluation of the modified Parkinson Psychosis Rating Scale across disease stages. Mov Disord (2010) 25(10):1391–8. doi:10.1002/mds.23081
18. Martínez-Martín P, Frades-Payo B, Rodríguez-Blázquez C, Forjaz MJ, de Pedro-Cuesta J. Longitudinal Parkinson’s disease patient study (ELEP group). [Psychometric attributes of scales for outcomes in Parkinson’s disease-cognition (SCOPA-Cog), Castilian language]. Rev Neurol (2008) 47(7):337–43.
19. Friedberg G, Zoldan J, Weizman A, Melamed E. Parkinson psychosis rating scale: a practical instrument for grading psychosis in Parkinson’s disease. Clin Neuropharmacol (1998) 21(5):280–4.
20. Marinus J, Visser M, Stiggelbout AM, Rabey JM, Martínez-Martín P, Bonuccelli U, et al. A short scale for the assessment of motor impairments and disabilities in Parkinson’s disease: the SPES/SCOPA. J Neurol Neurosurg Psychiatry (2004) 75(3):388–95. doi:10.1136/jnnp.2003.017509
21. Hoehn MM, Yahr MD. Parkinsonism: onset, progression and mortality. Neurology (1967) 17(5):427–42. doi:10.1212/WNL.17.5.427
22. Sterne JAC, White IR, Carlin JB, Spratt M, Royston P, Kenward MG, et al. Multiple imputation for missing data in epidemiological and clinical research: potential and pitfalls. BMJ (2009) 338:b2393. doi:10.1136/bmj.b2393
23. Cohen J. Statistical Power Analysis for the Behavioral Sciences (Revised Edition). New York: Academic Press (1977).
24. Zunzunegui MV, García de Yébenes MJ, Forster M, Aguilar Conesa MD, Rodríguez Laso A, Otero A. [Multilevel model applications to the analysis of longitudinal data]. Rev Esp Salud Publica (2004) 78(2):177–88. doi:10.1590/S1135-57272004000200005
25. Biering K, Hjollund NH, Frydenberg M. Using multiple imputation to deal with missing data and attrition in longitudinal studies with repeated measures of patient-reported outcomes. Clin Epidemiol (2015) 7:91–106. doi:10.2147/CLEP.S72247
26. Von Hippel PT. Regression with missing Ys: an improved strategy for analyzing multiply imputed data. Sociol Methodol (2007) 37(1):83–117. doi:10.1111/j.1467-9531.2007.00180.x
27. Sullivan TR, Salter AB, Ryan P, Lee KJ. Bias and precision of the «multiple imputation, then deletion» method for dealing with missing outcome data. Am J Epidemiol (2015) 182(6):528–34. doi:10.1093/aje/kwv100
28. Antonini A, Barone P, Marconi R, Morgante L, Zappulla S, Pontieri FE, et al. The progression of non-motor symptoms in Parkinson’s disease and their contribution to motor disability and quality of life. J Neurol (2012) 259(12):2621–31. doi:10.1007/s00415-012-6557-8
29. Vu TC, Nutt JG, Holford NHG. Disease progress and response to treatment as predictors of survival, disability, cognitive impairment and depression in Parkinson’s disease. Br J Clin Pharmacol (2012) 74(2):284–95. doi:10.1111/j.1365-2125.2012.04208.x
30. Frandsen R, Kjellberg J, Ibsen R, Jennum P. Morbidity in early Parkinson’s disease and prior to diagnosis. Brain Behav (2014) 4(3):446–52. doi:10.1002/brb3.228
31. Reinoso G, Allen JC, Au W-L, Seah S-H, Tay K-Y, Tan LCS. Clinical evolution of Parkinson’s disease and prognostic factors affecting motor progression: 9-year follow-up study. Eur J Neurol (2015) 22(3):457–63. doi:10.1111/ene.12476
32. Hely MA, Reid WGJ, Adena MA, Halliday GM, Morris JGL. The Sydney multicenter study of Parkinson’s disease: the inevitability of dementia at 20 years. Mov Disord (2008) 23(6):837–44. doi:10.1002/mds.21956
33. Holford NHG, Chan PLS, Nutt JG, Kieburtz K, Shoulson I, Parkinson Study Group. Disease progression and pharmacodynamics in Parkinson disease – evidence for functional protection with levodopa and other treatments. J Pharmacokinet Pharmacodyn (2006) 33(3):281–311. doi:10.1007/s10928-006-9012-6
34. Olanow CW, Agid Y, Mizuno Y, Albanese A, Bonuccelli U, Bonucelli U, et al. Levodopa in the treatment of Parkinson’s disease: current controversies. Mov Disord (2004) 19(9):997–1005. doi:10.1002/mds.20243
35. Velseboer DC, Broeders M, Post B, van Geloven N, Speelman JD, Schmand B, et al. Prognostic factors of motor impairment, disability, and quality of life in newly diagnosed PD. Neurology (2013) 80(7):627–33. doi:10.1212/WNL.0b013e318281cc99
36. Núñez E, Steyerberg EW, Núñez J. [Regression modeling strategies]. Rev Esp Cardiol (2011) 64(6):501–7. doi:10.1016/j.recesp.2011.01.019
Keywords: Parkinson’s disease, disease global severity, predictive model, multilevel analysis, multiple imputation
Citation: Ayala A, Triviño-Juárez JM, Forjaz MJ, Rodríguez-Blázquez C, Rojo-Abuin J-M and Martínez-Martín P (2017) Parkinson’s Disease Severity at 3 Years Can Be Predicted from Non-Motor Symptoms at Baseline. Front. Neurol. 8:551. doi: 10.3389/fneur.2017.00551
Received: 11 April 2017; Accepted: 28 September 2017;
Published: 30 October 2017
Edited by:
Oscar Arias-Carrión, Hospital General Dr. Manuel Gea Gonzalez, MexicoReviewed by:
Francisco José Pan-Montojo, Ludwig-Maximilians-Universität München, GermanyGennaro Pagano, King’s College London, United Kingdom
Copyright: © 2017 Ayala, Triviño-Juárez, Forjaz, Rodríguez-Blázquez, Rojo-Abuin and Martínez-Martín. This is an open-access article distributed under the terms of the Creative Commons Attribution License (CC BY). The use, distribution or reproduction in other forums is permitted, provided the original author(s) or licensor are credited and that the original publication in this journal is cited, in accordance with accepted academic practice. No use, distribution or reproduction is permitted which does not comply with these terms.
*Correspondence: Maria João Forjaz, jforjaz@isciii.es