Direct visualization of the perforant pathway in the human brain with ex vivo diffusion tensor imaging
- 1 Athinoula A. Martinos Center for Biomedical Imaging, Massachusetts General Hospital, Harvard Medical School, Charlestown, MA, USA
- 2 Computer Science and Artificial Intelligence Laboratory, Massachusetts Institute of Technology, Cambridge, MA, USA
Ex vivo magnetic resonance imaging yields high resolution images that reveal detailed cerebral anatomy and explicit cytoarchitecture in the cerebral cortex, subcortical structures, and white matter in the human brain. Our data illustrate neuroanatomical correlates of limbic circuitry with high resolution images at high field. In this report, we have studied ex vivo medial temporal lobe samples in high resolution structural MRI and high resolution diffusion MRI. Structural and diffusion MRIs were registered to each other and to histological sections stained for myelin for validation of the perforant pathway. We demonstrate probability maps and fiber tracking from diffusion tensor data that allows the direct visualization of the perforant pathway. Although it is not possible to validate the DTI data with invasive measures, results described here provide an additional line of evidence of the perforant pathway trajectory in the human brain and that the perforant pathway may cross the hippocampal sulcus.
Introduction
Ex vivo imaging is a field of study that offers tremendous potential to visualize the brain, or brain slices, in a novel way. Combining ex vivo imaging with histology allows features observed in magnetic resonance images to be validated with histological stains as the gold standard. Several significant advantages have increased the use of ex vivo imaging: first, the ability to examine cortical features without sectioning, second, the ability to re-slice or re-sample the brain in multiple planes (coronal, axial and sagittal) or even at an arbitrary angle that can yield new insights and reveal structures that are difficult to visualize otherwise; and third, the possibility of three dimensional reconstruction and novel manipulation of the magnetic resonance imaging (MRI).
Ex vivo imaging expands the range of neuroanatomical questions that can be investigated relative to conventional histological methods alone. Techniques such as diffusion tensor imaging (DTI) and tractography in the human brain (Conturo et al., 1999 ; Shimony et al., 1999 ; Lori et al., 2002 ; Mori et al., 2002 ; Behrens et al., 2003a ,b ; Zhang et al., 2008 ) enable us to formulate and test new hypotheses about the structural and connectivity properties of the brain. Our data focus on the medial temporal lobe and the perforant pathway because neuropathological studies have shown that mesocortical areas and the hippocampus are targeted in Alzheimer’s disease (AD) (Hyman et al., 1984 ; Braak and Braak, 1985 , 1991 ; Arnold et al., 1991 ; Arriagada et al., 1992 ). In the AD brain, incoming afferents lose their connections to the hippocampal formation and it is well known that mesocortical areas become disconnected from the hippocampus and the perforant pathway is destroyed in early AD (Hyman et al., 1986 ; Hyman et al., 1988 ; Salat et al., 2008 ). Thus, perforant pathway plays a crucial role in AD. More specific evaluation of structures, such as the perforant pathway, in the medial temporal lobe at high resolution using ex vivo methods could ultimately provide methods to evaluate AD in vivo imaging. Before that is possible, better characterization of perforant pathway in control brain at high resolution is necessary to establish a baseline for non-diseased brains.
In a healthy brain, incoming sensory information from visual, auditory, somatic association cortices converges in the mesocortical regions (Jones and Powell, 1970 ; Van Hoesen et al., 1972 ) and then sends a massive projection to the dentate gyrus granule cells and hippocampal pyramidal neurons via the perforant pathway or temporoammonic pathway (Lorente de No, 1934 ; Cajal, 1955 ; Van Hoesen and Pandya, 1975 ; Witter et al., 1989 ; Witter and Amaral, 1991 ) for memory consolidation. Thus, the perforant pathway begins in entorhinal layer II and superficial layer III. It ascends upward through the angular bundle and perforates the presubiculum, subiculum and subsequently hippocampal sulcus throughout the anterior–posterior extent of the entorhinal cortex (EC). This temporoammonic pathway predominantly terminates on the outer two-thirds of the molecular layer of the dentate gyrus. The EC has additional, albeit lesser, efferents: the temporoalvear and crossed temporoammonic pathways.
In this paper, we begin by outlining a few issues that affect the quality of ex vivo imaging, such as fixation, gadolinium enhancement, iron content, or lack thereof, in tissue. We present high resolution ex vivo imaging data that illustrate neural structures in Papez’s circuit where we concentrate on the perforant pathway in the medial temporal lobe using DTI and show probability maps between labeled anatomical structures and the perforant pathway trajectory in fiber tracking. Furthermore, high resolution structural MRI volumes (100 μm) registered to high resolution diffusion MRI volumes (200 or 300 μm) insured alignment and accurate labeling of regions of interest. In addition to MRI–MRI registration, we describe our techniques for registration of the MRI with the histological stained images, using blockface images as an intermediate guide to help remove distortions and improve the accuracy of the resulting registration. Finally, we validate the MRI results with histological analysis in a subset of the data.
Materials and Methods
Tissue Samples
Six normal control brain hemispheres were obtained from the Massachusetts General Hospital Autopsy Service and fixed at autopsy with 4% formalin or 2% paraformaldehyde for at least 4 weeks. Cases reported no clinical history of central nervous system disease, dementia, major psychiatric illness, or head trauma in any of our cases. One case had very minimal neurofibrillary tangles in entorhinal cortex but no amyloid plaques. All samples were restricted to less than 26 h postmortem interval. The mean age was 66 and gender consisted of three males and three females. In some instances, temporal lobe blocks (parahippocampal gyrus) were dissected and placed in heptacosafluorotributylamine (Sigma, St. Louis MO, USA) during scanning to minimize background effects. Medial temporal lobe blocks were used in these experiments. For diffusion tensor image study, some brain specimens were soaked in a 1 mM gadolinium (gadolinium dimeglumine) in phosphate buffered saline solution for up to 2 weeks. The gadolinium reduced the T1 of the tissue to allow for faster scanning, and the phosphate buffered saline rehydrated the tissue, increasing T2. Human brain tissue experiments were approved by an Institutional Review Board at Massachusetts General Hospital.
Fixative Experiments
We tested the effects of fixation on the contrast-to-noise of the ex vivo imaging. We selected a normal control brain and blocked primary visual cortex and bivalved the specimen into two parts: block A remained unfixed and block B was fixed in 10% formalin for 1 week. Unfixed (fresh) and well-fixed formalin tissue were scanned using the same scanning protocols. T1 and proton density (PD) maps were generated from six FLASH scan acquisitions with three flip angles of 10°, 20°, and 30° (Fischl et al., 2004 ). Acquisition and coil protocols were identical in each sample. The contrast-to-noise ratio (CNR) measurements were obtained using MATLAB software (Mathworks, Natick, MA, USA) sampling in the gray and white matter.
7.0t Scanner (for High Resolution Structural MRI)
For high resolution images, we used ultrahigh field 7.0 T MRI with 80 mT/m head gradient set. The 7.0T whole-body magnet was built by Magnex Scientific (Oxford, UK), and Siemens provided the conventional MRI console, gradient drivers and patient table. With its high performance gradient set (80 mT/m, 800 T/m/s slew rate head gradient set), the system can provide better than 100-μm resolution.
High Resolution Structural MRI Data Acquisition–Flash Images
Standard structural MRI is typically based on some combination of three time constants that vary for tissue type (T1, T2, and T2⋆) as well as the density of protons that are being imaged. For this project, we used a class of acquisition protocols known as the fast low angle shot (FLASH) pulse sequence and a high-bandwidth multi-echo flash sequence that minimizes distortions while maximizing signal-to-noise ratio (SNR) (Fischl et al., 2004 ). While the individual scans can be quite noisy, the information in the ensemble is significantly greater than the low bandwidth FLASH scans. We also collected 100 μm isotropic single echo scans and the single echo FLASH images were acquired with a fixed echo time (7.8 ms) and repetition time (20 ms), with flip angle 20° (Augustinack et al., 2005 ). The scan time to acquire 100 μm3 resolution for a single run was 1 h and 45 min. Typically, we acquire three runs per flip angle and three flip angles for a total scan time of 17 h. Supplementary scans for the fixation experiment and Papez’s neuroanatomy images were acquired at 120 μm3.
4.7T Scanner (For DTI)
Diffusion tensor imaging scans were acquired on a Bruker Biospec Avance system (4.7T/40 magnet, 12 cm, 40 G/cm gradients) using a 3D Stejskal–Tanner spin-echo sequence (TR/TE = 250/28 ms, δ = 7 ms, Δ = 10.4 ms, 200 μm isotropic spatial resolution, maximum b-value (bmax) = 4000 s/mm2 in 20 non-collinear directions) or (TR/TE 320/27.85 ms, δ = 7 ms, Δ = 10.4 ms, 300 μm isotropic spatial resolution, maximum b-value (bmax) = 4000 s/mm2 in 20 non-collinear directions). Two b = 0 scans were also acquired with each data set. Peak SNR ratio for the b = 0 scan in the cortex was approximately 170:1. The total scan time was 40 h for the 200 μm3 DTI data and 18 h for the 300 μm3 data. All resolutions were isotropic.
Radio Frequency Coils
For small samples (medial temporal lobe only), several transmit-receive solenoid coils were used. Solenoid coils were designed to closely fit the specimen tubes, and have an inner diameter of 28.5 mm and an active length of 44 mm with four turns for 7T images and 33 mm × 70 mm in length ∼6 turns for 4.7T images.
Registration – Spatial Alignment
We performed three registrations in this study: (1) structural MRI (FLASH)-to-diffusion MRI (b = 0), (2) structural MRI (FLASH)-to-diffusion FA (Register, MNI toolkit, McGill University, Montreal, QC, Canada), and (3) structural MRI (FLASH)-to-histological stained section (myelin stained). First, we registered each FA volume to its respective FLASH volume, drew labels on FA maps and extracted quantitative FA values from maps. Both volumes were visualized in Freeview 1 to draw labels for probability experiments. Second, we registered each b = 0 volume to its respective FLASH volume. Once files were registered, volumes were visualized and labels drawn for probability experiments in Freeview. The last component of the registration part of this project was to transfer information from the high resolution histology section to ex vivo MRI. Given that the sectioned tissue experienced significant deformations during the cutting, mounting and staining procedures, we used a registration processing pipeline that consisted of the following sequence of steps: (1) Pair-wise 2D registration of consecutive histology slices (2) Reconstruction of a 3D histology volume using the registered histology slices (3) Volumetric registration of the histology volume to 3D ex or in vivo MRI acquisitions. In order to correct for tissue tearing and deformation due to the histology preparation procedure, we acquired color digital photographs at the time of slicing. As these “blockface” images do not contain the above-mentioned types of distortions, we used them as a reference. We achieved accurate spatial alignment of consecutive histology slices by first aligning the blockface image series and then registered the corresponding histology and blockface image pairs (resulting in indirectly registered histology images). For the former registration task between blockface images, global rigid (rotation and displacement) or global affine (rotation, displacement and scaling) transformations were sufficient. However, for the latter, between histology and blockface images, we utilized high complexity non-linear warps described by B-spline parameters (Rueckert et al., 1999 ). We relied on mutual information as a similarity metric in both our global and local registration algorithms. After the histology slices were registered, we assembled them into a 3D volume (Wells et al., 1996 ; Maes et al., 1997 ). As has been suggested (Chakravarty et al., 2006 ), a global intensity correction/normalization was computed to ensure not only spatial but intensity correspondence between consecutive slices. Finally, the histology volume was non-linearly registered to the ex vivo MRI scan using a 3D version of the local registration method.
Image Analysis
We analyzed DTI data with two different methods: deterministic and probabilistic tractography. For the former, diffusion tensor metrics and the resulting fiber tracks were created with DTI Studio software (v2.02, Jiang and Mori, Johns Hopkins University) (Jiang et al., 2006 ). The input volumes were the principal eigenvector and fractional anisotropy maps. A region of interest (ROI) was outlined and selected and subsequent DTI tracks or streamlines were deterministically generated. For the latter, probabilistic tractography maps were generated using the FSL/FMRIB’s Diffusion Toolbox (FDT v. 2.0) following their pipeline with eddy current correction, diffusion parameters, segmentation and fitting the diffusion tensors 2 (Behrens et al., 2003b ). The primary input for the probability tractography maps was the four-dimensional raw diffusion data volume. In our analysis, step length was set at half the voxel size. Total number of steps were 5000 and curvature threshold = 0.05 (=89.7135°). For visualization purposes, in all of our subsequent figures, all resulting probability maps were normalized and display settings for heatmaps were selected at midlevel range for each case.
Tissue Processing, Histological Staining and Stereology
After the brain sample was fixed sufficiently and scanned with high resolution MRI protocols, tissue was cryoprotected in 15% glycerol. Temporal lobe blocks were sectioned coronally on a sliding microtome at 50 μm, collected serially, mounted on glass slides by hand or frozen at −20°C for future mounting and staining. Select selections were incubated with gadobenate dimeglumine for 2 days while rotated at room temperature. All cases were stained with thionin for cell bodies to show the cytoarchitecture of the cortex and Luxol Fast Blue for myelin and white matter pathways. Luxol Fast Blue (Solvent Blue 38, Sigma–Aldrich, St. Louis, MO, USA) is a myelin stain for the central and peripheral nervous system that distinguishes between gray and white matter. It has an affinity for lipids where it binds to the myelin sheaths formed by Schwann cells that surround neuron axons. Tissue slides were hydrated with 95% ethanol and stained with Luxol Fast Blue solution overnight at 37°C. After staining, tissue was differentiated in 0.05% lithium carbonate. Depending on the tissue thickness, dye penetrability, and desired viewing, the differentiation time was modified for best results for each case. For stereology methods, we used a Nikon 80i microscope, motorized stage, and MBF Bioscience software (Williston, VT, USA) to count neurons. We performed the standard workflow in StereoInvestigator and followed the stereology methods of West and Gundersen (West et al., 1991 ; Gundersen et al., 1999 ). We counted with a 10 μm dissector and 2 μm guard zone on each side. Our counting frame was 70 μm × 70 μm at 100× magnification and we only counted neurons that contained a stained nucleus.
Neuroanatomical Correlates in Ex Vivo MRI – Papez’s Circuit
We imaged ex vivo samples at 120 μm resolution to reveal detailed neuroanatomical structure in cortical limbic structures, as well as subcortical structures: thalamus, hippocampus, and hypothalamus and their subsequent white matter structures. We followed the neural structures in Papez’s classic circuit (Figure 1 ).
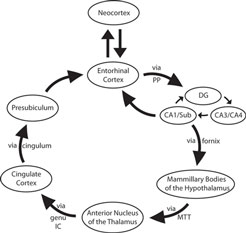
Figure 1. Simplified schemata of Papez’s circuit (see text for references). Abbreviations: DG, dentate gyrus; genu IC, genu of the internal capsule; MTT, mammillothalamic tract; PP, perforant pathway; Sub, subiculum.
Papez’s limbic circuit is illustrated with ex vivo MRI in Figure 2 . If we follow Papez’s circuit through our ex vivo images (Figure 2 ), we observe the gray structures and their white matter pathways with excellent anatomical detail. To begin, the EC projects via the perforant pathway to the dentate gyrus (Figure 2 A) and the dentate gyrus then projects within the hippocampus to CA3. The hippocampal fibers that are headed to the septal nuclei/basal forebrain area exit the hippocampus via the fornix and synapse in the mammillary bodies of the hypothalamus (Figure 2 B). The hypothalamus in turn sends axons to the anterior nucleus of the thalamus via the mammillothalamic tract (Figure 2 C). The anterior nucleus of the thalamus sends a projection to the cingulate cortex via the anterior limb of the internal capsule (Figure 2 D). The cingulate cortex sends limbic input via the cingulum to the anterior parahippocampal gyrus, presubiculum (Figure 2 E). Finally, presubiculum sends a projection back to EC (Figure 2 F) and the circuit is completed.
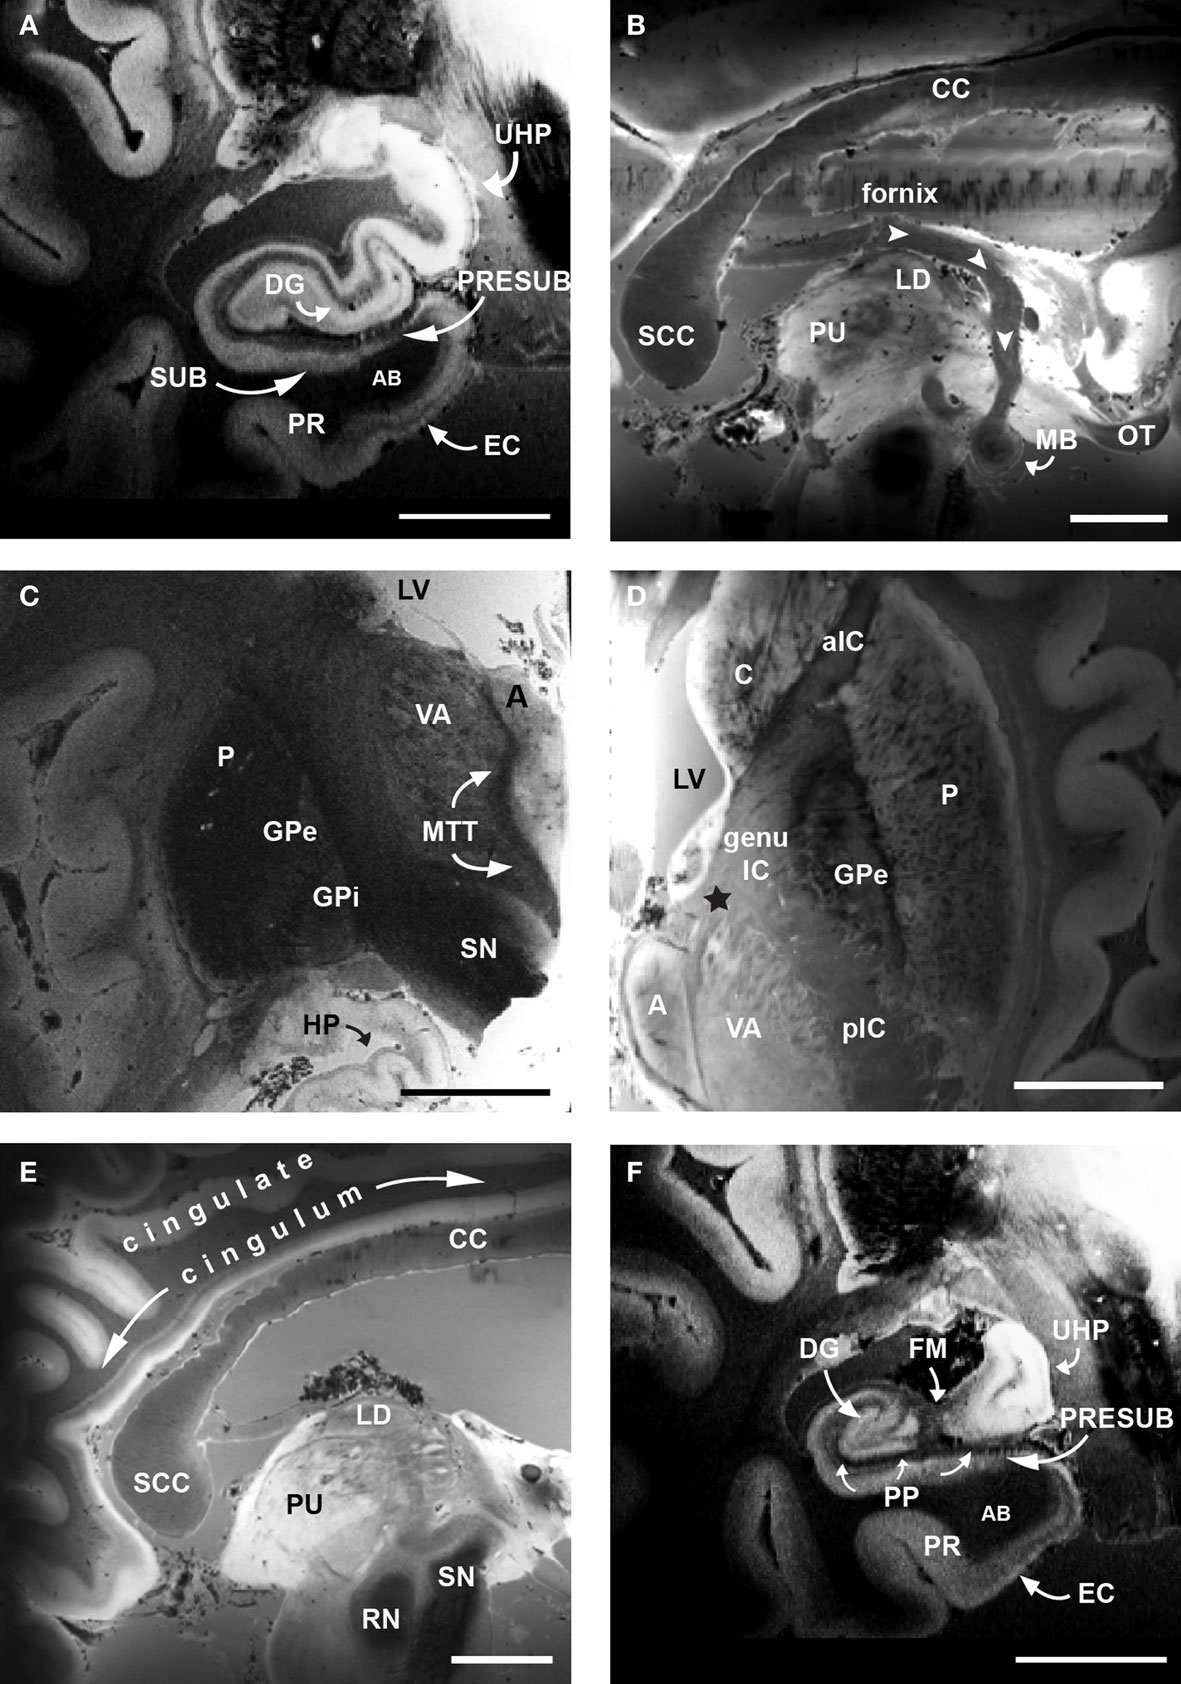
Figure 2. Ex vivo FLASH images following Papez’s circuit at 120 μm. (A) EC, dentate gyrus and hippocampus. (B) Fornix (white arrowheads) and mammillary bodies of the hypothalamus. (C) Mammillary bodies project to anterior nucleus of the thalamus via the mammillothalamic tract (D). Anterior nucleus of the thalamus projecting to cingulate cortex via the anterior limb of the internal capsule (black star). (E) Cingulate cortex via cingulum. (F) Presubiculum and EC. The high resolution images of cortical and subcortical structures reveal contrast differences between white and gray matter in the classic limbic circuit. Magnification bar, 1 cm. Abbreviations: A, anterior nucleus of the thalamus; AB, angular bundle; aIC, anterior limb of the internal capsule; C, caudate; CC, corpus callosum; DG, dentate gyrus; EC, entorhinal cortex; FM, fimbria; genu IC, genu of the internal capsule; GPe, external globus pallidus; GPi, internal globus pallidus; HP, hippocampus; LD, lateral dorsal nuclues of the thalamus; LV, lateral ventricle; MB, mammillary bodies; MTT, mammillothalamic tract; OT, optic tract; P, putamen; pIC, posterior limb of the internal capsule; PP, perforant pathway; PR, perirhinal cortex; PRESUB, presubiculum; PU, pulvinar; RN, red nuclues; SCC, splenium of the corpus callosum; SN, substantia nigra; SUB, subiculum; UHP, uncal hippocampus; VA, ventral anterior nucleus of the thalamus.
Results
Fixation Effects on CNR in MRI
Fixation – the immersion of tissue into a formaldehyde solution and subsequent fixation of proteins – changes the contrast of the tissue so that the majority of ex vivo MRI is not T1 contrast, but T2⋆ weighted instead. To quantify the effects of fixation on ex vivo MRI contrast, we examined unfixed and formalin-fixed tissue in primary visual cortex. We acquired 150 μm resolution MRI data to test fixation effects. In the fixed tissue (Figure 3 B), several characteristics stand out compared to the unfixed tissue (Figure 3 A). First, the gray matter–white matter border is indistinct in the unfixed tissue. Second, while the line of Gennari was observed in the unfixed tissue, the classic heavily myelinated layer IV became darker and more succinct in the fixed tissue image. Third, and related, the contrast of the white matter was black, cortical infragranular layers were gray and cortical supragranular layers – superior to the line of Gennari – were almost white. Finally, we computed the Mahalanobis distance of the T1/T2⋆/PD vectors between gray and white matter for CNR for the fixed and unfixed samples. The resulting distances were 11.849 for unfixed tissue and 27.735 for fixed tissue, illustrating the increased intrinsic contrast in the fixed tissue relative to unfixed. Although the gray matter–white matter border was much clearer in the fixed tissue, it was also distinguishable in the unfixed sample. The line of Gennari (layer IV in primary visual cortex) was observed in both fixed and unfixed tissue. The results suggest that fixation retains the contrast needed for imaging these architectonic features.
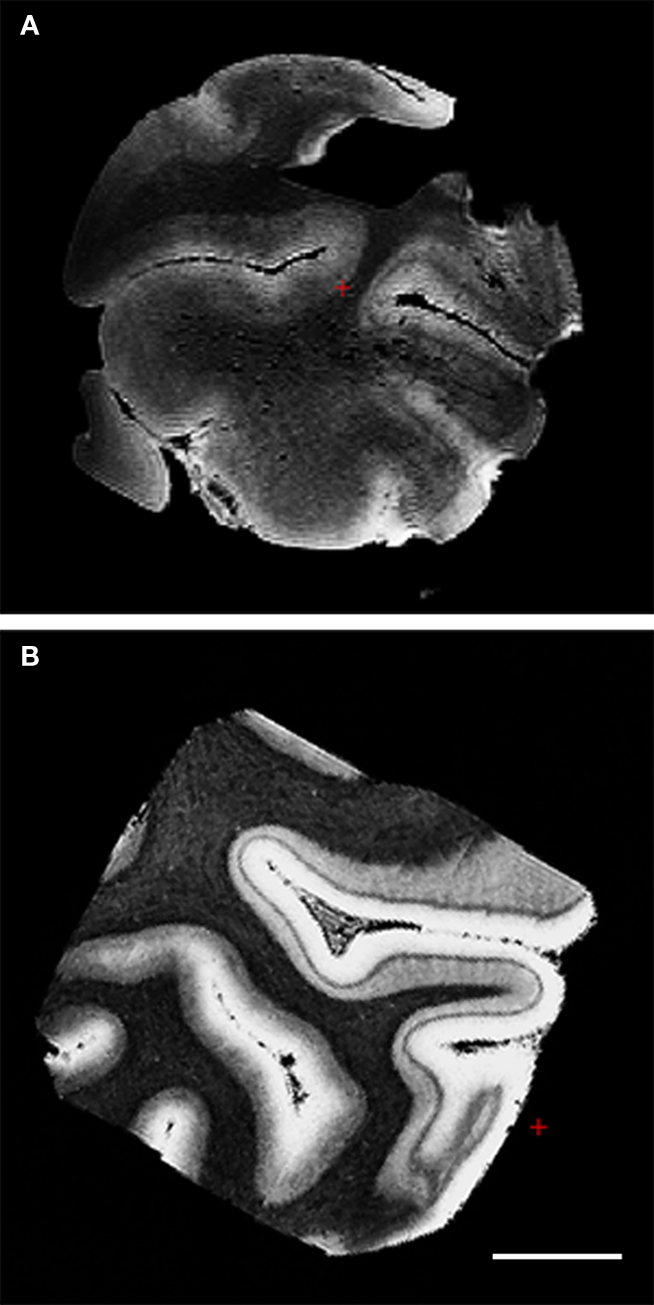
Figure 3. FLASH images (150 μm) of primary visual cortex tissue unfixed (A) and fixed in formalin (B). Note the line of Gennari in both and the superior CNR in the fixed tissue.
Effects of Gadolinium on MRI and Histology
Gadolinium is a chemical element that enhances MRI contrast. Two of our six cases were incubated with 1 mM gadobenate dimeglumine that enhanced diffusion contrast in these images. We found the gadolinium incubation produced more robust diffusion MRI results compared to the non-gadolinium treated (control) incubation. Both gadolinium treated and non-gadolinium treated cases were illustrated in later sections in this report (see Figures 8 and 9 ). We also assessed the gadolinium effects on SNR and we measured SNR (n = 20/case) on b = 0 and b = 4028 s/mm2 volumes in all cases. Table 1 contains mean SNR measurement for b = 0 and b = 4028 s/mm2. Case 1 has increased SNR due to incubation with gadolinium prior to scanning.
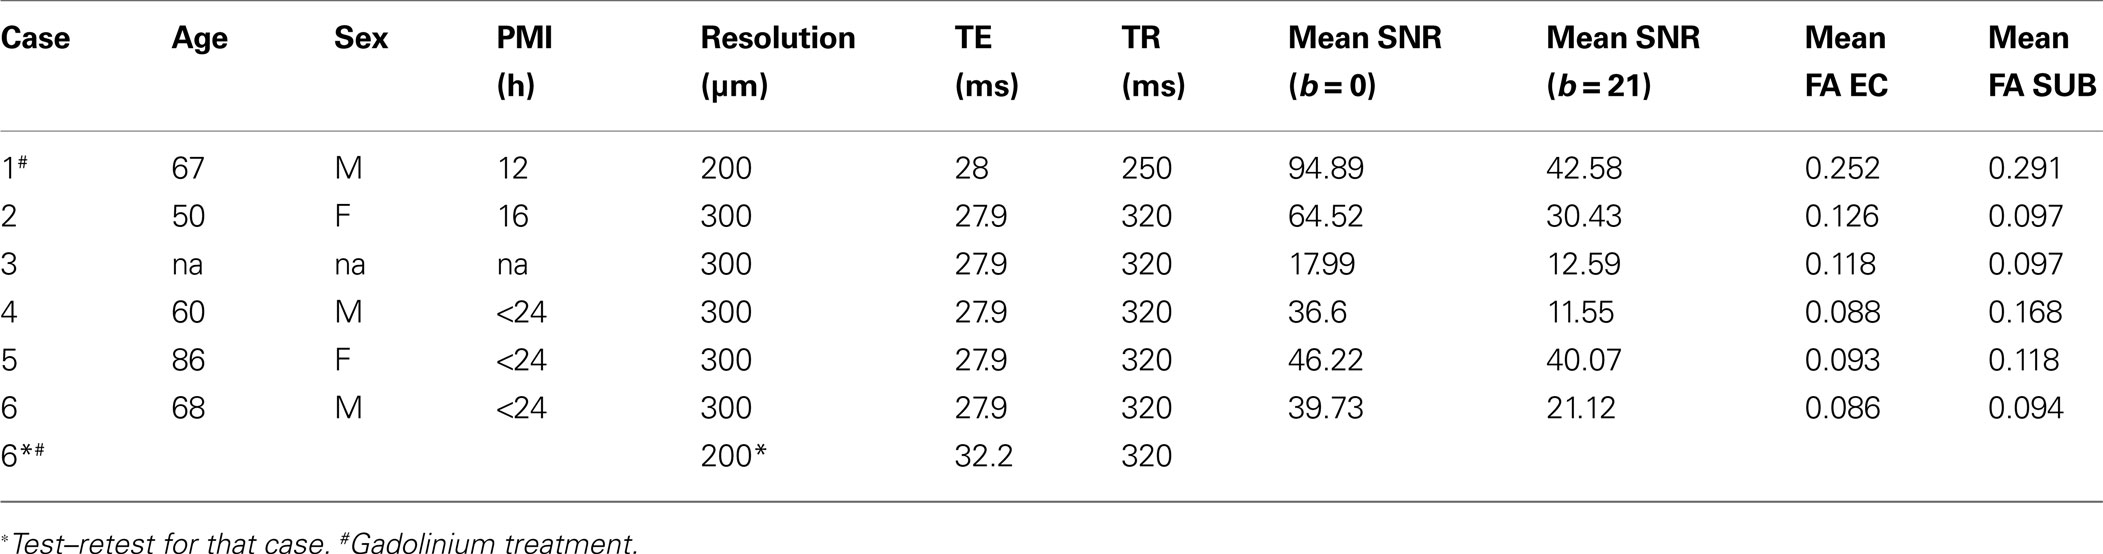
Table 1. Demographic information, MRI parameters and fractional anisotropy for all cases.
To characterize the effect on gadolinium on histology, we analyzed adjacent sections with Nissl staining (Figure 4 ) and stereologically counted neurons in the medial portion of the anterior nucleus of thalamus. Qualitative tissue assessment did not show striking differences in staining between the gadolinium treated tissue (Figure 4 A) and non-treated tissue (Figure 4 B). For our stereology experiment, we found that tissue sections exposed to gadolinium before staining had a total neuronal estimate of 653,476.38 with a coefficient of error = 0.06, whereas the non-gadolinium treated sections had a total neuronal estimate of 505,098.84 with coefficient of error = 0.07. These data suggest gadolinium treatment not only enhances MR images, but also enhances the affinity of Nissl dye to neurons.
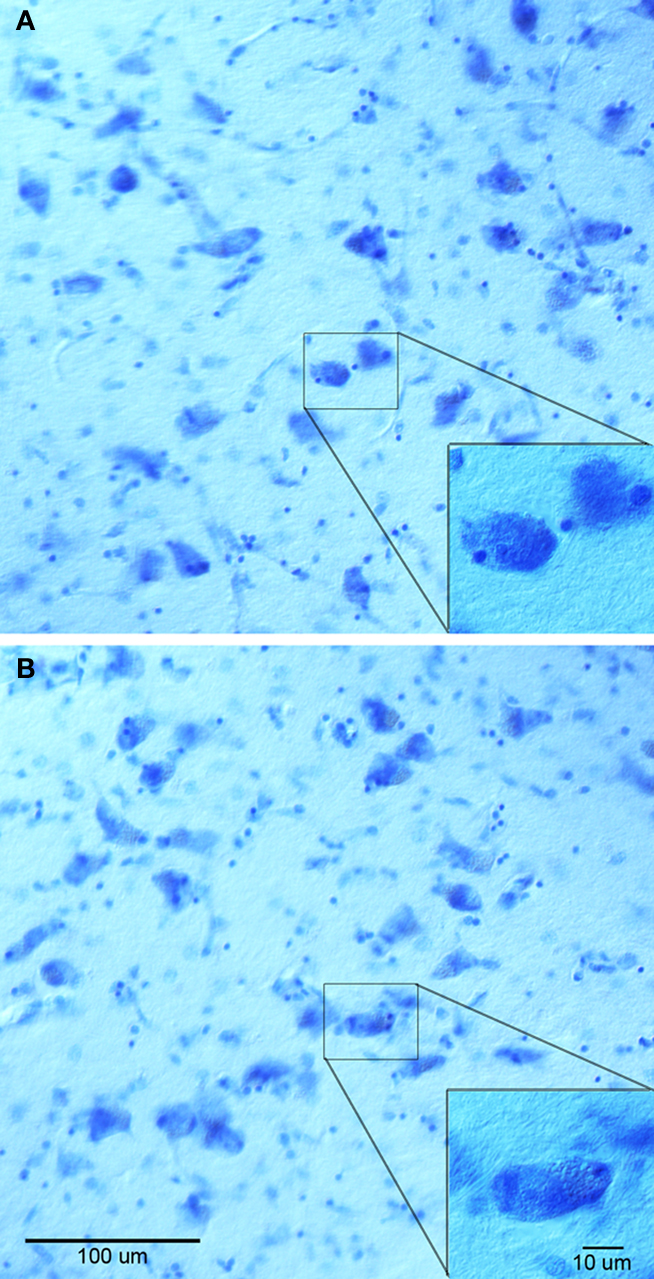
Figure 4. Nissl stained sections from anterior thalamus treated with gadolinium (A) and non-treated (B). Both (A, B) and insets show similar staining, although stereological neuronal estimates were different.
Lack of Iron Deposition – ex vivo Contrast is not Iron
A question that arises with ex vivo imaging is whether iron is responsible for gray/white matter contrast observed in the MRI. We stained four normal control cases of varying age for iron deposition using a Perl’s stain and found no major deposition of iron in these cases. The gray matter was devoid of staining while the white matter has a small amount of background staining (data not illustrated). In these cases, iron did not appear to be a major contributor to MR contrast.
Perforant Pathway in High Resolution Structural ex vivo MRI
We sampled temporal lobe block data and imaged at 100 μm isotropic to acquire the images in Figure 5 . Laminar structure is observed in the EC and prominent lamina principalis externa demarcates the presubiculum, which is notable on both MRI and histologically stained sections. The subicular and presubicular cortices outline the approximate areas where the majority of fibers in the perforant pathway “perforates” through the subicular cortices and black arrowheads show an example of the termination site on the distal two-thirds dendrites of the granule cells in dentate gyrus (Figure 5 ). On the 100 μm images, perforant pathway was apparent in the dark alterations in the subiculum and presubiculum where layer II was particularly bright in presubiculum.
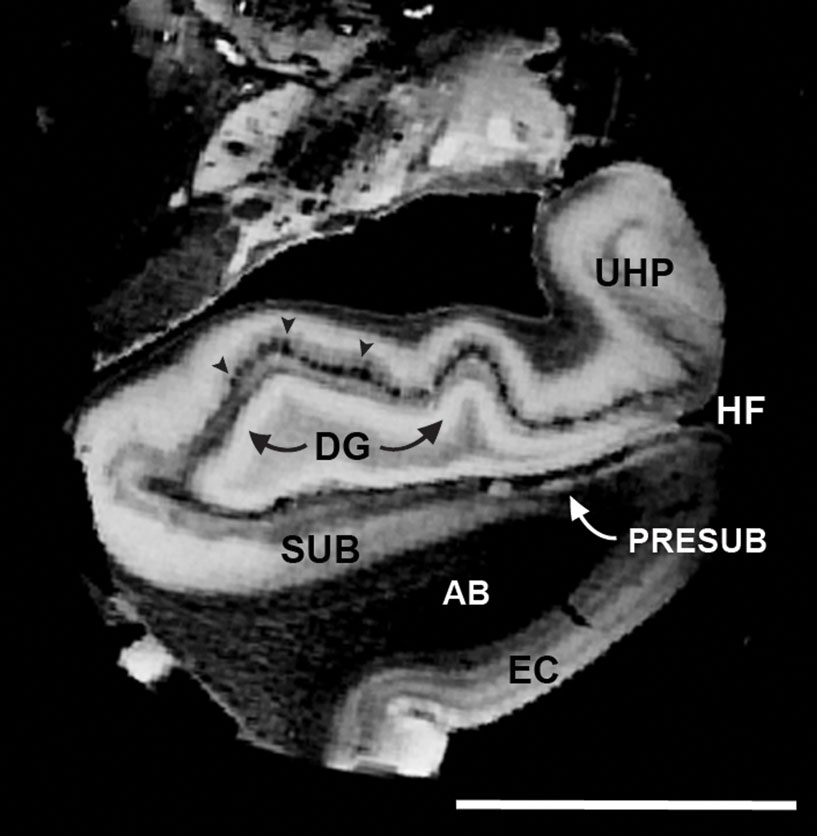
Figure 5. Isotropic 100 μm FLASH image that illustrates the anatomical areas that make up the perforant pathway: EC > AB > SUB/PreSUB > terminal zone of the perforant pathway in the dentate and HP (i. e. molecular layer; black arrowheads). Magnification bar = 1 cm. Abbreviations: EC, entorhinal cortex; HF, hippocampal fissure; PR, perirhinal cortex; UHP, uncal hippocampus.
Structural MRI – Diffusion MRI Registration
To register structural MRI to diffusion MRI, two slices were selected and 11 tags or fiduciary points (on average) were chosen throughout these slices. The selected slices were about 1.5 cm apart and aligned with Register (MNI toolkit McGill University, Montreal, QC, Canada). An example of MRI registration is shown where the FA_DTI volume is displayed in spectrum colors (Figure 6 A, D, and G) and structural MRI volume is displayed in grayscale (Figure 6 B, E, and H) and the aligned images, that were created in Register, are displayed as merged images (Figure 6 C, F, and I). Both FA and b = 0 volumes were registered but only the FA-FLASH registration is illustrated.
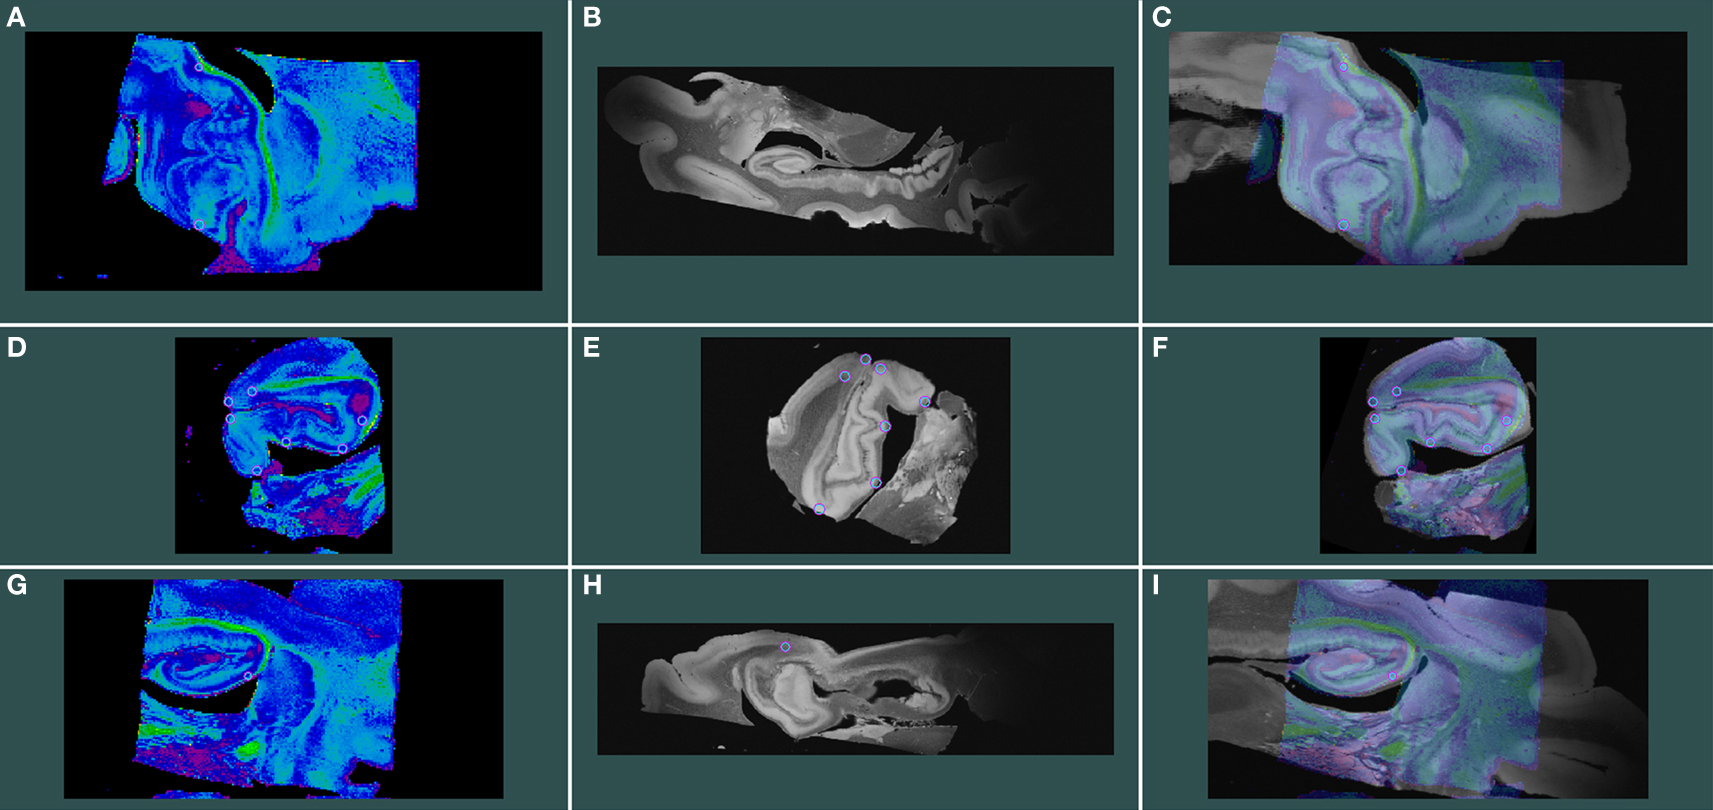
Figure 6. Isotropic 100 μm FLASH image registered with 200 μm isotropic DTI images. FA_DTI volume is shown in spectrum colors (A, D, and G) and structural MRI volume in grayscale (B, E, and H) and aligned volumes are shown as merged images (C, F, and I). Rows represent planes of cut; top row shows horizontal, middle row represents coronal and bottom panel illustrates sagittal.
Probabilistic Maps of Perforant Pathway
On high resolution diffusion images, we segmented four anatomical regions of interest on selected images throughout the rostrocaudal extent of entorhinal cortex to test the probability of connectivity. The regions included layer II entorhinal cortex, subicular cortex (included subiculum and presubiculum), dentate gyrus and hippocampal (mostly CA3) cortex. We used the diffusion toolkit (probtrackx) to generate probabilistic tractography maps between the regions EC and dentate gyrus. Using this algorithm, we were unable to track the entire pathway from EC to dentate gyrus and therefore we split the pathway into two parts: first from entorhinal to subicular regions (Figure 7 ) and second from subicular cortices to dentate gyrus (Figure 8 ). We found that all cases showed a non-zero probability connection (red and yellow) on the heatmap scale between entorhinal layer II, subicular cortices (presubiculum + subiculum) and dentate gyrus. Gadolinium treatment created higher probability pathways (Figures 7 A and 8 A) but also restricted the connection medially to the angular bundle (Figure 7 A) compared experiments on samples without gadolinium treatment (Figures 7 B–F and 8 B–F). Six cases with respective seed masks (EC layer II) and waypoints (subicular cortex) are illustrated in Figure 8 A–F. The cases with the highest FA values yielded the most consistent heatmaps between regions of interest and the reverse ROI run for seed mask (i.e. EC → SUB and SUB → EC) respectively. The six cases with seed masks in subicular cortex and waypoints in dentate gyrus are shown in Figure 9 . All six cases exhibit a non-zero probability connection between these regions of interest. As noted earlier, the maximum probability value is greater in the gadolinium treated case (Figure 7 A). It is interesting to note the perforating pattern observed in some cases (Figure 8 A and C). We performed test–retest in two cases treated with gadolinium and observed this pattern in both tests (data not illustrated). It is remarkable that we observed the perforating pattern in both gadolinium and non-gadolinium cases (Figure 8 A and C) and possibly to a lesser extent in other non-gadolinium cases (Figure 8 B, E, and F). Since the perforant pathway projection begins in EC layer II and superficial EC layer III, we tested the probability of hippocampus compared to dentate gyrus from EC. The constraints of all three components were too strict for our data. Again, we separated the perforant pathway into two parts and tested the subicular cortices’ connectivity to dentate gyrus and hippocampus. We set subicular cortex as seedmask and hippocampus as the waypoint and compared it to subicular cortex and dentate gyrus connectivity. The subicular (seedmask) and dentate gyrus (waypoint) parameters produced non-zero probability in all of our cases, but the subicular (seedmask) and hippocampal (waypoint) showed slightly less probability compared to the dentate gyrus. We also noticed some rostrocaudal differences in our data. Our probability maps show more robust probability between subicular and hippocampal labels anteriorly than posteriorly and conversely more robust probability between subicular and dentate gyrus posteriorly. The entorhinal–subicular and the subicular–dentate gyrus probability maps showed the highest probability of all the combinations in our connectivity experiments. We did not observe a consistent rostrocaudal relationship between the hippocampal formation and the medial–lateral organization with the entorhinal cortex. Diffusion spectrum imaging may aid in teasing out this organization since it is better suited for mapping out crossing fibers such as angular bundle in this instance.
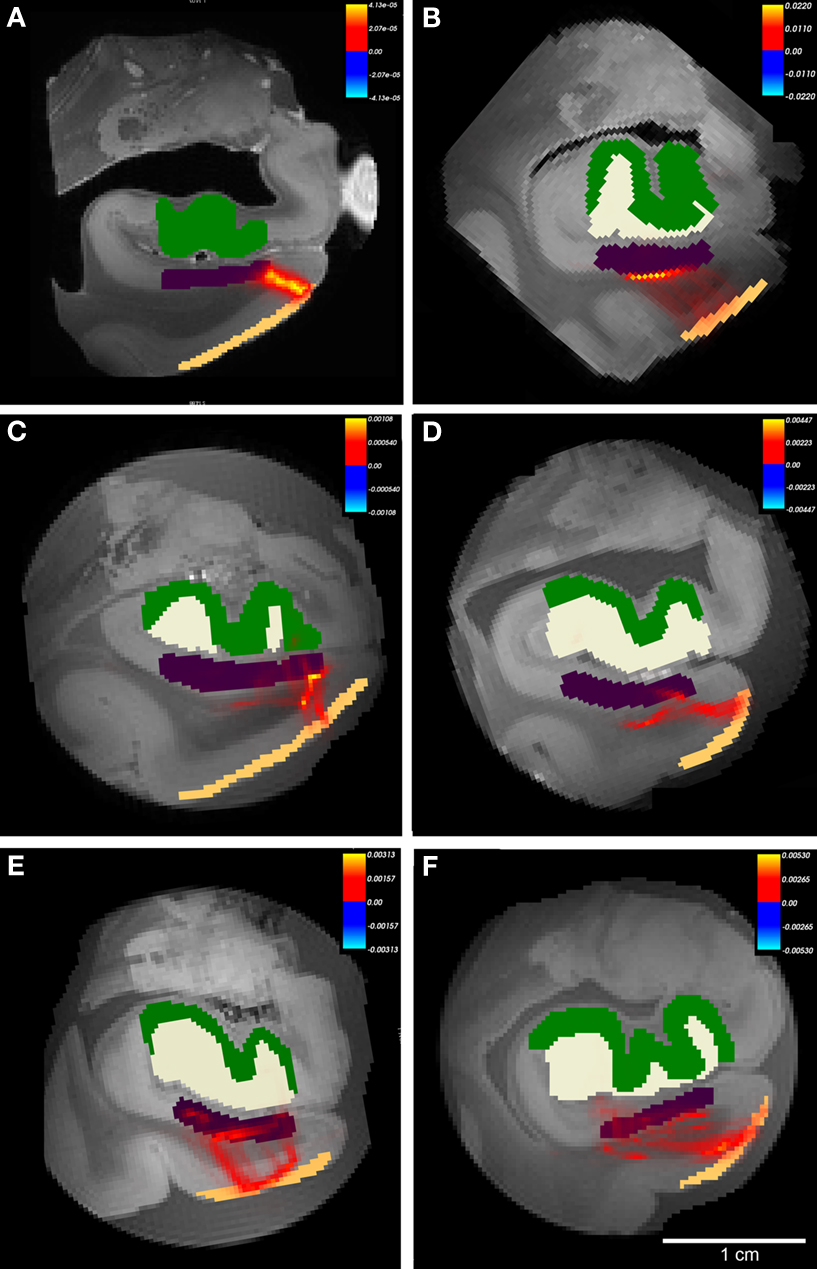
Figure 7. The probabilistic tractography results between labeled region entorhinal cortex layer II and subicular cortices (Subiculum+presubiculum) for all cases. In this illustration, probability for hippocampal formation was not tested and labels are shown for reference only. Color labels represent entorhinal layer II (beige), subiculum (purple), dentate gyrus (white) and hippocampus (green). Case A had gadolinium treatment prior to MR scanning and exhibits less noise. All cases showed connections with non-zero probability (A–F), but cases with higher FA generated higher values than cases with lower FA. Panels (A–F) represent cases 1-6, respectively with Table 1 . Heatmap scalebar located in upper right corner for all cases.
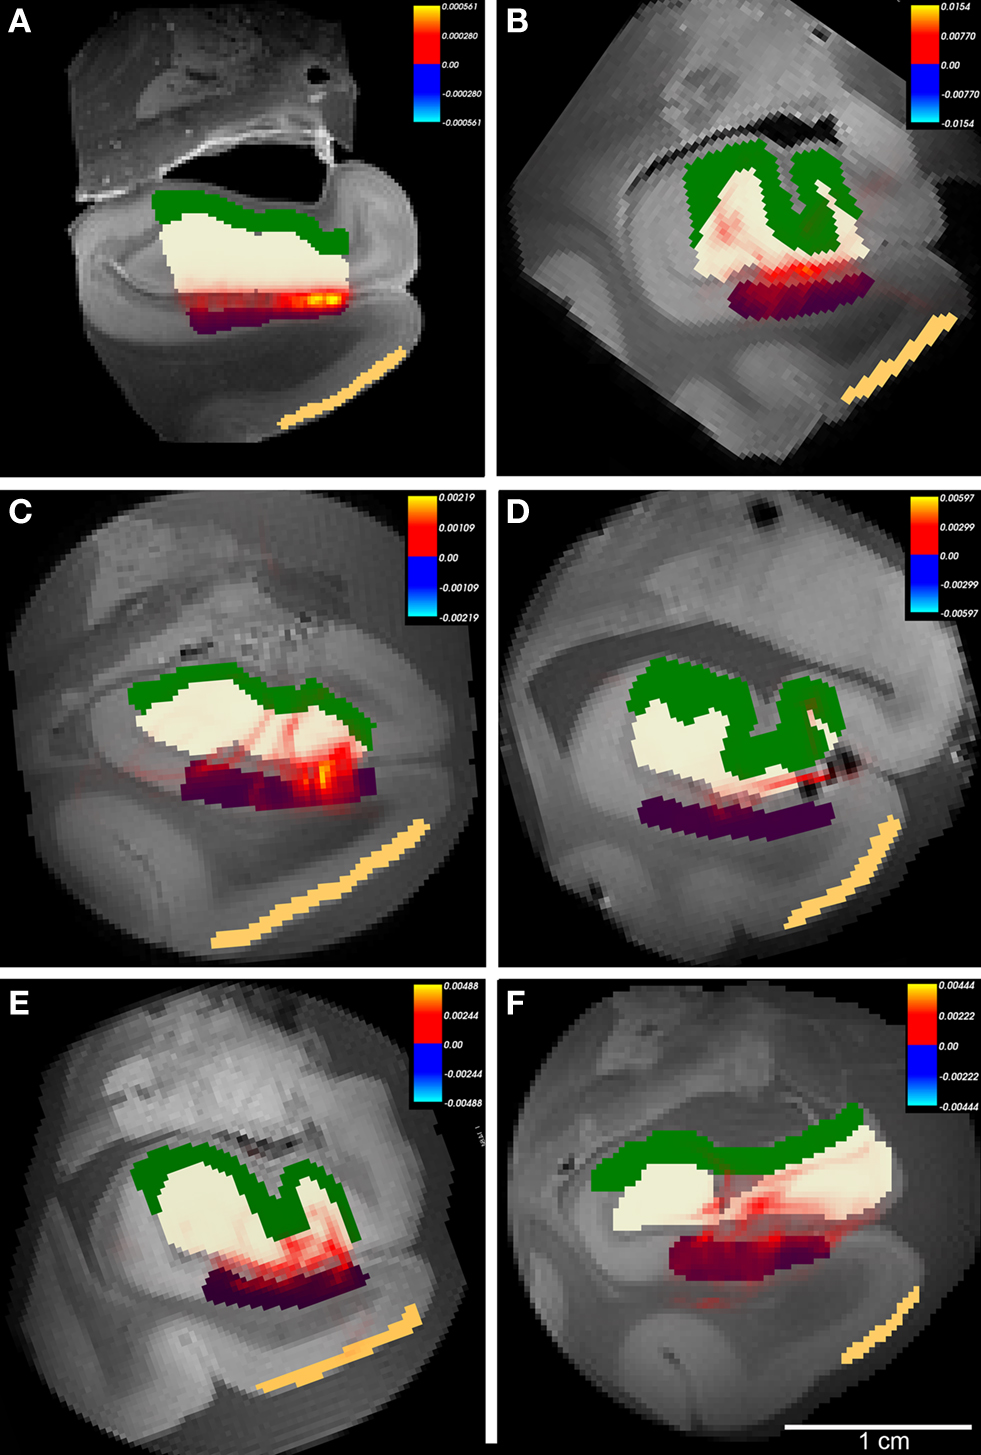
Figure 8. The probabilistic tractography results between labeled region subicular cortices (subiculum+presubiculum) and dentate gyrus for all cases. In this illustration, probability for entorhinal cortex layer II was not tested and label is shown for reference only. Color labels represent entorhinal layer II (beige), subiculum (purple), dentate gyrus (white) and hippocampus (green). Case A had gadolinium treatment prior to MR scanning and exhibits less noise. All cases showed connections with non-zero probability (A–F), but cases with higher FA generated higher values than cases with lower FA. Panels (A–F) represent cases 1-6, respectively with Table 1. Heatmap scalebar located in upper right corner for all cases.
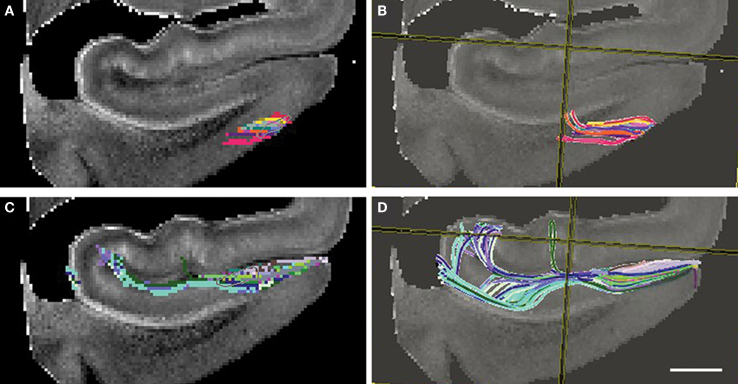
Figure 9. Diffusion tensor images at 4. 7T with fiber tracking (DTI Studio). Seed points outlined in (A) and (C) yield the perforant pathway streamlines in (B) and (D). Entorhinal layer II streamline is shown as it ascends into the angular bundle (B) and perforant pathway streamline shows an indication of crossing the hippocampal fissure and the temporoalvear pathway coursing around the hippocampal fissure (D). Magnification bar = 0.25 cm.
Fiber Tracking and Perforant Pathway in ex vivo Temporal Samples
The trajectory of the perforant pathway was mapped in 200 and 300 μm isotropic DTI data (n = 6) using the Fiber Assignment by Continuous Tracking (FACT) algorithm as implemented in DTI Studio (Jiang et al., 2006 ). An ROI was outlined in layer II EC (Figure 9 A) and was the seed ROI for the perforant pathway. DTI Studio generates the tracks deterministically following the direction of the highest diffusion from a given seed point. From the seed ROI, a deterministic voxel path was generated for the initial connection of entorhinodentate pathway and represented in Figure 9 B. The tracks begin at layer II and ascend toward the dentate gyrus and hippocampus. Given that there is a high incidence of crossing fibers in the parahippocampal white matter, the streamlines do not extend all the way dorsally to the hippocampal formation (Figure 9 B). A second ROI was seeded in subicular cortices and it is illustrated in Figure 9 C. This subicular ROI was confined to inferior to the hippocampal sulcus. The trajectory of perforant pathway, represented as DTI voxels, shows an indication that the perforant pathway crosses the hippocampal sulcus and perforating through the fissure. Both the temporoammonic (green, Figure 9 D) and the alvear (blue and aqua blue) pathways were demonstrated with deterministic fiber tracking. The alvear pathway is shown coursing around the hippocampal sulcus where it routes the long way to the hippocampus. Thus, using fiber tracking we have demonstrated DTI streamlines in medial temporal lobe samples. The directionality or orientation of the voxels and resulting streamlines suggest that the perforant pathway may cross the hippocampal sulcus.
Histological Validation of Perforant Pathway
To corroborate further the perforant pathway leg of Papez’s circuit, we acquired high resolution FLASH images on medial temporal lobe blocks (Figure 10 A), took digital photographs of the blockface during sectioning (Figure 10 B) and stained the histological tissue section with Luxol Fast Blue (Figure 10 C). The ex vivo MRI were acquired at a resolution of 100 μm (isotropic). Midway through the parahippocampal gyrus at this particular level of cut, EC is observed ventrally and the tail of the hippocampus is observed dorsally. In the MRI, granule cells of the dentate gyrus, which have a densely packed organization, have a bright signal in the T2⋆ weighted images relative to the surrounding tissue. Similarly, the EC and the presubiculum layer II show a brighter signal compared to the neighboring layers that are not as densely packed. In the same case, we stained with Luxol Fast Blue. We found that the blue myelin stain reflected the dark contrasted structures in the ex vivo MRI. Notably, in the histological sections, the Luxol Fast Blue (myelin) stain highlights the angular bundle, perforant pathway, and the alveus–fimbria–fornix (Figure 10 C). Fibers crossing the hippocampal sulcus are destroyed in histological preparations, increasing the importance of visualizing them with ex vivo MRI.
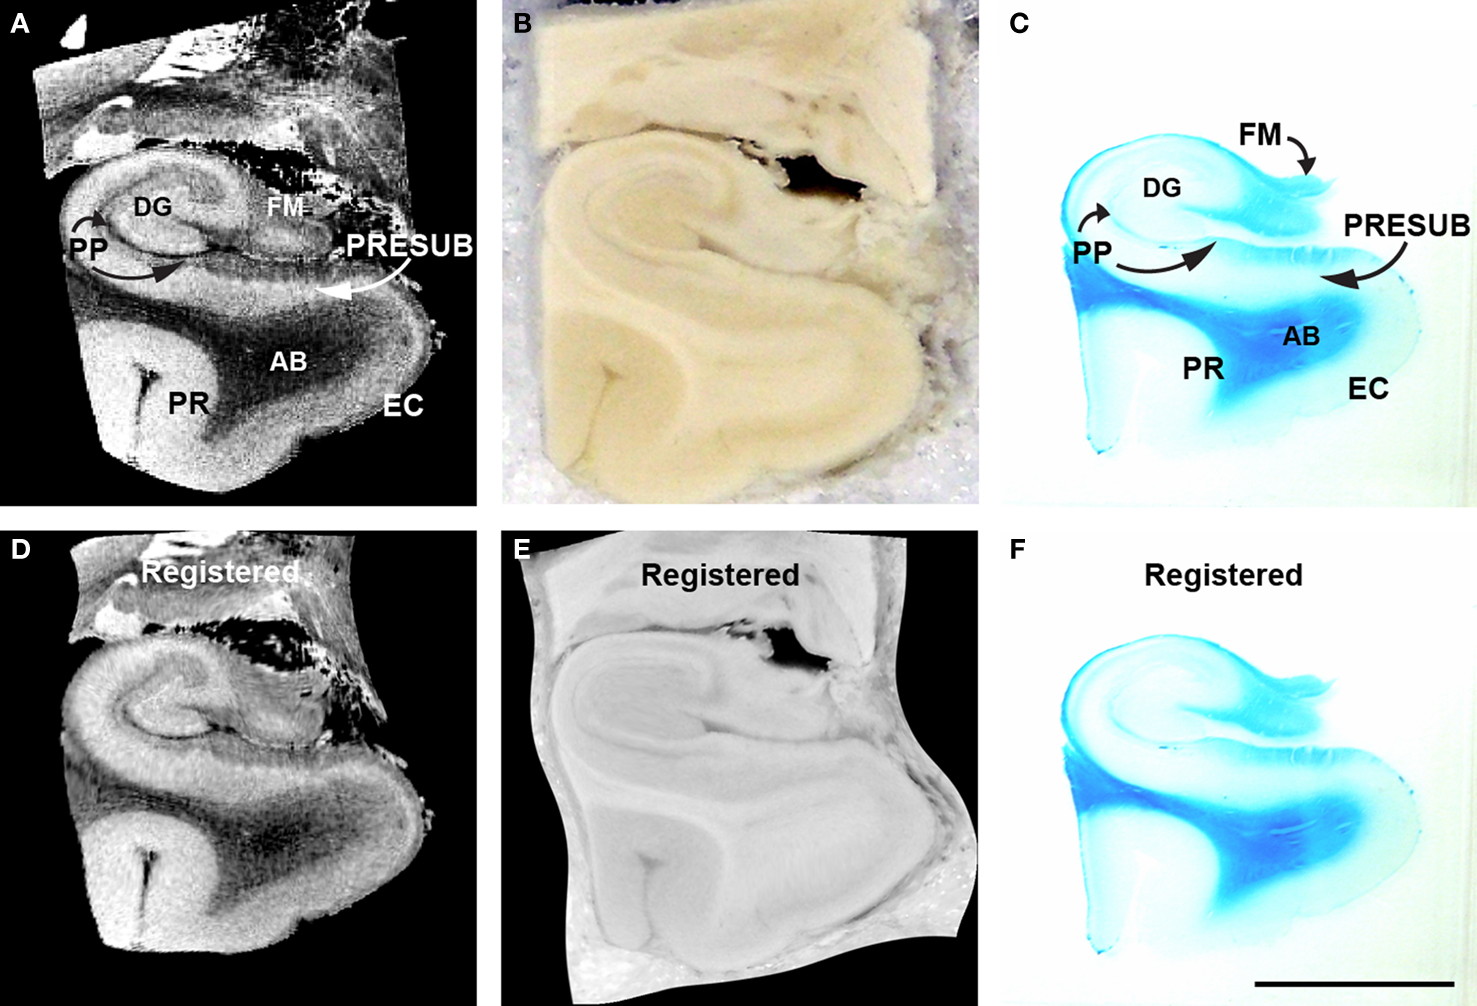
Figure 10. MRI (A), blockface (B), myelin stained (C) medial temporal lobe of corresponding sections and accompanying registered MRI (D) blockface (E) myelin stained (F). Perforant pathway is stained with Luxol fast blue, a stain that labels myelin. The perforant pathway is stained (C). Magnification bar = 1 cm. Abbreviations: AB, angular bundle; DG, dentate gyrus; EC, entorhinal cortex; FM, fimbria; PP, perforant pathway; PR, perirhinal cortex; PRESUB, presubiculum.
We illustrate an example of the pair-wise registration experiment where 2D histology, blockface and FLASH MRI images were spatially aligned (Figure 10 D–F). The histology slice was stained for myelin resulting in different contrast properties. Given the complexity of this example and a significantly torn sample, we initialized the registration process with global affine registration guided by manually identified landmark points. That was then followed by an automated affine and non-linear registration using mutual information and B-splines-based transformation encoding. Figure 10 demonstrates the slices before and after registration.
Discussion
Diffusion MRI allows us to generate image contrast based on the restrictions that the microstructure of white matter pathways in the brain impose upon endogenous water molecules. DTI is one method that provides a vector description of the endogenous water diffusion through highly oriented white matter and this vector information can be used to construct paths through the tissue. Water diffusion anisotropy can be characterized by the eigenvectors and eigenvalues of the tensor, and this orientation information can be further condensed into scalar fields such fractional anisotropy, which has become a common way to summarize DTI information in a quantitative manner.
The quality of ex vivo histological and MR imaging are affected by factors such as fixation effects and postmortem interval. For fixation, it has been shown that FA in DTI was stable until 72 h postmortem (Widjaja 2009 ; D’Arceuil et al., 2007 ; ) and that fixation does not alter FA in stroke brains (Sun, 2005 ). We have demonstrated that fixed brain SNR is superior to unfixed brain tissue and that fixed tissue strongly highlights the cytoarchitecture in layer IV in visual cortex. Although fixation adds another variable, ex vivo imaging allows validation with a histological gold standard, which is a crucial step in biomedical imaging.
Ex vivo imaging and specifically ex vivo DTI provides a window into the unsectioned brain to illustrate known pathways unlike any other neuroanatomical technique for the human. We imaged ex vivo temporal lobe samples with high resolution structural MRI at 7T and with high resolution DTI at 4.7T to evaluate the perforant pathway in the medial temporal lobe. In this work, we used FSL probabilistic tractography algorithms (Behrens et al., 2003b ) to generate probability maps for the perforant pathway and the FACT algorithm (Jiang et al., 2006 ) to generate deterministic streamlines in the human brain. We showed the perforant pathway structure in multi-echo FLASH ex vivo images and applied structural information to test hypotheses in DTI data in blocked medial temporal lobe samples. Given the fact that the angular bundle has highly mixed fiber orientations that includes superior–inferior fibers, medial–lateral fibers, and anterior–posterior fibers, a continuous perforant pathway from EC layer II to the distal dendrites of the dentate gyrus was difficult to demonstrate. Instead, we demonstrated the perforant pathway in sequential parts, first from EC layer II toward subiculum and then from subiculum/presubiculum to outer two-thirds of dentate gyrus. Using DTI, we have shown an indication that the perforant pathway may cross the hippocampal fissure in the human brain. These data add an additional line of evidence that supports what Cajal observed and illustrated a century ago (Cajal, 1911 , 1955 ). The perforant pathway trajectory was validated with monkey and rat models years later (Hjorth-Simonsen and Jeune, 1972 ; Van Hoesen and Pandya, 1975 ; Steward and Scoville, 1976 ; Witter et al., 1989 ). In addition to the portion that “perforates” the subicular cortices, the alvear component was also demonstrated and these data agree with tracing data in the macaque (Van Hoesen and Pandya, 1975 ; Witter et al., 1989 ; Witter and Amaral, 1991 ).
Cajal described the “spheno-cornual pathway as the exogenous fibers that enter Ammon’s horn and the fascia dentata”. In Cajal’s description, spheno corresponds to entorhinal cortex. He outlined four parts of entorhinal (II–III) output as it meets the angular bundle (1) cruciate spheno–cornual pathway, (2) superior perforating spheno–cornual pathway of Ammon’s horn (3) spheno–alvear pathway or bundle and (4) inferior perforating spheno–cornual pathway. We have observed a perforating pattern in our probability maps that are suggestive of the inferior and superior perforating pathway that Cajal noted. Cajal also stated in his study that fibers arise from entorhinal layer II and “that descend in little bundles across the inferior zones.” In two of our cases, we observed small bundles between entorhinal and subicular cortices and between subicular cortices and dentate gyrus. Cajal discussed the complexity of pathways, especially of the angular bundle, that most likely includes commissural fibers of presubiculum, commissural fibers of entorhinal cortex and crossed entorhinal hippocampal fibers and their presence make explicit interpretation difficult. We discerned a similar conclusion from our probabilistic tractography results, but suggest that although tractography may include additional fiber connectivity, the perforant pathway stands out with a striking appearance. Finally, Cajal commented on the difficulty in tracing pathways of an ‘enormous length and change in direction’ that still ring true as obstacles for modern diffusion methods.
Fiber tracking has improved and diffusion MRI has been validated with histological preparations with regard to fiber orientation in the rat brain (Leergaard et al. 2010 ). Others have described the FA and diffusivity of the human hippocampus ex vivo high resolution DTI to show delineation of hippocampal structure and color fiber orientation maps that show vertical orientation in the subicular white matter which is indicative of perforant pathway, although the resolution was not isotropic (Shepherd et al., 2007 ). Other studies have examined white matter tracts in DTI in vivo, such as the splenium of the corpus callosum, superior longitudinal fasciculus and corticospinal tract (Rose et al., 2000 ), but none have mapped out the trajectory of the perforant pathway. A human histological study concluded that the perforant pathway does not cross the hippocampal sulcus based on a gliotic signature (Mizutani and Kashara, 1995 ). Our histological data also was unable to delineate the perforant pathway across the sulcus as these fibers do not survive the sectioning process.
The perforant pathway contributes to a classic circuit known as Papez’s circuit (Papez, 1937 ; Blackstad, 1958 ; Hjorth-Simonsen, 1972 ; Hjorth-Simonsen and Jeune, 1972 ; Van Hoesen and Pandya, 1975 ; Steward and Scoville, 1976 ; Witter et al., 1989 ). We have demonstrated in high resolution (100 μm) ex vivo images the anatomical components of this famous limbic loop: EC → dentate gyrus → hippocampus → hypothalamus → thalamus → cingulated cortex → presubiculum→ and finally returns to → EC. In multi-echo FLASH data, we imaged each gray matter structure and accompanying white matter projection involved in Papez’s circuit. Our ex vivo images illustrate anatomical structures that have been shown by previous tracing studies that entorhinal projects to dentate gyrus via perforant pathway where it terminates on the outer two-thirds of the molecular layer of the dentate gyrus and the molecular layer (stratum lacusom-moleculare) of the hippocampal CA fields (Van Hoesen and Pandya, 1975 ; Steward and Scoville, 1976 ; Itaya et al., 1986 ; Rosene and Van Hoesen, 1987 ; Witter et al., 1989 ), dentate gyrus projects to CA3 via mossy fibers (Cajal, 1911 ; Blackstad et al., 1970 ), CA3 projects to CA1/subiculum via Schaffer collaterals (Lorente de No, 1934 ; Kondo et al., 2008 , 2009 ), CA1/subicular cortices projects to the mammillary bodies of the hypothalamus (Swanson and Cowan, 1977 ; Swanson et al., 1978 ; Aggleton et al., 2005 ; Saunders et al., 2005 ), mammillary bodies projects to the anterior nucleus of the thalamus via the mammillothalamic tract (Powell and Cowan, 1954 ; Raisman et al., 1966 ; Vann et al., 2007 ), anterior nucleus of the thalamus projects to cingulate cortex via the anterior limb of the internal capsule (Domesick, 1969 ; Vogt et al., 1979 ; Vogt and Pandya, 1987 ), cingulate cortex projects to presubiculum (Pandya et al., 1981 ) via the cingulum bundle and finally presubiculum projects to EC (Shipley, 1974 ; Saunders and Rosene, 1988 ). It is important to note that presubiculum projects to layer III entorhinal cortex in the monkey (Saunders and Rosene, 1988 ) and that projection could be represented in our DTI probability maps. However, we were particular to label layer II entorhinal cortex and not layer III or deep layers entorhinal cortex as not to confound the probabilistic tractography results.
In this report, we have shown perforant pathway validity with registration to myelin stained tissue sections, demonstrated accuracy by aligning high resolution structural MRI FLASH images to diffusion volumes and shown reliability with test–retest cases in multiple cases and finally with two fiber tracking methods.
The destruction of the perforant pathway is one of the earliest changes in Alzheimer’s disease where pathology in layer II entorhinal cortex destroys the white matter tract, the perforant pathway (Hyman et al., 1984 ; Salat et al., 2008 ). Diffusion changes have been shown in mild cognitive impairment and AD (Kalus et al., 2006 ; Medina et al., 2006 ) and in comparison with mutation carriers where results suggested that FA in fornix was the most outstanding predictor of mutation category (Ringman et al., 2007 ). Besides Alzheimer’s disease, ALS have also reported cognitive deficits and damaged perforant pathway (Takeda et al., 2007 ) and finally, in temporal lobe epilepsy models have shown a loss of hippocampal neurons due to sustained electrical stimulation in the perforant pathway in animal models (Sloviter, 1983 ; Meldrum, 1993 ; Kienzler et al., 2006 , 2009 ). Thus, it is evident that the vitality of perforant pathway has widespread effects and further documentation of its strength and deterioration will have a significant clinical impact.
Conflict of Interest Statement
The authors declare that the research was conducted in the absence of any commercial or financial relationships that could be construed as a potential conflict of interest.
Acknowledgments
The authors would like to thank Alex de Crespigny and George Dai for excellent technical assistance and advice with DTI. This research was supported by NIH AG028521.
Footnotes
References
Aggleton, J. P., Vann, S. D., and Saunders, R. C. (2005). Projections from the hippocampal region to the mammillary bodies in macaque monkeys. Eur. J. Neurosci. 22, 2519–2530.
Arnold, S. E., Hyman, B. T., Flory, J., Damasio, A. R., and Van Hoesen, G. W. (1991). The topographical and neuroanatomical distribution of neurofibrillary tangles and neuritic plaques in the cerebral cortex of patients with Alzheimer’s disease. Cereb. Cortex 1, 103–116.
Arriagada, P. V., Marzloff, K., and Hyman, B. T. (1992). Distribution of Alzheimer-type pathologic changes in nondemented elderly individuals matches the pattern in Alzheimer’s disease. Neurology 42, 1681–1688.
Augustinack, J. C., van der Kouwe, A. J., Blackwell, M. L., Salat, D. H., Wiggins, C. J., Frosch, M. P., Wiggins, G. C., Potthast, A., Wald, L. L., and Fischl, B. R. (2005). Detection of entorhinal layer II using 7Tesla [corrected] magnetic resonance imaging. Ann. Neurol. 57, 489–494.
Behrens, T. E., Johansen-Berg, H., Woolrich, M. W., Smith, S. M., Wheeler-Kingshott, C. A., Boulby, P. A., Barker, G. J., Sillery, E. L., Sheehan, K., Ciccarelli, O., Thompson, A. J., Brady, J. M., and Matthews, P. M. (2003a). Non-invasive mapping of connections between human thalamus and cortex using diffusion imaging. Nat. Neurosci. 6, 750–757.
Behrens, T. E., Woolrich, M. W., Jenkinson, M., Johansen-Berg, H., Nunes, R. G., Clare, S., Matthews, P. M., Brady, J. M., and Smith, S. M. (2003b). Characterization and propagation of uncertainty in diffusion-weighted MR imaging. Magn. Reson. Med. 50, 1077–1088.
Blackstad, T. W. (1958). On the termination of some afferents to the hippocampus and fascia dentata; an experimental study in the rat. Acta Anat. (Basel) 35, 202–214.
Blackstad, T. W., Brink, K., Hem, J., and Jeune, B. (1970). Distribution of hippocampal mossy fibers in the rat. An experimental study with silver impregnation methods. J. Comp. Neurol. 138, 433–449.
Braak, H., and Braak, E. (1985). On areas of transition between entorhinal allocortex and temporal isocortex in the human brain. Normal morphology and lamina-specific pathology in Alzheimer’s disease. Acta Neuropathol. 68, 325–332.
Braak, H., and Braak, E. (1991). Neuropathological stageing of Alzheimer-related changes. Acta Neuropathol. 82, 239–259.
Chakravarty, M. M., Bertrand, G., Hodge, C. P., Sadikot, A. F., and Collins, D. L. (2006). The creation of a brain atlas for image guided neurosurgery using serial histological data. Neuroimage 30, 359–376.
Conturo, T. E., Lori, N. F., Cull, T. S., Akbudak, E., Snyder, A. Z., Shimony, J. S., McKinstry, R. C., Burton, H., and Raichle, M. E. (1999). Tracking neuronal fiber pathways in the living human brain. Proc. Natl. Acad. Sci. USA 96, 10422–10427.
D’Arceuil, H., and de Crespigny, A. (2007). The effects of brain tissue decomposition on diffusion tensor imaging and tractography. Neuroimage 36, 64–68.
Fischl, B., Salat, D. H., van der Kouwe, A. J., Makris, N., Segonne, F., Quinn, B. T., and Dale, A. M. (2004). Sequence-independent segmentation of magnetic resonance images. Neuroimage 23(Suppl. 1), S69–S84.
Gundersen, H. J., Jensen, E. B., Kieu, K., and Nielsen, J. (1999). The efficiency of systematic sampling in stereology–reconsidered. J Microsc. 193, 199–211.
Hjorth-Simonsen, A. (1972). Projection of the lateral part of the entorhinal area to the hippocampus and fascia dentata. J. Comp. Neurol. 146, 219–232.
Hjorth-Simonsen, A., and Jeune, B. (1972). Origin and termination of the hippocampal perforant path in the rat studied by silver impregnation. J. Comp. Neurol. 144, 215–232.
Hyman, B. T., Kromer, L. J., and Van Hoesen, G. W. (1988). A direct demonstration of the perforant pathway terminal zone in Alzheimer’s disease using the monoclonal antibody Alz-50. Brain Res. 450, 392–397.
Hyman, B. T., Van Hoesen, G. W., Damasio, A. R., and Barnes, C. L. (1984). Alzheimer’s disease: cell-specific pathology isolates the hippocampal formation. Science 225, 1168–1170.
Hyman, B. T., Van Hoesen, G. W., Kromer, L. J., and Damasio, A. R. (1986). Perforant pathway changes and the memory impairment of Alzheimer’s disease. Ann. Neurol. 20, 472–481.
Itaya, S. K., Van Hoesen, G. W., and Barnes, C. L. (1986). Anterograde transsynaptic transport of WGA-HRP in the limbic system of rat and monkey. Brain Res. 398, 397–402.
Jiang, H., van Zijl, P. C., Kim, J., Pearlson, G. D., and Mori, S. (2006). DtiStudio: resource program for diffusion tensor computation and fiber bundle tracking. Comput. Methods Programs Biomed. 81, 106–116.
Jones, E. G., and Powell, T. P. (1970). An anatomical study of converging sensory pathways within the cerebral cortex of the monkey. Brain 93, 793–820.
Kalus, P., Slotboom, J., Gallinat, J., Mahlberg, R., Cattapan-Ludewig, K., Wiest, R., Nyffeler, T., Buri, C., Federspiel, A., Kunz, D., Schroth, G., and Kiefer, C. (2006). Examining the gateway to the limbic system with diffusion tensor imaging: the perforant pathway in dementia. Neuroimage 30, 713–720.
Kienzler, F., Jedlicka, P., Vuksic, M., Deller, T., and Schwarzacher, S. W. (2006). Excitotoxic hippocampal neuron loss following sustained electrical stimulation of the perforant pathway in the mouse. Brain Res. 1085, 195–198.
Kienzler, F., Norwood, B. A., and Sloviter, R. S. (2009). Hippocampal injury, atrophy, synaptic reorganization, and epileptogenesis after perforant pathway stimulation-induced status epilepticus in the mouse. J. Comp. Neurol. 515, 181–196.
Kondo, H., Lavenex, P., and Amaral, D. G. (2008). Intrinsic connections of the macaque monkey hippocampal formation: I. Dentate gyrus. J. Comp. Neurol. 511, 497–520.
Kondo, H., Lavenex, P., and Amaral, D. G. (2009). Intrinsic connections of the macaque monkey hippocampal formation: II. CA3 connections. J. Comp. Neurol. 515, 349–377.
Leergaard, T. B., White, N. S., de Crespigny, A., Bolstad, I., D’Arceuil, H., Bjaalie, J. G., and Dale, A. M. (2010). Quantitative histological validation of diffusion MRI fiber orientation distributions in the rat brain. PLoS One. 5, e8595 doi: 10.1371/journal.pone.0008595.
Lorente de No, R. (1934). Studies on the structure of the cerebral cortex II Continuation of the study of ammonic system. J. Psychol. Neurol. 46, 113–177.
Lori, N. F., Akbudak, E., Shimony, J. S., Cull, T. S., Snyder, A. Z., Guillory, R. K., and Conturo, T. E., (2002). Diffusion tensor fiber tracking of human brain connectivity: aquisition methods, reliability analysis and biological results. NMR Biomed. 15, 494–515.
Maes, F., Collignon, A., Vandermeulen, D., Marchal, G., and Suetens, P. (1997). Multimodality image registration by maximization of mutual information. IEEE Trans. Med. Imaging 16, 187–198.
Medina, D., DeToledo-Morrell, L., Urresta, F., Gabrieli, J. D., Moseley, M., Fleischman, D., Bennett, D. A., Leurgans, S., Turner, D. A., and Stebbins, G. T. (2006). White matter changes in mild cognitive impairment and AD: A diffusion tensor imaging study. Neurobiol. Aging 27, 663–672.
Meldrum, B. S. (1993). Excitotoxicity and selective neuronal loss in epilepsy. Brain Pathol. 3, 405–412.
Mizutani, T., and Kashara, M. (1995). Degeneration of the intrahippocampal routes of the perforant and alvear pathways in senile dementia of Alzheimer type. Neurosci. Lett. 184, 141–144.
Mori, S., Kaufmann, W. E., Davatzikos, C., Stieltjes, B., Amodei, L., Fredericksen, K., Pearlson, G. D., Melhem, E. R., Solaiyappan, M., Raymond, G. V., Moser, H. W., and van Zijl, P. C. (2002). Imaging cortical association tracts in the human brain using diffusion-tensor-based axonal tracking. Magn. Reson. Med. 47, 215–223.
Pandya, D. N., Van Hoesen, G. W., and Mesulam, M. M. (1981). Efferent connections of the cingulate gyrus in the rhesus monkey. Exp. Brain Res. 42, 319–330.
Powell, T. P., and Cowan, W. M. (1954). The origin of the mamillo-thalamic tract in the rat. J. Anat. 88, 489–497.
Raisman, G., Cowan, W. M., and Powell, T. P. (1966). An experimental analysis of the efferent projection of the hippocampus. Brain 89, 83–108.
Ringman, J. M., O’Neill, J., Geschwind, D., Medina, L., Apostolova, L. G., Rodriguez, Y., Schaffer, B., Varpetian, A., Tseng, B., Ortiz, F., Fitten, J., Cummings, J. L., and Bartzokis, G. (2007). Diffusion tensor imaging in preclinical and presymptomatic carriers of familial Alzheimer’s disease mutations. Brain 130, 1767–1776.
Rose, S. E., Chen, F., Chalk, J. B., Zelaya, F. O., Strugnell, W. E., Benson, M., Semple, J., and Doddrell, D. M. (2000). Loss of connectivity in Alzheimer’s disease: an evaluation of white matter tract integrity with colour coded MR diffusion tensor imaging. J. Neurol. Neurosurg. Psychiatry 69, 528–530.
Rosene, D. L., and Van Hoesen, G. W. (1987). “The hippocampal formation of the primate brain: A review of some comparative aspects of cytoarchitecture and connections,” in Cerebral Cortex. Further Aspects of Cortical Function, Including Hippocampus, Vol. 6, eds E. G. Jones and A. Peters (Plenum Press, New York), 345–456.
Rueckert, D., Sonoda, L. I., Hayes, C., Hill, D. L., Leach, M. O., and Hawkes, D. J. (1999). Nonrigid registration using free-form deformations: application to breast MR images. IEEE Trans Med Imaging 18, 712–721.
Salat, D. H., Tuch, D. S., van der Kouwe, A. J., Greve, D. N., Pappu, V., Lee, S. Y., Hevelone, N. D., Zaleta, A. K., Growdon, J. H., Corkin, S., Fischl, B., and Rosas, H. D. (2008). White matter pathology isolates the hippocampal formation in Alzheimer’s disease. Neurobiol. Aging 31, 244–256.
Saunders, R. C., Mishkin, M., and Aggleton, J. P. (2005). Projections from the entorhinal cortex, perirhinal cortex, presubiculum, and parasubiculum to the medial thalamus in macaque monkeys: identifying different pathways using disconnection techniques. Exp. Brain Res. 167, 1–16.
Saunders, R. C., and Rosene, D. L. (1988). A comparison of the efferents of the amygdala and the hippocampal formation in the rhesus monkey: I. Convergence in the entorhinal, prorhinal, and perirhinal cortices. J. Comp. Neurol. 271, 153–184.
Shepherd, T. M., Ozarslan, E., Yachnis, A. T., King, M. A., and Blackband, S. J. (2007). Diffusion tensor microscopy indicates the cytoarchitectural basis for diffusion anisotropy in the human hippocampus. AJNR Am. J. Neuroradiol. 28, 958–964.
Shimony, J. S., McKinstry, R. C., Akbudak, E., Aronovitz, J. A., Snyder, A. Z., Lori, N. F., Cull, T. S., and Conturo, T. E. (1999). Quantitative diffusion-tensor anisotropy brain MR imaging: normative human data and anatomic analysis. Radiology 212, 770–784.
Shipley, M. T. (1974). Presubiculum afferents to the entorhinal area and the Papez circuit. Brain Res. 67, 162–168.
Sloviter, R. S. (1983). “Epileptic” brain damage in rats induced by sustained electrical stimulation of the perforant path. I. Acute electrophysiological and light microscopic studies. Brain Res. Bull. 10, 675–697.
Steward, O., and Scoville, S. A. (1976). Cells of origin of entorhinal cortical afferents to the hippocampus and fascia dentata of the rat. J. Comp. Neurol. 169, 347–370.
Sun, S. W., Song, S. K., Harms, M. P., Lin, S. J., Holtzman, D. M., Merchant, K. M., and Kotyk, J. J. (2005). Detection of age-dependent brain injury in a mouse model of brain amyloidosis associated with Alzheimer’s disease using magnetic resonance diffusion tensor imaging. Exp. Neurol. 191, 77–85.
Swanson, L. W., and Cowan, W. M. (1977). An autoradiographic study of the organization of the efferent connections of the hippocampal formation in the rat. J. Comp. Neurol. 172, 49–84.
Swanson, L. W., Wyss, J. M., and Cowan, W. M. (1978). An autoradiographic study of the organization of intrahippocampal association pathways in the rat. J. Comp. Neurol. 181, 681–715.
Takeda, T., Uchihara, T., Mochizuki, Y., Mizutani, T., and Iwata, M. (2007). Memory deficits in amyotrophic lateral sclerosis patients with dementia and degeneration of the perforant pathway A clinicopathological study. J. Neurol. Sci. 260, 225–230.
Van Hoesen, G. W., and Pandya, D. N. (1975). Some connections of the entorhinal (area 28) and perirhinal (area 35) cortices of the rhesus monkey. III. Efferent connections. Brain Res. 95, 39–59.
Van Hoesen, G. W., Pandya, D. N., and Butters, N. (1972). Cortical afferents to the entorhinal cortex of the Rhesus monkey. Science 175, 1471–1473.
Vann, S. D., Saunders, R. C., and Aggleton, J. P. (2007). Distinct, parallel pathways link the medial mammillary bodies to the anterior thalamus in macaque monkeys. Eur. J. Neurosci. 26, 1575–1586.
Vogt, B. A., and Pandya, D. N. (1987). Cingulate cortex of the rhesus monkey: II. Cortical afferents. J. Comp. Neurol. 262, 271–289.
Vogt, B. A., Rosene, D. L., and Pandya, D. N. (1979). Thalamic and cortical afferents differentiate anterior from posterior cingulate cortex in the monkey. Science 204, 205–207.
Wells, W. M., Viola, P., Atsumi, H., Nakajima, S., and Kikinis, R. (1996). Multi-modal volume registration by maximization of mutual information. Med. Image Anal. 1, 35–52.
West, M. J., Slomianka, L., and Gundersen, H. J. (1991). Unbiased stereological estimation of the total number of neurons in the subdivisions of the rat hippocampus using the optical fractionator. Anat. Rec. 231, 482–497.
Widjaja, E., Wei, X., Vidarsson, L., Moineddin, R., Macgowan, C. K., and Nilsson, D. (2009). Alteration of diffusion tensor parameters in postmortem brain. Magn. Reson. Imaging 27, 865–870.
Witter, M. P., and Amaral, D. G. (1991). Entorhinal cortex of the monkey: V. Projections to the dentate gyrus, hippocampus, and subicular complex. J. Comp. Neurol. 307, 437–459.
Witter, M. P., Van Hoesen, G. W., and Amaral, D. G. (1989). Topographical organization of the entorhinal projection to the dentate gyrus of the monkey. J. Neurosci. 9, 216–228.
Keywords: entorhinal cortex, dentate gyrus, hippocampus, subiculum, presubiculum, resolution
Citation: Augustinack JC, Helmer K, Huber KE, Kakunoori S, Zöllei L and Fischl B (2010) Direct visualization of the perforant pathway in the human brain with ex vivo diffusion tensor imaging. Front. Hum. Neurosci. 4:42. doi: 10.3389/fnhum.2010.00042
Received: 27 August 2009;
Paper pending published: 03 February 2010;
Accepted: 26 April 2010;
Published online: 28 May 2010
Edited by:
Andreas Jeromin, Banyan Biomarkers, USAReviewed by:
Konstantinos Arfanakis, Illinois Institute of Technology, USAJames Gee, University of Pennsylvania, USA
Christopher Kroenke, Oregon Health and Science University, USA
Copyright: © 2010 Augustinack, Helmer, Huber, Kakunoori, Zöllei and Fischl. This is an open-access article subject to an exclusive license agreement between the authors and the Frontiers Research Foundation, which permits unrestricted use, distribution, and reproduction in any medium, provided the original authors and source are credited.
*Correspondence: Jean Augustinack, Athinoula A. Martinos Center for Biomedical Imaging, Massachusetts General Hospital, Harvard Medical School, Building 149, 13th Street, Charlestown, MA 02129, USA. e-mail: jean@nmr.mgh.harvard.edu
Abbreviations: AB, angular bundle; AL, alveus; CC, corpus callosum; CS, collateral sulcus; DG, dentate gyrus; EC, entorhinal cortex; FLASH, fast low angle shot; ff, fimbria–fornix; f, fornix; HP, hippocampus; HF, hippocampal fissure; LPE, lamina principalis externa; MR, magnetic resonance; PARA, parasubiculum; PreSUB, presubiculum; PP, perforant pathway; PR, perirhinal cortex; SUB, subiculum; TE, echo time; TR, repetition time; UHP, uncal hippocampus.