Spatial probability aids visual stimulus discrimination
- 1 Department of Psychology, University of Waterloo, Waterloo, ON, Canada
- 2 Centre for Theoretical Neuroscience, University of Waterloo, Waterloo, ON, Canada
We investigated whether the statistical predictability of a target’s location would influence how quickly and accurately it was classified. Recent results have suggested that spatial probability can be a cue for the allocation of attention in visual search. One explanation for probability cuing is spatial repetition priming. In our two experiments we used probability distributions that were continuous across the display rather than relying on a few arbitrary screen locations. This produced fewer spatial repeats and allowed us to dissociate the effect of a high-probability location from that of short-term spatial repetition. The task required participants to quickly judge the color of a single dot presented on a computer screen. In Experiment 1, targets were more probable in an off-center hotspot of high-probability that gradually declined to a background rate. Targets garnered faster responses if they were near earlier target locations (priming) and if they were near the high-probability hotspot (probability cuing). In Experiment 2, target locations were chosen on three concentric circles around fixation. One circle contained 80% of targets. The value of this ring distribution is that it allowed for a spatially restricted high-probability zone in which sequentially repeated trials were not likely to be physically close. Participant performance was sensitive to the high-probability circle in addition to the expected effects of eccentricity and the distance to recent targets. These two experiments suggest that inhomogeneities in spatial probability can be learned and used by participants on-line and without prompting as an aid for visual stimulus discrimination and that spatial repetition priming is not a sufficient explanation for this effect. Future models of attention should consider explicitly incorporating the probabilities of targets locations and features.
Introduction
Experimental demonstrations of attention often report changes in performance as correlates of changes in information. For example, in the paradigmatic Posner cuing task (Posner, 1980), participants report whether a visual target appears on their left or right. Shortly before the target’s appearance, a cue is displayed. The cue may be symbolic, such as an arrow pointing to one side (endogenous) or physical, such as a flash of light (exogenous). Participant responses are faster when the cue indicates the side of the target. One reason for the fecundity of the Posner paradigm is that it captures, simply, the essence of many complicated real world contingencies. Driving down the highway one is constantly cued by arrows pointing toward on-ramps and off-ramps, and flashing lights indicate merging vehicles. But many searches occur without the explicit guidance of external cues. The morning’s search for your house keys is not guided by indicative arrows or flashing lights, but by the knowledge of where you expect them, and where you expect to find them is related to where it was likely that you left them.
This “probabilistic” cuing seems in keeping with other demonstrations of statistical influences on behavior. In statistical learning, the probabilistic contingency between stimuli and rewards influences choice behavior; however it is not clear that it affects perception and detection. In contextual cuing (Chun and Jiang, 1998), the familiar structure of a search array makes search more efficient, but in its purest form the cuing context is presented simultaneously with the target; there is no antecedent bias to a particular location or target feature like the cues used in a Posner task.
One of the first demonstrations of probabilistic cuing in the Posnerian sense, was by Geng and Behrmann (2002). In this study, participants identified a letter target (L or F) hidden in an array of distractor letters (T and E). Items appeared on a grid of six columns and three rows. Participants were first tested in a baseline condition where each column was equally likely to contain the target and then in an “uneven” condition where the three columns on one side of the computer screen contained the target 80% of the time. Geng and Behrmann (2002) found that participants improved from the first to the second session, but that there was an additional improvement for targets occurring in the high-probability columns when compared with the columns on the low-probability side of the screen. To evaluate if some component of the benefit could be attributed to attentional mechanisms, Geng and Behrmann (2002) tested seven participants with hemi-spatial neglect and found that these participants too showed an improvement in their reaction time to targets in the high-probability columns.
Subsequently, the basic result has been confirmed, but the mechanism has been challenged. Walthew and Gilchrist (2006) confirmed an RT and accuracy benefit for visual targets appearing on a high-probability or “rich” side. However, the authors conclude that, “When short-term target location repetitions were restricted, there was no statistical learning effect.” We do not share this conclusion, but will defer further comment until the Section “Discussion.” The thesis of Walthew and Gilchrist (2006) is that benefits in discriminating and detecting visual targets such as that reported by Geng and Behrmann (2002, 2005), but also Miller (1988) and Hoffmann and Kunde (1999), reflect trial to trial priming rather than the learning of a spatial probability distribution (see also Rabbitt et al., 1977, 1979; Shore and Klein, 2000).
Repetition priming refers to a sensitization of a participant to respond to a particular stimulus as a result of some similar stimulus having recently been presented; the literature on visual search and repetition priming have recently been reviewed (Kristjánsson and Campana, 2010). A classic example of repetition priming for visual stimuli is the work of Maljkovic and Nakayama (1994, 1996). In one experiment, participants reported which side of a diamond shape had a wedge removed. There were two distractor shapes and the target diamond could occur in either of two positions. When Maljkovic and Nakayama (1996) looked at the facilitation for response time when the target diamond appeared in the same position as it had on a prior trial, they found a facilitation from the seven previous trials. As Walthew and Gilchrist (2006) emphasize, frequent spatial repeats are a by-product of having one out of a few positions be a high-probability position and having trial by trial independence. This fact of probability combined with the potent potentiation of responses by repetition priming make pertinent the suggestion that the appearance of long time frame probability effects merely reflects the consequence of local time repetitions.
One common thread in the prior work is that the visual search tasks used, in general, few spatial positions. Geng and Behrmann (2002) were relatively expansive when they used 18 locations. Walthew and Gilchrist (2006) used eight. Some of the experiments by Miller (1988) used four while some of Maljkovic and Nakayama (1996) used only two. This limitation on spatial locations for targets means that only very coarse spatial probability distributions can be studied and it makes it difficult to analyze how the effects of repeats are modulated by their spatial separation from earlier trials. When such data are analyzed in terms of position, or when the data are aggregated into “column” or “side,” the analysis of spatial probability effects becomes quite coarse.
We explore these issues in two experiments where we manipulate spatial probability with finer resolution. For both the experiments that we report, the task of the participants was to perform a color classification. In one experiment, we imposed a spatially continuous probability distribution for targets across the computer screen. This made true spatial repeats almost non-existent while allowing us to have both an inhomogeneous spatial probability distribution and sequential independence of trials. In the second experiment, we imposed a concentric annular organization for target locations with, again, a spatially continuous probability distribution on each of the three annuli. One annulus was four times more probable. Our results show, as has been shown before, that participants do perform better when targets appear in positions of high spatial probability and that spatial probability modulates but does not trump other performance effects (e.g., targets appearing parafoveally are still responded to more quickly than extrafoveal targets). As our task can measure repetition priming effects, we also show that repetition priming does not solely account for our data.
While the effects of spatial probability and repetition priming in visual discrimination and visual search tasks are intrinsically interesting, and may have some practical import for occupations in which visual search is prominent, we feel there is a more important motivation for this type of research. As a great deal of recent work reveals, the statistical structure of the environment has an important effect on perceptual and motor performance (Ernst and Banks, 2002; Guo et al., 2004; Kersten et al., 2004; Knill and Pouget, 2004; Tassinari et al., 2006; Schwartz et al., 2007). As a consequence, it has become increasingly popular to evaluate if people are Bayesian observers. Do people, when they perform under conditions of noise and changes in stimulus probability, achieve results that would be ideal for a true Bayesian observer? Our data are relevant to this question because they demonstrate that people can learn to use on-line, and without awareness a prior probability distribution and that these benefits cannot be accounted for by recourse to short-term priming effects. While not demonstrative that we are “Bayesian attenders,” our data, and data like them, make it more probable that Bayesian accounts, which are so prevalent in motor control and perception, may also have a place in providing accounts for attentional effects.
Materials and Methods
Both of the experiments in this report used variants of the same simple visual classification task. Participants viewed a centered fixation cross and then a small circle appeared in one of two colors. Participants pressed one of two buttons to indicate the color. Trial pacing was rapid. Spatial locations for targets were drawn from non-uniform, spatially continuous probability distributions, and this was the principal experimental manipulation; participants were naive to the spatial distribution of locations. Response measures were RT and accuracy.
Experiment 1
Twelve university students (seven female) participated in the experiment for course credit. This research was approved by the University of Waterloo Office of Research Ethics and informed consent was obtained from all participants.
Participants sat at a viewing distance of approximately 65 cm from a flat CRT monitor (36.5 cm × 27.5 cm viewable area, approximately 31° × 24° of visual angle computed at screen center) running at 85 Hz and at 640 × 480 resolution. Participants completed a practice block of 100 trials and then four blocks of 400 trials each.
Each trial began with a 1° × 1° white fixation cross appearing at the center of the screen for 600 ms. Participant instructions had requested participants to look at the fixation spot for each trial.
Immediately following this interval, the fixation spot was removed and a target appeared. Targets were filled red or green circles. Participants had been instructed to report the color of the target by pressing a button. They were to do this as quickly and accurately as possible. The two buttons used were the left and right arrow keys of a computer keyboard. The target remained visible until the participant’s response, after which the next trial immediately began. The result was a rapidly paced and demanding experimental session.
Participants were not given feedback. Stimuli were equally likely to be red or green, and the screen background was black throughout the experiment. An eye tracker was not used.
The principal experimental manipulation was where the targets could appear. The spatial distribution of stimuli was composed of an off-center high-probability area overlaid on a spatially uniform probability distribution (see Figure 1A). We refer to this distribution as the “hotspot” distribution as there was a single point of highest probability with a steep, but gradual, fall off, to a uniform background level1. All points on the screen had some probability of being selected as the target location for any given trial and targets were spread across the extent of the screen for all participants, however, there was a hotspot and the closer a location was to this hotspot the more likely it was to be chosen as a target location (see Figure 1B). The hotspot was centered in the vertical dimension of the computer screen and offset to either the right or the left horizontally. The side of the hotspot and response key mapping were counterbalanced across participants.
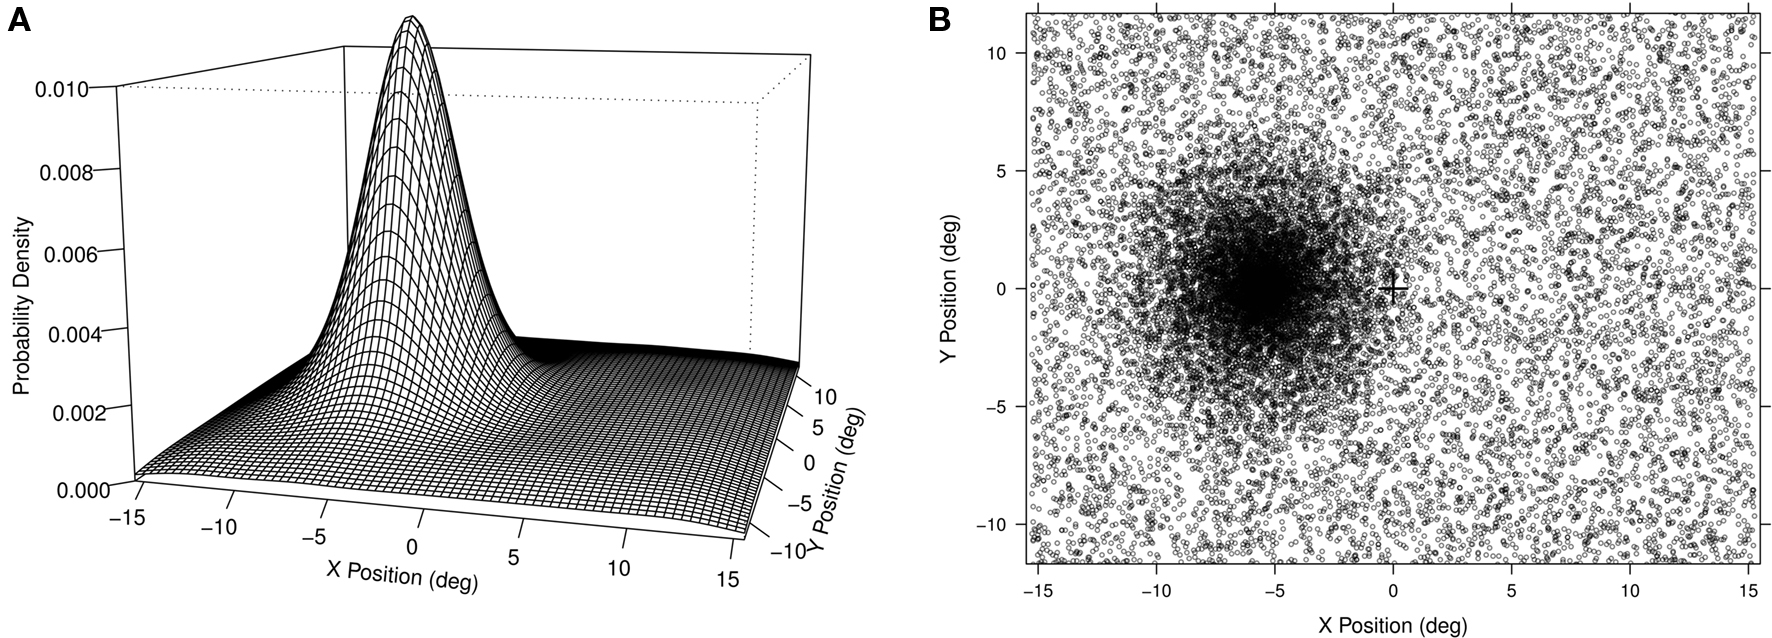
Figure 1. (A) Left: The probability distribution for the left sided hotspot distribution is shown. The screen dimensions were 31° × 24° of visual angle and the center of the hotspot distribution was offset 5.6° to the left. The distribution had a linear decrease over a radius of 7.3° at which point it blended in to a background uniform probability. (B) Right: The actual experimental distribution collapsed across all 12 participants. Each point indicates the location of one trial for one participant. Note that for half of the participants the hotspot was actually on the right side, but we have reflected the data here to aid visualization.
Experiment 2
Forty-three university students (28 female) participated in the experiment for course credit. This research was approved by the University of Waterloo Office of Research Ethics and informed consent was obtained from all participants.
The experimental set-up and presentation was the same as in Experiment 1 except for the following variations. The two colors used for the two dots were blue and yellow. Participants completed a practice block of 50 trials and then six blocks of 200 trials. To make the timing of target onset less predictable, we presented the 1° × 1° white fixation cross for 400 ms followed by a blank interval of 100–300 ms; the duration of this blank interval was chosen from a uniform distribution.
The key difference between Experiments 1 and 2 was the probability distribution used for target locations. In Experiment 2 the locations of targets were fixed to one of three distances from the center of the screen (3°, 6°, or 9° of visual angle). For each participant targets fell at one of these distances from the center of the screen and the radial direction from the center of the screen was chosen uniformly from 0 to 2π. The result was that target locations were distributed into three concentric circles (see Figure 2). Each participant was assigned to one of three probability conditions that specified which of the three radial distances was most likely to be chosen for the target location. There were 12 participants in the inner-heavy, 19 in the middle-heavy, and 12 in the outer-heavy conditions. The designation “heavy” means that that radial distance was chosen 80% of the time while the other two distances were equally probable at 10%.
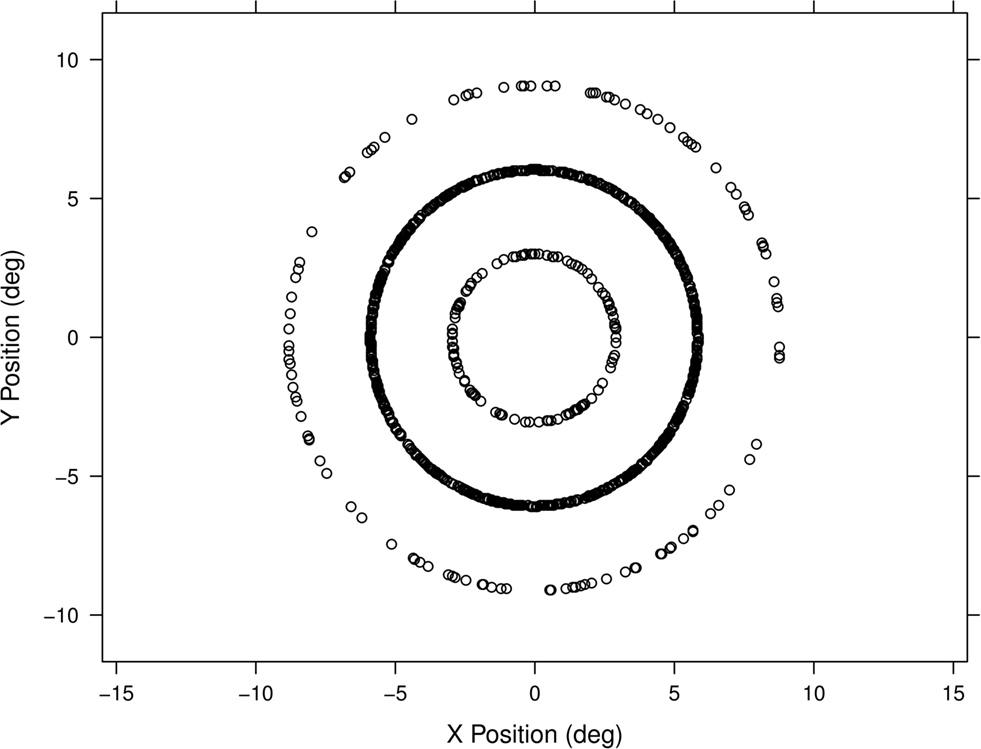
Figure 2. Stimuli in Experiment 2 were located in concentric circles at 3°, 6°, and 9° of visual angle from fixation, with one circle containing 80% of stimuli and the other two containing 10% each. Plotted here is the full set of stimulus locations for one participant in the middle-heavy condition. Five centimeters near fixation subtended just over 4° of visual angle.
Statistics
For our analyses we used linear mixed models implemented in the R system for statistical computing (version 2.10.1; R Development Core Team, 2009), via the lmer function in the lme4 package (version 0.999375-32; see Bates, 2005; Baayen, 2008).
Linear mixed modeling is a statistical technique that uses both fixed and random effects. It is gaining prominence in the analysis of psychological data because it allows for increased power over conventional methods based on cell means such as ANOVAs. In an ANOVA, reliably different parts of a participant’s data can contribute little when pooled with variable participants. In linear mixed models participants can be considered as a random effect, thus accounting for the between-participant differences but still utilizing all data points. The result is a better use of available data and increased power; this is particularly relevant for assessing small RT differences in a task where participants have very different mean RTs.
Although these linear mixed models can yield conventional t statistics, the appropriate corresponding degrees of freedom are yet uncertain. Current best practice is to compute the statistical significance of fixed effects by estimating the parameters from the model with Markov Chain Monte Carlo resampling methods. These are implemented in the function pvals.fnc in the languageR package (version 0.955; see Baayen, 2008) and were used for the significance tests we report. Improvement in model fit was tested with likelihood ratio tests using the R function anova on lmer models fit to optimize the log-likelihood.
Results
Experiment 1
The primary finding of Experiment 1 is that participants were faster to respond to targets when they appeared in a high-probability location. This benefit of proximity to the high-probability hotspot was beyond that which could be explained by priming effects or eccentricity effects (Carrasco et al., 1995), and participants were generally unaware of the probability manipulation.
We conclude that participants were generally unaware of the probability manipulation from their responses to a post-session questionnaire. After completing the task, participants were asked, in writing, “Did anything about the experimental task stand out to you?” Only 1 of the 12 participants stated that there were more targets on one side of the screen. However, it should also be noted that several other participants reported spurious correlations, e.g., more targets of a particular color on one side and more of the other color on the other side, or that particular color sequences were common. The next question asked whether there was any pattern in the location of the targets. Two participants (one the same as before) reported more targets on one side of the screen, with one participant reporting more on the lower half of the screen, and another reporting a star pattern. When directly asked to respond which side of the screen had more targets, 10 of the 12 participants gave the correct response.
Prior to directly addressing the effects of target location and the high-probability hotspot we first report an analysis similar to that of Geng and Behrmann (2002) and Walthew and Gilchrist (2006) where we examine the effects of targets appearing on the high-probability half of the screen. Since participants were heterogeneous in their RTs [one-way ANOVA F(11, 18714) = 379.02, p < 0.001], we used a linear mixed effects (LME) model with participants as a random effect (Baayen, 2008) and whether the target fell on the high-probability side as a categorical fixed effect. Limiting the comparison to correct trials only (pruned to eliminate anticipations and lapses by requiring RTs >150 ms and <1000 ms) showed that being on the high-probability side reduced the RTs by 16 ms [p = 0.001, 95% confidence interval (CI) 12–19 ms]. The high-probability benefit was not driven by a minority of participants, and Figure 3 shows that while RT and accuracy effects were variable in magnitude, they were consistent in direction for most participants. All participants but two showed a decrease in RT for the targets on the high-probability side and in general they also increased in accuracy. Thus, targets on the high-probability side were responded to more quickly and with no decrease in accuracy. Figure 4 shows that most participants individually showed linear RT increases with increasing distance to the high-probability hotspot. Is the benefit of high-probability location due simply to positional priming effects? Before considering this directly we first demonstrate that our methods and data are sufficiently sensitive to demonstrate priming effects.
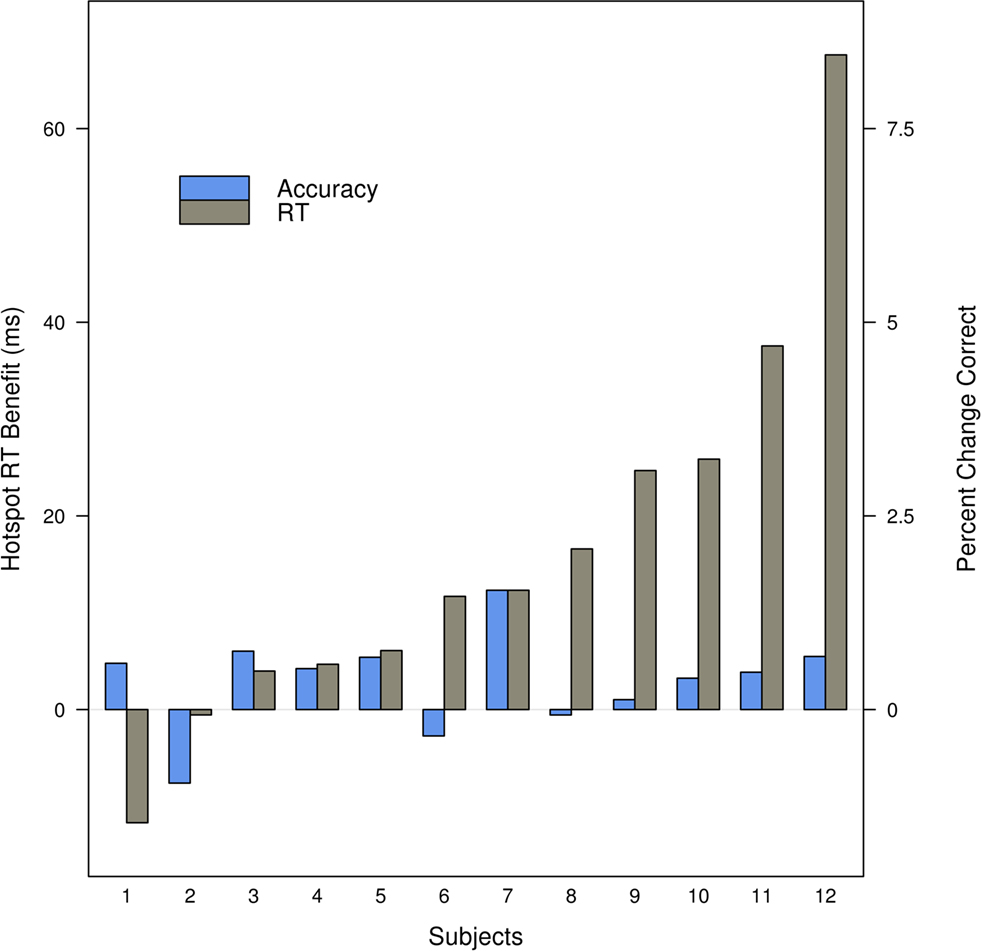
Figure 3. There is a benefit in RT and accuracy for individual participants when targets from the high-probability, hotspot, side are compared to targets from the low-probability side. Participants are ordered by the magnitude of the RT benefit. Trials with RT <150 ms or >1000 ms are excluded, and RT is computed for correct trials only.
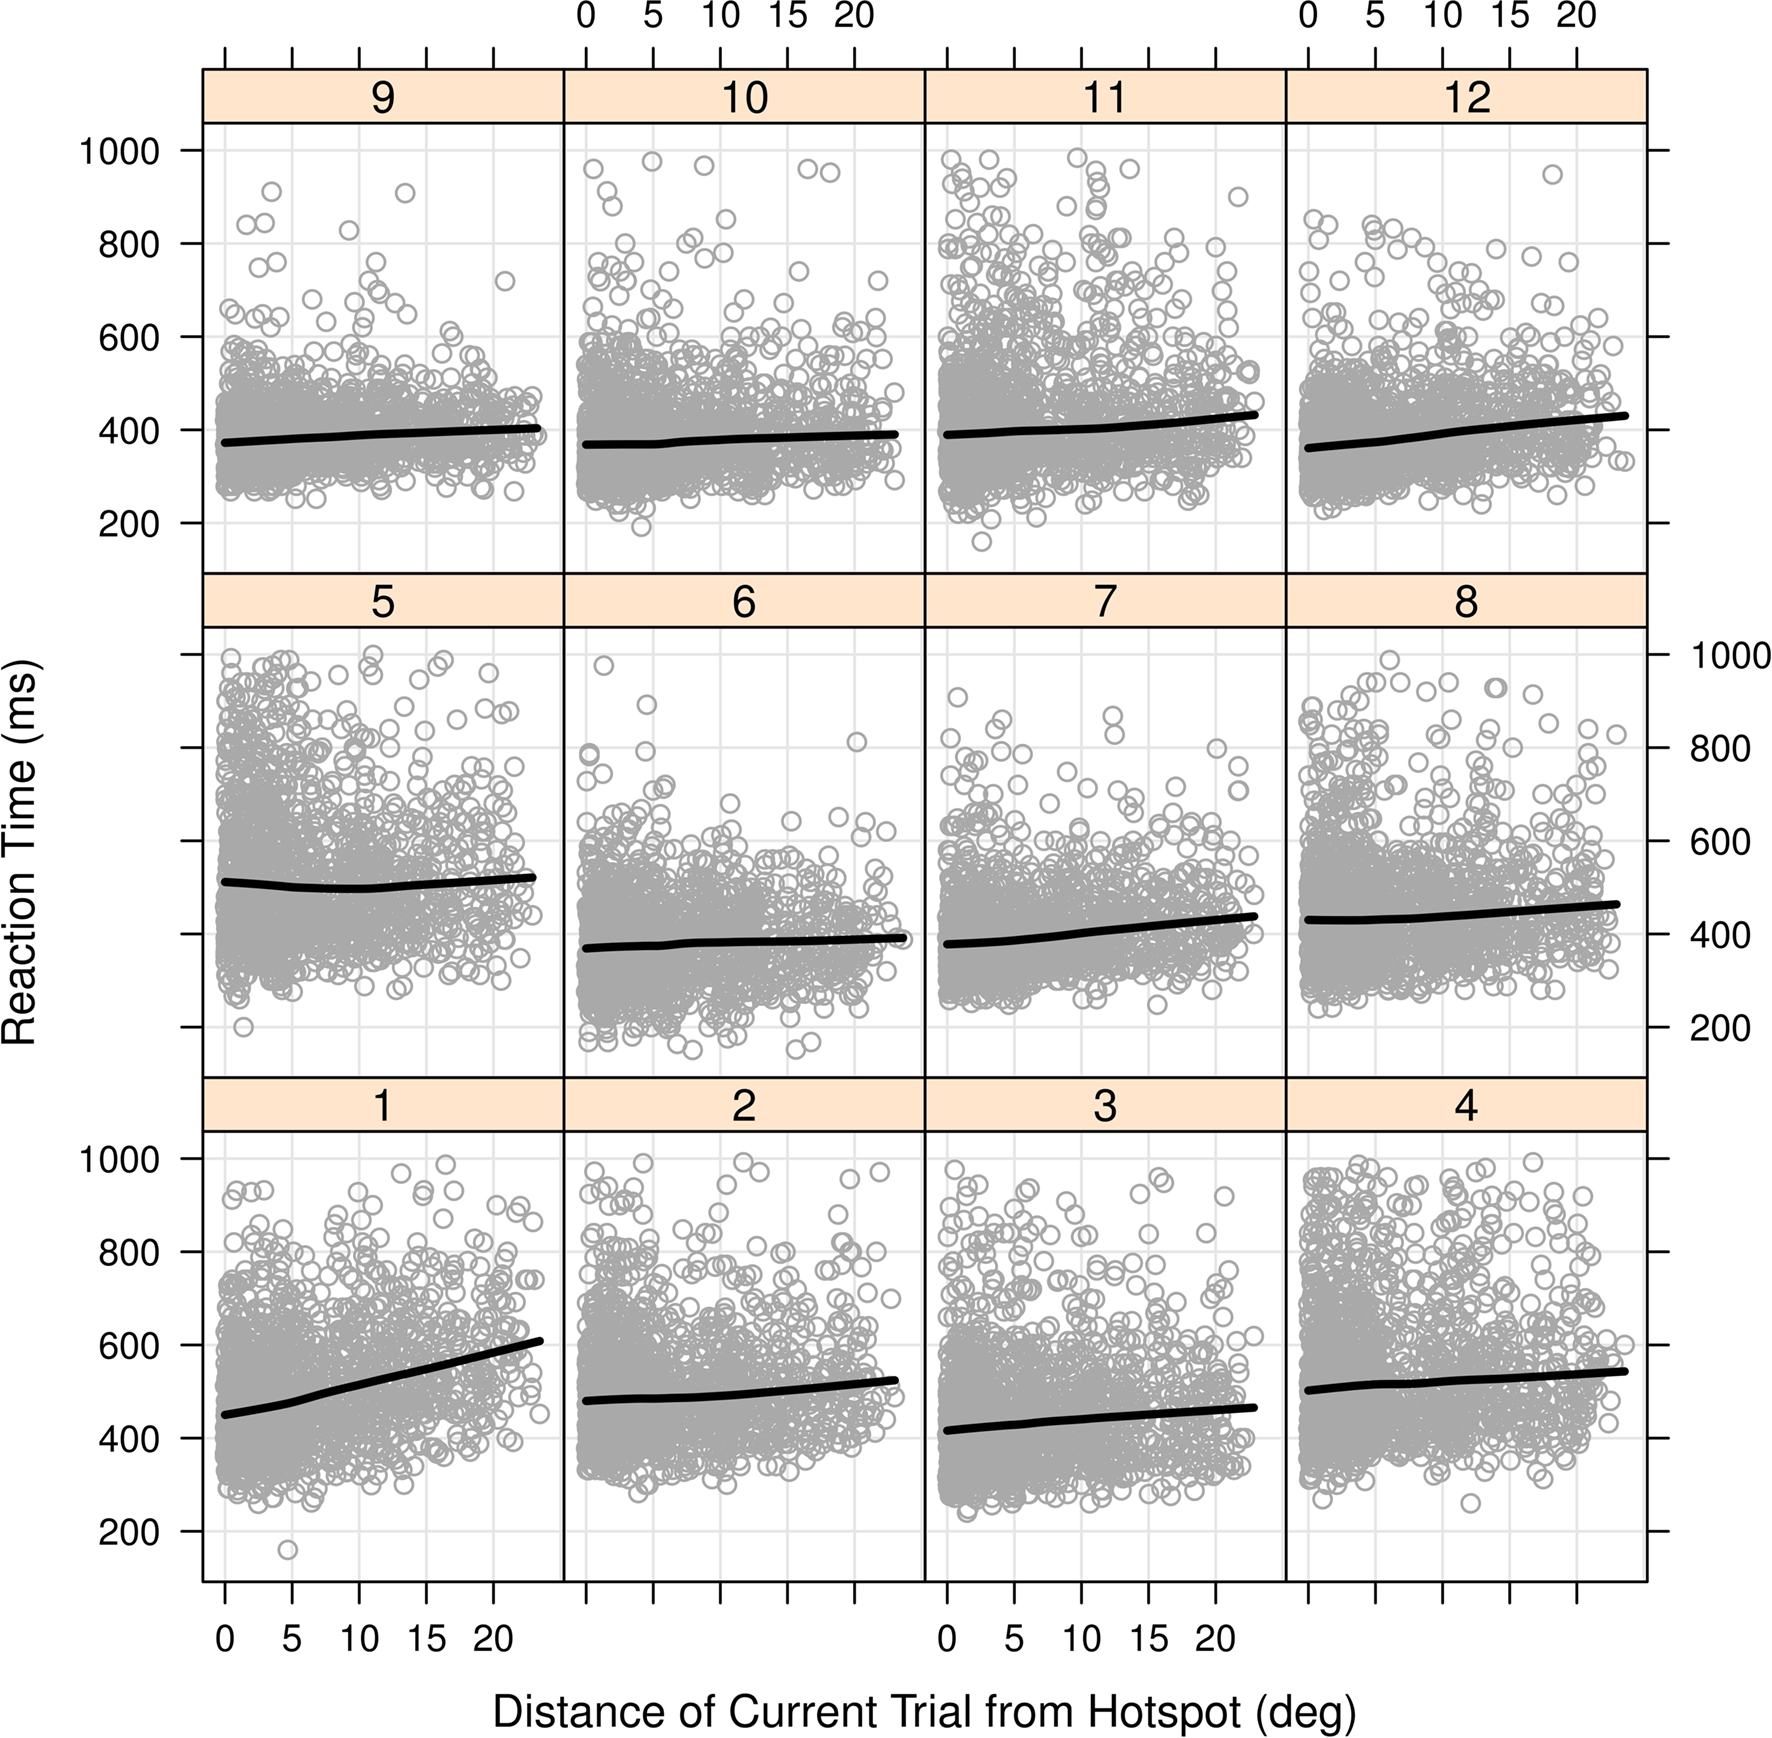
Figure 4. Scatterplots of RT versus distance to high-probability hotspot for each participant in Experiment 1. The trend lines superimposed on each participant’s data are for visualization purposes and are created from locally weighted scatterplot smoothing using the xylowess function in the R Statistical Language. Linear regression on the individual plots showed ten out of the 12 regression slopes were significantly positive, at p < 0.05.
Since participants responded to targets that were equally likely to be red or green with consistent button presses, about one half of all trials involved a repeat of color and button press. We refer to this as stimulus–response priming. Figure 5 shows the stimulus–response priming effect for both RT and accuracy when the priming trial was “n” back, similar to the manner of presentation in Maljkovic and Nakayama (1996). Decreases in RT are evident for the preceding four trials and there is a suggestion of an improvement in accuracy as well, perhaps with an even longer time frame. Our LME model examined as the only factor whether the prior trial was of the same color and included the participants as a random effect. A repeat in the stimulus–response was associated with an average decrease in RT of 28 ms (p = 0.0001, 95% CI 25–32 ms).
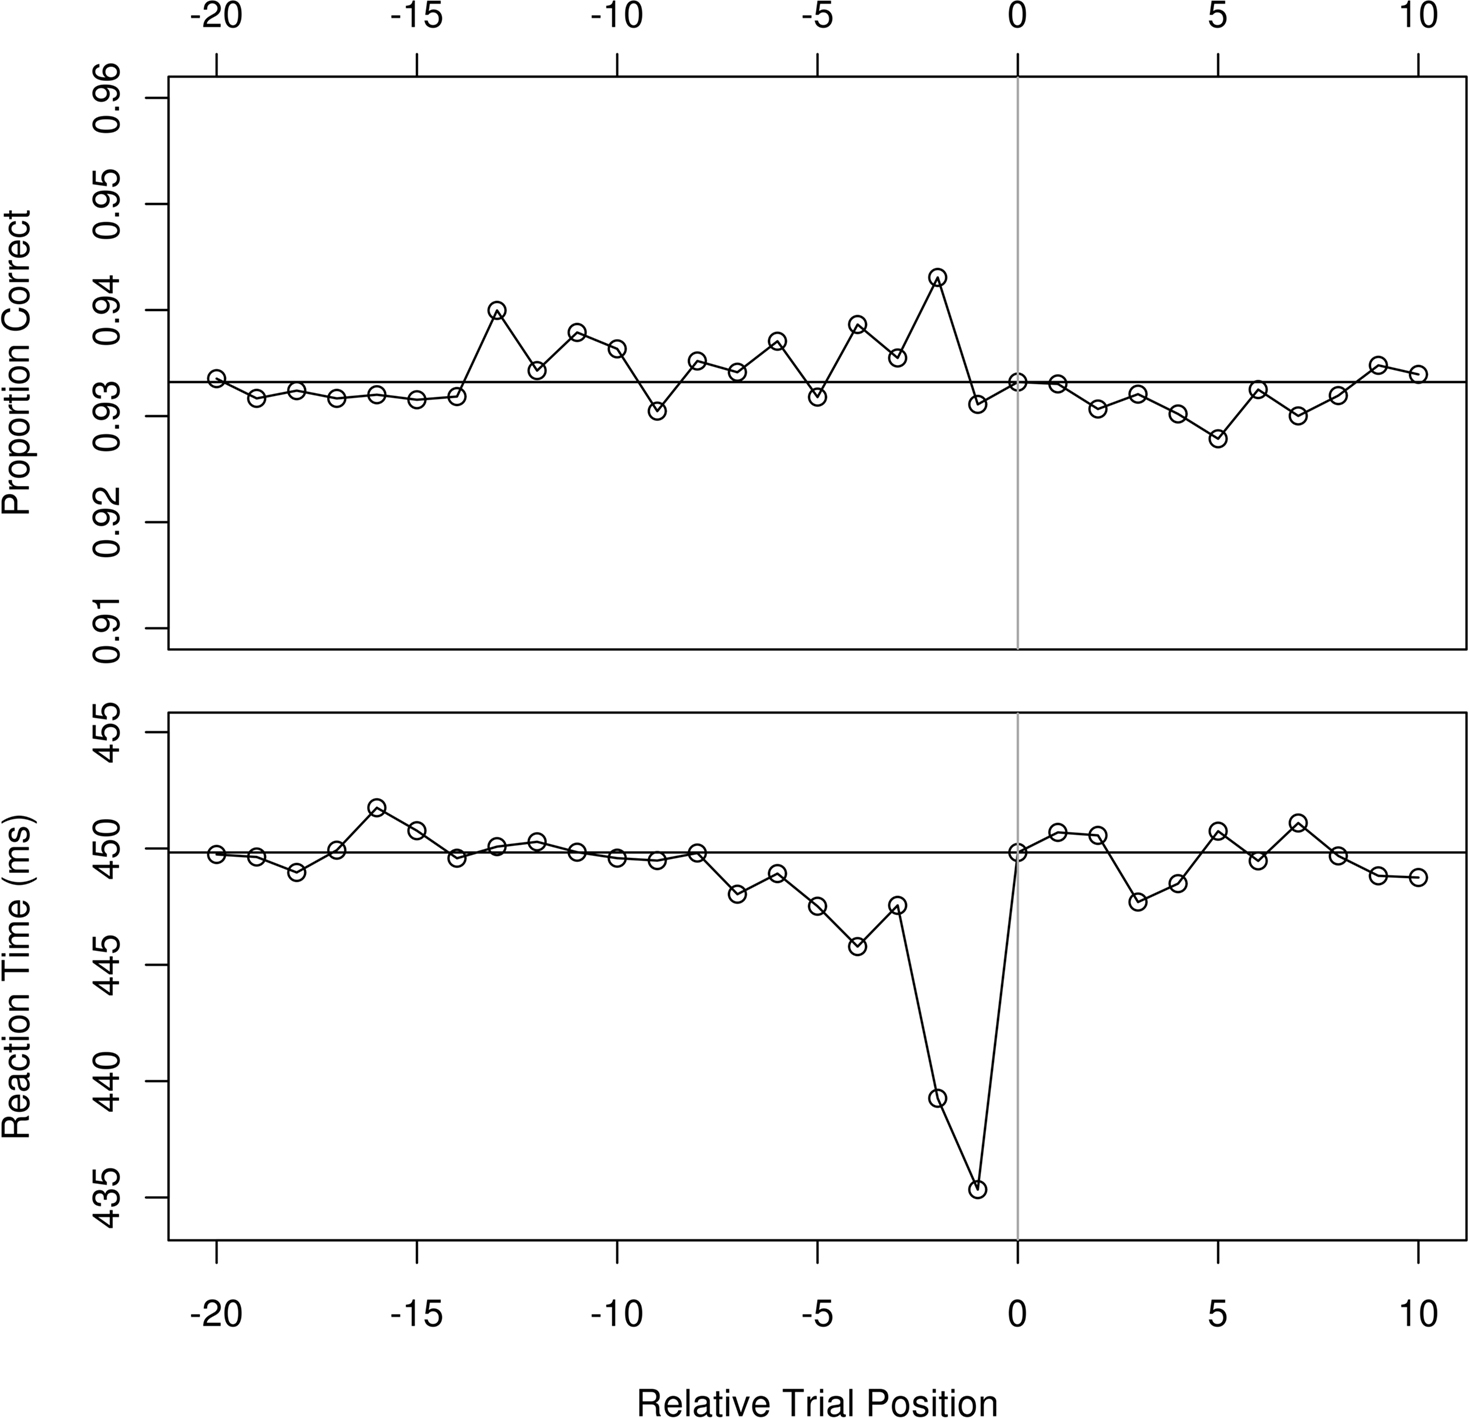
Figure 5. Accuracy (above) and correct trial RT (below) in Experiment 1 as a function of whether the trial n back had the same stimulus color and thus required the same response. Mean values are seen at n = 0 and at the corresponding horizontal lines. A future stimulus cannot prime a current one, so the future trial contingencies serve as a visual reference for variability in the data.
Having demonstrated that we can detect a priming effect for target color and button press response, we proceeded to test if spatial repetition priming could explain the decrease in RT for targets located on the high-probability side. As can be seen from Figure 1A, the probability of a target repeating at exactly the same location was very small. However, targets were frequently close by. Rather than picking an arbitrary distance to define priming, we used the actual distance between target locations in our models. This permits us to examine a graded effect of spatial priming without enforcing an either-or categorization. Inspection of Figure 5 shows that the effect on RT for stimulus–response priming was present for the four prior trials. We therefore first compared priming measures based on the immediately preceding trial and the minimum distance to any of the four preceding trials, or “priming distance.” We found that the latter had a stronger statistical relationship to RT than the distance to the immediately preceding trial. Models that included the priming distance did not improve their fit when adding in the distance to the immediately preceding trial, so we only used the priming distance as a covariate. In addition, since objects at fixation are seen better, and since response times in attentional tasks vary with visual eccentricity (Carrasco et al., 1995), we also included the distance to the center of the screen as a covariate. The critical test was to evaluate whether there was a significant improvement in fit when the distance to the high-probability hotspot was added to the model.
We compared the fits of two LME models for the data. Both models included the priming distance, the distance of the target location to the center of the screen, and a random effect of participant. One model included as an additional covariate the distance of the target from the high-probability hotspot. Including this distance resulted in a significant improvement in fit [χ2(1) = 6.3, p = 0.01]. Within this model there were effects of priming distance (p = 0.004, 0.9 ms increase per degree of visual angle, 95% CI 0.3–1.5 ms) and eccentricity (p < 0.001, 1.9 ms increase per degree of visual angle, 95% CI 1.2–2.6 ms), as well as of distance to hotspot (p = 0.01, 0.7 ms increase per degree of visual angle, 95% CI 0.1–1.2 ms). Thus, even when accounting for important covariates, including spatial priming, there is still an additional benefit to being nearer the point of highest probability.
Experiment 2
The primary findings of Experiment 2 were similar to Experiment 1. Participants benefited when targets appeared near the center of the screen, but there was an additional benefit when targets were in high-probability regions. This probability benefit occurred even though the use of circular distributions precluded any benefit from a strategy of shifting the eyes away from the center of the screen. The use of circular distributions also meant that while sequential trials were more likely to occur on the high-probability ring they were less likely to be physically near each other.
Similar to Experiment 1 there seemed to be little awareness of, or little emphasis placed by participants on the uneven spatial distribution of target locations. On the post-session questionnaire, only one participant volunteered information about a non-random spatial distribution of target locations, noting that target locations favored the center of the screen and not the corners. Again, there were also several comments reporting non-existent associations such as patterns in the sequence of colors or an association between color and side.
Our primary interest was in comparing the pattern of results for the three rings as a consequence of the probability manipulation. We expected target locations near the center of the screen to be responded to faster, but we wished to determine if there was an additional benefit of being on the high-probability ring. As in Experiment 1, our statistical analysis used LME modeling.
To test this hypothesis, we first constructed an LME model with participants as a random effect and fixed factors of circle (which is equivalent to distance from the center of the screen) and the “priming distance” (the minimum distance between the current target and the position of any of the four preceding, as in Experiment 1). After fitting this model, we fit a second model with an additional fixed factor to indicate if the target location was on the high-probability circle. This model produced a significant improvement in fit [χ2(1) = 9.6, p = 0.002].
Next, we looked at the significance of the individual factors, as described in Section “Statistics.” The largest effects were seen for the circle factor, as expected. Responses were slower for targets further away from the center of the screen, and this was most pronounced for the outer circle location (9° of visual angle from screen center; p = 0.0001, 10.0 ms increase over inner circle, 95% CI 6.8–13.3 ms). The priming distance was also found to have an effect (p = 0.001, 0.6 ms decrease per degree of visual angle, 95% CI 0.3–0.9 ms). Location on a high-probability circle resulted in a decrease, on average, of 3.7 ms in RT (p = 0.002, 95% CI 1.3–6.0 ms).
To visualize these effects we plotted the mean RTs for all three circles in Figure 6, with targets subdivided by whether the condition had the circle as the high-probability circle. Figure 6 can be viewed in two different ways. One can compare across the circle locations within a probability condition or by focusing on the effect of probability condition for each circle position. The basic pattern suggests that the middle condition was the least affected by the probability manipulation while the rings on the edge of the target location zone, the inner most and outer most, were most affected by being high- and low-probability locations. The slowest location, the outer circle, benefited the most from being the high-probability location.
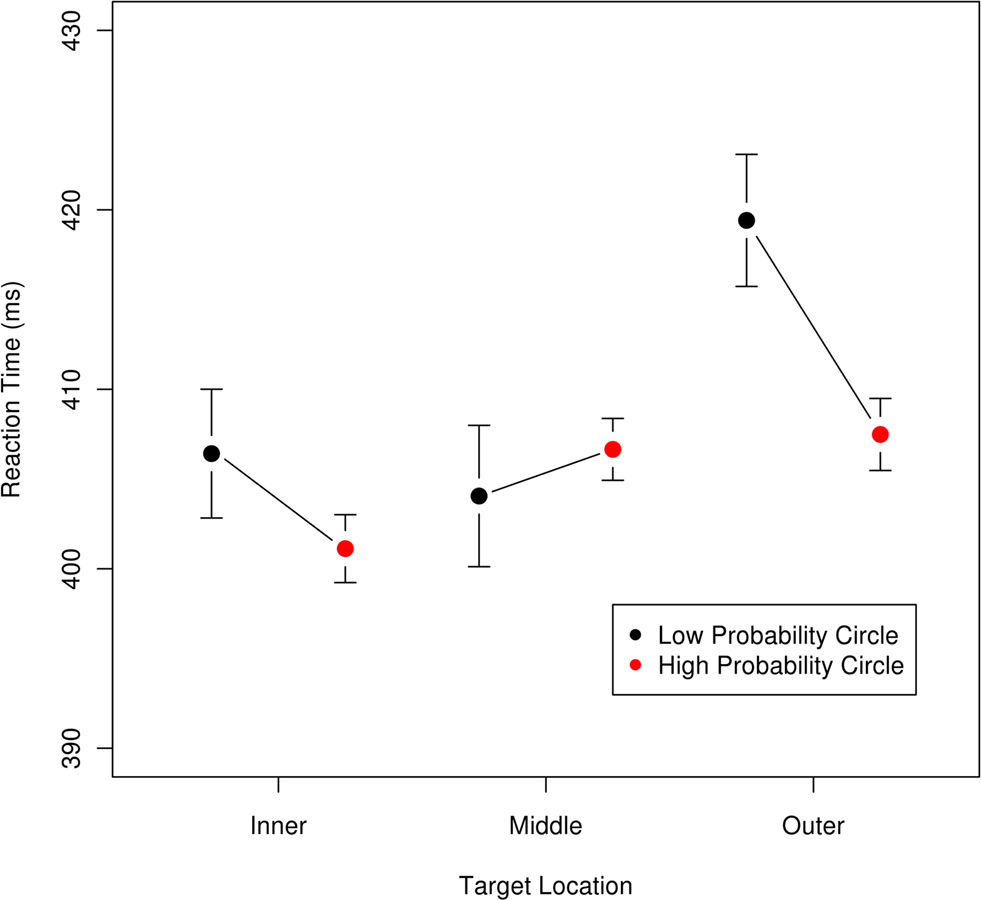
Figure 6. Mean reaction time as a function of target location and probability; error bars are 95% confidence intervals for each location × probability condition. Targets were either on the inner, middle, or outer circle. For each circle, the right (red) point is for the trials where that circle was the high-probability location, and the left (black) point is for trials where the circle was a low-probability location. This graph is intended to visualize the magnitude and directions of the effects and thus excludes the data from two participants who had mean RTs two standard deviations away from the sample mean. Statistical analyses reported in the text include the data from all participants.
Table 1 shows the accuracy data, which indicates that our data were not due to speed-accuracy trade-offs.
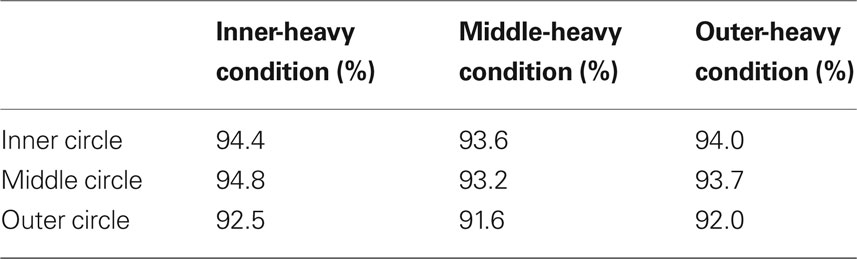
Table 1. Accuracy as a function of probability distribution and stimulus location for trials with RT >150 ms and <1000 ms (as for the other analyses).
Discussion
The motivation for these experiments was to examine the phenomena of probabilistic cuing. If it were established that people learn complex and arbitrary probability distributions for the location and character of search targets then developing detailed probability based models of visual attention would be warranted. However, if the effect of probability on search is simply a matter of response selection or short-term biases toward recently visited locations then such models would probably not be warranted, or at least they would be much simpler and less far-reaching in their explanatory scope. Below we argue that our experiments provide evidence that participants can learn graded and complex probabilistic contingencies, and that the effects of probability are not explained by short-term priming effects. Moreover, we claim that this is also seen in the no-repeats experiment of Walthew and Gilchrist (2006), in direct opposition to those authors’ interpretation. We believe further investigation of probability effects on attention is warranted.
While probability considerations have been prominent in psychology for some time (for an early review see Estes, 1962), their application was mostly in the area of learning, where the emphasis was on a condition and a response. Despite an impressive beginning (Shaw and Shaw, 1977), extensions of probability manipulations to attention have been less extensive and less quantitative. For example, the phenomenon of contextual cuing demonstrates that the repetitive pairing of displays with target locations leads to an improvement in target detection. While contextual cuing is often described as involving visual attention (Chun, 2000) this is not uniformly accepted, since, for example, contextual cuing does not modulate the efficiency of search as inferred from RT × distractor number slope (Kunar et al., 2007). But the main point is that while phenomena like contextual cuing are suggestive, such indirect demonstrations of the effect of probability manipulations on attention and search are insufficient to a full understanding of the relationship.
A recent explicit and quantitative manipulation of probability in a visual search task was the probabilistic cuing experiments of Geng and Behrmann (2002). These authors showed that when stimuli in a visual search and classify task appeared disproportionately on one side of a computer screen, the target classification was performed more quickly for trials appearing in the high-probability locations when compared to locations on the lower-probability side of the screen. Walthew and Gilchrist (2006) confirmed the basic effect, but also reported this benefit was eliminated if short-term positional repeats were precluded.
We felt that probabilistic cuing and its characterization as a spatial priming effect could be clarified if we used spatially graded probability distributions and a task that was simple enough to allow large numbers of trials to be delivered in an experimental session. This would give the participants more experience with the probabilistic contingencies and give us a greater amount of data for examining the effects within participants.
Our experiments required participants to make a large number of simple color discriminations. Trials appeared individually on a computer screen, at randomly (but not uniformly) chosen locations.
In Experiment 1, we used a spatially continuous but non-uniform probability distribution with an off-center hotspot of maximal probability. Since this distribution extended over the entire computer display area, the probability of any single location being a target location was small, as can be seen by inspecting the z-axis of Figure 1A. Thus, precise spatial repeats were infrequent. For each trial we could measure its distance to immediately preceding trials and to the point of maximal probability. The analyses of these data confirm spatial priming and eccentricity effects, but the data also show an effect of the distance of a target position from the high-probability hotspot. This implies that our participants learned the spatial bias. We find additional qualitative support when we examine RT as a function of target position distance from the hotspot for individual participants (see Figure 4). For almost all participants there is a graded, apparently linear relation, between RT and distance from the hotspot.
The demonstration of probabilistic cuing is separate from the question of whether the probabilistic inhomogeneity was consciously appreciated. But based on data from a questionnaire participants completed after their experimental session, we infer that few participants had high awareness of the nature of our experimental manipulation. Only one participant volunteered a correct description of the spatial imbalance of stimuli, and several volunteered false associations.
We did not track eye movements. As so few participants had much awareness of the spatial probability manipulation, there is no reason to suggest that participants adopted a consistent conscious strategy. It is possible that a strategy of shifting gaze toward the high-probability side in Experiment 1 could have happened covertly. If so, it would offer one explanation for how the superior performance at high-probability locations is achieved, but it would not challenge the conclusion that probability can serve as a cue for a visual search, nor would it salvage an explanation in terms of spatial repetition priming. We also maintain that it would not eliminate a claim that the benefit for high-probability locations is attentional, since gaze location and attentional allocation are interdependent (Hoffman and Subramaniam, 1995; Corbetta, 1998). We could not call it covert attention if there were overtly detectable shifts in gaze, but to call it overt attention would also seem to be a misnomer given the lack of participant awareness.
Experiment 2 also bears on the issue of eye movements. More importantly, it provides additional evidence for the inadequacy of a spatial priming account and more evidence for the richness and flexibility of participants to adapt to spatial inhomogeneities in target location probability.
In Experiment 2 targets were located on three concentric annuli. The radial direction of the targets was uniform. Therefore shifting the gaze in one direction or another would not yield any benefit to participants. If the average location of targets is calculated it is at the center of the screen, even though no targets actually appears there. The strategy that will minimize the average distance between eye fixation and targets is to look at the center of the screen. And in this circumstance we still find a benefit for trials when they are on the high-probability circle.
If participants could allocate their resources in a perfect match to the target location distributions they would have required a doughnut shaped spotlight (Egly and Homa, 1984; Eimer, 1999; Müller and Hübner, 2002). Our findings suggest that this may be practically difficult for participants to achieve. The greatest effect of probability seems to be for targets appearing on the edges of the target zone. When more targets were on the inner circle there seemed to be a particularly high cost for the occasional outer circle trial, but not for the middle circle trials. Conversely, when outer targets were frequent, there was an improvement in RT for the common outer targets that hurt infrequent inner trials, but not infrequent middle circle trials. It is interesting to note that high-probability targets on the outer ring were classified about as quickly as the low-probability inner circle trials.
Our demonstration of a probabilistic cuing effect not explained by spatial repetition priming contradicts the conclusion of Walthew and Gilchrist (2006). We therefore return to examine the support for their claim that “when short-term target location repetitions were restricted, there was no statistical learning effect.”
In their Experiment 3, Walthew and Gilchrist (2006) evaluate the effect of spatial repetition priming. To test the effect of spatial priming, the authors measured the accuracy of the first saccade in a task where the target could appear in any of eight positions arranged around a ring, four on the left and four on the right. The authors had 10 participants in each of two conditions: repeat and no-repeat. In both conditions four positions on one side of the screen were in the aggregate twice as likely to be a target location (“rich”) as were positions on the other side of the screen (“sparse”). In the repeat condition, trials were independent and thus the rich side always had a 67% chance of being the target side regardless of trial history. In the no-repeat condition, locations were generated such that no spatial position was occupied more than once every four trials. In a footnote, the authors acknowledge that this results in a rich trial increasing the relative chances that the next trial will be sparse, but discount this conditional probability as having any bearing on their findings.
Walthew and Gilchrist (2006) carried out a 2 × 2 mixed ANOVA with a rich/sparse factor within participants and repeat/no-repeat factor between participants. They found no main effects, but did find an interaction; these data were graphically presented in their Figure 3. The pairwise comparison for rich versus sparse trials within the repeat condition was reported significant, but not for the no-repeat condition. This is the basis for the authors concluding that the elimination of repeats abolishes statistical learning.
We have several concerns with this analysis. First, the authors conclude that the absence of a statistically significant effect implies the absence of an effect. However, failing to reject the null is not the same as proving it, and it is not clear what the power of the test was. Second, Walthew and Gilchrist (2006) conclude that two comparisons are different because one achieved statistical significance whereas the other did not, but they did not directly compare the two results to see if they were statistically different. We suggest that the basis for the significant interaction effect is clear from their figure: rich trials were more accurate than sparse in the repeat condition, but the opposite was the case for the no-repeat condition. Numerically the largest pairwise difference was between the sparse – repeat trials (0.405 accuracy) and the sparse – no-repeat trials (0.517), while the rich – repeat trials (0.481) and rich – no-repeat trials (0.475) did not seem to differ. The standard error bars for sparse trials in the two conditions show no overlap. The phenomena that requires an explanation is not the elimination of a rich side versus sparse side difference, but the improvement in sparse side performance when shifting from the repeat to no-repeat condition.
Why would the performance on sparse trials have improved in the no-repeat condition when the rich trials show little change? We contend that it is because the participants have demonstrated statistical learning of exactly the kind Walthew and Gilchrist (2006) reject. Certainly we are not claiming any carelessness on the part of the authors. Their analysis seems a natural assessment given their hypothesis, but the details of their experimental design are more subtle than they appear. If target locations on the rich side have a probability weight twice that of the sparse side, then enforcing the no-repeat condition yields sequences of trials that have, in practice, only about 60% of the trials on the rich side. In order to obtain a sequence which obeys the specified no-repeat rule, and where the rich side has 2/3 of the trials, it is necessary to have each of the rich sided target locations have a weight approximately 3.3 times that of the sparse side.
Assuming this weighting, simple modeling and simulation2 shows that the effect on the expectation for the sparse side locations is substantial (Table 2). Unlike the repeats condition, where sparse trials are always equally unlikely, here there is large variability in the probability of seeing a sparse trial. Perversely, almost a quarter of trials follow a stretch of three rich trials, and in this case the next trial is actually more likely to be sparse than rich. Inverting the relationship, over a third of the actual sparse trials follow a stretch of three rich trials. This increased predictability of sparse trials provides a viable explanation for the reported pattern of performance. Note that this analysis requires that participants have some trace of which side of the screen the prior three trials were on. The consequence of the conditional probability distribution is that the improved accuracy of a participant’s first saccade doesn’t reflect spatial repetition priming, as in this design there were no repeats, but rather the learning of a conditional probability distribution. This contradicts the authors’ conclusions.
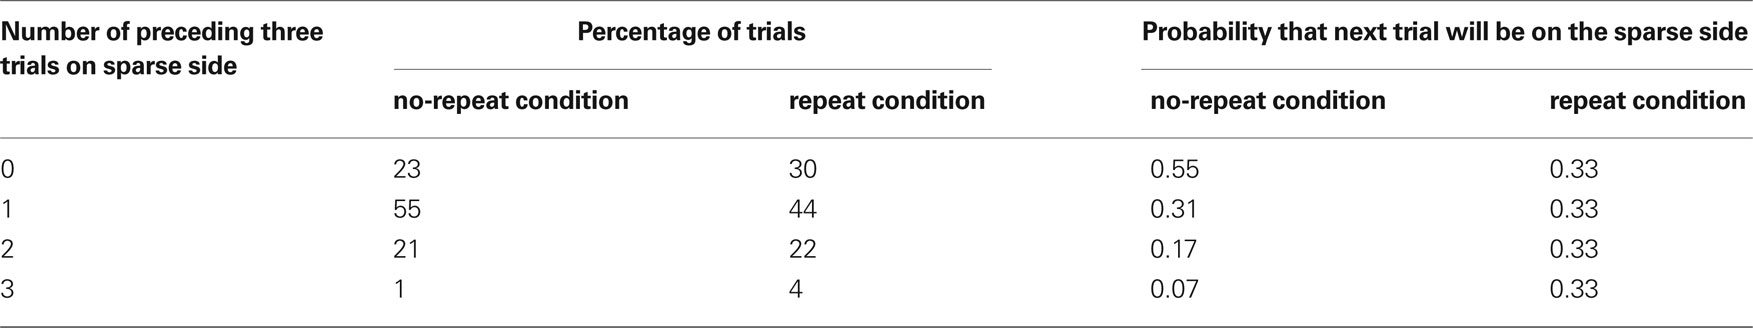
Table 2. Results of simulation of the repeats and no-repeats sequences in Walthew and Gilchrist (2006). Note that for nearly one-quarter of the no-repeat condition, the next trial is actually more likely to be sparse.
A rapidly growing literature supports the explanatory value of probability based models in psychology. Recently these have primarily taken the form of Bayesian models (Ernst and Banks, 2002; Guo et al., 2004; Kersten et al., 2004; Knill and Pouget, 2004; Tassinari et al., 2006; Schwartz et al., 2007). However, explicit probabilistic accounts for attention are few (e.g., Eckstein et al., 2006). The dominant metaphors for attention (Fernandez-Duque and Johnson, 1999), despite their problems (Cave and Bichot, 1999), remain the spotlight of attention (Posner et al., 1980) and its relative the zoom lens (Eriksen and St. James, 1986). These metaphors posit that attention is a resource that is spatially directed and constrained in a contiguous circular area. Our results could certainly be cast in this language. For example, in Experiment 1, stimulus probability caused a translation in the attentional spotlight away from fixation. In Experiment 2, shifting more of the stimuli away from the center served to dilate the zoom lens of attention.
We favor an alternative explanation: that these results stem from humans’ ability to function as statistically optimized observers. We interpret our experiments and those of Geng and Behrmann (2002, 2005) and Walthew and Gilchrist (2006) to be demonstrations that performance is proportionate to probability. Rather than interpret probability as a cue, perhaps we should interpret cues for their consequences on probability? While the data here do not decide the issue, they encourage its pursuit. A probabilistic account is more parsimonious and more general than the spotlight or zoom lens metaphors. The parsimony derives from the fact that the results are explained by recourse to the experimental manipulation alone, and not to a putative and poorly characterized “resource.” It is more general because the same variable of prior probability is an effective explanation for other results in visual search and attention and provides quantitative predictions.
Conflict of Interest Statement
The authors declare that the research was conducted in the absence of any commercial or financial relationships that could be construed as a potential conflict of interest.
Acknowledgments
The authors wish to thank two anonymous referees for feedback on an earlier version of this manuscript.
Footnotes
- ^The specific distribution was cone-shaped. There was a circular radius of 150 pixels which was displaced to the left or right by 115 pixels from the center of the screen. Probability density linearly decreased from the center of this distribution to its edge. The stimulus location angle around this center was uniformly chosen and the distance to it was generated as 150 x000D7 (1 – sqrt(1 – sqrt(z))), for z uniformly chosen from [0.0, 1.0].
- ^We used a simplifying assumption of a single sequence of trials and simulated the no-repeats procedure. The weighting ratio of 3.3 for rich to sparse trials was obtained by trial and error to reach a 2/3 overall rich proportion. The number of rich trials seen in the last three trials fully characterized the prior information available to determine the probability of seeing a rich trial next (though not at a specific location).
References
Baayen, R. (2008). Analyzing Linguistic Data: A Practical Introduction to Statistics Using R. Cambridge, UK: Cambridge University Press.
Carrasco, M., Evert, D., Chang, I., and Katz, B. (1995). The eccentricity effect: target eccentricity affects performance on conjunction searches. Percept. Psychophys. 57, 1241–1261.
Cave, K. R., and Bichot, N. P. (1999). Visuospatial attention: beyond a spotlight model. Psychon. Bull. Rev. 6, 204–223.
Chun, M. M., and Jiang, Y. (1998). Contextual cueing: implicit learning and memory of visual context guides spatial attention. Cogn. Psychol. 71, 28–71.
Corbetta, M. (1998). Frontoparietal cortical networks for directing attention and the eye to visual locations: identical, independent, or overlapping neural systems? Proc. Natl. Acad. Sci. U.S.A. 95, 831–838.
Eckstein, M. P., Drescher, B. A., and Shimozaki, S. S. (2006). Attentional cues in real scenes, saccadic targeting, and Bayesian priors. Psychol. Sci. 17, 973–980.
Egly, R., and Homa, D. (1984). Sensitization of the visual field. J. Exp. Psychol. Hum. Percept. Perform. 10, 778–793.
Eimer, M. (1999). Attending to quadrants and ring-shaped regions: ERP effects of visual attention in different spatial selection tasks. Psychophysiology 36, 491–503.
Eriksen, C. W., and St. James, J. D. (1986). Visual attention within and around the field of focal attention: a zoom lens model. Percept. Psychophys. 40, 225–240.
Ernst, M. O., and Banks, M. S. (2002). Humans integrate visual and haptic information in a statistically optimal fashion. Nature, 415, 429–433.
Fernandez-Duque, D., and Johnson, M. L. (1999). Attention metaphors: how metaphors guide the cognitive psychology of attention. Cogn. Sci. 23, 83–116.
Geng, J. J., and Behrmann, M. (2002). Probability cuing of target location facilitates visual search implicitly in normal participants and patients with hemispatial neglect. Psychol. Sci. 13, 520–525.
Geng, J. J., and Behrmann, M. (2005). Spatial probability as an attentional cue in visual search. Percept. Psychophys. 67, 1252–1268.
Guo, K., Nevado, A., Robertson, R. G., Pulgarin, M., Thiele, A., and Young, M. P. (2004). Effects on orientation perception of manipulating the spatio-temporal prior probability of stimuli. Vision Res. 44, 2349–2358.
Hoffman, J., and Subramaniam, B. (1995). The role of visual attention in saccadic eye movements. Percept. Psychophys. 57, 787–795.
Hoffmann, J., and Kunde, W. (1999). Location-specific target expectancies in visual search. J. Exp. Psychol. Hum. Percept. Perform. 25, 1127–1141.
Kersten, D., Mamassian, P., and Yuille, A. (2004). Object perception as Bayesian inference. Annu. Rev. Psychol. 55, 271–304.
Knill, D. C., and Pouget, A. (2004). The Bayesian brain: the role of uncertainty in neural coding and computation. Trends Neurosci. 2, 712–719.
Kristjánsson, A., and Campana, G. (2010). Where perception meets memory: a review of repetition priming in visual search tasks. Atten. Percept. Psychophys. 72, 5–18.
Kunar, M. A., Flusberg, S., Horowitz, T. S., and Wolfe, J. M. (2007). Does contextual cuing guide the deployment of attention? J. Exp. Psychol. Hum. Percept. Perform. 33, 816–828.
Maljkovic, V., and Nakayama, K. (1994). Priming of pop-out: I. Role of features. Mem. Cogn. 22, 657–657.
Maljkovic, V., and Nakayama, K. (1996). Priming of pop-out: II. The role of position. Percept. Psychophys. 58, 977–991.
Miller, J. (1988). Components of the location probability effect in visual search tasks. J. Exp. Psychol. Hum. Percept. Perform. 14, 453–471.
Müller, M., and Hübner, R. (2002). Can the spotlight of attention be shaped like a doughnut? Evidence from steady-state visual evoked potentials. Psychol. Sci. 13, 119–124.
Posner, M., Snyder, C., and Davidson, B. (1980). Attention and the detection of signals. J. Exp. Psychol. Gen. 109, 160–174.
Rabbitt, P. M., Cumming, G. D., and Vyas, S. M. (1977). “An analysis of visual search: entropy and sequential effects,” in Attention and Performance, Vol. VI, ed. S. Dornic (Potomac, MD: Lawrence Erlbaum Associates), 363–386.
Rabbitt, P., Cumming, G., and Vyas, S. (1979). Modulation of selective attention by sequential effects in visual-search tasks. Q. J. Exp. Psychol. 31, 305–317.
R Development Core Team. (2009). R: A Language and Environment for Statistical Computing. Vienna, Austria: R Foundation for Statistical Computing.
Schwartz, O., Hsu, A., and Dayan, P. (2007). Space and time in visual context. Nat. Rev. Neurosci. 8, 522–535.
Shaw, M. L., and Shaw, P. (1977). Optimal allocation of cognitive resources to spatial locations. J. Exp. Psychol. Hum. Percept. Perform. 3, 201–211.
Shore, D. I., and Klein, R. M. (2000). On the manifestations of memory in visual search. Spat. Vis. 14, 59–75.
Tassinari, H., Hudson, T. E., and Landy, M. S. (2006). Combining priors and noisy visual cues in a rapid pointing task. J. Neurosci. 26, 10154–10163.
Keywords: attention, vision, reaction time, perception
Citation: Druker M and Anderson B (2010) Spatial probability aids visual stimulus discrimination. Front. Hum. Neurosci. 4:63. doi: 10.3389/fnhum.2010.00063
Received: 05 March 2010;
Paper pending published: 08 April 2010;
Accepted: 17 July 2010;
Published online: 06 August 2010
Edited by:
Maurizio Corbetta, Washington University, USAReviewed by:
Árni Kristjánsson, University of Iceland, IcelandMichael A. Silver, University of California, USA
Copyright: © 2010 Druker and Anderson. This is an open-access article subject to an exclusive license agreement between the authors and the Frontiers Research Foundation, which permits unrestricted use, distribution, and reproduction in any medium, provided the original authors and source are credited.
*Correspondence: Britt Anderson, Department of Psychology, University of Waterloo, 200 University Avenue West, Waterloo, ON, Canada N2L 3G1. e-mail: britt@uwaterloo.ca