Risk-sensitivity in sensorimotor control
- 1 Computational and Biological Learning Laboratory, Department of Engineering, University of Cambridge, Cambridge, UK
- 2 Computational Learning and Motor Control Laboratory, Department of Computer Science, University of Southern California, Los Angeles, CA, USA
- 3 Department of Experimental Psychology, University of Cambridge, Cambridge, UK
Recent advances in theoretical neuroscience suggest that motor control can be considered as a continuous decision-making process in which uncertainty plays a key role. Decision-makers can be risk-sensitive with respect to this uncertainty in that they may not only consider the average payoff of an outcome, but also consider the variability of the payoffs. Although such risk-sensitivity is a well-established phenomenon in psychology and economics, it has been much less studied in motor control. In fact, leading theories of motor control, such as optimal feedback control, assume that motor behaviors can be explained as the optimization of a given expected payoff or cost. Here we review evidence that humans exhibit risk-sensitivity in their motor behaviors, thereby demonstrating sensitivity to the variability of “motor costs.” Furthermore, we discuss how risk-sensitivity can be incorporated into optimal feedback control models of motor control. We conclude that risk-sensitivity is an important concept in understanding individual motor behavior under uncertainty.
Introduction
Sensorimotor control can be considered as a continuous decision-making process and is thus amenable to the same mathematical framework that formalizes decision-making in economics and psychology. This mathematical framework is decision theory which in its neo-classical form is founded on the maximum expected utility hypothesis (Fishburn, 1970; Kreps, 1988; Pratt et al., 1995). The principle of maximum expected utility states that a rational decision-maker that holds a belief P(x|a) about the probability that an action a leads to an outcome x with utility U(x) should choose action a* = arg maxa E[U|a] in order to maximize the expected utility E[U|a] =  x P(x|a) U(x).
In human sensorimotor control the maximum expected utility principle has been used to explain behavior in movement tasks in which uncertainty arises due to the inherent variability of the motor system (van Beers et al., 2002; Faisal et al., 2008). The hypothesis of maximum expected utility has been invoked, for example, as the maximization of expected gain in motor tasks with monetary payoffs (Trommershauser et al., 2003a,b, 2008) or as the minimization of movement-related costs such as energy expenditure and task error (Harris and Wolpert, 1998; Todorov and Jordan, 2002; Todorov, 2004; Diedrichsen et al., 2010). Unlike in economic decision-making tasks where a considerable number of violations of the expected utility hypothesis have been reported over the years (Kahneman et al., 1982; Bell et al., 1988; Kahneman and Tversky, 2000), in motor tasks the vast majority of studies have provided evidence in favor of the maximum expected utility hypothesis. Recently, however, a number of studies (Wu et al., 2009; Nagengast et al., 2010a,b) have reported that the motor system is not only sensitive to the expected payoff (or cost) of movements, but also to the variability associated with the payoff (or cost). Decision-makers that take such variability into account in decision-making are termed risk-sensitive.
Consider, for example, that you have the choice between a 50:50 gamble of winning either $0 or $100 and a sure-bet of $50. Most people prefer the sure-bet, because it is devoid of risk, even though both choices have the same expected payoff. In fact, most people would even prefer the sure-bet if it had a slightly lower payoff, say $45 – the $5 difference in expected payoff is called a risk-premium that risk-averse decision-makers are prepared to pay in order to avoid risk, thereby providing a livelihood to insurance companies (Samuelson and Nordhaus, 2009). In contrast, risk-seeking individuals that are obsessed by the possibility of winning $100 might prefer the gamble over even a sure-bet of $55, ultimately providing a livelihood for casino owners. How can such risk-sensitive behavior be explained? The theory of risk in decision-making goes back to the eighteenth century (Bernoulli, 1954/1738) and has since developed into a host of different models of decision-making under uncertainty (Von Neumann and Morgenstern, 1944; Markowitz, 1952; Savage, 1954; Pratt, 1964; Arrow, 1965; Kahneman and Tversky, 1979). Here we will briefly review different models of risk and then discuss their relevance for the study of sensorimotor control.
Models of Risk
Arrow–Pratt Measure of Risk
A first quantitative model of risk was developed by Daniel Bernoulli in the eighteenth century in response to the famous St. Petersburg paradox (Bernoulli, 1954/1738). In this paradox a fair coin is tossed repeatedly and every time a head comes up the value of the jackpot is doubled, but the game ends as soon as a tail appears. Therefore, if the jackpot is initialized with $1 and tail appears in the first toss you win $1, if it appears in the second toss you win $2, in the third toss it is $4, and so forth. The question was how much a gambler should be prepared to pay to enter such a game of chance. Since the expected payoff  is infinity, the apparent answer seemed to be that one should be prepared to pay any arbitrarily high amount of money to enter this game – a rather questionable result. Bernoulli therefore introduced the distinction between the objectively given nominal value of a gamble (e.g., $1000) and the subjective utility assigned to it by a decision-maker [e.g., U($1000)]. In particular, he noted that $1000 has a higher utility for a pauper compared to a rich man that has already $1000, even though both would gain the same amount. The hypothesis that the second $1000 has less utility, is known as the diminishing marginal utility of money. Bernoulli postulated that the perceived utility of money follows a logarithmic law U($x) ∝ log($x) such that increments in payoff have a diminishing utility. This hypothesis can also explain why a risk-averse person would prefer a sure-bet with a risk-premium in the example described above, because for a risk-averse decision-maker the perceived utility U($45) is higher than the utility of 1/2U($100).
Since subjective utilities are not directly observable, this raises the question of how such utilities could be measured. Von Neumann and Morgenstern (1944) devised a mathematical framework to address this question, based on the notion of preference between “lotteries.” A lottery can be imagined as a roulette wheel where differently sized segments correspond to the probabilities p1, p2,…, pN of the N different outcomes X1, X2,…, XN. If we now create different lotteries by varying the size of the segments then we can ask a decision-maker to indicate preferences between the lotteries. Von Neumann and Morgenstern showed mathematically that if these preferences follow the four basic axioms of completeness, transitivity, continuity, and independence, then the decision-maker’s choice between lotteries can be predicted by the maximum expected utility principle with a utility function U(X1), U(X2), …, U(XN) over the outcomes. A typical shorthand for such lotteries is to write them as [p1, U1; p2, U2; …; pN, UN]. As utilities are only cardinal, they can only be determined up to an affine transform – that is the utility U(X) and the utility represent the same preference patterns. Importantly, the probabilities p1, p2,…, pN are assumed to be known objectively in this framework – an assumption that was later dropped by Savage (1954) who introduced subjective probabilities into decision theory, that is probabilities that can be inferred from observed preference patterns just like subjective utilities.
The hypothesis of subjective utilities that are marginally diminishing seems to suggest that risk-sensitivity could be defined in terms of the curvature of the utility function. This definition is, however, problematic, since utility functions are only determined up to an affine transform, which makes the second derivative dependent on the arbitrarily chosen scaling parameter of the affine transform. Arrow and Pratt (Pratt, 1964; Arrow, 1965) therefore developed invariant measures of risk-sensitivity that are defined as the absolute risk-aversion A(x) = U′(x)/U″(x) and the relative risk-aversion RA(x) = −xA(x). For Bernoulli’s log-utility, for example, the absolute risk-aversion would be decreasing according to RA(x) = 1/x, and the relative risk-aversion would be constant RA(x) = 1. A decreasing absolute risk-aversion means that a wealthier decision-maker is willing to pay a smaller risk-premium to avoid uncertainty, while a constant relative risk-aversion implies that the decision-maker is prepared to put the same percentage of wealth at risk at all levels of wealth. Importantly, this notion of risk requires a continuously differentiable utility function and essentially equates risk with the concept of diminishing marginal utility. Other models of risk do not require these two concepts to be the same.
Risk–Return Models
One of the most popular risk models in finance is the risk–return model proposed by Markowitz (1952). In this model an investor has to decide on a portfolio consisting of diverse financial products such as bank deposits, government bonds, shares, gold, etc. Some of these products may have very predictable payoffs (e.g., a savings account), whereas others might be more volatile (e.g., shares). An investor who considers both the return and the risk (variability of the return) of a portfolio is risk-sensitive. Such an investor bases his decisions on a trade-off f(x) between expected return r(x) and risk R(x) of a portfolio x such that f(x) = r(x) − θR(x), where θ expresses the investor’s individual risk-attitude. A risk-neutral investor (θ = 0) only cares about the return, whereas a risk-averse investor (θ > 0) considers risk as a discount in utility and a risk-seeking investor (θ < 0) considers it as a bonus. A special case of the risk–return model is the mean–variance model, where return is formalized as the expected value r(x) = E[x] and risk is formalized as the variability in payoff, i.e., R(x) = VAR[x].
While the risk–return model provides an alternative approach to risk that is essentially different from the conception of risk in expected utility theory, under certain circumstances the two formalizations can be shown to be equivalent. For example, a decision-maker with a quadratic utility function will make decisions based on expected utilities that only depend on mean and variance of the payoff. Similarly, if payoffs have a Gaussian distribution and the utility function is monotonic and concave, then a decision-maker who follows expected utility theory maximizes a trade-off between mean and variance. In general, one can use Taylor series expansion to locally approximate smooth concave utility functions with a finite number of moments, such as mean and variance (Levy and Markowitz, 1979). Thus, the mean–variance formulation can always be considered as locally equivalent to the expected utility framework for such general utility functions. Some approaches have also suggested risk-sensitive models that consider higher order moments, for example, by using exponential risk functions that generate all moments (Whittle, 1981; Sarin, 1984).
Risk–return models, however, generally do not need to be consistent with expected utility theory. In fact, generalized risk–return models can account for preference patterns that cannot be captured by expected utility theory. If we assume a value function V(x), for example, that measures riskless preference (strength of preference), then we can define the return r(x) = E[V(x)], the risk R(x) = VAR[V(x)] and the trade-off f(x) = E[V(x)] − θVAR[V(x)] to account for preference patterns that violate the independence axiom of expected utility theory (Allais, 1953; Allais and Hagen, 1979; Sarin and Weber, 1993; Bar-Shira and Finkelshtain, 1999) – compare Figure A1 in Appendix for details. This approach also allows modeling perceived returns and perceived risks, where risk is treated as a fundamental quantity measured through direct judgments very much like psychophysical quantities such as brightness or loudness (Sarin and Weber, 1993).
The Fourfold Pattern of Risk in Prospect Theory
Prospect theory was developed as a descriptive theory of decision-making in response to a host of experimental studies on human choice behavior that had reported violations of the normative axioms underlying expected utility theory (Allais, 1953; Attneave, 1953; Ellsberg, 1961; Lichtenstein et al., 1978). One of the most famous violations is the Allais paradox (Allais, 1953), where a decision-maker is faced with two different decisions that essentially present the same choice, but reveal an inconsistent preference reversal. In an adapted version reported by Kahneman and Tversky (1979), the first decision is between lottery A [0.33, U($2500); 0.66, U($2400); 0.01, U($0)] and lottery B [1.0, U($2400)], and the second decision is between lottery C [0.33, U($2500); 0.67, U($0)] and lottery D [0.34, U($2400); 0.66, U($0)]. If we assume that U($0) = 0 then both decisions only differ in their “common consequence” in that lotteries A and B simply add 0.66U($2400) to lotteries C and D. However, most subjects faced with these decisions choose B over A and C over D. This is apparently inconsistent and violates the independence axiom of expected utility theory, as the first choice would imply 0.33U($2500) < 0.34U($2400) and the second choice would imply 0.33U($2500) > 0.34U($2400), thus, reversing the first preference. This reversal can be considered as a special case of the fourfold pattern of risk suggested by Kahneman and Tversky (Tversky and Kahneman, 1992; Glimcher, 2008) and confirmed by several other studies (Fishburn and Kochenberger, 1979; Hershey and Schoemaker, 1980; Payne et al., 1981). These studies found that for high-probability gains subjects are typically risk-averse (as in the first decision of the Allais paradox), whereas for low-probability gains they are risk-seeking (for example, when playing in a casino). However, if lotteries are “framed” in terms of losses rather than gains then the risk pattern is reversed. Subjects are risk-seeking for high-probability losses (as when desperately trying to avert a sure loss) and risk-averse for low-probability losses (for example, when purchasing insurance).
Prospect theory accounts for this fourfold pattern of risk through a two-stage decision process. In the first stage, outcomes are “framed” as losses or gains relative to a reference point that depends on how prospects are presented and how they are mentally “edited” by the decision-maker. This is in contrast to expected utility theory where utilities are defined for absolute states of wealth. In the second stage, the prospect with the highest expected subjective value is selected. The expected subjective value of a prospect with outcomes X1 and X2 occurring with probabilities p1 and p2 is defined as V = i w(pi)v(Xi). The subjective value function v(Xi) measures the subjective gain or loss of the outcome Xi, and the probability weighting function w(pi) measures the subjective distortion of the probability pi as a decision weight.
The subjective value function (Figure 1A) for human subjects is concave for gains (implying marginally diminishing value and contributing to risk-aversion for pure gains) and convex for losses (contributing to risk-seeking for pure losses). The subjective value function is also steeper for losses than for gains, a property known as loss aversion, leading to risk-averse behavior for mixed gain–loss gambles. For example, subjects typically only accept a 50:50 gamble when the potential gain is higher than the potential loss. The probability weighting function (Figure 1B) for human subjects is inverse-S shaped, thus, overweighting low probabilities and underweighting high probabilities. This helps explaining the fourfold pattern of risk, since underweighting of high probabilities reinforces risk-aversion for gains, and risk-seeking for losses as already implied by the shape of the value function, whereas overweighting of low probabilities counteracts the effects of the value function and permits risk-seeking for gains and risk-aversion for losses in the case of low probabilities. Both the subjective value function and the probability weighting function can be measured either by assuming particular parametric forms for v(Xi) and w(pi) (Kahneman and Tversky, 1979; Prelec, 1998) or by non-parametric methods that allow determining v(Xi) and w(pi) for particular Xi and pi without assuming a specific parametric form (Wacker and Deneffe, 1996; Gonzalez and Wu, 1999; Abdellaoui, 2000; Bleichrodt and Pinto, 2000; Abdellaoui et al., 2007). In cumulative prospect theory the probability weighting function transforms cumulative probabilities rather than single event probabilities, which allows for a consistent generalization to arbitrary numbers of outcomes (Tversky and Kahneman, 1992). However, in both variants of the theory the fourfold pattern of risk depends on both the shape of the subjective value function and the distortion through the probability weighting function.
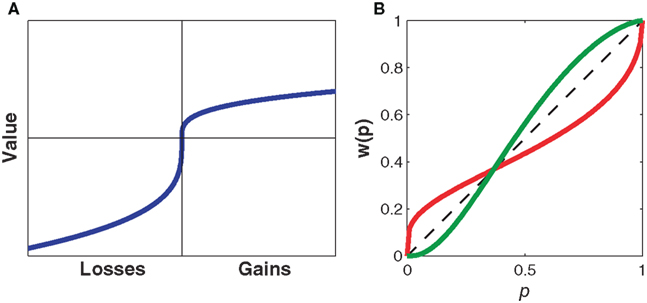
Figure 1. Representative subjective value and probability weighting functions from Prospect Theory. (A) The subjective value of money as perceived by an individual against its nominal value. The value function illustrates concavity for gains and convexity for losses. Note that the value function is steeper for losses than for gains leading to loss aversion. (B) The subjective probability as perceived by an individual against the actual numerical probability. The dashed line indicates no distortion of probabilities. The probability weighting function in red illustrates overweighting of small probabilities and underweighting of large probabilities as found when using explicit probabilities, for example, in questionnaire studies. The probability weighting function in green illustrates underweighting of small probabilities and overweighting of large probabilities as found in two recent motor control studies (Wu et al., 2009; Nagengast et al., 2010a,b).
Risk-Neutral Accounts of Motor Control
In economic decision-making tasks, subjects are typically faced with one-shot choices between lotteries that are communicated to the subject by explicit numbers both for the payoffs and the involved probabilities (e.g., a “50:50” chance of winning “$100” or “$0”). In contrast, motor tasks are generally not specified in terms of numerically displayed probabilities. Instead, probabilities in motor task “lotteries” arise through the inherent variability of the motor system. For example, when subjects are asked to point to a target under time constraints, they are generally unable to point again to the exact same spot, and over repeated trials a distribution of endpoints is obtained that can be represented by a probability distribution (Maloney et al., 2007). Similarly, during reaching movements signal-dependent noise is thought to induce variability into the movement leading to a distribution over trajectories (Harris and Wolpert, 1998; Todorov and Jordan, 2002; Todorov, 2005). Similar to task probabilities, payoffs can also be either explicit or implicit. In the following we review both kinds of motor tasks, i.e., tasks with explicit payoff, for example given by point rewards or monetary rewards, and tasks with implicit payoff, for example given by energy costs, task error, or effort.
Maximum Expected Gain Models for Explicit Reward Tasks
Throwing a dart at a dart board is a paradigmatic example of a motor task that involves explicitly given point rewards. The points define a payoff landscape that determines where on the board it is best to aim given the sensorimotor variability of the thrower. Trommershauser et al. (2003a,b, 2008) have exposed human subjects to pointing tasks similar to dart throwing and investigated whether subjects’ aiming behavior could be explained by statistical decision theory. In their experiments subjects could point to different target regions Ri each of which was labeled with a monetary reward Gi. The pointing movements had to be performed under time constraints. As subjects’ movements were inherently noisy, movement endpoints could be represented with a Gaussian probability distribution P(x′, y′/x, y) around the aim point (x, y). Thus, the probability of hitting target region Ri is given by  . The hypothesis of maximum expected gain then states that subjects should choose their aim point (x, y) so as to maximize Γ(x, y) = i GiP(Ri|x, y). Importantly, given a measure of the variability in pointing, specifying the payoffs Gi and the locations of the target regions Ri allows one to predict the optimal aiming point (x, y), which was tested experimentally. Trommershauser et al. (2003a,b, 2008) found that in contrast to many economic decision-making tasks, subjects’ motor behavior (i.e., their aim points) could be well described by the expected gain hypothesis. Since this model implies a linear utility function U(Gi) = Gi, this also implies risk-neutrality – compare for example both the absolute and the relative Arrow–Pratt measures of risk which are zero for linear utility functions.
Optimal Feedback Control Models for Implicit Reward Tasks
In many motor tasks there is no explicit numerical reward, for example, when walking, cycling, or lifting a cup of coffee. Nevertheless, such motor tasks are amenable to theoretical investigation by optimality principles (Todorov, 2004). Optimality models for motor tasks can be classified into open-loop and closed-loop control schemes. Open-loop models predict an optimal desired trajectory from biomechanical constraints and a performance criterion like energy consumption or trajectory smoothness (Hatze and Buys, 1977; Flash and Hogan, 1985; Uno et al., 1989; Alexander, 1997; Nakano et al., 1999; Smeets and Brenner, 1999; Fagg et al., 2002). Most of these models deal with deterministic dynamics and are therefore devoid of risk, although some open-loop models take motor variability into account for planning optimal movements (Harris and Wolpert, 1998). In contrast, optimal feedback control (Todorov and Jordan, 2002) is a closed-loop modeling scheme in which sensory and motor noise are considered for finding the optimal feedback control law (sometimes also called “optimal policy”), which is a contingent observation-action plan for all possible states, rather than a pre-determined sequence of actions. Such optimal control laws have been found to successfully explain diverse phenomena, such as variability patterns and flexibility of arm movement trajectories (Todorov and Jordan, 2002; Liu and Todorov, 2007; Guigon et al., 2008), coordination in bimanual movements (Diedrichsen, 2007; Braun et al., 2009a; Diedrichsen and Dowling, 2009), adaptation to force-fields and visuomotor transforms (Izawa et al., 2008; Braun et al., 2009b), preservation of movement stability under uncertainty (Crevecoeur et al., 2010), adaptive control of saccades (Chen-Harris et al., 2008), object manipulation (Nagengast et al., 2009) and snowboard-like full-body movements (Stevenson et al., 2009).
Optimal feedback control models typically assume a biomechanical system (e.g., the arm) with state xt and dynamics xt+1 = f(xt, ut, εt), where ut is the control command and εt is the motor noise. The controller receives feedback yt = g(xt, ηt) that is contaminated by sensory noise ηt (e.g., visual or haptic feedback). At each time-step this system incurs a cost ct(xt, ut) that can depend on effort, task error, speed, and possibly other states of the biomechanical system. The optimal control problem is to find the control law that minimizes the total expected cost E⌊t ct(xt, ut)⌋, where the expectation is taken with respect to the probability distribution over trajectories induced by the control law. Thus, the optimal feedback control problem can be considered as a temporally extended motor “lottery” where the probabilities are given implicitly by the uncertainty over trajectories and the choices correspond to different policies that map past observations y1, y2, …, yt to a motor command ut. Since the expectation E⌊t ct(xt, ut)⌋ is linear in the cost, optimal feedback control models that minimize this expectation value are risk-neutral with respect to the cost.
Risk-Sensitive Accounts of Motor Control
Risk-Seeking in Motor Tasks with Monetary Payoffs
Given the apparent discrepancy between economic studies on decision-making and the studies in motor control described above, the question arises whether the same subjects that exhibit risk-sensitivity in an economic decision task would act differently if the same decision-problem was presented as a motor task. Recently, this question was addressed experimentally (Wu et al., 2009). Wu et al. trained subjects on a motor task that required accurate pointing movements under time constraints, so that after training they could establish subjects’ probability pi of hitting target region i with payoff $Vi. By manipulating the payoffs and probabilities, by adjusting the size of the target regions and the associated monetary rewards, they could present subjects with binary choices between varying motor lotteries of the form [p1, V1; p2, V2; p3, V3]. In particular, they were able to induce lotteries that only differed in “common consequences,” as in the Allais paradox, to study whether violations of expected utility theory also occur in motor tasks.
In their experiments Wu et al. used this paradigm of “common consequences” both in the motor task and in the equivalent economic decision task. In both cases they observed preference reversals that were inconsistent with expected utility theory. Importantly, “common consequence” lotteries also differ in their riskiness, that is in the variance of their payoffs. Wu et al. found that in the motor task subjects chose riskier lotteries with significantly higher frequencies than in the economic decision task. To explain this phenomenon they fit a prospect theory model to their subjects’ choice data. While there was no significant difference in the inferred value functions of the economic and the motor task, Wu et al. found a characteristic difference in the probability weighting function. In the motor task the inverse-S shaped weighting function of the economic decision task appeared mirrored on the diagonal, such that in the motor task low probabilities were underweighted and high probabilities overweighted. Since the same subjects overweighted low probabilities and underweighted high probabilities in the economic decision-making task, subjects exhibited opposite patterns of probability distortion in the motor and the economic decision-making task (compare Figure 1B). This difference in the probability weighting function also accounts for the increased risk-seeking observed during the motor task, since low probabilities of not winning are systematically underweighted.
Motor Risk as Mean–Variance Trade-Off in Effort
In its simplest form the risk–return model formalizes risk-sensitivity as a trade-off between mean payoff and the variance of the payoff. Recently, this mean–variance model of risk-sensitivity has been tested by Nagengast et al. (2010b) in a motor task that required effort as an implicit payoff. In their task, subjects had a choice between a sure motor action associated with a fixed and certain effort and a risky action that was probabilistically associated with an effort that was either lower or higher than the certain effort. Similar to the studies by Trommershauser et al. (2003a,b, 2008), in the case of the risky action the probabilistic outcome was determined by subjects’ probability of hitting a designated target region within a short time limit. Crucially, the two possible outcomes of the risky action not only entailed a mean effort that could be compared to the certain effort, but also a variance. By manipulating the two outcomes of the risky choice appropriately, Nagengast et al. could fix the level of effort variance, while exposing subjects to different mean levels of effort. In this way they measured the indifference points where subjects chose equiprobably between the certain effort and the mean effort for a given variance level. Thus, subjects could be classified as risk-seeking, risk-averse, or risk-neutral depending on whether they accepted risky actions that had a higher, lower, or equal mean effort compared to the certain effort. In fact, the null-hypothesis of risk-neutrality could be rejected for most subjects in this task, with the majority being risk-seeking (Figure 2).
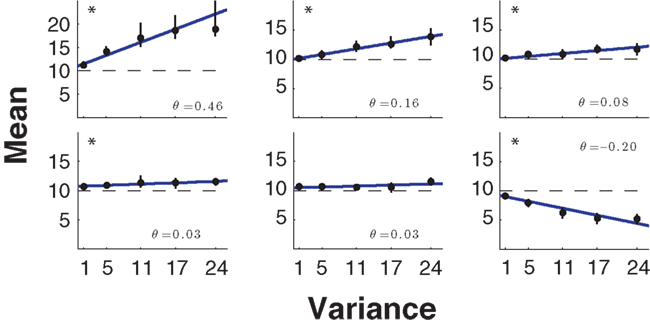
Figure 2. Mean–variance trade-off. Six representative subjects of the mean–variance trade-off experiment (Nagengast et al., 2010b) ordered from the most risk-seeking to the most risk-averse. The five indifference points ± SD obtained using psychometric curve fits are shown in black. The best lines of fit were obtained using weighted linear regression and are shown in blue. The risk-attitude parameter θ is the line’s slope and is shown in the right-hand corners of the subplots. In the experiment the null-hypothesis of risk-neutrality could be rejected with p < 0.05 for 11 out of 14 subjects (significance is marked with an asterisk in the plot).
The risk-seeking behavior observed in this motor task with implicit effort payoffs is similar to the risk-seeking behavior reported by Wu et al. (2009) in their motor task with monetary payoffs. Accordingly, a fit of the trial-by-trial choice data with a prospect theory model reconfirmed the finding of Wu et al. about the probability weighting function underweighting small probabilities in motor tasks (compare Figure 1B). To this end, we assumed the commonplace parametric forms v(x) = −xα and w(p) = exp[−(−lnp)γ] for the subjective value function and the probability weighting function respectively (Wu et al., 2009), and we conducted a maximum likelihood fit for the parameters α and γ. However, this prospect theory model fit did not provide a better explanation of subjects’ choices than the mean–variance model. Unlike the study by Wu et al., the experimental setup allowed the mean and variance of the payoff to be manipulated separately, which in turn allowed the mean–variance trade-off to be directly measured. However, whether the brain represents risk in agreement with the mean–variance approach or with the prospect theory account is still subject to an ongoing debate (Boorman and Sallet, 2009). Recent evidence from electrophysiological and functional imaging studies has provided support for both theories. In support of the mean–variance approach, separate encoding of reward magnitude and risk has been reported in humans (Preuschoff et al., 2006; Tobler et al., 2007, 2009) as well as in non-human primates (Tobler et al., 2005). However, recent studies have also found neural evidence in favor of prospect theory, such as neural correlates of framing processes (Martino et al., 2006) and neural responses that depended on probabilities in a non-linear fashion during a risky task (Hsu et al., 2009). Both effects are cornerstones of prospect theory. However, further studies are needed to elucidate how the brain represents value and how the brain’s different valuation and action selection systems interact and vie for control to arrive at an overt behavioral decision (Rangel et al., 2008).
Risk-Sensitive Optimal Feedback Control
In contrast to risk-neutral optimal feedback controllers that have been widely used to model motor behavior (Todorov and Jordan, 2002), a risk-sensitive optimal feedback controller depends not only on the mean expectation value of the cost but also on higher order moments, such as the variance of the cost (Whittle, 1981). An optimal controller with risk-sensitivity θ optimizes the criterion  with θ < 0 for a risk-averse controller, θ > 0 for a risk-seeking controller, and θ = 0 for the risk-neutral controller where the criterion function coincides with the standard expected cost function E⌊t ct(xt, ut)⌋. Interestingly, this criterion is compatible with a mean–variance notion of risk, since the first two terms of a Taylor series approximation of γ(θ) correspond to mean and variance, i.e., γ(θ) ≈ E[t ct(xt, ut)] − θ/4 VAR[t ct(xt, ut)]. In the case of a system with linear dynamics, quadratic cost function, and additive noise, such a risk-sensitive control scheme predicts that the control gain should be dependent on the magnitude of the process noise, whereas a risk-neutral control scheme predicts that the control gain should be unaffected by this noise level.
Recently, Nagengast et al. (2010a) tested this prediction of the risk-sensitive control framework in a human movement task – compare Figure 3. Subjects had to control a virtual ball that underwent Brownian motion resulting from an additive noise process with a given magnitude. The ball moved forward with constant velocity toward a target line, but the ball’s trajectory fluctuated randomly to the left and to the right according to the process of Brownian motion. Subjects were required to minimize an explicit cost displayed in points that was a combination of the final positional error measured as the distance of the ball from the center of the target line and the integrated control cost. Accordingly, the Brownian motion introduced a task-relevant variability directly affecting the task cost (Franklin and Wolpert, 2008). Since the control costs were given explicitly in this task and did not have to be fitted to subjects’ behavior, the only free parameters of the risk-sensitive model were the magnitude of the noise and the risk-parameter. By testing subjects on different levels of Brownian motion noise, it was possible to test whether subjects changed their control gains in accordance with a risk-sensitive account of control, or were indifferent to such changes in accordance with a risk-neutral account of control. Nagengast et al. found that for the same error experienced in a particular trial, most subjects intervened more in a task with large error statistics than in a task with small error statistics (Figure 4). Thus, the statistics of preceding trials affects the reaction to the same error.
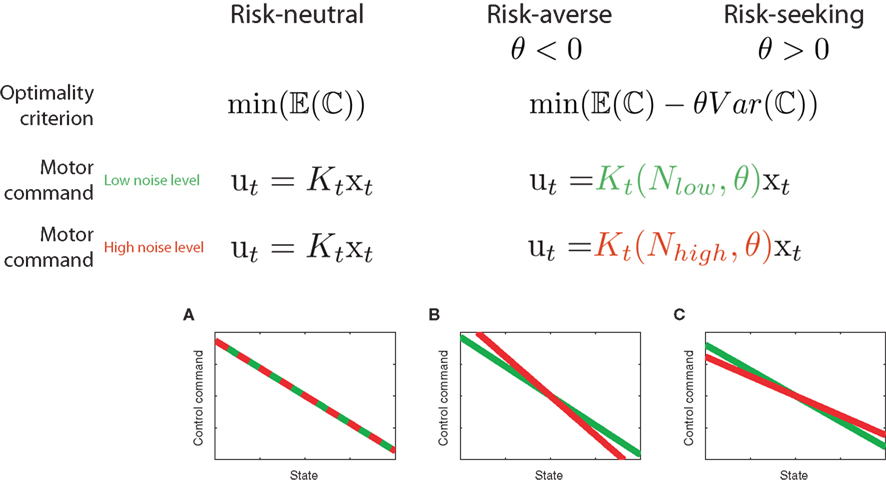
Figure 3. Predictions of risk-sensitive optimal feedback control. A risk-neutral optimal control model (θ = 0) attempts to minimize the mean of the cost function. As a result, its policy (that is the motor command applied for a given state of the world) is independent of the noise variance N. In contrast, a risk-sensitive optimal control model minimizes a weighted combination of the mean and variance of the cost. Additional variance is an added cost for a risk-averse controller (θ < 0), whereas it makes a movement strategy more desirable for a risk-seeking controller (θ > 0). As a consequence, the policy of the controller changes with the noise level N depending on its risk-attitude θ. (A–C) Changes in motor command with the state for a low noise level (green) and for a high noise level (red) for the risk-neutral (A), risk-averse (B) and risk-seeking (C) controllers. In our experiments the state is given by the positional deviation of a cursor from the center of a target line (the cursor can deviate to the left or to the right leading to positive or negative State) and the control task is to reduce this deviation to zero. Consequently, all lines have a negative slope, as the control command needs to point into the opposite direction of the deviation. The slope of the lines is equivalent to the control gain of the controller.
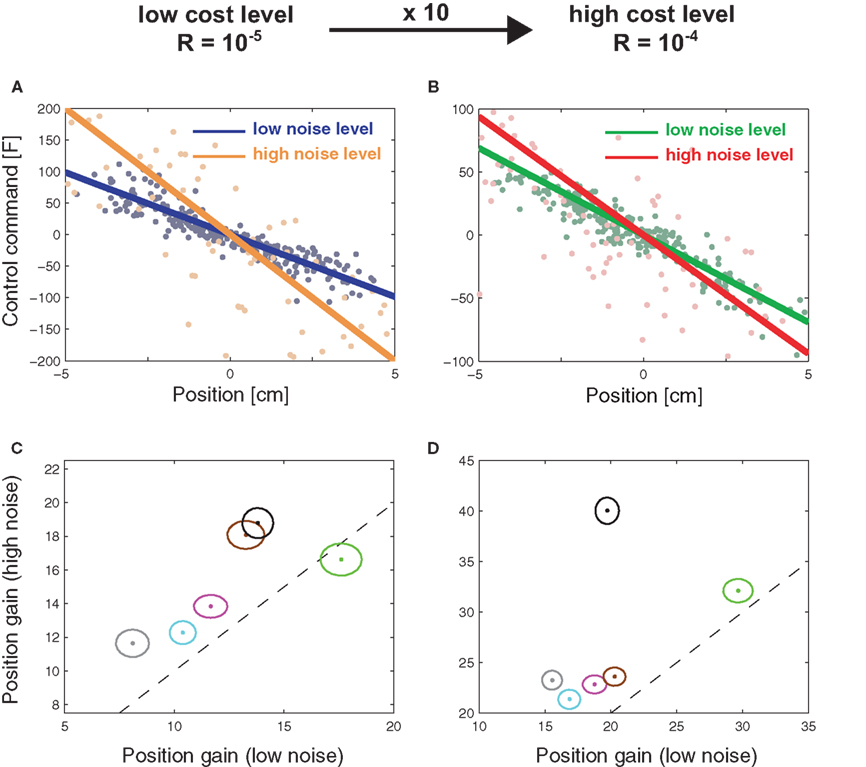
Figure 4. Subjects’ control gains in experiment for different cost and noise conditions. (A) Experimental Session with low control costs. Results of a multi-linear regression analysis of the control gains for a representative subject. The lines show the average motor command that the subject produces for a given position (blue – low noise level, yellow – high noise level). The slope of the line is a measure for the positional control gain of the subject. (B) same as in (A) but for a condition with high control costs (green – low noise level, red – high noise level). (C) Positional control gain for the high noise condition plotted against the control gains of the low noise condition for all six subjects under low control costs (ellipses show the standard deviation). The dashed line represents equality between the gains. (D) as (C) but for high control costs. In both cost conditions, the gains have changed significantly as most ellipses do not intersect with the dashed diagonal. This change in gains is consistent with a risk-sensitive optimal feedback control model, but not with a risk-neutral model.
This behavior is consistent with risk-aversion, but inconsistent with a risk-neutral account of motor control. Therefore, subjects acted pessimistically in the presence of noise, as they were prepared to accept higher control costs in order to avoid losses.
Conclusion
Risk-sensitivity has been studied extensively in economics and psychology (Trimpop, 1994; Kahneman and Tversky, 2000; Gigerenzer, 2002; Samuelson and Nordhaus, 2009). In biology, the concept of risk-sensitivity has previously been mainly applied to foraging, feeding, and reproduction (Houston, 1991; Hurly and Oseen, 1999; Shafir et al., 1999; Kirshenbaum et al., 2000; Shapiro, 2000; Bateson, 2002; Goldshmidt and Fantino, 2004; Heilbronner et al., 2008; Matsushima et al., 2008; Wong et al., 2009; Bardsen et al., 2010; Kawamori and Matsushima, 2010). There have also been investigations on the neural substrate of risk-sensitivity in economic decision tasks in which macaque monkeys “gambled” for fluid rewards (McCoy and Platt, 2005; Hayden et al., 2008; Long et al., 2009). In contrast to this body of research, the majority of studies in motor control have emphasized risk-neutrality, in that motor behavior in these studies could be explained as the maximization (minimization) of expected reward (cost) without taking into account higher moments like the variance of the reward (cost). This apparent discrepancy between motor control and economic decision-making seems all the more striking as both fields rely on the same normative framework of decision theory.
Here we have reviewed recent evidence for risk-sensitivity in motor control tasks. In these studies risk was either conceptualized as a distortion of monetary value and probability or as a trade-off between mean and variance of movement costs. While these two accounts may differ in the way they formalize risk, both frameworks suggest that movement neuroscience needs to consider risk-sensitivity in computational models to explain individual differences in motor control. Previous studies in economics have shown that individual risk-sensitivity tends to be context-dependent, such that the same individual can be risk-averse in one domain but risk-seeking in another (MacCrimmon and Wehrung, 1986; Yates, 1992; Weber et al., 2002; Hanoch et al., 2006). In motor control risk-sensitivity may also depend on the task domain, the skill level and other contextual factors. How risk-sensitivity generalizes across different motor tasks is therefore an important future question.
Since ultimately optimal choice models both in motor control and in economics rely on the same mathematical framework of decision theory, the study of risk-sensitivity within this framework promises to further weld together the fields of movement neuroscience, neuroeconomics, and behavioral economics. However, this commonality of the theoretical framework does not necessarily imply that the normative principles and neural processes across the levels from motor to cognitive neuroscience are the same. For example, whether numbers are represented symbolically, as is typically the case in cognitive decision tasks between lotteries, or non-symbolically, as is typically the case in motor control, fundamentally affects decision-making and neural processing (Dehaene et al., 2008). Important differences might also exist in the learning processes that lead to optimized behavior. Some of these may be optimized on the fly, while others may take a long time to learn – indicating that the underlying mechanisms are different. Therefore, whether the application of the same normative theory across these domains is a fruitful exercise is – in the end – an empirical question.
Conflict of Interest Statement
The authors declare that the research was conducted in the absence of any commercial or financial relationships that could be construed as a potential conflict of interest.
Acknowledgments
This work was supported by the Wellcome Trust and the European Project SENSOPAC (IST-2005-028056). Daniel A. Braun was supported by the German Academic Exchange Service (DAAD). Arne J. Nagengast was financially supported by a MRC research studentship.
References
Abdellaoui, M. (2000). Parameter-free elicitation of utility and probability weighting functions. Manage. Sci. 46, 1497–1512.
Abdellaoui, M., Bleichrodt, H., and Paraschiv, C. (2007). Measuring loss aversion under prospect theory: a parameter-free approach. Manage. Sci. 53, 1659–1674.
Alexander, R. M. (1997). A minimum energy cost hypothesis for human arm trajectories. Biol. Cybern. 76, 97–105.
Allais, M. (1953). Le comportement de l’homme rationnel devant le risque: critique des postulats et axiomes de l’école américaine. Econometrica 2, 503–546.
Allais, M., and Hagen, O. (eds). (1979). Expected Utility Hypothesis and the Allais Paradox. Dordrecht: D. Reidel.
Attneave, F. (1953). Psychological probability as a function of experienced frequency. J. Exp. Psychol. 46, 81–86.
Bar-Shira, Z., and Finkelshtain, I. (1999). Two-moments decision models and utility-representable preferences. J. Econ. Behav. Organ. 38, 237–244.
Bardsen, B. J., Tveraa, T., Fauchald, P., and Langeland, K. (2010). Observational evidence of risk-sensitive reproductive allocation in a long-lived mammal. Oecologia 162, 627–639.
Bateson, M. (2002). Recent advances in our understanding of risk-sensitive foraging preferences. Proc. Nutr. Soc. 61, 509–516.
Bell, D. E., Raiffa, H., and Tversky, A. (eds). (1988). Decision Making: Descriptive, Normative and Prescriptive Interactions. Cambridge: Cambridge University Press.
Bernoulli, D. (1954/1738). Exposition of a new theory on the measurement of risk. Econometrica 22, 23–36.
Bleichrodt, H., and Pinto, J. L. (2000). A parameter-free elicitation of the probability weighting function in medical decision analysis. Manage. Sci. 46, 1485–1496.
Boorman, E. D., and Sallet, J. (2009). Mean–variance or prospect theory: the nature of value representations in the human brain. J. Neurosci. 29, 7945–7947.
Braun, D. A., Ortega, P. A., and Wolpert, D. M. (2009a). Nash equilibria in multi-agent motor interactions. PLoS Comput. Biol. 5, e1000468. doi: 10.1371/journal.pcbi.1000468
Braun, D. A., Aertsen, A., Wolpert, D. M., and Mehring, C. (2009b). Learning optimal adaptation strategies in unpredictable motor tasks. J. Neurosci. 29, 6472–6478.
Chen-Harris, H., Joiner, W. M., Ethier, V., Zee, D. S., and Shadmehr, R. (2008). Adaptive control of saccades via internal feedback. J. Neurosci. 28, 2804–2813.
Crevecoeur, F., McIntyre, J., Thonnard, J. L., and Lefevre, P. (2010). Movement stability under uncertain internal models of dynamics. J. Neurophysiol. 104, 1309–1313.
Dehaene, S., Izard, V., Spelke, E., and Pica, P. (2008). Log or linear? Distinct intuitions of the number scale in Western and Amazonian indigene cultures. Science 320, 1217–1220.
Diedrichsen, J. (2007). Optimal task-dependent changes of bimanual feedback control and adaptation. Curr. Biol. 17, 1675–1679.
Diedrichsen, J., and Dowling, N. (2009). Bimanual coordination as task-dependent linear control policies. Hum. Mov. Sci. 28, 334–347.
Diedrichsen, J., Shadmehr, R., and Ivry, R. B. (2010). The coordination of movement: optimal feedback control and beyond. Trends Cogn. Sci. 14, 31–39.
Fagg, A. H., Shah, A., and Barto, A. G. (2002). A computational model of muscle recruitment for wrist movements. J. Neurophysiol. 88, 3348–3358.
Faisal, A. A., Selen, L. P., and Wolpert, D. M. (2008). Noise in the nervous system. Nat. Rev. Neurosci. 9, 292–303.
Fishburn, P., and Kochenberger, G. (1979). Two-piece von Neumann-Morgenstern utility functions. Decis. Sci. 10, 503–518.
Flash, T., and Hogan, N. (1985). The coordination of arm movements: an experimentally confirmed mathematical model. J. Neurosci. 5, 1688–1703.
Franklin, D. W., and Wolpert, D. M. (2008). Specificity of reflex adaptation for task-relevant variability. J. Neurosci. 28, 14165–14175.
Goldshmidt, J. N., and Fantino, E. (2004). Economic context and pigeons’ risk-taking: an integrative approach. Behav. Processes 65, 133–154.
Gonzalez, R., and Wu, G. (1999). On the shape of the probability weighting function. Cogn. Psychol. 38, 129–166.
Guigon, E., Baraduc, P., and Desmurget, M. (2008). Computational motor control: feedback and accuracy. Eur. J. Neurosci. 27, 1003–1016.
Hanoch, Y., Johnson, J., and Wilke, A. (2006). Domain specifcity in experimental measures and participant recruitment: an application to risk-taking behavior. Psychol. Sci. 17, 300–304.
Harris, C. M., and Wolpert, D. M. (1998). Signal-dependent noise determines motor planning. Nature 394, 780–784.
Hatze, H., and Buys, J. D. (1977). Energy-optimal controls in the mammalian neuromuscular system. Biol. Cybern. 27, 9–20.
Hayden, B. Y., Heilbronner, S. R., Nair, A. C., and Platt, M. L. (2008). Cognitive influences on risk-seeking by rhesus macaques. Judgm. Decis. Mak. 3, 389–395.
Heilbronner, S. R., Rosati, A. G., Stevens, J. R., Hare, B., and Hauser, M. D. (2008). A fruit in the hand or two in the bush? Divergent risk preferences in chimpanzees and bonobos. Biol. Lett. 4, 246–249.
Hershey, J. C., and Schoemaker, P. J. H. (1980). Probability versus certainty equivalence methods in utility measurement: are they equivalent? Manag. Sci. 31, 1213–1231.
Houston, A. I. (1991). Risk-sensitive foraging theory and operant psychology. J. Exp. Anal. Behav. 56, 585–589.
Hsu, M., Krajbich, I., Zhao, C., and Camerer, C. (2009). Neural response to reward anticipation under risk is nonlinear in probabilities. J. Neurosci. 29, 2231–2237.
Hurly, T. A., and Oseen, M. D. (1999). Context-dependent, risk-sensitive foraging preferences in wild rufous hummingbirds. Anim. Behav. 58, 59–66.
Izawa, J., Rane, T., Donchin, O., and Shadmehr, R. (2008). Motor adaptation as a process of reoptimization. J. Neurosci. 28, 2883–2891.
Kahneman, D., Slovic, P., and Tversky, A. (1982). Judgment Under Uncertainty: Heuristics and Biases. Cambridge: Cambridge University Press.
Kahneman, D., and Tversky, A. (1979). Prospect theory: an analysis of decision under risk. Econometrica 47, 263–291.
Kahneman, D., and Tversky, A. (2000). Choices, Values, and Frames. Cambridge: Cambridge University Press.
Kawamori, A., and Matsushima, T. (2010). Subjective value of risky foods for individual domestic chicks: a hierarchical Bayesian model. Anim. Cogn. 13, 431–441.
Kirshenbaum, A. P., Szalda-Petree, A. D., and Haddad, N. F. (2000). Risk-sensitive foraging in rats: the effects of response-effort and reward-amount manipulations on choice behavior. Behav. Processes 50, 9–17.
Levy, H., and Markowitz, H. (1979). Approximating expected utility by a function of mean and variance. Am. Econ. Rev. 9, 308–317.
Lichtenstein, S., Slovic, P., Fischhoff, B., Layman, M., and Coombs, B. (1978). Judged frequency of lethal events. J. Exp. Psychol. Hum. Learn. Mem. 4, 551–578.
Liu, D., and Todorov, E. (2007). Evidence for the flexible sensorimotor strategies predicted by optimal feedback control. J. Neurosci. 27, 9354–9368.
Long, A. B., Kuhn, C. M., and Platt, M. L. (2009). Serotonin shapes risky decision making in monkeys. Soc. Cogn. Affect. Neurosci. 4, 346–356.
MacCrimmon, K. R., and Wehrung, D. A. (1986). Taking Risks: The Management of Uncertainty. New York: Free Press.
Maloney, L. T., Trommershäuser, J., and Landy, M. S. (2007). “Questions without words: a comparison between decision making under risk and movement planning under risk,” in Integrated Models of Cognitive Systems, ed. W. Gray (New York: Oxford University Press), 297–313.
Martino, B. D., Kumaran, D., Seymour, B., and Dolan, R. J. (2006). Frames, biases, and rational decision-making in the human brain. Science 313, 684–687.
Matsushima, T., Kawamori, A., and Bem-Sojka, T. (2008). Neuro-economics in chicks: foraging choices based on amount, delay and cost. Brain Res. Bull. 76, 245–252.
McCoy, A. N., and Platt, M. L. (2005). Risk-sensitive neurons in macaque posterior cingulate cortex. Nat. Neurosci. 8, 1220–1227.
Nagengast, A. J., Braun, D. A., and Wolpert, D. M. (2009). Optimal control predicts human performance on objects with internal degrees of freedom. PLoS Comput. Biol. 5, e1000419. doi: 10.1371/journal.pcbi.1000419
Nagengast, A. J., Braun, D. A., and Wolpert, D. M. (2010a). Risk-sensitive optimal feedback control accounts for sensorimotor behavior under uncertainty. PLoS Comput. Biol. 6, e1000857. doi: 10.1371/journal.pcbi.1000857
Nagengast, A. J., Braun, D. A., and Wolpert, D. M. (2010b). Risk-sensitivity and the mean–variance trade-off: decision-making in sensorimotor control. Proc. R. Soc. B. doi: 10.1098/rspb.2010.2518. [Epub ahead of print].
Nakano, E., Imamizu, H., Osu, R., Uno, Y., Gomi, H., Yoshioka, T., and Kawato, M. (1999). Quantitative examinations of internal representations for arm trajectory planning: minimum commanded torque change model. J. Neurophysiol. 81, 2140–2155.
Payne, J. W., Laughhunn, D. J., and Crum, R. (1981). Further tests of aspiration level effects in risky choice. Manage. Sci. 27, 953–958.
Pratt, J. W., Raiffa, H., and Schlaifer, R. (1995). Introduction to Statistical Decision Theory. Cambridge, MA, London: MIT Press.
Preuschoff, K., Bossaerts, P., and Quartz, S. R. (2006). Neural differentiation of expected reward and risk in human subcortical structures. Neuron 51, 381–390.
Rangel, A., Camerer, C., and Montague, P. R. (2008). A framework for studying the neurobiology of value-based decision making. Nat. Rev. Neurosci. 9, 545–556.
Shafir, S., Wiegmann, D. D., Smith, B. H., and Real, L. A. (1999). Risk-sensitive foraging: choice behaviour of honeybees in response to variability in volume of reward. Anim. Behav. 57, 1055–1061.
Shapiro, M. S. (2000). Quantitative analysis of risk sensitivity in honeybees (Apis mellifera) with variability in concentration and amount of reward. J. Exp. Psychol. Anim. Behav. Process. 26, 196–205.
Stevenson, I. H., Fernandes, H. L., Vilares, I., Wei, K., and Kording, K. P. (2009). Bayesian integration and non-linear feedback control in a full-body motor task. PLoS Comput. Biol. 5, e1000629. doi: 10.1371/journal.pcbi.1000629
Tobler, P. N., Christopoulos, G. I., O’Doherty, J. P., Dolan, R. J., and Schultz, W. (2009). Risk-dependent reward value signal in human prefrontal cortex. Proc. Natl. Acad. Sci. U.S.A. 106, 7185–7190.
Tobler, P. N., Florillo, C. D., and Schultz, W. (2005). Adaptive coding of reward value by dopamine neurons. Science 307, 1642–1645.
Tobler, P. N., O’Doherty, J. P., Dolan, R. J., and Schultz, W. (2007). Reward value coding distinct from risk attitude-related uncertainty coding in human reward systems. J. Neurophysiol. 97, 1621–1632.
Todorov, E. (2005). Stochastic optimal control and estimation methods adapted to the noise characteristics of the sensorimotor system. Neural. Comput. 17, 1084–1108.
Todorov, E., and Jordan, M. I. (2002). Optimal feedback control as a theory of motor coordination. Nat. Neurosci. 5, 1226–1235.
Trommershauser, J., Maloney, L. T., and Landy, M. S. (2003a). Statistical decision theory and trade-offs in the control of motor response. Spat. Vis. 16, 255–275.
Trommershauser, J., Maloney, L. T., and Landy, M. S. (2003b). Statistical decision theory and the selection of rapid, goal-directed movements. J. Opt. Soc. Am. A. Opt. Image Sci. Vis. 20, 1419–1433.
Trommershauser, J., Maloney, L. T., and Landy, M. S. (2008). Decision making, movement planning and statistical decision theory. Trends Cogn. Sci. 12, 291–297.
Tversky, A., and Kahneman, D. (1992). Advances in prospect theory - cumulative representation of uncertainty. J. Risk Uncertain. 5, 297–323.
Uno, Y., Kawato, M., and Suzuki, R. (1989). Formation and control of optimal trajectory in human multijoint arm movement. Minimum torque-change model. Biol. Cybern. 61, 89–101.
van Beers, R. J., Baraduc, P., and Wolpert, D. M. (2002). Role of uncertainty in sensorimotor control. Philos. Trans. R. Soc. Lond. B, Biol. Sci. 357, 1137–1145.
Von Neumann, J., and Morgenstern, O. (1944). Theory of Games and Economic Behavior. Princeton: Princeton University Press.
Wacker, P., and Deneffe, D. (1996). Eliciting von Neumann-Morgenstern utilities when probabilities are distorted or unknown. Manage. Sci. 42, 1131–1150.
Weber, E., Blais, A., and Betz, N. (2002). A domain-specific risk-attitude scale: measuring risk perceptions and risk behaviors. J. Behav. Decis. Mak. 15, 263–290.
Wong, B. B., Jarvenpaa, M., and Lindstrom, K. (2009). Risk-sensitive mating decisions in a visually compromised environment. Biol. Lett. 5, 600–602.
Keywords: risk, uncertainty, sensorimotor control, risk-sensitivity
Citation: Braun DA, Nagengast AJ and Wolpert DM (2011) Risk-sensitivity in sensorimotor control. Front. Hum. Neurosci. 5:1. doi: 10.3389/fnhum.2011.00001
Received: 07 September 2010;
Accepted: 03 January 2011;
Published online: 24 January 2011.
Edited by:
Sven Bestmann, University College London, UKReviewed by:
Philippe N. Tobler, University of Cambridge, UKJoern Diedrichsen, University of Wales Bangor, UK
Copyright: © 2011 Braun, Nagengast and Wolpert. This is an open-access article subject to an exclusive license agreement between the authors and Frontiers Media SA, which permits unrestricted use, distribution, and reproduction in any medium, provided the original authors and source are credited.
*Correspondence: Daniel A. Braun, Department of Engineering, Cambridge University, Trumpington Street, Cambridge CB2 1PZ, UK. e-mail: dab54@cam.ac.uk