Microstructural parcellation of the human cerebral cortex – from Brodmann’s post-mortem map to in vivo mapping with high-field magnetic resonance imaging
- Department of Neurophysics, Max Planck Institute for Human Cognitive and Brain Sciences, Leipzig, Germany
The year 2009 marked the 100th anniversary of the publication of the famous brain map of Korbinian Brodmann. Although a “classic” guide to microanatomical parcellation of the cerebral cortex, it is – from today’s state-of-the-art neuroimaging perspective – problematic to use Brodmann’s map as a structural guide to functional units in the cortex. In this article we discuss some of the reasons, especially the problematic compatibility of the “post-mortem world” of microstructural brain maps with the “in vivo world” of neuroimaging. We conclude with some prospects for the future of in vivo structural brain mapping: a new approach which has the enormous potential to make direct correlations between microstructure and function in living human brains: “in vivo Brodmann mapping” with high-field magnetic resonance imaging.
Around the turn of the twentieth century, several neuroanatomists, among them Alfred Walter Campbell, Grafton Elliot Smith, Korbinian Brodmann, and Cécile and Oskar Vogt, set out to study the microanatomy of the human cerebral cortex. They noticed that the laminar architectonic pattern of neurons in preparations stained for cell bodies (e.g., with the Nissl technique) and/or the arrangement of tangentially and radially oriented myelinated fibers in preparations stained for myelin sheaths (e.g., with the Weigert technique) are not uniform across the cerebral cortex. Instead, there are marked regional variations. This allowed the delineation of cortical areas, characterized by a uniform cyto- or myeloarchitectonic pattern, and the definition of borders where the pattern changes. Among the first who investigated the functional significance of these areas were Cécile and Oskar Vogt who also studied the cortex of non-human primates. In laboratory animals, microstructure can be directly correlated with function since upon completion of the functional experiments (electrical stimulation of the cortex at that time) the brains can be sectioned, stained for cell bodies or myelin sheaths, and stimulation sites compared with the architectonic pattern. Vogt and Vogt (1919) found that stimulation sites with comparable motor response properties lie within the same area. However, across an architectonic border, the response properties change – first evidence that these areas are also functional entities. Among several cytoarchitectonic maps of the human cortex published in the first half of the twentieth century (Campbell, 1905; Brodmann, 1909; von Economo and Koskinas, 1925; Bailey and von Bonin, 1951; Sarkissov et al., 1955), Brodmann’s map became the most famous parcellation. In 1909 he published his findings in a comprehensive monograph entitled Vergleichende Lokalisationslehre der Großhirnrinde (Treatise on Comparative Localization in the Cerebral Cortex; see also Annese, 2009; Zilles and Amunts, 2010).
A major goal of Brodmann was to elucidate the evolutionary background of structural differentiation in the cortex. Hence, in his monograph (for an English translation see Garey, 2006) he published cytoarchitectonic maps of the cortex of Homo sapiens and eight other mammals ranging from insectivores (Erinaceus europaeus or hedgehog) to non-human primates (Cercopithecus or guenon). He found that some cortical areas, e.g., areas 4, 1, and 17 are present in almost all species examined, whereas other regions in the frontal, posterior parietal, or temporal cortex increasingly differentiate and new areas emerge as one ascends the evolutionary tree. In the human cortex, Brodmann defined 11 Hauptregionen (regions), each of which was subdivided into a varying number of Einzelfelder (areas). They were numbered consecutively from 1 to 52. However, there are two gaps in the sequence: areas 12, 13, 14–16, and 48–51 were defined in lower mammals and non-human primates, but they are missing in humans. This results in 43 areas in the human cortex.
Brodmann’s map has become a “classic” in the field of neurobiology. His ideas provided the basis for the concept of “localization” of function in the cerebral cortex – in sharp contrast to the “holistic” way of viewing brain functions (i.e., higher-level cognitive abilities are functions of the entire brain and not of single cortical areas or modules). Despite many advances in neuroscience, Brodmann’s nomenclature of cortical areas is still widely used to designate functional regions in the cortex, e.g., area 4 for primary motor or area 17 for primary visual cortex. As to the functional validity of Brodmann areas, it is important to note that cytoarchitectonic borders between these areas are also faithfully reflected on a neurochemical level, i.e., within the domain of synaptic processing. Binding sites of “classical” neurotransmitters (e.g., acetylcholine, noradrenaline, glutamate, GABA), detected with quantitative in vitro receptor autoradiography (Zilles et al., 2002), a technique developed in the second half of the twentieth century and many years after Brodmann’s death, exhibit marked laminar and regional variations in their cortical distribution patterns. It has often been shown that borders defined by regional changes in these laminar binding patterns precisely match cytoarchitectonic “Brodmann borders” in adjacent sections stained for cell bodies, e.g., in the motor cortex (Geyer et al., 1996), premotor cortex (Zilles et al., 1996), cingulate cortex (Palomero-Gallagher et al., 2008), Broca’s region (Amunts et al., 2010), somatosensory cortex (Geyer et al., 1997), parietal cortex (Zilles and Palomero-Gallagher, 2001; Scheperjans et al., 2005), auditory cortex (Morosan et al., 2005), and visual cortex (Zilles et al., 2004; Eickhoff et al., 2008; Zilles and Amunts, 2009). This means that not only does cellular microanatomy change at these “Brodmann borders,” but so too does the entire organization of synaptic wiring and information processing. It is not surprising that Brodmann’s map has found its way into the world of functional neuroimaging. Talairach and Tournoux (1988, 1993) when establishing their stereotaxic reference system for spatially normalizing imaging data, adopted Brodmann’s nomenclature for parcellating the cortex of their standard brain in “Talairach Space.”
However, from today’s state-of-the-art neuroimaging perspective, several major problems arise when an investigator wants to use the map as a structural guide to functional units in the cerebral cortex.
Firstly, more sensitive microstructural mapping techniques developed since Brodmann’s time, e.g., neurofilament protein immunohistochemistry (Baleydier et al., 1997) or in vitro transmitter receptor autoradiography (Zilles et al., 2002) have revealed functionally relevant subregions within many of the areas considered by Brodmann to be homogeneous. For example, area 19 is actually a mosaic of different regions belonging to the extrastriate visual cortex (Orban et al., 2004; Wandell et al., 2007). Likewise, area 6 is nowadays subdivided into the supplementary, presupplementary, dorsal, and ventral premotor cortex (Rizzolatti et al., 1998; Geyer et al., 2000).
Secondly, Brodmann’s book – in contrast to, e.g., von Economo and Koskinas’s (1925) monograph – does not provide systematic verbal or pictorial descriptions of each area’s cytoarchitectonic features. In many instances, he only briefly comments on their topographic locations. The map shows each area’s location and extent only on the exposed cortical surface, the sulci are not opened up, and no information is available on each area’s topography within each sulcus. Hence, it is very difficult to compare Brodmann’s map with those of other authors and virtually impossible to re-map his areas in histological sections stained for cell bodies.
Thirdly, “classical” brain maps such as Brodmann’s parcellation were published in two-dimensional print format. This raises problems when structural data from these maps are to be matched with data from other brains. “Classical” maps are schematic drawings that reflect the topographical situation in one brain and do not address the problem of interindividual variability. Furthermore, these maps are “rigid,” i.e., they are not based on a spatial reference system and cannot be warped to other brains. Multimodal integration of structural and functional data is impossible. Although software programs that are capable of inflating and/or flattening the cortex are available nowadays, e.g., FreeSurfer1, Caret2, or BrainVoyager3, the above problems with Brodmann’s map remain.
On the other hand, functional imaging techniques, especially functional magnetic resonance imaging (fMRI), map the cortex with ever-increasing spatial resolution, but they have so far correlated activations only with macroanatomy (gyri and sulci). Invasive electrophysiology in experimental animals (e.g., macaques), however, shows functional borders where microanatomy changes (e.g., Luppino et al., 1991; Matelli et al., 1991). Unfortunately, microanatomy is topographically variable across brains (Rademacher et al., 1993; Geyer et al., 1996, 1999; Amunts et al., 1999, 2000; Caspers et al., 2006) and hard to detect with MRI. Hence, structural–functional correlations based solely on macroanatomy are questionable and may account for at least some of the conflicting results functional imaging studies have provided in the past. Talairach and Tournoux’s (1988, 1993) atlas is of limited value as well. The authors adopted Brodmann’s nomenclature of areas, but their cortical maps are not based on microstructural data. In addition, the atlas indicates only the approximate position of each area (borders between areas are not marked) and it ignores the problem of interindividual variability (only one brain is depicted).
One way to overcome this dilemma is to generate probabilistic cytoarchitectonic maps in standard anatomical (e.g., Montreal Neurological Institute, MNI) space (Roland and Zilles, 1994). Cortical areas are defined cytoarchitectonically in post-mortem brains, reconstructed in 3-D, and spatially normalized. Superimposing data from 10 brains gives a probabilistic description of each area’s spatial variability. In this format, the areas can be matched with co-registered functional imaging data. However, due to the small size of many cortical areas, their close spatial proximity, and interindividual variability, the population maps overlap considerably. Only after extensive thresholding (i.e., considering only voxels above a certain probability level) – and thus discarding structural information – is it possible unequivocally to assign a given voxel in standard space to a particular population map (or cortical area). Furthermore, the invasive nature of microanatomical studies precludes microstructure and function to be studied in the same brain – such correlations can only be probabilistic in nature.
More recent approaches aim at mapping cortical areas non-invasively in living human brains. One line of research uses cortical folding patterns to estimate the topography of Brodmann areas in individual brains (Fischl et al., 2008, 2009; Hinds et al., 2008, 2009). In general, the predictability of Brodmann areas from cortical folds is high in the case of primary areas (e.g., motor cortex = area 4 or visual cortex = area 17), but goes down in the case of higher order cortical areas (e.g., Broca’s region = areas 44 and 45; Fischl et al., 2008). Another approach uses differences in connectivity patterns to delineate cortical areas. Diffusion-weighted MRI combined with probabilistic tractography measures such connectivity patterns in living subjects, and, with an automatic clustering algorithm, cortical regions can then be identified with internally coherent but mutually distinct connectivity (Johansen-Berg et al., 2004; Behrens and Johansen-Berg, 2005; Anwander et al., 2007; Johansen-Berg and Rushworth, 2009). The technique, however, is region of interest (ROI)-based (whose voxels are fed into the clustering algorithm) which means that the neuroanatomical validity of the parcellation result is greatly dependent on the validity of the ROI borders (which are not based on microanatomical criteria).
In recent years, however, two observations have been made which should result in a clearer picture of the organization of individual human brains, thereby opening up exciting questions of the correlation of structure and function (Crick and Jones, 1993; Passingham et al., 2002; Devlin and Poldrack, 2007). The first of these is the dramatic improvement in the quality of in vivo MRI scanning of human brain, by increasing the magnetic field to 7 T and by using a much more sensitive design of radiofrequency receiver coil, involving coil arrays (Roemer et al., 1990) to detect the MRI signal. This provides an increase in signal-to-noise ratio by a factor of >10, as compared with 1.5-T MRI scanning, and thus allows relatively routine 10-min acquisition of whole-brain images with a spatial resolution of only 300–400 μm, easily showing significant features of intracortical microstructure.
The second of these relates to what has become a poor relation of Brodmann’s cytoarchitectonic approach to cortical mapping, the analysis of cortical areas based on myeloarchitecture. Historically, Brodmann’s colleagues, the Vogts, favored this type of analysis, and it was perhaps their erroneous concept of “haarscharfe Grenzen” (i.e., interareal borders as sharp as a hair) that caused their work to fall almost into obscurity. Be this as it may, very little histological work has been done ever since in the frontal (Sanides, 1964; Rajkowska and Goldman-Rakic, 1995a,b), parietal (Hopf, 1969, 1970), temporal (Hopf, 1968; Krimer et al., 1997), and occipital (Clarke and Miklossy, 1990) cortex in exploring the striking variations of myelin structures within human cortex, beyond noting that they are very well correlated with the much better researched cytoarchitectonic maps. A cursory glance at myelin-stained sections through any region of human cerebral cortex reveals that myeloarchitectonic differences between areas are not subtle.
This relative neglect of myeloarchitectonic cortical parcellation is particularly striking in the light of the second observation: that almost all types of MR image contrast variously depend on the presence of myelin within the image voxel. Variations of cytoarchitecture are detectable with MRI only in rare instances, e.g., in the case of the unique islands of large neurons in layer II of the entorhinal cortex (Augustinack et al., 2005), but myelin is very easy to pick out. It is the major source of contrast in T1-weighted and proton density images, and is responsible for T2 and T2* contrast in most of the brain, except for the small deep brain structures naturally containing sequestered ferritin, such as the basal ganglia and the subthalamic nucleus, where the magnetic effects of iron obviously dominate the contrast. Oriented bundles of myelinated axons determine most of the anisotropy of water mobility detected using diffusion tensor MRI. Where myelinated fibers are found within the cortex, in the form of tangential layers and radial bundles, they also give excellent MRI contrast.
For unknown reasons, this fact, self-evident to radiologists and MR scientists, has barely been linked with the problem of in vivo parcellation of human cerebral cortex. Since the first in vivo MRI observation of the Stria of Gennari in primary visual cortex, by Clark et al. (1992), there have been only a few careful studies of the intracortical structure (Barbier et al., 2002; Walters et al., 2003; Bridge et al., 2005; Clare and Bridge, 2005; Bridge and Clare, 2006; Carmichael et al., 2006; Sigalovsky et al., 2006; Duyn et al., 2007; Hinds et al., 2008; Turner et al., 2008; Kim et al., 2009) often observed incidentally in high-resolution scans. One major reason for this is the considerable difficulty in achieving sufficient MRI signal to noise in vivo with isotropic voxels of <0.6 mm size (Hinds et al., 2008), which is required adequately to map the 3-dimensional extent of any cortical area with a distinguishable myeloarchitecture. Only now, with well-engineered scanners at 7 T or more, has it become feasible within a practicable scan time.
In Figure 1 we show an example of microstructural 7 T mapping in a post-mortem brain. The tissue block includes portions of the pre- and post-central gyrus, which contains the border between primary motor (M1) and primary somatosensory cortex (S1). Together with a photograph of the block before MR scanning and histological processing (Figure 1A), we show an MRI (Figure 1B), a myeloarchitectonic (Figure 1C), and a cytoarchitectonic (Figure 1D) section that reproducibly display this border at the expected position, somewhat anterior to the fundus of the central sulcus. The MR scan provides a quantitative map of the longitudinal relaxation time T1, which is reliably reduced in areas of higher myelin density. In these images, it is very easy to discriminate the more densely myelinated layers of primary motor cortex, and to note its greater thickness than corresponding somatosensory cortex. This figure demonstrates the ability of 7-T MRI to resolve local cortical myeloarchitecture, and precisely to depict cortical boundaries. In Figure 2 we show examples of microstructural 7-T MRI in living human brains. Corresponding to the cadaver brain section of Figure 1B, a T1 map in a coronal section through the central sulcus of a volunteer subject is shown in Figure 2A, with isotropic spatial resolution of 600 μm. Although this spatial resolution is inevitably coarser than in cadaver brain (330 μm), the difference in cortical thickness between Brodmann areas 3a and 4 is clearly visible, the enhanced myelination of the layers of area 4 is easily seen, and the border between areas 3a and 4 is easily delineated. Figure 2B shows FLASH MR images with 400 μm isotropic resolution, in two orthogonal sections which include most of the occipital cortex of a volunteer subject. These images show myelinated structures with excellent T2* contrast. The Stria of Gennari, which identifies primary visual cortex, is strikingly visible in both planes of section, due to the use of isotropic voxels (Turner et al., 2008). A 600-μm isotropic resolution T1-weighted volumetric data set (not shown) was used to segment gray and white matter, and cortical profiles with realistic curvature were derived using a level-set method. The image intensity values at equidistant points on these profiles were formed into feature vectors for each point on the gray-white boundary surface. These feature vectors were then subjected to an automatic clustering algorithm, with the aim of grouping within one cluster all profiles that showed the characteristic mid-cortical intensity dip corresponding to the Stria of Gennari. This cluster is indicated in green on the right halves of the images in Figure 2B. Figure 2C shows the cluster on a rendered view of an intermediate cortical surface (∼1.5 mm above white matter), which constitutes a map of Brodmann area 17 (primary visual cortex V1). This is a good example of a fully automated map of a cortical area that uses MRI-based criteria to identify myeloarchitectonic features well known to correspond to Brodmann’s cytoarchitectonic parcellation. Retinotopically derived maps of V1 have not yet covered its full extent, due to the extreme difficulty of providing a sufficiently large visual angle in fMRI visual stimulation studies.
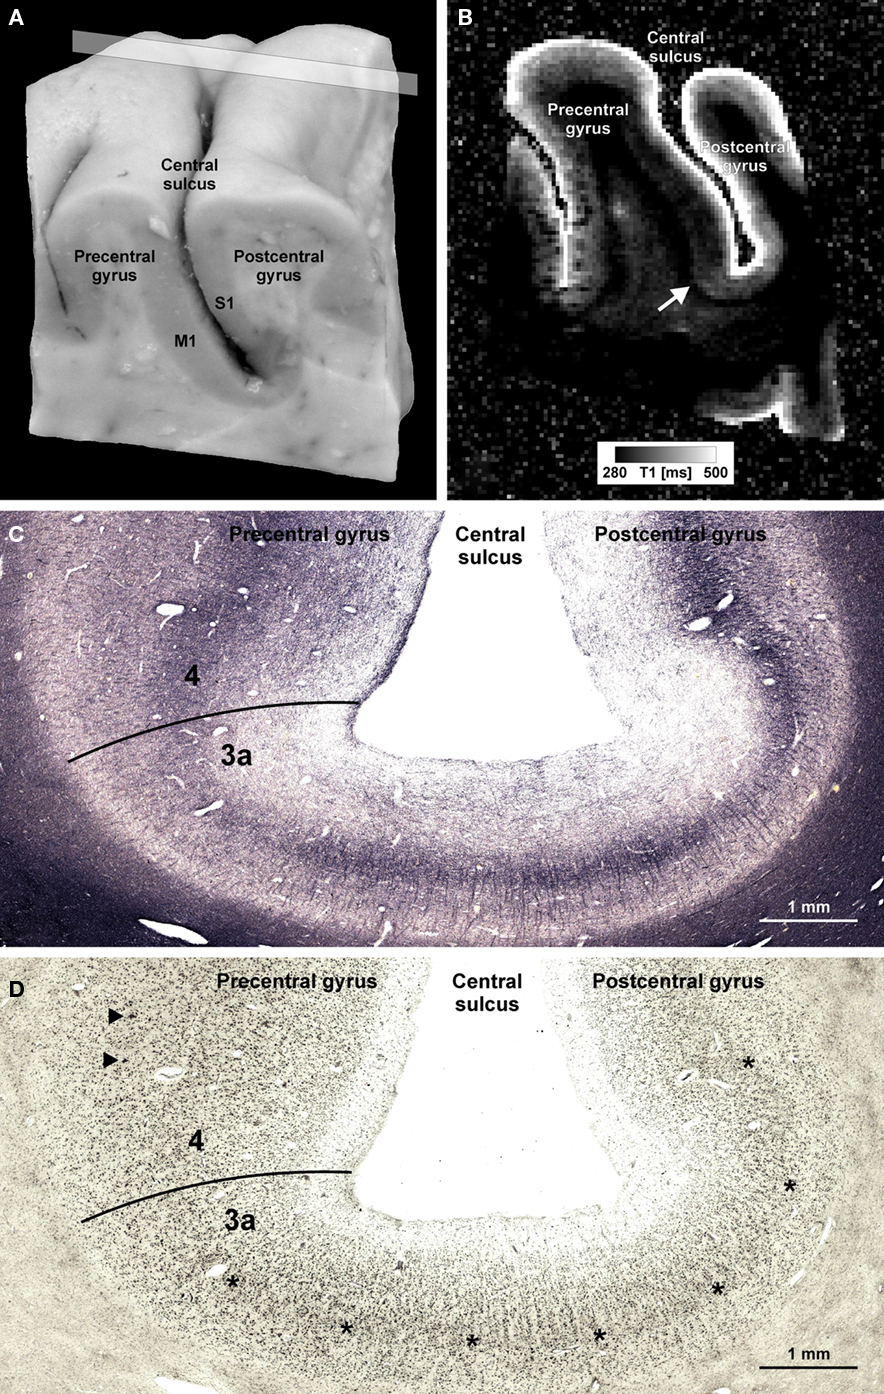
Figure 1. Microstructural 7-T MR mapping in post-mortem brains. (A) Tissue block (pre- and post-central gyrus, right hemisphere) from a post-mortem human brain (female, 61 years, died of pulmonary failure and chronic obstructive pulmonary disease, autopsy performed with informed consent of the patient’s relatives, post-mortem interval before fixation 24 h, fixed in 4% formalin for 2 months) prior to MR scanning and histological processing. M1 = primary motor cortex in the posterior wall of the precentral gyrus, S1 = primary somatosensory cortex in the anterior wall of the post-central gyrus. (B) Quantitative T1 map of the tissue block [for plane of sectioning see rectangle in (A)]. MP2RAGE sequence (Marques et al., 2010) at 7 T, voxel size (0.33 mm)3, 32 averages, acquisition time 3 h 50 min, surrounding medium: Fomblin (Solvay Solexis, Bollate, Italy). Arrow indicates a sharp change in T1 contrast at the base of the precentral gyrus that matches a change in the myelo- and cytoarchitectonic pattern [cf. (C,D)]. (C,D) Frozen sections (30 μm) from a corresponding position of the same block stained for myelin basic protein [rat monoclonal antibody, avidin–biotin–peroxidase complex (ABC) method, chromogen: DAB and ammonium nickel(II) sulfate (C)] and cell bodies [according to Merker, 1983; (D)]. Micrographs show the fundus of the central sulcus [same orientation as in (A,B)]. The drop in T1 values at the base of the precentral gyrus coincides with an increase in myelin basic protein immunostaining [line in (C)]. In an accompanying section stained for cell bodies, this position is characterized by an increase in gray matter thickness, a disappearing inner granular layer (asterisks), and emerging giant pyramidal (Betz) cells (arrowheads). This transition [lines in (C,D)] corresponds to the border between area 3a (somatosensory cortex) and area 4 (primary motor cortex; Geyer et al., 1999).
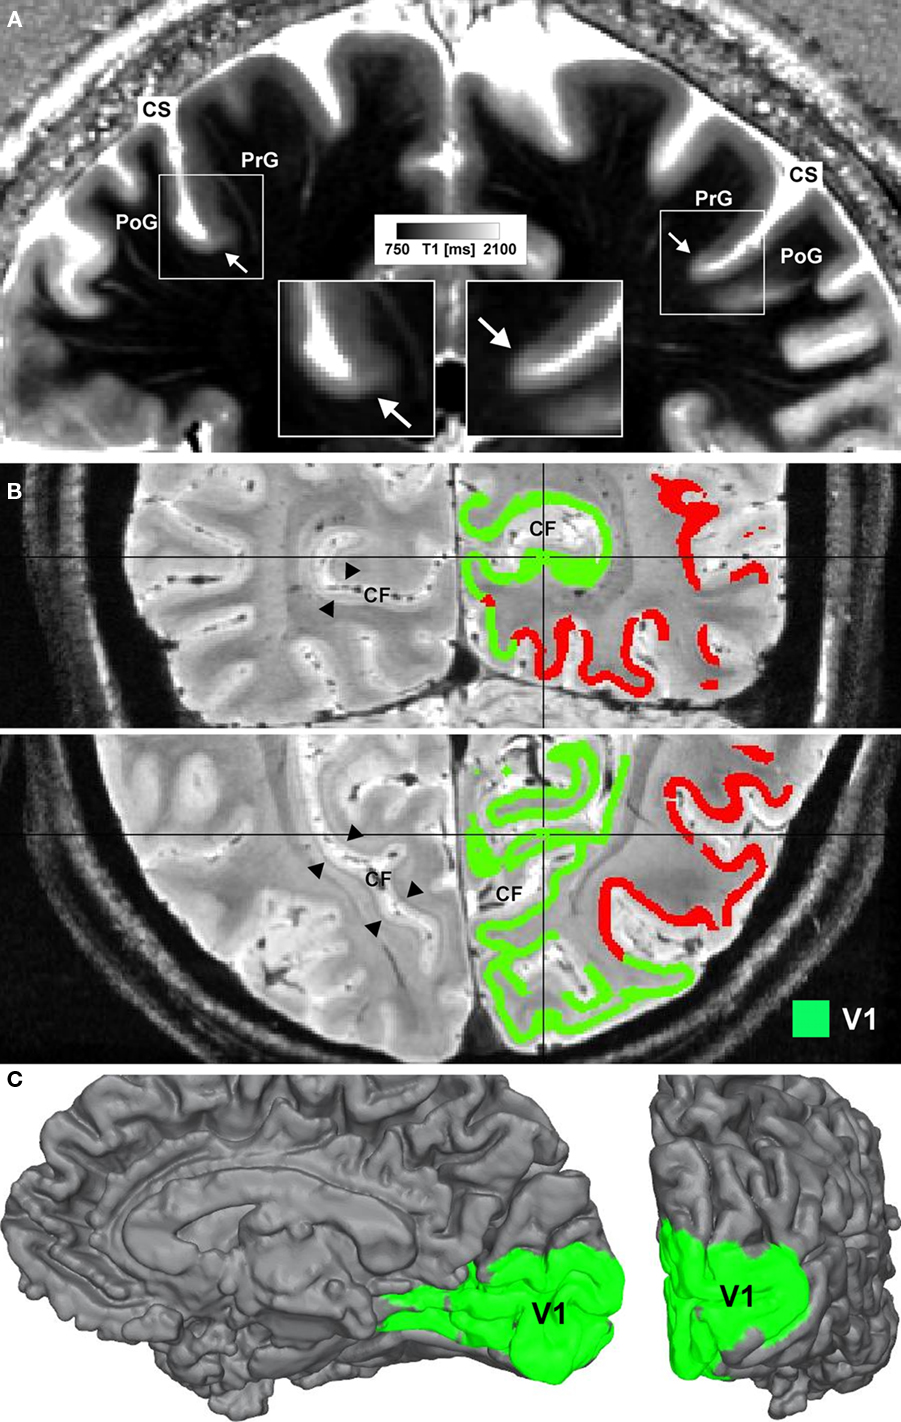
Figure 2. Microstructural 7-T MR mapping in living brains. (A) Quantitative T1 map of the central region in vivo (female, 25 years, coronal section). MP2RAGE sequence (Marques et al., 2010) at 7 T, voxel size (0.6 mm)3, 3 averages, acquisition time 60 min. Arrows mark a drop in T1 values and an increase in cortical thickness at the base of the precentral gyrus (cf. insets). The border matches the corresponding border in the post-mortem tissue block between area 3a and area 4. CS = central sulcus, PoG = post-central gyrus, PrG = precentral gyrus. (B) Ultra high-resolution (0.4 mm)3 FLASH MR image covering the occipital lobe of a living subject (female, 27 years) shown in coronal (top) and axial (bottom) view. In the left hemisphere the well depicted Stria of Gennari (arrowheads) can be seen, whereas in the right hemisphere results of an automatic clustering algorithm are shown. Cortical surfaces were reconstructed on the basis of a high-resolution T1-weighted image (not shown) using a level-set approach. Additional transcortical profiles were computed perpendicular to the isosurfaces of the level-set function. Sampling the FLASH data along these profiles extracts laminar fingerprints for each point on the cortical surface that can be interpreted as feature vectors in a multi-dimensional space. Feeding those into an automatic k-means clustering algorithm parcellates the cortex into areas of similar laminar structure. The green cluster indicates the area containing the Stria of Gennari and marks the primary visual cortex (V1). CF = calcarine fissure. (C) The same cluster as in (B) is mapped onto an intermediate (∼1.5 mm from gray/white matter border) cortical surface. The medial surface (left) and the occipital pole (right) are shown.
Systematic high-field MRI studies, aided by renewed efforts to provide a concordance between cortical areas defined by cytoarchitecture and myeloarchitecture, will now be needed to approach the goal of “in vivo Brodmann mapping.” Only when this is achieved will we be able to achieve the all-important goal of modeling precisely the functional specializations assignable to specific types of cortical structure.
Conflict of Interest Statement
The authors declare that the research was conducted in the absence of any commercial or financial relationships that could be construed as a potential conflict of interest.
Footnotes
References
Amunts, K., Lenzen, M., Friederici, A. D., Schleicher, A., Morosan, P., Palomero-Gallagher, N., and Zilles, K. (2010). Broca’s region: novel organizational principles and multiple receptor mapping. PLoS Biol. 8, e1000489. doi: 10.1371/journal.pbio.1000489
Amunts, K., Malikovic, A., Mohlberg, H., Schormann, T., and Zilles, K. (2000). Brodmann’s areas 17 and 18 brought into stereotaxic space – where and how variable? Neuroimage 11, 66–84.
Amunts, K., Schleicher, A., Bürgel, U., Mohlberg, H., Uylings, H. B. M., and Zilles, K. (1999). Broca’s region revisited: cytoarchitecture and intersubject variability. J. Comp. Neurol. 412, 319–341.
Anwander, A., Tittgemeyer, M., von Cramon, D. Y., Friederici, A. D., and Knösche, T. R. (2007). Connectivity-based parcellation of Broca’s area. Cereb. Cortex 17, 816–825.
Augustinack, J. C., van der Kouwe, A. J. W., Blackwell, M. L., Salat, D. H., Wiggins, C. J., Frosch, M. P., Wiggins, G. C., Potthast, A., Wald, L. L., and Fischl, B. R. (2005). Detection of entorhinal layer II using 7 Tesla magnetic resonance imaging. Ann. Neurol. 57, 489–494.
Bailey, P., and von Bonin, G. (1951). The Isocortex of Man. Urbana, IL: University of Illinois Press.
Baleydier, C., Achache, P., and Froment, J. C. (1997). Neurofilament architecture of superior and mesial premotor cortex in the human brain. Neuroreport 8, 1691–1696.
Barbier, E. L., Marrett, S., Danek, A., Vortmeyer, A., van Gelderen, P., Duyn, J., Bandettini, P., Grafman, J., and Koretsky, A. P. (2002). Imaging cortical anatomy by high-resolution MR at 3.0T: detection of the stripe of Gennari in visual area 17. Magn. Reson. Med. 48, 735–738.
Behrens, T. E. J., and Johansen-Berg, H. (2005). Relating connectional architecture to grey matter function using diffusion imaging. Philos. Trans. R. Soc. Lond. B 360, 903–911.
Bridge, H., and Clare, S. (2006). High-resolution MRI: in vivo histology? Philos. Trans. R. Soc. Lond. B 361, 137–146.
Bridge, H., Clare, S., Jenkinson, M., Jezzard, P., Parker, A. J., and Matthews, P. M. (2005). Independent anatomical and functional measures of the V1/V2 boundary in human visual cortex. J. Vis. 5, 93–102.
Campbell, A. W. (1905). Histological Studies on the Localization of Cerebral Function. Cambridge: University Press.
Carmichael, D. W., Thomas, D. L., De Vita, E., Fernandez-Seara, M. A., Chhina, N., Cooper, M., Sunderland, C., Randell, C., Turner, R., and Ordidge, R. J. (2006). Improving whole brain structural MRI at 4.7 Tesla using 4 irregularly shaped receiver coils. Neuroimage 32, 1176–1184.
Caspers, S., Geyer, S., Schleicher, A., Mohlberg, H., Amunts, K., and Zilles, K. (2006). The human inferior parietal cortex: cytoarchitectonic parcellation and interindividual variability. Neuroimage 33, 430–448.
Clare, S., and Bridge, H. (2005). Methodological issues relating to in vivo cortical myelography using MRI. Hum. Brain Mapp. 26, 240–250.
Clark, V. P., Courchesne, E., and Grafe, M. (1992). In vivo myeloarchitectonic analysis of human striate and extrastriate cortex using magnetic resonance imaging. Cereb. Cortex 2, 417–424.
Clarke, S., and Miklossy, J. (1990). Occipital cortex in man: organization of callosal connections, related myelo- and cytoarchitecture, and putative boundaries of functional visual areas. J. Comp. Neurol. 298, 188–214.
Duyn, J. H., van Gelderen, P., Li, T. Q., de Zwart, J. A., Koretsky, A. P., and Fukunaga, M. (2007). High-field MRI of brain cortical substructure based on signal phase. Proc. Natl. Acad. Sci. U.S.A. 104, 11796–11801.
Eickhoff, S. B., Rottschy, C., Kujovic, M., Palomero-Gallagher, N., and Zilles, K. (2008). Organizational principles of human visual cortex revealed by receptor mapping. Cereb. Cortex 18, 2637–2645.
Fischl, B., Rajendran, N., Busa, E., Augustinack, J., Hinds, O., Yeo, B. T. T., Mohlberg, H., Amunts, K., and Zilles, K. (2008). Cortical folding patterns and predicting cytoarchitecture. Cereb. Cortex 18, 1973–1980.
Fischl, B., Stevens, A. A., Rajendran, N., Yeo, B. T. T., Greve, D. N., Van Leemput, K., Polimeni, J. R., Kakunoori, S., Buckner, R. L., Pacheco, J., Salat, D. H., Melcher, J., Frosch, M. P., Hyman, B. T., Grant, P. E., Rosen, B. R., van der Kouwe, A. J. W., Wiggins, G. C., Wald, L. L., and Augustinack, J. C. (2009). Predicting the location of entorhinal cortex from MRI. Neuroimage 47, 8–17.
Geyer, S., Ledberg, A., Schleicher, A., Kinomura, S., Schormann, T., Bürgel, U., Klingberg, T., Larsson, J., Zilles, K., and Roland, P. E. (1996). Two different areas within the primary motor cortex of man. Nature 382, 805–807.
Geyer, S., Matelli, M., Luppino, G., and Zilles, K. (2000). Functional neuroanatomy of the primate isocortical motor system. Anat. Embryol. 202, 443–474.
Geyer, S., Schleicher, A., and Zilles, K. (1997). The somatosensory cortex of human: cytoarchitecture and regional distributions of receptor-binding sites. Neuroimage 6, 27–45.
Geyer, S., Schleicher, A., and Zilles, K. (1999). Areas 3a, 3b, and 1 of human primary somatosensory cortex: 1. Microstructural organization and interindividual variability. Neuroimage 10, 63–83.
Hinds, O., Polimeni, J. R., Rajendran, N., Balasubramanian, M., Amunts, K., Zilles, K., Schwartz, E. L., Fischl, B., and Triantafyllou, C. (2009). Locating the functional and anatomical boundaries of human primary visual cortex. Neuroimage 46, 915–922.
Hinds, O. P., Rajendran, N., Polimeni, J. R., Augustinack, J. C., Wiggins, G., Wald, L. L., Rosas, H. D., Potthast, A., Schwartz, E. L., and Fischl, B. (2008). Accurate prediction of V1 location from cortical folds in a surface coordinate system. Neuroimage 39, 1585–1599.
Hopf, A. (1968). Photometric studies on the myeloarchitecture of the human temporal lobe. J. Hirnforsch. 10, 285–297.
Hopf, A. (1969). Photometric studies on the myeloarchitecture of the human parietal lobe. I. Parietal region. J. Hirnforsch. 11, 253–265.
Hopf, A. (1970). Photometric studies on the myeloarchitecture of the human parietal lobe. II. Postcentral region. J. Hirnforsch. 12, 135–141.
Johansen-Berg, H., Behrens, T. E. J., Robson, M. D., Drobnjak, I., Rushworth, M. F. S., Brady, J. M., Smith, S. M., Higham, D. J., and Matthews, P. M. (2004). Changes in connectivity profiles define functionally distinct regions in human medial frontal cortex. Proc. Natl. Acad. Sci. U.S.A. 101, 13335–13340.
Johansen-Berg, H., and Rushworth, M. F. S. (2009). Using diffusion imaging to study human connectional anatomy. Annu. Rev. Neurosci. 32, 75–94.
Kim, E. Y., Kim, D. H., Chang, J. H., Yoo, E., Lee, J. W., and Park, H. J. (2009). Triple-layer appearance of Brodmann area 4 at thin-section double inversion-recovery MR imaging. Radiology 250, 515–522.
Krimer, L. S., Hyde, T. M., Herman, M. M., and Saunders, R. C. (1997). The entorhinal cortex: an examination of cyto- and myeloarchitectonic organization in humans. Cereb. Cortex 7, 722–731.
Luppino, G., Matelli, M., Camarda, R. M., Gallese, V., and Rizzolatti, G. (1991). Multiple representations of body movements in mesial area 6 and the adjacent cingulate cortex: an intracortical microstimulation study in the macaque monkey. J. Comp. Neurol. 311, 463–482.
Marques, J. P., Kober, T., Krueger, G., van der Zwaag, W., van de Moortele, P. F., and Gruetter, R. (2010). MP2RAGE, a self bias-field corrected sequence for improved segmentation and T1-mapping at high field. Neuroimage 49, 1271–1281.
Matelli, M., Luppino, G., and Rizzolatti, G. (1991). Architecture of superior and mesial area 6 and the adjacent cingulate cortex in the macaque monkey. J. Comp. Neurol. 311, 445–462.
Merker, B. (1983). Silver staining of cell bodies by means of physical development. J. Neurosci. Methods 9, 235–241.
Morosan, P., Schleicher, A., Amunts, K., and Zilles, K. (2005). Multimodal architectonic mapping of human superior temporal gyrus. Anat. Embryol. 210, 401–406.
Orban, G. A., Van Essen, D., and Vanduffel, W. (2004). Comparative mapping of higher visual areas in monkeys and humans. Trends Cogn. Sci. 8, 315–324.
Palomero-Gallagher, N., Mohlberg, H., Zilles, K., and Vogt, B. (2008). Cytology and receptor architecture of human anterior cingulate cortex. J. Comp. Neurol. 508, 906–926.
Passingham, R. E., Stephan, K. E., and Kötter, R. (2002). The anatomical basis of functional localization in the cortex. Nat. Rev. Neurosci. 3, 606–616.
Rademacher, J., Caviness, V. S., Steinmetz, H., and Galaburda, A. M. (1993). Topographical variation of the human primary cortices: implications for neuroimaging, brain mapping, and neurobiology. Cereb. Cortex 3, 313–329.
Rajkowska, G., and Goldman-Rakic, P. S. (1995a). Cytoarchitectonic definition of prefrontal areas in the normal human cortex: I. Remapping of areas 9 and 46 using quantitative criteria. Cereb. Cortex 5, 307–322.
Rajkowska, G., and Goldman-Rakic, P. S. (1995b). Cytoarchitectonic definition of prefrontal areas in the normal human cortex: II. Variability in locations of areas 9 and 46 and relationship to the Talairach coordinate system. Cereb. Cortex 5, 323–337.
Rizzolatti, G., Luppino, G., and Matelli, M. (1998). The organization of the cortical motor system: new concepts. Electroencephalogr. Clin. Neurophysiol. 106, 283–296.
Roemer, P. B., Edelstein, W. A., Hayes, C. E., Souza, S. P., and Mueller, O. M. (1990). The NMR phased array. Magn. Reson. Med. 16, 192–225.
Roland, P. E., and Zilles, K. (1994). Brain atlases – a new research tool. Trends Neurosci. 17, 458–467.
Sanides, F. (1964). The cyto-myeloarchitecture of the human frontal lobe and its relation to phylogenetic differentiation of the cerebral cortex. J. Hirnforsch. 6, 269–282.
Sarkissov, S. A., Filimonoff, I. N., Kononowa, E. P., Preobraschenskaja, I. S., and Kukuew, L. A. (1955). Atlas of the Cytoarchitectonics of the Human Cerebral Cortex. Moscow: Medgiz.
Scheperjans, F., Grefkes, C., Palomero-Gallagher, N., Schleicher, A., and Zilles, K. (2005). Subdivisions of human parietal area 5 revealed by quantitative receptor autoradiography: a parietal region between motor, somatosensory, and cingulate cortical areas. Neuroimage 25, 975–992.
Sigalovsky, I. S., Fischl, B., and Melcher, J. R. (2006). Mapping an intrinsic MR property of gray matter in auditory cortex of living humans: a possible marker for primary cortex and hemispheric differences. Neuroimage 32, 1524–1537.
Talairach, J., and Tournoux, P. (1988). Co-Planar Stereotaxic Atlas of the Human Brain. 3-Dimensional Proportional System: An Approach to Cerebral Imaging. Stuttgart: Thieme.
Talairach, J., and Tournoux, P. (1993). Referentially Oriented Cerebral MRI Anatomy. Atlas of Stereotaxic Anatomical Correlations for Gray and White Matter. Stuttgart: Thieme.
Turner, R., Oros-Peusquens, A. M., Romanzetti, S., Zilles, K., and Shah, N. J. (2008). Optimised in vivo visualisation of cortical structures in the human brain at 3 T using IR-TSE. Magn. Reson. Imaging 26, 935–942.
Vogt, C., and Vogt, O. (1919). Allgemeinere Ergebnisse unserer Hirnforschung. J. Psychol. Neurol. 25, 279–461.
von Economo, K., and Koskinas, G. (1925). Die Cytoarchitektonik der Hirnrinde des erwachsenen Menschen. Wien: Springer.
Walters, N. B., Egan, G. F., Kril, J. J., Kean, M., Waley, P., Jenkinson, M., and Watson, J. D. G. (2003). In vivo identification of human cortical areas using high-resolution MRI: an approach to cerebral structure-function correlation. Proc. Natl. Acad. Sci. U.S.A. 100, 2981–2986.
Wandell, B. A., Dumoulin, S. O., and Brewer, A. A. (2007). Visual field maps in human cortex. Neuron 56, 366–383.
Zilles, K., and Amunts, K. (2009). Receptor mapping: architecture of the human cerebral cortex. Curr. Opin. Neurol. 22, 331–339.
Zilles, K., and Amunts, K. (2010). Centenary of Brodmann’s map – conception and fate. Nat. Rev. Neurosci. 11, 139–145.
Zilles, K., and Palomero-Gallagher, N. (2001). Cyto-, myelo-, and receptor architectonics of the human parietal cortex. Neuroimage 14, S8–S20.
Zilles, K., Palomero-Gallagher, N., Grefkes, C., Scheperjans, F., Boy, C., Amunts, K., and Schleicher, A. (2002). Architectonics of the human cerebral cortex and transmitter receptor fingerprints: reconciling functional neuroanatomy and neurochemistry. Eur. Neuropsychopharmacol. 12, 587–599.
Zilles, K., Palomero-Gallagher, N., and Schleicher, A. (2004). Transmitter receptors and functional anatomy of the cerebral cortex. J. Anat. 205, 417–432.
Zilles, K., Schlaug, G., Geyer, S., Luppino, G., Matelli, M., Qü, M., Schleicher, A., and Schormann, T. (1996). “Anatomy and transmitter receptors of the supplementary motor areas in the human and nonhuman primate brain,” in Supplementary Sensorimotor Area, ed. H. O. Lüders (Philadelphia: Lippincott-Raven), 29–43.
Keywords: brain map, cortical areas, cytoarchitecture, myeloarchitecture, quantitative T1 map
Citation: Geyer S, Weiss M, Reimann K, Lohmann G and Turner R (2011) Microstructural parcellation of the human cerebral cortex – from Brodmann’s post-mortem map to in vivo mapping with high-field magnetic resonance imaging. Front. Hum. Neurosci. 5:19. doi: 10.3389/fnhum.2011.00019
Received: 30 June 2010;
Accepted: 07 February 2011;
Published online: 18 February 2011.
Edited by:
Patrik Vuilleumier, University Medical Center and University Hospital Geneva, SwitzerlandReviewed by:
Katrin Amunts, Aachen University, GermanyCopyright: © 2011 Geyer, Weiss, Reimann, Lohmann and Turner. This is an open-access article subject to an exclusive license agreement between the authors and Frontiers Media SA, which permits unrestricted use, distribution, and reproduction in any medium, provided the original authors and source are credited.
*Correspondence: Stefan Geyer, Department of Neurophysics, Max Planck Institute for Human Cognitive and Brain Sciences, Stephanstrasse 1a, 04103 Leipzig, Germany. e-mail: sgeyer@cbs.mpg.de