Early (N170/M170) face-sensitivity despite right lateral occipital brain damage in acquired prosopagnosia
- 1 Institute of Psychology, Institute of Neuroscience, Center for Cognitive and Systems Neuroscience, Université Catholique de Louvain, Louvain-la-Neuve, Belgium
- 2 Medical Research Council Cognition and Brain Sciences Unit, Cambridge, England
Compared to objects, pictures of faces elicit a larger early electromagnetic response at occipito-temporal sites on the human scalp, with an onset of 130 ms and a peak at about 170 ms. This N170 face effect is larger in the right than the left hemisphere and has been associated with the early categorization of the stimulus as a face. Here we tested whether this effect can be observed in the absence of some of the visual areas showing a preferential response to faces as typically identified in neuroimaging. Event-related potentials were recorded in response to faces, cars, and their phase-scrambled versions in a well-known brain-damaged case of prosopagnosia (PS). Despite the patient’s right inferior occipital gyrus lesion encompassing the most posterior cortical area showing preferential response to faces (“occipital face area”), we identified an early face-sensitive component over the right occipito-temporal hemisphere of the patient that was identified as the N170. A second experiment supported this conclusion, showing the typical N170 increase of latency and amplitude in response to inverted faces. In contrast, there was no N170 in the left hemisphere, where PS has a lesion to the middle fusiform gyrus and shows no evidence of face-preferential response in neuroimaging (no left “fusiform face area”). These results were replicated by a magnetoencephalographic investigation of the patient, disclosing a M170 component only in the right hemisphere. These observations indicate that face-preferential activation in the inferior occipital cortex is not necessary to elicit early visual responses associated with face perception (N170/M170) on the human scalp. These results further suggest that when the right inferior occipital cortex is damaged, the integrity of the middle fusiform gyrus and/or the superior temporal sulcus – two areas showing face-preferential responses in the patient’s right hemisphere – might be necessary to generate the N170 effect.
Introduction
Faces are the most frequent and important stimuli we encounter in our social life and the question of how they are perceived has received considerable interest in cognitive neuroscience. Although the extensive research during the last decades has advanced our understanding of the neural mechanisms underlying face perception, still little is known about the functional role of the brain areas involved and the temporal dynamics of the process. Studies of patients with acquired prosopagnosia, who are unable to recognize faces after brain injury (Bodamer, 1947), are useful in this endeavor. Together with electrophysiological and neuroimaging research in animals and healthy humans, such lesion studies have helped to demonstrate the importance of a wide set of areas responding specifically or preferentially to faces in the occipito-temporal cortex, with a dominance of the right hemisphere (e.g., Damasio et al., 1982; Sergent and Signoret, 1992; Sergent et al., 1992; Allison et al., 1994, 1999; Puce et al., 1995; Kanwisher et al., 1997; Gauthier et al., 2000; Haxby et al., 2000; Barton et al., 2002; Henson et al., 2003; Rossion et al., 2003a; Bouvier and Engel, 2006; Ishai, 2008; Tsao et al., 2008).
The combination of neuroimaging with the study of brain-damaged patients provides important further constraints on the functional organization of this set of areas (Marotta et al., 2001; Rossion, 2008). For instance, in the normal brain, preferential activation to faces is generally observed concomitantly at least in the inferior occipital gyrus (so-called “occipital face area,” OFA, see Pitcher et al., 2011 for a review), the middle fusiform gyrus (the so-called “fusiform face area,” FFA; Kanwisher et al., 1997; see Kanwisher and Yovel, 2006 for a review), and the posterior section of the superior temporal sulcus (pSTS; e.g., Puce et al., 1995; see Haxby et al., 2000; Gobbini and Haxby, 2007 for reviews). Interestingly, despite a right hemisphere lesion to the inferior occipital gyrus leading to prosopagnosia, and thus no evidence of an OFA activation, one can still observe right FFA and pSTS activation (Rossion et al., 2003a; Sorger et al., 2007: patient PS; see also Steeves et al., 2006 for evidence of bilateral FFA activation in patient DF with bilateral inferior occipital lesions encompassing the OFA). This latter observation challenges a strictly hierarchical view of the neural basis of face perception (e.g., Haxby et al., 2000; Fairhall and Ishai, 2007; Pitcher et al., 2007; Ishai, 2008) rather suggesting that in the intact human brain there may be direct pathways from early visual areas to the middle fusiform gyrus and pSTS, bypassing a face-preferential activation in the inferior occipital cortex (i.e., in particular to FFA bypassing OFA, Rossion et al., 2003a; Rossion, 2008; Atkinson and Adolphs, 2011). One purpose of a hypothetical direct ventral pathway to the middle fusiform gyrus might be to categorize the visual stimulus as a face based on an initial, coarse, holistic/configural representation (Rossion, 2008; Goffaux et al., 2011; Rossion et al., 2011).
According to this view, preferential activation to faces in the human brain should have an early onset time, irrespective of the integrity of the inferior occipital cortex (i.e., any OFA activation). To corroborate this hypothesis, knowledge about the activation time course of face-preferential areas in normal observers and brain-damaged patients could be useful. Unfortunately, the time course of activation cannot be directly measured in these areas in the normal human brain. Currently, recordings of electrical (electroencephalography, EEG) and magnetic fields (magnetoencephalography, MEG) on the human scalp are the only non-invasive methods that provide information at sufficient temporal resolution (i.e., milliseconds), albeit with a poor spatial resolution. These studies have identified an occipito-temporal event-related potential (ERP) of negative polarity on the human scalp, the N170, which appears between 130 and 170 ms after stimulus onset and increases its amplitude when faces are presented compared to other object categories (e.g., Bötzel et al., 1995; Bentin et al., 1996; for earlier studies on the positive counterpart of N170, see Jeffreys, 1989; for a review of N170 face-sensitivity, see Rossion and Jacques, 2008). Although MEG is sensitive to only a subset of the sources generating the EEG scalp components (i.e., tangential sources), MEG studies have also reported an increased M170 in response to faces (e.g., Linkenkaer-Hansen et al., 1998; Halgren et al., 2000). This increased amplitude has been named the N170/M170 face effect and represents a temporal marker of the first and most consistent electrophysiological response to faces in the human brain (see Rossion and Jacques, 2008), a response that cannot be accounted for by low-level visual features (Rossion and Caharel, 2011). Even though there is no agreement about the exact neural sources of this component, the posterior and middle sections of the fusiform gyrus have been identified as primary contributors of the scalp component in many source localization studies (e.g., Bötzel et al., 1995; Linkenkaer-Hansen et al., 1998; Watanabe et al., 1999, 2003; Deffke et al., 2007; Henson et al., 2009) possibly with an additional contribution of the pSTS (Itier and Taylor, 2004).
Although confronting the anatomical, neuropsychological, and electrophysiological profiles of patients with acquired prosopagnosia can help to determine the neurofunctional dynamics of face perception, such studies are scarce (for ERP studies on patients with congenital/developmental prosopagnosia, see, e.g., Bentin et al., 1999, 2007; Minnebusch et al., 2007) and their implications generally remain at the functional level. For instance, Renault et al. (1989) showed evidence for covert (i.e., non-conscious) recognition of faces in a case of prosopagnosia using the P300 amplitude and latency difference for familiar and unfamiliar face processing (see also Bobes et al., 2003 for similar evidence in another case using a face identity matching paradigm). Eimer and McCarthy (1999) reported an absence of N170 component in their case of acquired prosopagnosia, providing ERP evidence that the patient’s encoding of face representations was impaired. However, most recently, Dalrymple et al. (2011) reported the ERP data of five patients with acquired prosopagnosia whose lesions and face-sensitive cortical areas had been well defined. Two patients with lesions sparing the cortical territory of the posterior face-sensitive areas (FFA, OFA, pSTS) presented with normal N170 face effect in the right hemisphere. In contrast, two patients with lesions encompassing both the right OFA and FFA did not present with a N170 face effect. Interestingly, a fifth patient who had brain damage encompassing the right FFA but not the OFA presented with a N170 face effect. The authors concluded that at least two of the three major functional areas must be functionally intact to generate the N170 face effect. However, to be correct, this claim still has to be substantiated by the demonstration of a normal N170 face effect when damage concerns the right inferior occipital gyrus, with no OFA activation, while the two main anterior components of the right hemisphere cortical face network (FFA, pSTS) are spared. More generally, to our knowledge, there is no report of a right N170 face effect in a patient with acquired prosopagnosia who has a right hemisphere lesion limited to the inferior occipital gyrus while sparing both the middle fusiform gyrus and pSTS. That is, one cannot exclude from previous studies that the integrity of the right inferior occipital gyrus alone, encompassing the right OFA, is necessary for observing early face-sensitive responses on the scalp.
This issue was addressed in the present study, in which electromagnetic recordings on the scalp of the brain-damaged patient PS mentioned above are reported for the first time when the patient is stimulated with faces, objects, and visual stimuli controlling for low-level visual features. According to the Section “Introduction” above, this endeavor is important for at least two reasons. First, to test the hypothesis that a lesion of the right inferior occipital cortex, which removes any face-preferential response in this region (i.e., no right OFA, “rOFA,” Rossion et al., 2003a), does not prevent the observation of early face-preferential responses (N170/M170) over the right hemisphere. Such an observation would provide indirect evidence that face-sensitive activation as recorded in fMRI in high-level areas (FFA and pSTS) may have an early onset time of activation despite no relay in the inferior occipital gyrus, and therefore may arise through direct feedforward inputs from early visual areas. Alternatively, if an early face-preferential potential cannot be observed over PS’ right hemisphere, it might be argued that FFA and pSTS activation to faces in the patient’s brain as described in previous studies is rather driven by top-down processes, as could be alternatively hypothesized (e.g., Kleinschmidt and Cohen, 2006).
Second, patient PS has a lesion in the left hemisphere showing the reverse pattern to the right hemisphere damage: it encompasses the whole left middle fusiform gyrus, without evidence of left FFA activation, while the left inferior occipital cortex remains structurally intact (Figure 1). Hence, comparing the N170 recorded on the right vs. the left hemisphere in this patient might be particularly informative as to the contribution of the FFA to the N170 recorded on the scalp: the presence of an N170 on the right but not on the left hemisphere would strongly suggest that the FFA plays a major role in generating the N170 face effect.
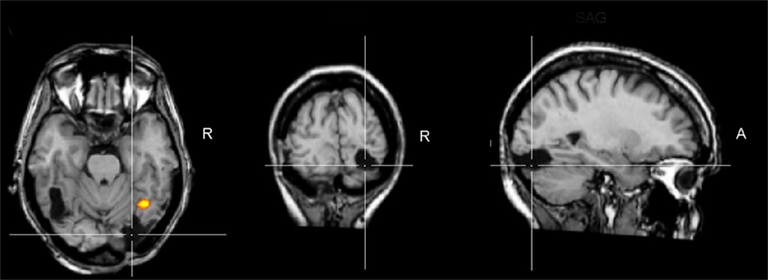
Figure 1. Brain damage profile of the acquired prosopagnosia patient PS. This patient has damage to the left middle fusiform gyrus and a small lesion to the right middle temporal gyrus, but her main lesion, thought to be instrumental in causing her prosopagnosia, concerns the right inferior occipital cortex (line crossing). This lesion does not prevent a preferential activation for faces in the right middle fusiform gyrus (FFA; here as the result of a combined analysis of six functional localizer runs, contrasting faces and object pictures in a face localizer contrast, see Sorger et al., 2007 for details). Although this region responds preferentially to faces, it does not show the normal release to adaptation to different facial identities, in line with the difficulties of the patient in individualizing faces. TRA, transverse plane; COR, coronal plane; SAG, sagittal plane; R, right.
In addition, with respect to the previous ERP studies of cases of acquired prosopagnosia cited above, the present study presents with several particular interests. First, it focuses on a patient whose impairment in face perception/recognition is well characterized and restricted to faces (e.g., Busigny et al., 2010), who has been studied extensively in fMRI (e.g., Rossion et al., 2003a; Sorger et al., 2007) and for whom a demonstration of early face-sensitive responses would have theoretical implications for the neural dynamics of face perception, as explained above. Second, the single-case tested here was stimulated with visual stimuli matched for low-level properties with faces and objects as in a recent study (Rossion and Caharel, 2011). Third, multiple EEG recordings (eight, in four sessions) were made to ensure replicability of the findings. Fourth, PS was also tested in a MEG experiment for converging evidence since MEG is less affected by signal distortions caused by the skull and scalp than is EEG, an important consideration when studying patients with brain damage. Finally, since one of the most characteristic signatures of the N170 as recorded in the normal adult brain is its increased latency and amplitude to inverted faces (e.g., Linkenkaer-Hansen et al., 1998; Rossion et al., 1999; Itier et al., 2007), a second experiment was performed on PS in which upright and inverted faces were presented, in order to help identifying the component in the patient’s brain and characterize its response properties.
Materials and Methods
Participants
Patient PS
The patient PS, whose case has been first reported by Rossion et al. (2003a), has been described in detail in numerous previous studies. Briefly, PS was born in 1950 and sustained a closed head injury in 1992 that left her with extensive lesions of the left mid-ventral (mainly fusiform gyrus) and the right inferior occipital cortex (Figure 1). Her visual field is almost full (small left paracentral scotoma, see Sorger et al., 2007) and her visual acuity is below normal but good (0.8 for both eyes as tested in August 2003, see Sorger et al., 2007 for all information about the patient’s lesions). PS’ only continuing complain is a profound difficulty in recognizing familiar faces, including those of her family when they are presented out of context. This impairment in face recognition and individual face discrimination has been formally established in several behavioral studies with classical neuropsychological tests as well as individual face matching and recognition computer tasks (see Rossion et al., 2003a; Schiltz and Rossion, 2006; Busigny and Rossion, 2010). Importantly, PS does not present any difficulty in recognizing and discriminating non-face objects, even when fine-grained discrimination is required, and when considering both accuracy rates and response times (Rossion et al., 2003a; Schiltz and Rossion, 2006; Busigny and Rossion, 2010).
Normal controls
In EEG Experiment 1, faces vs. objects, the sample of control participants consisted of 11 paid female volunteers (mean age = 23 ± 2.45 years), with the data of four of them having been included in a larger sample of males and females subjects in a recent study (Rossion and Caharel, 2011). In Experiment 2, inverted faces, eight paid female volunteers were tested (mean age = 21.43 ± 2.57 years). Four age-matched female controls (mean age = 59.33 ± 2.52 years) were also tested in each experiment to account for potential age-related effects on early visual ERPs that were of interest in the present study. All participants but one were right handed and all had normal or corrected-to-normal vision. They gave their informed consent after detailed information about the experiment was provided. The study was approved by the ethical committee of the Université catholique de Louvain and was in agreement with the Declaration of Helsinki.
Stimuli
Experiment 1: Faces vs. objects and scrambled stimuli
Two sets of 43 colored photographs of full front faces and cars were used (Figure 2). Two additional sets of stimuli were built by scrambling the faces and the cars using a Fourier phase randomization procedure (Nasanen, 1999; Figure 2). This procedure leads to different scrambled stimuli than used in several previous ERP studies, in which face components are swapped (e.g., George et al., 1996) or pieces of the stimuli are exchanged so that the faces and objects are not recognizable (e.g., Allison et al., 1994; Bentin et al., 1996). Here, as in a few previous studies (e.g., Watanabe et al., 2003; Rousselet et al., 2005), the phase spectrum of the images with random values, keeping their amplitude spectrum unaltered. It yields images that preserve the global low-level properties of the originals (i.e., luminance, global contrast, color, spatial frequency) while destroying their shape (for all details about the stimuli, see Rossion and Caharel, 2011). This particular set of stimuli (faces, cars, and their scrambled counterparts) have been used in recent studies in order to (1) localize the human brain areas responding preferentially or selectively to faces in fMRI (e.g., Rossion et al., 2011) and (2) disentangle low-level from high-level visual factors as contributing to differences between faces and other stimuli on early visual ERPs (e.g., Rossion and Caharel, 2011). All stimuli subtended ∼3.72° × 4.24° of visual angle and they were displayed using E-prime 1.1, on a light gray background.
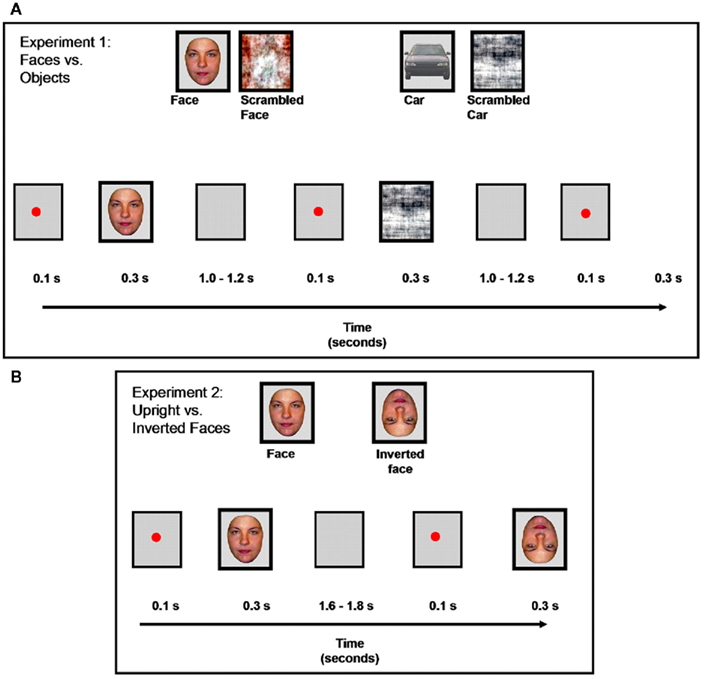
Figure 2. Examples of stimuli and experimental design for the two experiments. (A): Experiment 1, faces vs. objects. (B): Experiment 2, upright vs. inverted faces.
Experiment 2: face Inversion
Photographs of 30 front view faces (15 females) without glasses, facial hair, or make-up, and with neutral expression were used (Figure 2). Inverted (flipped) versions of the 30 faces were also presented during the experiment (Figure 2). These cropped faces were equated for mean pixel luminance. They were shown in full color and subtended approximately 2.95° × 4.02° of visual angle.
Procedure
Al procedures for Experiment #1 have been described in a recent paper (Rossion and Caharel, 2011) and will only be briefly summarized here. Two times 43 instances of each of the four kinds of stimuli (86 × 4 trials in total) were presented in random order (Figure 2A) and participants had to judge whether the stimulus was an object (face or car) or a “texture” (scrambled versions) To ensure that PS results were replicable and also to increase signal-to-noise ratio, she performed the experiment eight times in total (two recording sessions in December 2008; December 2009; March 2010; and June 2010) leading to a total of 688 trials for each condition for her. Grand averages of all sessions are reported, and the data of each individual session are also displayed.
The timeline of events in Experiment # 2 is shown in Figure 2B, in which upright and inverted faces (random order) were presented and participants had to press one key if the stimulus was upright and another key if the stimulus was inverted. They performed 90 trials per condition in one session (30 stimuli in each set repeated three times each). Again, to ensure that her results were replicable and to increase signal-to-noise ratio, PS performed the experiment eight times in total, always following Experiment #1 (in December 2008, December 2009, March and June 2010) leading to a total of 720 trials for each condition.
The MEG data were acquired during a 2-day visit of the patient to the MRC Cognition and Brain Sciences unit in Cambridge, UK, from 29th to 30th November, 2007. Three runs of Experiment 1 were applied consecutively on Day 1, and one run of Experiment 2 on Day 2.
EEG Recording and Data Analysis
Scalp EEG was recorded from 128 Ag/AgCl electrodes mounted in an electrode cap (Wavegard1, ANT Inc.; Figure A1 in Appendix displays the electrodes layout) with a left mastoid reference. Electrodes were positioned according to the standard 10–20 system with additional intermediate positions. Two pairs of bipolar electrodes were used to record vertical and horizontal eye movements. Electrode impedances were maintained below 10 kΩ during recording. EEG analog signal was digitized at a 1000-Hz sample rate and a digital analog-aliasing filter of 0.27* sampling rate was applied at recording (at 1000 Hz sampling rate the usable bandwidth is 0 to approximately 270 Hz).
Electroencephalography data were analyzed using ASA 4.6 (ANT, Inc.), Brain Vision Analyzer (2.0), and custom-made routines in Matlab 7.0. EEG was filtered with a band-pass filter of 0.1–30 Hz. Time points in the filtered data at which the absolute amplitude of the EEG exceeded ±120 μV were marked as EEG artifact or blink artifacts. Trials containing EEG artifacts were rejected from further analyses, as were trials containing an incorrect behavioral response. Data was then averaged in epochs from 200 ms pre-stimulus onset to 800 ms post-stimulus onset. Averages were baseline corrected using the 200-ms pre-stimulus epoch and re-referenced to a common average reference.
MEG Recording and Analyses
Magnetoencephalography data were acquired using a whole-head, 306-sensors (102 magnetometers and 102 pairs of orthogonally oriented planar gradiometers) VectorView system (Elekta Neuromag Oy). The MEG unit was housed in a light magnetically shielded room (MSR). Signals were sampled at 1 kHz within on-line band-pass filtering 0.03–330 Hz. The position of PS’ head was monitored continuously by four head-position indicators (HPI) coils. To measure eye movements and blinks, electrooculogram (EOG) was recorded from two pairs of bipolar electrodes placed above and below one eye (VEOG) and on the outer canthus of each eye (HEOG). Experiment 1 was run three times in a single session, though HPI problems toward the end of the second run resulted in loss of ∼20% of those trials. Experiment 2 was run once during a separate session on the following day.
Initial preprocessing of the MEG data used signal space separation (SSS; Taulu and Simola, 2006) as implemented in the MaxFilter 2.0 software (Elekta Neuromag, Helsinki). This approach re-expresses the data in terms of linear combinations of spherical-harmonic basis functions describing two separable subspaces that reflect sources originating inside and outside the sensor array. The origin was set to the center of the head, defined as the best-fitting sphere to the digitized scalp points (excluding points on the face and nose). This SSS representation was then used in three steps. First, “bad” channels were detected using the initial 20 s of data from each session, which were uncontaminated by HPI signal (no bad channels were detected). In the second step, head-movement correction was applied every 200 ms (estimated total translation within each session was less than 3 mm), and noise from sources beyond the outer sphere, or from within the space between the inner and outer spheres (that would produce components in inner and outer spheres that are temporally correlated) was removed using the temporal extension of SSS (Taulu and Simola, 2006). In a third step, the movement-corrected head position in each session was virtually transformed to a common location across sessions relative to the default device space. This was achieved by moving the origin of the sphere fit to PS’s headpoints to a point (0, 13, −6) in device coordinates (appropriate for the typical head-size according to the Elekta Neuromag Users Manual), and rotated such that the head coordinate system, defined by the pre-auricular and nasion fiducial markers, was aligned to the device coordinate system. Data were downsampled to 250 Hz (with anti-aliasing filter).
The SSS-processed continuous data were then analyzed with SPM52 and custom-made routines in Matlab 7.03, emulating the same preprocessing steps as for PS’s EEG data, i.e., filtered within a band of 0.1–30 Hz, epoched from −200 to +800 ms (baseline corrected from −200 to 0 ms), and then epochs containing EOG deflections above ±120 μV rejected prior to averaging over epochs for each condition to create event-related fields (ERFs) for each condition (resulting in at least 146 artifact-free trials for each of the four conditions in Experiment 1, and at least 83 trials for each of the two conditions in Experiment 2).
Statistical Analysis of ERP and ERF Data
In normal participants, two clear visual ERP components elicited by the different sets of stimuli were analyzed: the P1 (maximal at approximately 100 ms), and the N170 (maximal at approximately 150 ms). Amplitude values of these components were measured at the different pairs of occipito-temporal electrodes in the left and right hemisphere where they were the most prominent (P8/7, PO8/O7, PPO10h/9h, and PO10/9). Amplitudes were quantified for each condition as the mean voltage measured within 30 ms windows centered on the grand average peak latencies of the components’ maximum. Peak latency of both components were extracted automatically at the maximum amplitude between 70 and 140 ms for the P1, and at the minimum value between 120 and 190 ms for the N170 at the pairs of occipito-temporal electrodes where these components were the largest. A similar approach was taken to the ERFs recorded from the MEG magnetometers [the root-mean-square (RMS) of the planar gradiometer data showed similar results, as shown in figures in Appendix].
The amplitude and latency values of each component were then submitted to separate repeated-measures analysis of variance (ANOVA). Three within-subject factors were used: Shape (non-scrambled, scrambled), Category (faces, cars), and Hemisphere (right and left). Post hoc comparisons were performed using post hoc t-tests (p < 0.05). All effects with two or more degrees of freedom were adjusted for violations of sphericity according to the Greenhouse–Geisser correction.
For the ERP data, this analysis was performed for the younger control group and for PS, although the electrodes selected were slightly different for PS because the topography was not identical to control participants (see Results). For PS we used the eight repetitions of the experiment. The four age-matched controls performed only one repetition of the experiment and were not analyzed as a group, but their individual data were compared to PS. The comparison between PS (once again using all eight experiment repetitions averaged together) and the control group was performed using the Crawford and Howell’s method for single cases (Crawford and Howell, 1998).
For MEG data, the U-Mann–Whitney was chosen whenever the analysis was performed across trials because the distributions of latency across trials, especially when only one subject is considered rather than across subjects on trial-averaged EEG data, were not Gaussian, most likely because defining latency in noisy individual trials is error-prone.
Results
Experiment 1: Faces vs. Objects
Behavioral data
Mean accuracy and response time to correct responses for each experimental group are reported in Table A1 in Appendix. Performance was almost flawless in this easy task, with PS and age-matched controls scoring above 99% in all conditions. Young controls performed between 95.5 and 97.8%. PS’ average RTs in the first session did not differ from those of controls [Faces: t(14) = 0.14, p > 0.05; Cars: t(14) = 0.79, p > 0.05; Scrambled Faces: t(14) = 0.48, p > 0.05; Scrambled Cars: t(14) = 0.57, p > 0.05].
Electrophysiological data
P1 component.
Normal controls. The first electrophysiological response evoked by the presentation of all four stimuli in young controls, the P1, peaked at about 100 ms (Table 1; Figure 3A) reaching its highest amplitude at P8/P7 and lower channels for all conditions. Similar pattern was observed in the group of age-matched controls (Figure 3B).
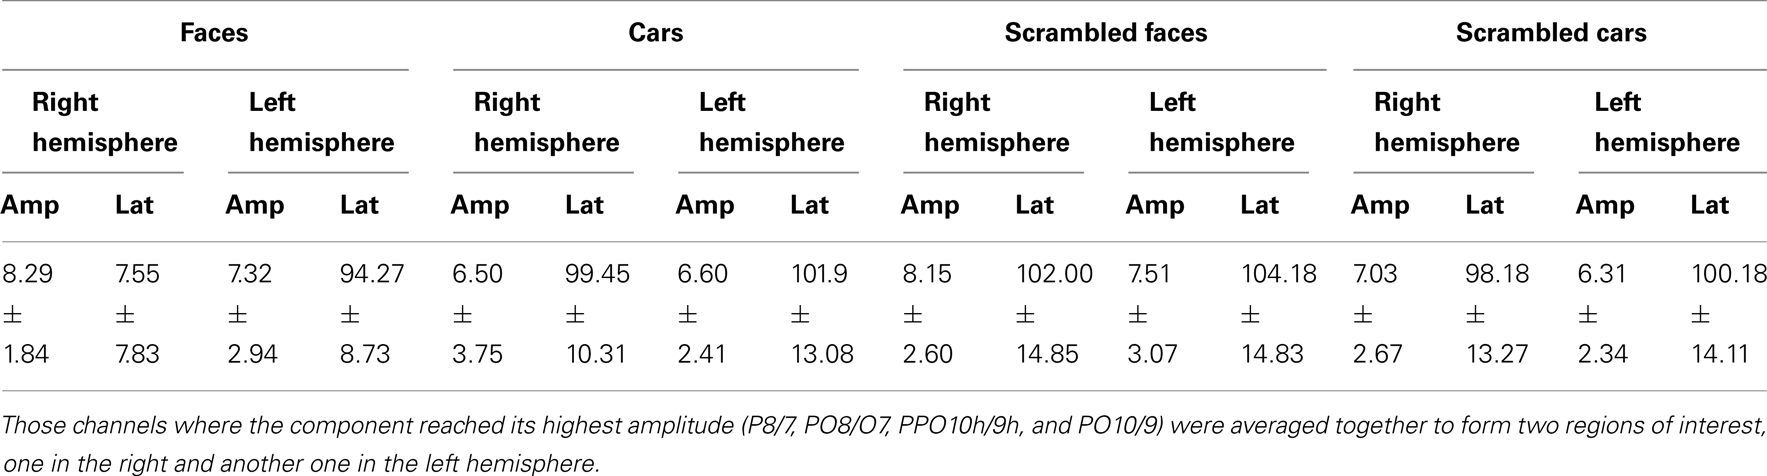
Table 1. Mean amplitude and latency values of P1 component for younger participants.
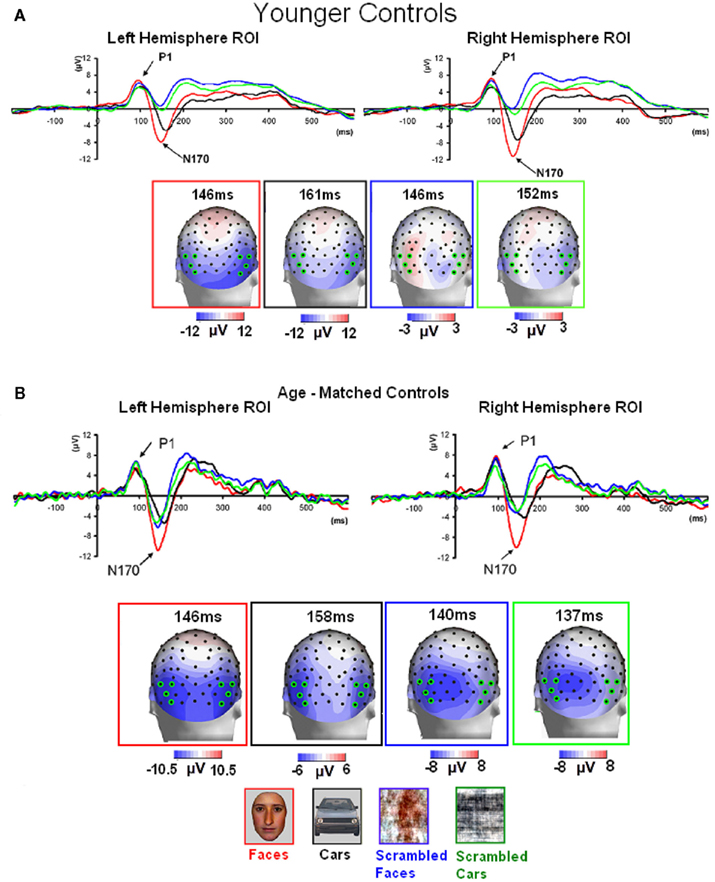
Figure 3. Visual ERPs elicited by all stimulus types in the group of younger controls (A) and age-matched controls (B) highlighting the sensitivity to faces of the P1 and N170 (the ROIs are based on four channels indicated on the topographic maps). Note that the P1 was larger in amplitude both to faces and phase-scrambled faces than to cars and phase-scrambled cars. In contrast, the N170 was small for meaningless (phase-scrambled) stimuli, and showed a larger response to faces than cars.
In the group of younger controls, there was a main effect of Category on P1 amplitude [F(1, 10) = 8.31, p < 0.05], reflecting the larger response to faces and scrambled faces than cars and scrambled cars (Figure 3A; see also Rossion and Caharel, 2011). There was no effect of Shape or interaction between the two factors (ps > 0.05). All other effects were non-significant (all ps > 0.05).
Regarding P1 latency, there was a significant interaction between Category and Shape [F(1, 10) = 7.83, p < 0.05] due to slower responses to scrambled faces than faces [t(10) = 2.28, p < 0.05] and scrambled cars [t(10) = 2.50, p < 0.05].
Prosopagnosic patient. The prosopagnosic patient also exhibited a lateral positive electrophysiological response peaking at about 100 ms in all experimental conditions, identified as the P1. It reached its largest amplitude between 100 and 120 ms, about 10 ms earlier in the left than in the right hemisphere. In all cases, it was delayed and slightly larger for scrambled stimuli (Table 2; Figures 4 and 5).
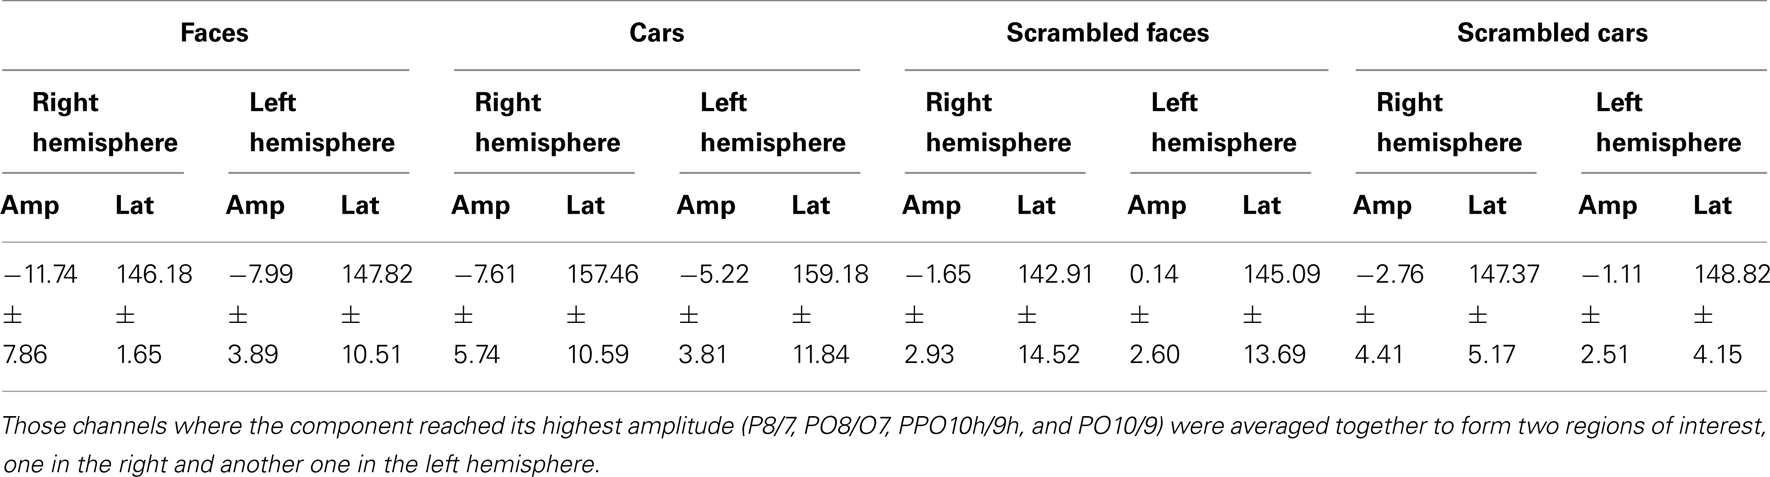
Table 2. Mean amplitude and latency values of N170 component for younger participants.
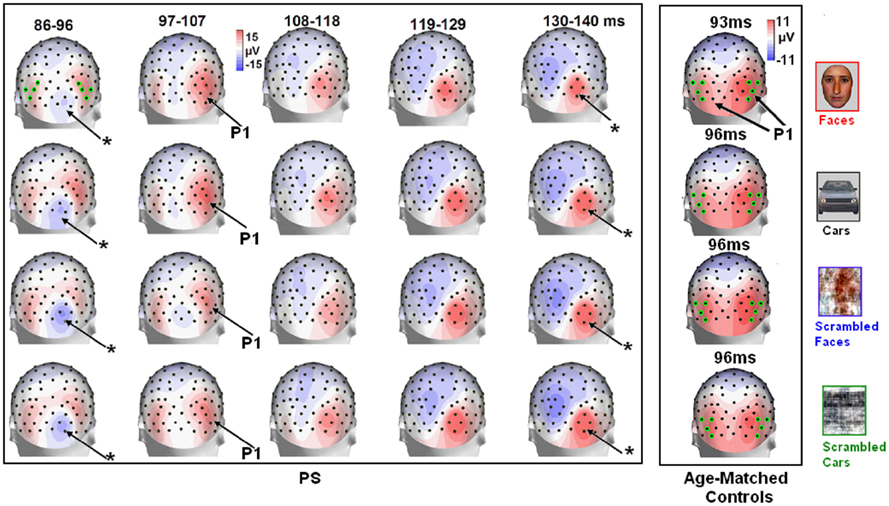
Figure 4. Evolution of electrophysiological responses to visual stimulation at the back of the head for patient PS. Following visual stimulation, large evoked potentials were recorded on the right posterior medial sites, over PS’ main lesion, with an alternation of negative and positive current flows out of the brain (negative at 75–85 ms, positive at 130–140 ms). These unusual components (indicated in the figure with an asterisk) were most prominent before and after the lateral P1 component. The P1 topography (at the latency at which the component reached its highest amplitude) for the age –matched controls is also shown for comparison.
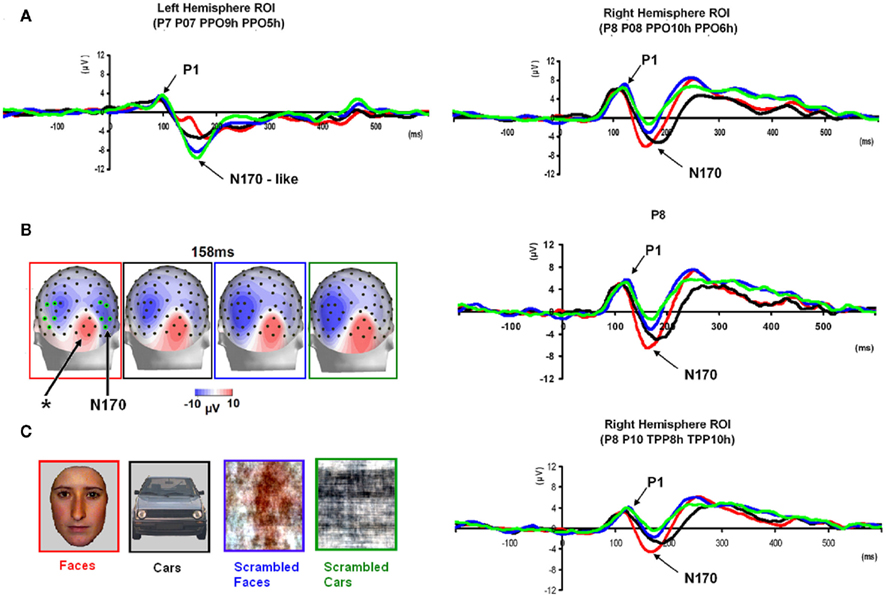
Figure 5. Waveforms recorded over PS’ scalp following visual stimulation in the four conditions. The waveforms correspond to an average of eight recording sessions (averaged of each session displayed in Figure 6) in which 86 trials were presented for each condition. The first response was identified as a P1, which did not differ much across conditions, but was slightly delayed and larger for scrambled stimuli. The second visual component showed a typical N170 response profile (see the topographic maps displayed at the latency at which the N170 amplitude was highest) only in the right hemisphere (larger response to meaningful stimuli, larger and earlier response to faces than cars). Its topography was slightly different than in normal controls due to the presence of a large unusual visual component recorded on the right posterior medial channels, over the main right hemisphere lesion (indicated in the figure with an asterisk). The “N170-like” component, recorded on electrode sites over the left lateral occipital channels, did not show any of the characteristics associated with an N170, presenting the largest response to phase-scrambled stimuli and the lowest and most delayed response to faces. Different ROIs are presented because the larger response to faces than the other conditions was most pronounced on more anterior lateral channels (B,C) than on channels where all conditions elicited the largest N170 (A).
In between the lateral P1 component (86–96 ms), there was an unusual (i.e., absent in normal controls) negative component recorded on the electrodes above the right hemisphere lesion (Figure 4). This response then changed polarity after the P1 peak, becoming positive at about 120 ms and until the time window of the N170 (Figure 4). This unusual time-locked visual component observed over the lesion site complicates the identification of the “real” P1 for the patient PS. Nevertheless, the P1 could be measured adequately due to its lateral distribution and its peak falling in between the maxima of the unusual component.
A statistical analysis was carried out using the eight repetitions performed by PS. To this end, latency and amplitude values were averaged over all four electrodes located away from the lesion where the P1 component was maximal before 120 ms (PO8/09, PPO10h/9h, PO6/5, and P8/7). For the P1 amplitude, there were main effects of Shape [F(1, 7) = 8.61, p < 0.05; scrambled > intact] and Hemisphere [F(1, 7) = 19.57, p < 0.001; right > left]. All other effects were non-significant: ps > 0.05.
Regarding P1 latency for PS, there was a main effect of Shape [F(1, 7) = 52.19, p < 0.001] and Category [F(1, 7) = 9.80, p < 0.001], which was qualified by an interaction between Shape and Category [F(1, 7) = 5.98, p < 0.05]. This interaction was due to an earlier P1 latency for faces compared to scrambled faces [t(7) = 7.53, p < 0.001], while the latency delay for scrambled cars as compared to cars was significant [t(7) = 4.85, p = 0.002] but smaller (Figure 5). There was also a main effect of Hemisphere [F(1, 7) = 56.92, p < 0.001] due to higher latency values in the right than in the left hemisphere.
PS vs. controls
An index of P1 face-sensitivity in amplitude, which is due to low-level visual cues, was computed for each participant (11 younger controls, 4 age-matched controls, and PS) by averaging EEG epochs to faces and scrambled faces to compare to cars and scrambled cars averaged (right hemisphere only). The average and SD of the difference was for younger controls: 1.00 ± 1.51, age-matched controls: 0.48 ± 1.00 and PS: 0.21 ± 1.24). Therefore, while PS’ positive difference on the P1 (face-sensitivity) is of small amplitude, it was not out of range of the controls, and in fact, two age-matched controls and three younger controls did not present with any positive difference on the P1.
In summary, PS’ first component in response to visual stimuli could be identified as the P1, with a lateral occipital topography. It was prominent on the same electrodes as normal participants, even though its late response, particularly on the more medial channels, appeared to be contaminated by the presence of unusual components over the lesion sites. There was no evidence of a sensitivity to low-level visual cues of faces for PS’ P1 (i.e., larger amplitude to faces and scrambled faces than cars and scrambled cars), contrary to young controls taken as a group (Figure 3). However, such effects were not found in all individual controls, so that it is impossible to conclude for any abnormality in PS data at this level.
N170 component.
Younger controls: group analysis. The N170 peaked at about 150 ms. It was most prominent over lateral occipital electrodes (P8/7, PO8/7, PO10/9, PPO10h/9), especially in the right hemisphere, and it reached its highest amplitude at P8/P7 (Figure 3). It was larger for the intact versions of the stimuli and slightly delayed for cars (Table 3; Figure 3). There was a significant main effect of Shape [F(1, 10) = 51.72, p < 0.001], of Category [F(1, 10) = 8.77, p < 0.05], and of Hemisphere [F(1, 10) = 5.13, p < 0.05; right > left]. The main effects of Shape and Category were qualified by a significant interaction between the two factors [F(1, 10) = 10.71, p < 0.05]. Post hoc comparison showed that the N170 to faces was significantly larger than the N170 to cars [t(10) = 3.95, p < 0.05] while there were no differences between scrambled faces and scrambled cars [t(10) = 1.65, p > 0.05].
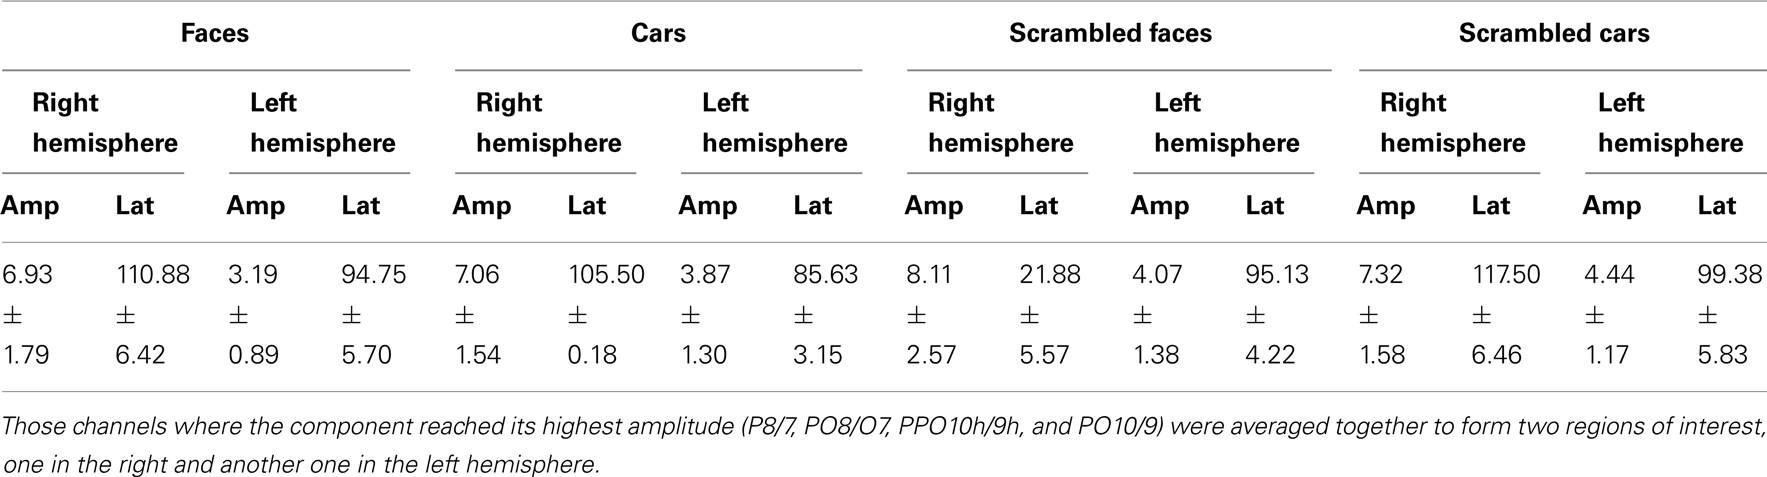
Table 3. Mean amplitude and latency values of P1 component for PS.
Regarding the N170 latency, statistical analysis showed a main effect of Shape [F(1, 10) = 9.57, p < 0.05] and Category [F(1, 10) = 59.171, p < 0.001]. There was a significant interaction between the two factors [F(1, 10) = 7.03, p < 0.05] since the N170 was delayed for cars compared to faces [t(10) = 5.19, p < 0.001] and to a lesser extent for scrambled cars compared to scrambled faces [t(10) = 4.18, p < 0.001; Figure 3].
Prosopagnosia
Following the P1, there was a clear bilateral negativity that resembled the N170 component exhibited by normal participants (Table 4; Figure 5). In the right hemisphere, it started at about 145 ms and reached its highest amplitude at about 160 ms on lateral occipital electrodes, especially at P6, P8, PO8, PPO6h, and PPO10h. It was maximal for faces but it was also found for the other conditions albeit with a reduced amplitude, and with a latency delay for pictures of cars (Figure 5). It coexisted with the above-described positive unusual deflection that peaked in the right medial occipital electrodes around 140 ms and was present for all conditions (Figure 5).
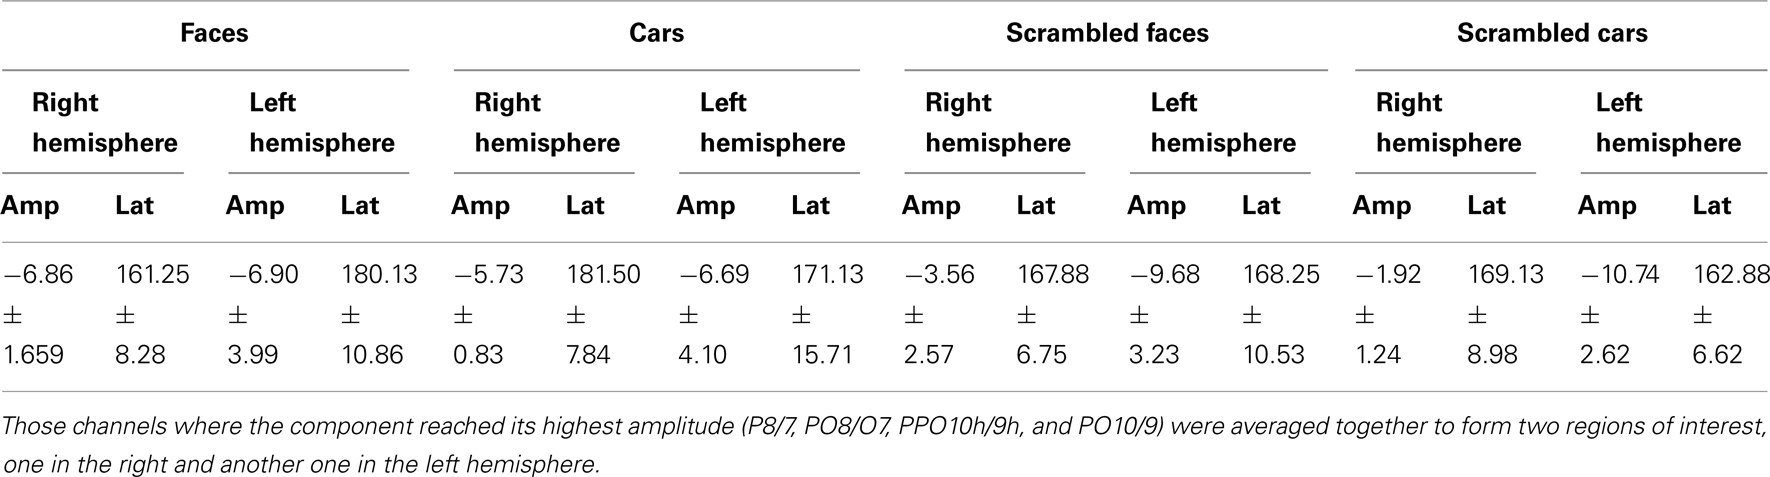
Table 4. Mean amplitude and latency values of N170 component for PS.
In the left hemisphere, there was also a large negative deflection that was maximal at lateral occipital electrodes but it differed in several aspects from the negativity observed in the right hemisphere. Specifically, it appeared around 15 ms earlier than in the right hemisphere and coexisted with the unusual positive deflection observed in the lowest, right medial occipital electrodes. Additionally, it reached its highest amplitude also later, at around 170 ms (Figure 5) and was located on slightly more parieto-occipital channels. Most importantly, it was much smaller for faces than for the remaining conditions (Figure 5).
These atypical characteristics clearly indicate that this left hemisphere response did not correspond to the normal N170 component as observed both in healthy individuals and on right lateral occipital electrodes for PS. Consequently, analyses were performed for the right hemisphere only, using the averaged latency and amplitude values over the five electrodes where the component was maximal, and only the factors of Shape (non-scrambled, scrambled) and Category (faces, cars) were used.
In the right hemisphere, there was a main effect of Shape [F(1, 7) = 153.87, p < 0.001] on N170 amplitude. This was due to larger values for intact than scrambled stimuli. There was also a main effect of Category [F(1, 7) = 10.92, p < 0.05] because of larger amplitude for faces/scrambled faces than for cars/scrambled cars. However, the interaction between these two factors failed to reach significance [F(1, 7) = 0.37, p = 0.56].
The statistical analysis on the latency in the same hemisphere revealed that there was a main effect of Category [F(1, 7) = 37.47, p < 0.001] but also an interaction involving the factors of Shape and Category [F(1, 7) = 29.23, p < 0.001] due to a longer latency for cars compared to faces [t(7) = 6.74, p < 0.001] and compared to scrambled cars [t(7) = 3.68, p < 0.05], and for scrambled faces compared to faces [t(7) = 3.99, p < 0.05].
In summary, the N170 resembled the component observed in normal participants only in the right hemisphere since it was larger for meaningful than scrambled stimuli, and larger for faces compared to cars. It was also significantly delayed for cars as compared to faces, as in normal controls of this study.
The above-described pattern was observed in all eight repetitions of the experiment (Figure 6) and also when the data was re-referenced to Fz, a procedure that was done because the data could have been potentially affected by an average reference that incorporated electrodes where the unknown (large) component was present (Figure A2 in Appendix).
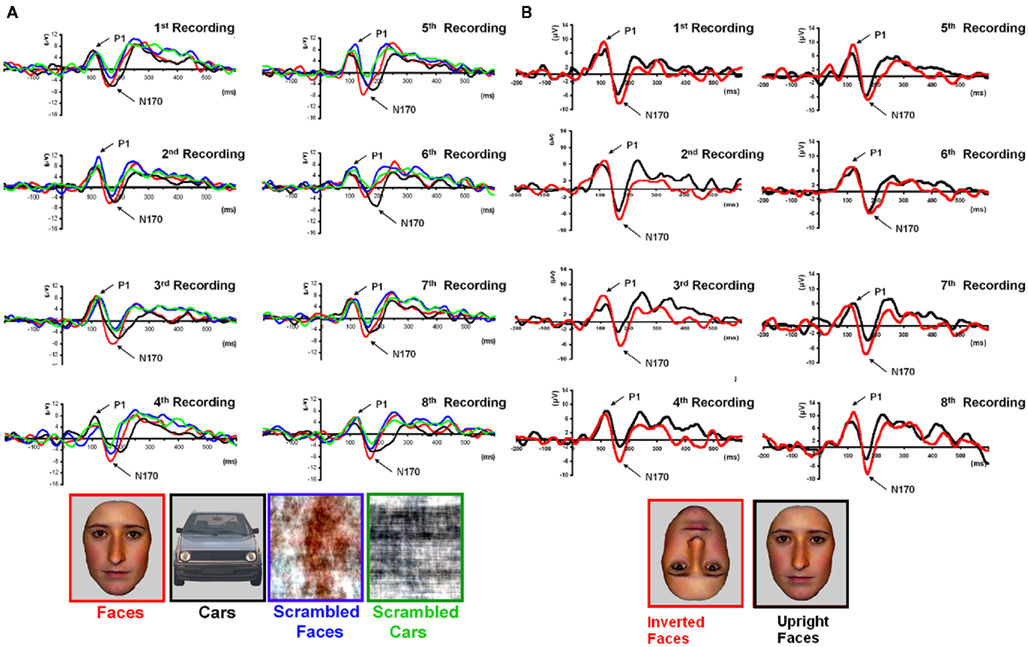
Figure 6. (A) PS averaged waveforms on the lateral occipital channels that form the regions of interest in the right hemisphere (RH) for each of the eight repetitions of Experiment 1. Despite the relatively low signal-to-noise ratio observed in each of the sessions, most probably due to brain damage, the reliability of the results across sessions with respect to the presence of an N170 in the right hemisphere can be observed. (B). Eight recording sessions of Experiment 2, showing the latency delay and amplitude increase for inverted as compared to upright faces. The latency delay was not present in one of the recording sessions only (seventh), where the preceding component (P1) was substantially delayed for upright faces.
Finally, it is also worth noting that the selection of electrodes for the ROI of the right hemisphere was based on the observation that the largest negative peak was found on the same channels for all conditions (Figure 5). However, the largest difference between faces and the other conditions was observed on the most anterior and lowest of the five channels (P8; Figure 5), which is generally – or is among one of – the optimal channel(s) to disclose the N170 face effect (Rossion and Jacques, 2008). For patient PS, averaging conditions over P8 and the more anterior and lower neighboring channels over the right occipito-temporal lobe (P10, TPP8h, TPP10h) showed the clearest face effect on the N170 (Figure 5).
PS vs. controls: comparison of effects. We performed a PS-based analysis for which we used the electrode where the patient presented the highest N170 amplitude value to the presentation of faces in most of the eight repetitions of the experiment (P8). Then, we also performed an individual-based analysis for which we used the electrode where every participant had the highest amplitude value for faces. In the case of PS, we took the electrode where she had the highest value for each application of the paradigm. Note that in all cases this analysis involved only the right hemisphere.
PS-based analysis. There were no differences regarding the amplitude [t(14) = 0.55, p = 0.30] and the latency [t(14) = 1.5, p = 0.08] of the N170 component in response to faces between PS and controls. There were no differences either in response to cars [amplitude: t(14) = 0.33, p = 0.37; latency: t(14) = 1.36, p = 0.10].
We also computed a Normalized face effect index [NFEI = (faces − cars)/(faces + cars)] for which there was no difference between PS and controls [NFEI amplitude: t(14) = 0.67, p = 0.26; NFEI latency: t(14) = 0.00, p = 0.50].
Individual-based analysis. When the electrode showing the largest amplitude to faces in each individual was used for the comparison, there were still no significant differences between PS and controls in terms of the N170 amplitude [t(14) = 0.70, p = 0.25] nor in terms of the latency [t(14) = 1.40, p = 0.09]. Similar results were obtained in response to cars [amplitude: t(14) = 0.35, p = 0.36; latency: t(14) = 2.21, p = 0.02] as well as when the NFEI was used [NFEI amplitude: t(14) = 0.33, p = 0.38; NFEI latency: t(14) = 0.81, p = 0.22; Figure A3 in Appendix].
Taken together, these results show that PS’ electrophysiological response to faces and objects did not differ significantly from that presented by normal participants. Admittedly, there is quite a large variance among individual participants in the N170 response to faces and other stimuli, which may have masked abnormal latencies and amplitudes for PS. However, this variance is part of the phenomenon of interest, and we can safely conclude that there is no reason to believe that PS shows a different pattern of N170 response in the right hemisphere compared to normal observers. Experiment 2 aimed at reinforcing this conclusion by testing the effect of inversion, a manipulation that is known to affect the latency and amplitude of the N170 in response to faces.
Experiment 2: Face Inversion
Behavioral data
Performance was above 93% for all conditions and PS’ accuracy was the highest (Table A2 in Appendix). Her correct RTs were not significantly different than the controls [Upright Faces: t(14) = 0.95, p = 0.18; Inverted Faces: t(14) = 1.71, p = 0.05]. For controls there was no difference in response time between upright and inverted stimuli [t(14) = 1.76, p = 0.09]. However, PS responded more rapidly to inverted faces (mean = 701.96 ± 94.95 ms) compared to upright faces [mean = 742.57 ± 88.73 ims; t(7) = 5.41, p < 0.01]. Note that this difference does not reflect a face inversion effect per se, in the sense that the task was merely to classify faces across orientation not identity.
Electrophysiological data
Normal controls. For the sake of brevity, in the following we will concentrate on the N170 results since the P1 component did not exhibit any characteristic worth mentioning in addition to those already described for the previous experiment.
For control participants, the N170 was delayed and larger for inverted faces compared to upright faces, although the effect was clearer on amplitude for age-matched controls (Figure 7) than in the group of younger controls, for which only four out of eight participants presented with a higher amplitude for inverted than upright faces. (Figure A4 in Appendix).
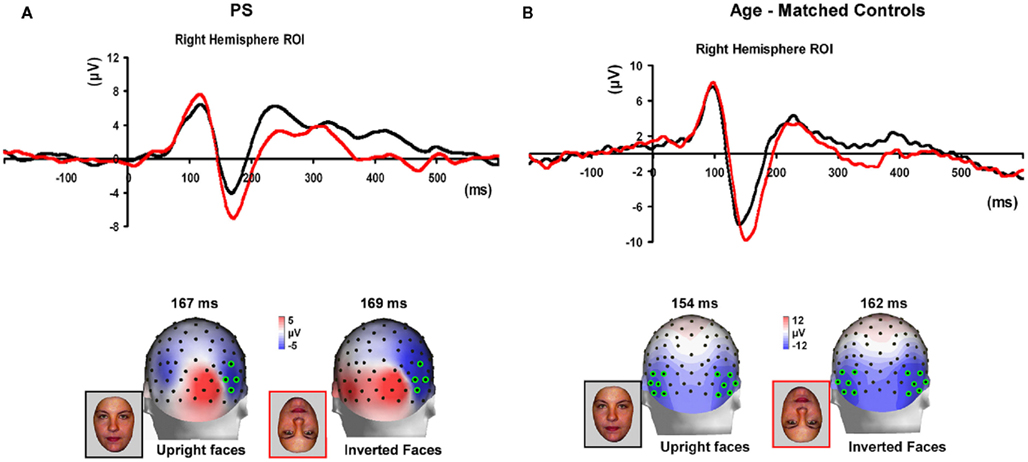
Figure 7. (A) The effect of face inversion on the right N170 for the four age-matched normal controls tested in Experiment 2. The N170 was larger in amplitude and delayed to inverted faces, as previously shown in many studies. (B). The inversion increase and delay as observed on the right hemisphere N170 for PS.
For the N170 amplitude, there were no main effects of Orientation [F(1, 7) = 0.51, p = 0.50] or Hemisphere [F(1, 7) = 3.55, p = 0.10], but there was a highly significant effect of Orientation [F(1, 7) = 18.11, p < 0.001] due to longer latencies for inverted than upright faces.
Prosopagnosia. As in the previous experiment, here PS also presented with a negative peak between 140 and 190 ms on lateral occipital electrodes (Figure 7), but it corresponded to an N170 only in the right hemisphere (Figure 7). There was a larger amplitude for inverted than upright faces [t(7) = 5.42, p = 0.001]. Although there was a delay for inverted faces in six of the sessions at least (Figure 6), the opposite effect was found in session 7, so that overall there was no significant difference between conditions in terms of latency [t(7) = 1.55, p = 0.17]. The opposite effect appeared to be related to a delayed P1 component for upright faces in that session (Figure 6). To take into account this pre-N170 difference, we selected the electrode where the N170 was highest and subtracted the P1 latency from the N170 latency. This peak-to-peak analysis revealed that the N170 (-P1) in response to inverted faces was significantly delayed compared to upright faces [t(7) = 2.05, p = 0.04].
PS vs. controls: comparison of effects.
PS-based analysis. There were no differences regarding the amplitude [t(14) = 0.17, p > 0.05] and the latency [t(14) = 1.63, p > 0.05] of the (right) N170 component in response to upright faces. Similar observations were made for inverted faces [amplitude: t(14) = 0.14, p > 0.05; latency: t(14) = 1.85, p > 0.05].
Likewise, there were no differences regarding the Normalized Face Inversion Index (NFII = (inverted faces − upright faces)/(inverted faces + upright faces)) (NFII amplitude: t(14) = 0.92, p > 0.05) (NFII latency: t(14) = 0.23, p > 0.05). This indicates that PS’ inversion effect on the N170 was at least as large as in normal controls.
Individual-based analysis. As with PS-based analysis, the individual-based analysis revealed no difference regarding PS response to upright faces [amplitude: t(14) = 0.87, p > 0.05; latency: t(14) = 1.65, p > 0.05], inverted faces [amplitude: t(14) = 0.51, p > 0.05; latency: t(14) = 0.88, p > 0.05]. There were no differences for the NFII either [NFII amplitude: t(14) = 0.95, p > 0.05; NFII latency: t(14) = 1.15, p > 0.05; Figure A3 in Appendix].
MEG Data (PS Only)
Experiment 1
In all experimental conditions, the magnetometer MEG data from PS exhibited a first magnetic deflection (M100) between 80 and 120 ms, analogous to the P1 in her EEG data, with a dipolar field pattern (positive on right, negative on left; see Figure A5 in Appendix) suggestive of an occipital generator. This was followed by a second deflection, at least for faces, that again started at about 145 ms, and was associated with a more complex field pattern suggestive of at least two dipolar sources (with a more superior negative lobe plus a more inferior positive lobe on the right, reflected in the left; see Figure 8). Cars produced a similar field pattern of weaker amplitude, while scrambled images produced a simpler field pattern of similar magnitude. The corresponding topographic plots for the RMS of the planar gradiometers are shown in Figure A6 in Appendix.
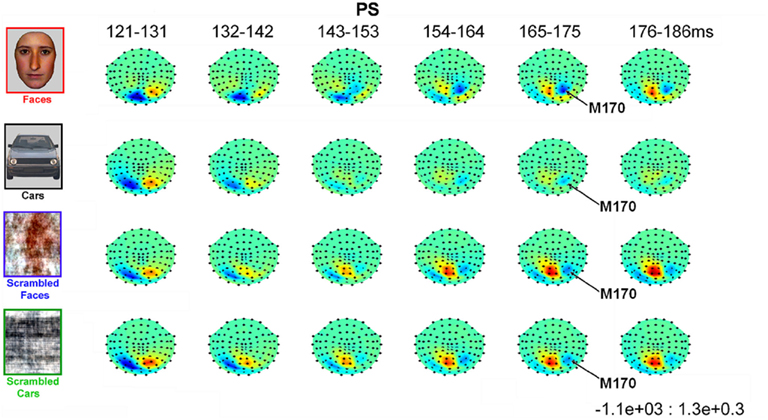
Figure 8. Evolution of magnetic fields evoked by visual stimulation as recorded by 102 magnetometers for patient PS averaged across 10 ms time windows around the M170 component in Experiment 1 (viewed from above, nasion upward; data are interpolated linearly between sensors, indicated by black dots, after their spherical projection onto a 2D surface). Red and blue indicate outward and inward radial direction of magnetic flux through single flux coils within the helmet (in units of fT).
In order to parallel the EEG analysis, pairs of homologous left and right hemisphere ROIs were defined on the basis of MEG channels showing maximal deflection for all conditions from 120 to 190 ms vs. baseline (though note that, for the magnetometer data, the sensors showing the maximal deflection will not be directly above the underlying current generator). Two such ROI pairs were defined, based on the three channels showing the maximal negative deflection in either the left hemisphere (the “superior” ROI pair in Figure 9), or in the right hemisphere (the “inferior” ROI pair in Figure A7 in Appendix). In both of these superior and inferior pairs, the right ROI, but not the left ROI, showed a greater deflection for Faces than the other three conditions, which peaked around 160 ms (henceforth the M170). This pattern of face-sensitivity in both of the right ROIs, but in neither of the left ROIs, is consistent with one dipolar generator in each hemisphere (rather than two midline generators), only the right of which was sensitive to faces.
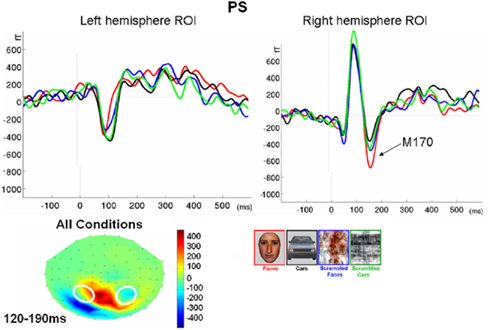
Figure 9. Evoked responses averaged across three channels for the more superior left and right ROIs in Experiment 1 (see Figure A7 in Appendix for more inferior ROIs). These channels were chosen as those with the maximal negative deflection vs. baseline in the right hemisphere from 120 to 190 ms, averaged across conditions, highlighted in white on topography below (these are Neuromag channels “MEG2441,” “MEG2311,” and “MEG2231” for the right ROI, and “MEG1841,” “MEG1631,” and “MEG1911” for the left ROI).
The median latency across trials of the maximal negative deflection in Figure 9 was 164 ms for Faces, 160 ms for Cars and 164 ms for both scrambled images. A 2 × 2 × 2 mixed effects ANOVA on the mean amplitude during this time window within each ROI for each trial showed a reliable three-way interaction between Hemisphere, Category, and Shape, F(1, 614) = 5.52, p < 0.05. Follow-on between-trial ANOVAs on each hemisphere separately showed a reliable interaction between Category and Shape in the right ROI, F(1, 614) = 6.51, p < 0.05, but not in the left ROI, F(1, 614) < 1. Post hoc pairwise comparisons across conditions in the right ROI showed that Faces produced more negative deflections than any other of the three conditions, ts > 2.282, ps < 0.05, two-tailed [the only other significant pairwise difference was more negative deflection for Scrambled Faces than Cars, t(301) = 2.11, p < 0.05].
For the left ROI, the main effects of Category, F(1, 614) = 3.17, p = 0.08, and of Shape, F(1, 614) = 3.602, p = 0.058 approached significance, with trends for more positive responses for Scrambled vs. Intact stimuli, and for Face-derived than Car-derived stimuli. Only the pairwise difference between Scrambled Faces and Cars reached significance, t(301) = 2.68, p < 0.01. The absence of a clear M170 component in the left hemisphere, coupled with the reliable interaction with Hemisphere, supports the EEG findings in suggesting the presence of a Face-related M170 in the right hemisphere only.
Experiment 2
As in the previous experiment, the magnetometer MEG data from PS exhibited a first magnetic deflection (M100) between 80 and 120 ms, with a dipolar field pattern (positive on right, negative on left; see Figure A8 in Appendix) suggestive of an occipital generator. This was followed by a second deflection that was maximal around 160 ms, and was associated with a more complex field pattern for Faces, as in Experiment 1 (with a more superior negative lobe plus a more inferior positive lobe on the right, reflected in the left; see Figure 10). Inverted faces produced a simpler field pattern of similar magnitude, though with a less marked dipolar pattern over the left hemisphere. The corresponding topographic plots for the RMS of the planar gradiometers are shown in Figure A9 in Appendix.
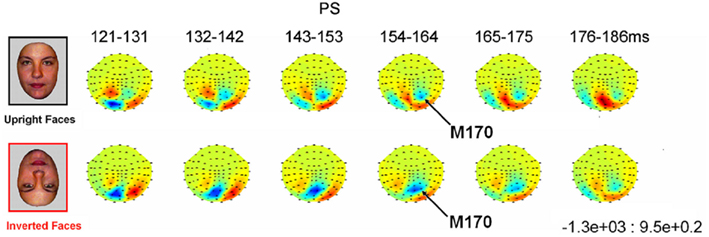
Figure 10. Evolution of magnetic fields evoked by visual stimulation as recorded by 102 magnetometers for patient PS averaged across 10 ms time windows around the M170 component in Experiment 2 (viewed from above, nasion upward; data are interpolated linearly between sensors, indicated by black dots, after their spherical projection onto a 2D surface). Red and blue indicate outward and inward radial direction of magnetic flux through single flux coils within the helmet (in units of fT).
As in the previous experiment, two pairs of ROIs were defined, based on the negative and positive lobes within each hemisphere. The three channels showing the maximal negative deflection vs. baseline in the right hemisphere, and their left hemisphere homologs, were identical to those in Experiment 1 (Figure 11). The more inferior ROIs, defined by the maximal negative deflection in the left hemisphere, contained three channels close to those in Experiment 1, but slightly more inferior (see Figure A10 in Appendix).
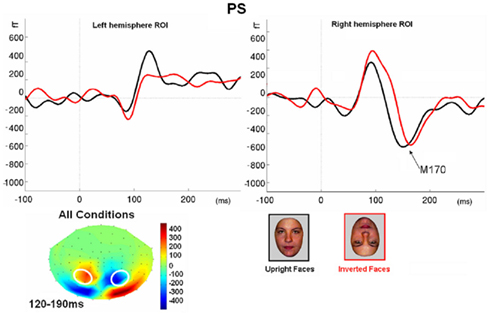
Figure 11. Evoked responses averaged across three channels for the more superior left and right ROIs in Experiment 2 (see Figure A10 in Appendix for more inferior ROIs). These channels were chosen as those with the maximal negative deflection vs. baseline in the right hemisphere from 120 to 190 ms, averaged across conditions, highlighted in white on topography below (these are Neuromag channels “MEG2441,” “MEG2311,” and “MEG2231” for the right ROI, and “MEG1841,” “MEG1631,” and “MEG1911” for the left ROI).
The evoked fields from the more superior ROI pair showed a M100 in both hemispheres, but an additional positive deflection (at least for upright faces) in the left ROI, whose original is unclear (and which was not seen in Experiment 1). Nonetheless, as in Experiment 1, a M170 component was only seen in the right ROI, which appeared delayed for Inverted relative to Upright Faces. Indeed, the median latency across trials of the maximal negative deflection in the right ROI in Figure 11 was 152 ms for Upright Faces and 168 ms for Inverted Faces, a difference that was reliable using a Mann–Whitney non-parametric test, U(167) = 2333 (Z = 3.69), p < 0.001, two-tailed.
Using a 30-ms window centered on the median latency for each condition separately, a 2 × 2 mixed effects ANOVA on the mean amplitude during this time window within each ROI for each trial showed a reliable main effect of Hemisphere, F(1, 165) = 177.82, p < 0.001, but no main effect of Inversion or interaction, Fs(1, 165) < 1.29, p > 0.26. Follow-on pairwise comparisons did not show a reliable amplitude difference in either left, t(165) = 0.68, p = 0.50, or right, t(165) = 0.94, p = 0.345, ROI. Thus, like with the EEG data, there is a clear component evoked by both upright and inverted faces around 160 ms in the right but not left ROI, though unlike the EEG data, this component had a greater latency, rather than greater amplitude, for inverted relative to upright faces. The more inferior pair of ROIs did not show the same pattern of results, possibly reflecting a different generator (Figure A10 in Appendix).
Discussion
Despite her well established prosopagnosia and her extensive brain damage, PS presented the traditional N170 amplitude increase in response to faces compared to non-face stimuli on the right occipito-temporal electrodes. Although the presence of unusual large components over the lesion sites disrupted the N170 scalp topography at right occipital medial sites, PS’ right N170 appeared to be of normal absolute amplitude for faces, and differential amplitude with respect to the N170 elicited by pictures of cars. The N170 also exhibited an amplitude increase and delay for inverted faces compared to upright faces, as found in normal observers with an intact brain. These results were replicated across several EEG recording sessions. The early face-preferential response over the right hemisphere was also found for the patient in an independent MEG recording session, showing remarkable similarities (timing, delay for inverted faces) between the M170 and N170, and suggesting that PS’ N170 was not overly distorted by the deformations in her skull/scalp or the lesions in her cortex (Figure 1).
Behaviorally, PS is able to categorize a visual stimulus as a face, being as good and as fast as normal observers (e.g., Schiltz and Rossion, 2006; Rossion et al., 2011). Neuroimaging studies have also shown a larger response to faces than objects in her right fusiform gyrus (FFA) and pSTS (Rossion et al., 2003a; Sorger et al., 2007), and the magnitude of this higher response to faces in fMRI does not appear to differ between PS and normal controls in these studies. The present electromagnetic findings thus complement these observations by showing that PS’ brain differentiates between faces and other categories as early as normal observers, that is well before 200 ms. This result is in agreement with the view that the N170 face effect is related to the initial perception of a stimulus as a face or, in other words, to the activation of a generic face representation in high–level visual cortex (Bentin et al., 1996; Sagiv and Bentin, 2001; Rossion and Jacques, 2011 for a review). Moreover, the delay and amplitude increase of the N170/M170 to inverted faces is also in agreement with PS’ behavioral performance: she is capable of telling an upright from an inverted face (see also Rossion et al., 2011).
However, the patient’s difficulties arise when faces have to be individualized, with several recent behavioral studies showing that the patient is no longer able to individualize faces using holistic processes (Busigny and Rossion, 2010; Ramon et al., 2010; Van Belle et al., 2010). Therefore, we would expect that when sensitivity to individual faces is tested, PS’ electrophysiological response to faces could be different than that of normal observers. Testing this hypothesis could be done by recording the N170/M170 in the context of a face identity adaptation paradigm. That is, in normal subjects, the N170 is reduced in amplitude when the same face is immediately repeated compared to the presentation of a different face (e.g., Heisz et al., 2006; Jacques and Rossion, 2007; Ewbank et al., 2008). However, in the same way that PS’ FFA does not show sensitivity to individual faces in such adaptation paradigms (Schiltz and Rossion, 2006), we would predict that PS’ N170 as identified in the present study would be of equal amplitude to different and repeated individual faces.
The Right Inferior Occipital Cortex is not Necessary to Generate the Right N170/M170 Effect
An important issue raised by our findings relates to the anatomical structures that support the N170/M170 face effect, in particular over the right hemisphere, where the N170 is typically the largest (e.g., Bentin et al., 1996; Rossion et al., 2003b).
To remind the reader, in fMRI, preferential activation to faces is generally observed concomitantly at least in the inferior occipital gyrus (OFA), middle fusiform gyrus (FFA), and the pSTS.
Since PS presents a reliable N170/M170 amplitude modulation over the right hemisphere electrodes despite her well-defined lesion in the right inferior occipital gyrus, we can exclude this area as an indispensable structure for generating the N170/M170 increase to faces on the scalp. However, both the middle fusiform gyrus and the pSTS are intact in PS right hemisphere, and both areas show face-preferential responses as demonstrated in fMRI (Sorger et al., 2007). Consequently, the present data suggest that face-preferential responses in the middle fusiform gyrus (FFA), and probably the pSTS, may be sufficient for generating the amplitude increase of the N170/M170 component in response to faces. This observation is in agreement with and complements the findings of significant correlations between fMRI signal and N170 amplitudes for faces in fusiform and superior temporal gyri, either using a parametric paradigm in which the amplitude of the N170 is modulated by varying the level of noise in a face stimulus (Horovitz et al., 2004), or relying on the variance of signal across a large sample of participants (Sadeh et al., 2010). They also provide new evidence supporting the claim of Dalrymple et al. (2011) that at least two of the three major functional areas must be functionally intact to generate the N170 face effect.
With respect to this issue and the findings made here, they are at least three caveats that should be mentioned.
First, our observation of a N170 face effect despite no right OFA does not eliminate the putative contribution of the (right) inferior occipital cortex to the generation of the right N170/M170 in the normal brain, and to its larger amplitude to faces. Indeed, the component recorded on the scalp reflects the combination of electromagnetic fields produced by multiple possible cortical current sources with overlapping time courses. It is likely that in the normal brain, all of these populations of neurons showing a preferential response to faces contribute to the N170 face effect, including the so-called OFA in the inferior occipital cortex (Rossion and Jacques, 2008; Henson et al., 2009). Moreover, fields produced by current flows in opposite orientations may partially cancel out each other. Given this, the removal of one of the sources following brain damage might also paradoxically increase the amplitude of signals recorded on the scalp. Note that such an increase was not observed here for the patient PS, who showed a reliable enhanced N170/M170 to faces, but which nevertheless corresponded to one of the smaller effects observed in the controls. Moreover, the N170 maxima were recorded over the same electrodes as in normal controls, suggesting that the orientation of the equivalent dipole generating the component remained largely intact without any putative contribution from face-preferential clusters of neurons in the inferior occipital cortex.
A second caveat worth mentioning is that there is a huge amount of variability in the amplitude of the N170/M170 component, and its larger amplitude to faces, in the normal brain: these components and effects can be up to 10 times larger in one individual’s brain as compared to another’s. Hence, one cannot exclude that PS’ N170/M170 face effect would have been much larger without the brain damage affecting her right inferior occipital gyrus.
Finally, the N170 (but not the M170) recorded on PS’ scalp was not only significantly larger to faces than cars, but was also larger for scrambled faces than scrambled cars, unlike what was found in normal controls. This observation suggests that the early face-preferential response over PS’ right hemisphere appears to be partially driven by low-level visual cues (e.g., color and spatial frequency spectrum, see Rossion and Caharel, 2011). Interestingly, there is evidence that low-level visual cues play a small role in driving face-preferential responses in the middle fusiform gyrus (i.e., in generating the FFA, Andrews et al., 2010; Yue et al., 2011; Rossion et al., in revision), in particular color and spatial frequency spectrum as shown with the stimuli used here. Therefore, it may be that the enhanced sensitivity to low-level visual cues at the level of the N170 for PS is related to an increase of the contribution from face-preferential responses in the middle fusiform gyrus, given the absence of any possible contribution from sources in the inferior occipital cortex in the patient’s brain. In this context, the lack of sensitivity to low-level visual cues from MEG data recorded in the same patient might reflect a larger contribution from sources localized in the upper or lower banks of the pSTS, which would be tangential to the recording electrodes on the scalp (e.g., Watanabe et al., 2003).
Despite these warnings, the present claim that the (right) OFA is not a necessary component for generating the early N170/M170 electrophysiological response on the scalp remains entirely valid and it is in agreement with the lack of correlation between the N170 amplitude and OFA signal across normal individuals (Sadeh et al., 2010).
The Absence of Left N170 Following the Left Middle Fusiform Lesion
The N170 shown by normal controls in response to faces was smaller in the left than in the right hemisphere. The larger amplitude for faces as compared to non-face objects is also typically smaller in the left than the right hemisphere, although it was not the case here (see Rossion et al., 2003b for evidence and discussion of this issue). Interestingly, we did not observe any N170/M170 or any other early face-preferential response for PS over left electrode sites. At first glance this observation is surprising because PS’ posterior lesion in the left hemisphere is much smaller than in the right hemisphere (Sorger et al., 2007). Moreover, it encompasses only the middle section of the fusiform gyrus on the ventral surface of the occipito-temporal cortex, further away from the scalp recording sites than the right hemisphere lesion. Hence, this observation is quite interesting because it supports the view that the left middle fusiform gyrus is not only sufficient but is perhaps a necessary component to generate a left N170/M170. Moreover, a left OFA, which is a small face-preferential activation not systematically found in PS’ brain (Sorger et al., 2007) appears to be insufficient to generate the N170. Thus, considering the contrast between the findings at right (N170) and left sensors (no N170), our observations point to both a sufficient and necessary role of the middle fusiform gyrus in generating early face-preferential responses on the scalp. Interestingly, the ERP data of two brain-damaged patients (R-IOT1; B-OT/AT1) tested by Dalrymple et al. (2011) support this view.
Having said this, we should acknowledge that the conclusions drawn from the present left hemisphere data on patient PS should be qualified because there are observations from other studies that qualify the claim that a FFA would be necessary to generate the N170. For instance, Bobes et al. (2004) reported a left N170 face effect in their prosopagnosic patient FE despite an extensive lesion of the left fusiform gyrus. Without functional activations, the integrity of the FFA and especially the OFA in the left hemisphere of their patient remains unknown, but the patient’s lesions appeared to be much larger than PS and concerned a very large part of the middle fusiform gyrus. Most importantly, in the recent study of Dalrymple et al. (2011), one patient had middle fusiform damage (and no FFA) in the right hemisphere and nevertheless presents with a N170 face effect on the scalp. Taken together, these observations highlight the important role of the right FFA in generating an early N170 face effect. However, they also indicate that integrity of the right middle fusiform gyrus is not always necessary to generate such an effect over the right hemisphere, providing that two other components of the face network (inferior occipital cortex and STS potentially) are intact.
The Effect of Face Inversion on the N170 and M170 without Right Inferior Occipital Cortex
PS’ N170 and M170 over the right hemisphere electrodes was delayed in response to inverted faces, as in normal observers of the present study and in numerous previous studies, reinforcing the identification of the component as being the N/M170. In MEG, PS’ M170 was not increased in response to inverted faces, and this observation is in agreement with the literature: Face inversion does not normally affect the M170 amplitude (e.g., Linkenkaer-Hansen et al., 1998; Liu et al., 2002; Watanabe et al., 2003).
Here, the traditional N170 increase of amplitude for inverted faces was found in many controls but not for all of them, and could reflect a difference in the respective contribution of the multiple sources generating the N170, depending on how the cortex is folded and thus how the sources are oriented with respect to the recording sites on the scalp. That is, sources in the inferior occipital cortex, where larger responses to inverted faces can be observed in intracranial recordings (Rosburg et al., 2010), might contribute more to the scalp potential for some participants than sources in the middle fusiform gyrus, where responses to upright and inverted faces appear to be of equal magnitude (Rosburg et al., 2010). However, this reasoning is at odds with the effect of inversion on PS’ N170, since there was a large and significant increase of amplitude to inverted faces despite damage to her right inferior occipital cortex. There are at least two ways to account for these observations. First, PS’ N170 increase to inverted faces might be due to other face-related sources, for instance in her pSTS, in which face-selective responses have been observed with fMRI (Sorger et al., 2007). Second, and more likely, the increased N170 to face inversion may originate from non-face-selective cortical sources that are preserved in her right inferior occipital cortex, such as the ventral section of the lateral occipital cortex (vLOC, Sorger et al., 2007), and in which larger responses to inverted faces have been observed in fMRI studies (e.g., Haxby et al., 1999).
Conclusion
We observed early characteristic face-preferential response over the right but not left hemisphere in a patient presenting prosopagnosia following damage to the right inferior occipital cortex and left middle fusiform gyrus. These observations indicate that a right inferior occipital cortex is not necessary to produce early face-preferential responses in the human brain and suggest that face-preferential responses in the right middle fusiform gyrus (FFA) is an important component of such early N170 face-preferential responses associated with the activation of generic face representations.
Conflict of Interest Statement
The authors declare that the research was conducted in the absence of any commercial or financial relationships that could be construed as a potential conflict of interest.
Acknowledgments
We thank Elias Mouchlianitis for assistance collecting the MEG data. Most of all, we thank PS for her time and patience. Bruno Rossion is supported by the Belgian National Fund for Scientific Research (Fonds de la Recherche Scientifique – FNRS); Richard Henson is supported by the UK Medical Research Council. This work was supported by an ARC (Actions de Recherche Concertées) grant 07/12-007, Communauté Française de Belgique and a mandat d’impulsion scientifique FNRS to BR and by UK Medical Research Council grant MC_US_A060_0046.
Footnotes
References
Allison, T., Ginter, H., McCarthy, G., Nobre, A. C., Puce, A., Luby, M., and Spencer, D. D. (1994). Face recognition in human extrastriate cortex. J. Neurophysiol. 71, 821–825.
Allison, T., Puce, A., Spencer, D. D., and McCarthy, G. (1999). Electrophysiological studies of human face perception. I: potentials generated in occipitotemporal cortex by face and non-face stimuli. Cereb. Cortex 9, 415–430.
Andrews, T. J., Clarke, A., Pell, P., and Hartley, T. (2010). Selectivity for low-level features of objects in the human ventral stream. Neuroimage 49, 703–711.
Atkinson, A. P., and Adolphs, R. (2011). The neuropsychology of face perception: beyond simple dissociations and functional selectivity. Philos. Trans. R. Soc. Lond. B Biol. Sci. 366, 1726–1738.
Barton, J. J., Press, D. Z., Keenan, J. P., and O’Connor, M. (2002). Lesions of the fusiform face area impair perception of facial configuration in prosopagnosia. Neurology 58, 71–78.
Bentin, S., Allison, T., Puce, A., Perez, E., and McCarthy, G. (1996). Electrophysiological studies of face perception in humans. J. Cogn. Neurosci. 8, 551–565.
Bentin, S., Degutis, J. M., D’Esposito, M., and Robertson, L. C. (2007). Too many trees to see the forest, performance, event-related potential, and functional magnetic resonance imaging manifestations of integrative congenital prosopagnosia. J. Cogn. Neurosci. 19, 132–146.
Bentin, S., Deouell, L. Y., and Soroker, N. (1999). Selective visual streaming in face recognition, evidence from developmental prosopagnosia. Neuroreport 10, 823–827.
Bobes, M. A., Lopera, F., Díaz-Comas, L., Galán, L., Carbonell, F., Bringas, M. L., and Valdés-Sosa, M. (2004). Brain potentials reflect residual face processing in a case of prosopagnosia. Cogn. Neuropsychol. 21, 691–718.
Bobes, M. A., Lopera, F., García, M., Díaz-Comas, L., Galán, L., and Valdés-Sosa, M. (2003). Covert matching of unfamiliar faces in a case of prosopagnosia, an ERP study. Cortex 39, 41–56.
Bodamer, J. (1947). Die-Prosop-Agnosie. Arch. Psychiatr. Nervenkr. 179, 6–54. [English translation by Ellis, H. D., Florence, M. (1990). Cogn. Neuropsychol. 7, 81–105.]
Bötzel, K., Schulze, S., and Stodieck, S. R. G. (1995). Scalp topography and analysis of intracranial sources of face-evoked potentials. Exp. Brain Res. 104, 135–143.
Bouvier, S. E., and Engel, S. A. (2006). Behavioral deficits and cortical damage loci in cerebral achromatopsia. Cereb. Cortex 16, 183–191.
Busigny, T., Joubert, S., Felician, O., Ceccaldi, M., and Rossion, B. (2010). Holistic perception of the individual face is specific and necessary: evidence from an extensive case study of acquired prosopagnosia. Neuropsychologia 48, 4057–4092.
Busigny, T., and Rossion, B. (2010). Acquired prosopagnosia abolishes the face inversion effect. Cortex 46, 965–981.
Crawford, J. R., and Howell, D. C. (1998). Comparing an individual’s test score against norms derived from small samples. Clin. Neuropsychol. 12, 482–486.
Dalrymple, K., Oruç, I., Duchaine, B., Fox, C. J., Iaria, G., Handy, T. C., and Barton, J. J. (2011). The anatomic basis of the right face-selective N170 in acquired prosopagnosia, a combined ERP/fMRI study. Neuropsychologia 49, 2553–2563.
Damasio, A. R., Damasio, H., and Van Hoesen, G. W. (1982). Prosopagnosia, anatomic basis and behavioral mechanisms. Neurology 32, 331–341.
Deffke, I., Sander, T., Heidenreich, J., Sommer, W., Curio, G., Trahms, L., and Lueschow, A. (2007). MEG/EEG sources of the 170-ms response to faces are co-localized in the fusiform gyrus. Neuroimage 35, 1495–1501.
Eimer, M., and McCarthy, R. A. (1999). Prosopagnosia and structural encoding of faces, evidence from event-related potentials. Neuroreport 10, 255–259.
Ewbank, M. P., Smith, W., Hancock, E. R., and Andrews, T. J. (2008). The M170 reflects a viewpoint dependent representation for both familiar and unfamiliar faces. Cereb. Cortex 18, 364–370.
Fairhall, S. L., and Ishai, A. (2007). Effective connectivity within the distributed cortical network for face perception. Cereb. Cortex 17, 2400–2406.
Gauthier, I., Tarr, M. J., Moylan, J., Skudlarski, P., Gore, J. C., and Anderson, A. W. (2000). The fusiform ‘face area’ is part of a network that processes faces at the individual level. J. Cogn. Neurosci. 12, 495–504.
George, N., Evans, J., Fiori, N., Davidoff, J., and Renault, B. (1996). Brain events related to normal and moderately scrambled faces. Brain Res. Cogn. Brain Res. 4, 65–76.
Gobbini, M. I., and Haxby, J. V. (2007). Neural systems for recognition of familiar faces. Neuropsychologia 7, 32–41.
Goffaux, V., Peters, J., Haubrechts, J., Schiltz, C., Jansma, B., and Goebel, R. (2011). From coarse to fine? Spatial and temporal dynamics of cortical face processing. Cereb. Cortex 21, 467–476.
Halgren, E., Raij, T., Marinkovic, K., Jousmäki, V., and Hari, R. (2000). Cognitive response profile of the human fusiform face area as determined by MEG. Cereb. Cortex 10, 69–81.
Haxby, J. V., Hoffman, E. A., and Gobbini, M. I. (2000). The distributed human neural system for face perception. Trends Cogn. Sci. (Regul. Ed.) 4, 223–233.
Haxby, J. V., Ungerleider, L. G., Clark, V. P., Schouten, J. L., Hoffman, E. A., and Martin, A. (1999). The effect of face inversion on activity in human neural systems for face and object perception. Neuron 22, 189–199.
Heisz, J. J., Watter, J., and Shedden, J. M. (2006). Progressive N170 habituation to unattended repeated faces. Vision Res. 46, 47–56.
Henson, R. N., Goshen-Gottstein, Y., Ganel, T., Otten, L. J., Quayle, A., and Rugg, M. D. (2003). Electrophysiological and haemodynamic correlates of face perception, recognition and priming. Cereb. Cortex 13, 793–805.
Henson, R. N., Mouchlianitis, E., and Friston, K. J. (2009). MEG and EEG data fusion, simultaneous localisation of face-evoked responses. Neuroimage 47, 581–589.
Horovitz, S. G., Rossion, B., Skudlarski, P., and Gore, J. C. (2004). Parametric design and correlational analyses help integrating fMRI and electrophysiological data during face processing. Neuroimage 22, 1587–1595.
Itier, R. J., Alain, C., Sedore, K., and McIntosh, A. R. J. (2007). Early face processing specificity: it’s in the eyes. J. Cogn. Neurosci. 19, 1815–1826.
Itier, R. J., and Taylor, M. J. (2004). Source analysis of the N170 to faces and objects. Neuroreport 15, 1261–1265.
Jacques, C., and Rossion, B. (2007). Early electrophysiological responses to multiple face orientations correlate with individual discrimination performance in humans. Neuroimage 36, 863–876.
Jeffreys, D. A. (1989). A face-responsive potential recorded from the human scalp. Exp. Brain Res. 78, 193–202.
Kanwisher, N., McDermott, J., and Chun, M. M. (1997). The fusiform face area, a module in human extrastriate cortex specialized for face perception. J. Neurosci. 17, 4302–4311.
Kanwisher, N., and Yovel, G. (2006). The fusiform face area: a cortical region specialized for the perception of faces. Philos. Trans. R. Soc. Lond. B Biol. Sci. 361, 2109–2128.
Kleinschmidt, A., and Cohen, L. (2006). The neural bases of prosopagnosia and pure alexia, recent insights from functional neuroimaging. Curr. Opin. Neurol. 19, 386–391.
Linkenkaer-Hansen, K., Palva, J. M., Sams, M., Hietanen, J. K., Aronen, H. J., and Ilmoniemi, R. J. (1998). Face-selective processing in human extrastriate cortex around 120 ms after stimulus onset revealed by magneto- and electroencephalography. Neurosci. Lett. 253, 147–150.
Liu, J., Harris, A., and Kanwisher, N. (2002). Stages of processing in face perception, an MEG study. Nat. Neurosci. 5, 910–916.
Marotta, J. J., Genovese, C. R., and Behrmann, M. (2001). A functional MRI study of face recognition in patients with prosopagnosia. Neuroreport 12, 1581–1587.
Minnebusch, D. A., Suchan, B., Ramon, M., and Daum, I. (2007). Event-related potentials reflect heterogeneity of developmental prosopagnosia. Eur. J. Neurosci. 25, 2234–2247.
Nasanen, R. (1999). Spatial frequency bandwidth used in the recognition of facial images. Vision Res. 39, 3824–3833.
Pitcher, D., Walsh, V., and Duchaine, B. (2011). The role of the occipital face area in the cortical face perception network. Exp. Brain Res. 209, 481–493.
Pitcher, D., Walsh, V., Yovel, G., and Duchaine, B. (2007). TMS evidence for the involvement of the right occipital face area in early face processing. Curr. Biol. 17, 1–6.
Puce, A., Allison, T., Gore, J. C., and McCarthy, G. (1995). Face-sensitive regions in human extrastriate cortex studied by functional MRI. J. Neurophysiol. 74, 1192–1199.
Ramon, M., Busigny, T., and Rossion, B. (2010). Impaired holistic processing of unfamiliar individual faces in acquired prosopagnosia. Neuropsychologia 48, 933–944.
Renault, B., Signoret, J. L., Debruille, B., Breton, F., and Bolgert, F. (1989). Brain potentials reveal covert facial recognition in prosopagnosia. Neuropsychologia 27, 905–912.
Rosburg, T., Ludowig, E., Dumpelmann, M., Alba-Ferrara, L., Urbach, H., and Elger, C. E. (2010). The effect of face inversion on intracranial and scalp recordings of event-related potentials. Psychophysiology 27, 147–157.
Rossion, B. (2008). Constraining the cortical face network by neuroimaging studies of acquired prosopagnosia. Neuroimage 40, 423–426.
Rossion, B., and Caharel, S. (2011). ERP evidence for the speed of face categorization in the human brain: disentangling the contribution of low-level visual cues from face perception. Vision Res. 51, 1297–1311.
Rossion, B., Caldara, R., Seghier, M., Schuller, A., Lazeyras, M., and Mayer, F. (2003a). A network of occipito-temporal face-sensitive areas besides the right middle fusiform gyrus is necessary for normal face processing. Brain 126, 2381–2395.
Rossion, B., Joyce, C. A., Cottrell, G. W., and Tarr, M. J. (2003b). Early lateralization and orientation tuning for face, word, and object processing in the visual cortex. Neuroimage 20, 1609–1624.
Rossion, B., Delvenne, J. F., Debatisse, D., Goffaux, V., Bruyer, R., Crommelinck, M., and Guérit, J. M. (1999). Spatio-temporal brain localization of the face inversion effect. Biol. Psychol. 50, 173–189.
Rossion, B., Dricot, L., Goebel, R., and Busigny, T. (2011). Holistic face categorization in higher-level cortical visual areas of the normal and prosopagnosic brain: towards a non-hierarchical view of face perception. Front. Hum. Neurosci. 4:225. doi:10.3389/fnhum.2010.00225
Rossion, B., and Jacques, C. (2008). Does physical interstimulus variance account for early electrophysiological face sensitive responses in the human brain? Ten lessons on the N170. Neuroimage 39, 1959–1979.
Rossion, B., and Jacques, C. (2011). “The N170: understanding the time-course of face perception in the human brain,” in The Oxford Handbook of ERP Components, eds S. Luck and E. Kappenman (New York, NY: Oxford University Press), 115–142.
Rousselet, G. A., Husk, J. S., Bennett, P. J., and Sekuler, A. B. (2005). Spatial scaling factors explain eccentricity effects on face ERPs. J. Vis. 5, 755–763.
Sadeh, B., Podlipsky, I., Zhdanov, A., and Yovel, G. (2010). Event-related potential and functional MRI measures of face-selectivity are highly correlated: a simultaneous ERP-fMRI investigation. Hum. Brain Mapp. 3, 1490–1501.
Sagiv, N., and Bentin, S. (2001). Structural encoding of human and schematic faces: holistic and part-based processes. J. Cogn. Neurosci. 13, 937–951.
Schiltz, C., and Rossion, B. (2006). Faces are represented holistically in the human occipitotemporal cortex. Neuroimage 32, 1385–1394.
Sergent, J., Ohta, S., and Macdonald, B. (1992). Functional neuroanatomy of face and object processing – a positron emission tomography study. Brain 115, 15–36.
Sergent, J., and Signoret, J. L. (1992). Varieties of functional deficits in prosopagnosia. Cereb. Cortex 2, 375–388.
Sorger, B., Goebel, R., Schiltz, C., and Rossion, B. (2007). Understanding the functional neuroanatomy of prosopagnosia. Neuroimage 35, 852–856.
Steeves, J. K., Culham, J. C., Duchaine, B. C., Pratesi, C. C., Valyear, K. F., Schindler, I., Humphrey, G. K., Milner, A. D., and Goodale, M. A. (2006). The fusiform face area is not sufficient for face recognition, evidence from a patient with dense prosopagnosia and no occipital face area. Neuropsychologia 44, 594–609.
Taulu, S., and Simola, J. (2006). Spatiotemporal signal space separation method for rejecting nearby interference in MEG measurements. Phys. Med. Biol. 51, 1759–1768.
Tsao, D. Y., Schweers, N., Moeller, M., and Freiwald, W. A. (2008). Patches of face-selective cortex in the macaque frontal lobe. Nat. Neurosci. 11, 877–879.
Van Belle, G., de Graef, P., Verfaillie, K., Busigny, T., and Rossion, B. (2010). Whole not hole, expert face recognition requires holistic perception. Neuropsychologia 48, 2609–2620.
Watanabe, S., Kakigi, R., Koyama, S., and Kirino, E. (1999). Human face perception traced by magneto- and electroencephalography. Brain Res. Cogn. Brain Res. 8, 125–142.
Watanabe, S., Kakigi, R., and Puce, A. (2003). The spatiotemporal dynamics of the face inversion effect: a magneto- and electro-encephalographic study. Neuroscience 116, 879–895.
Yue, X., Cassidy, B. S., Devaney, K. J., Holt, D. J., and Tootell, R. B. (2011). Lower-level stimulus features strongly influence responses in the fusiform face area. Cereb. Cortex 21, 35–47.
Appendix
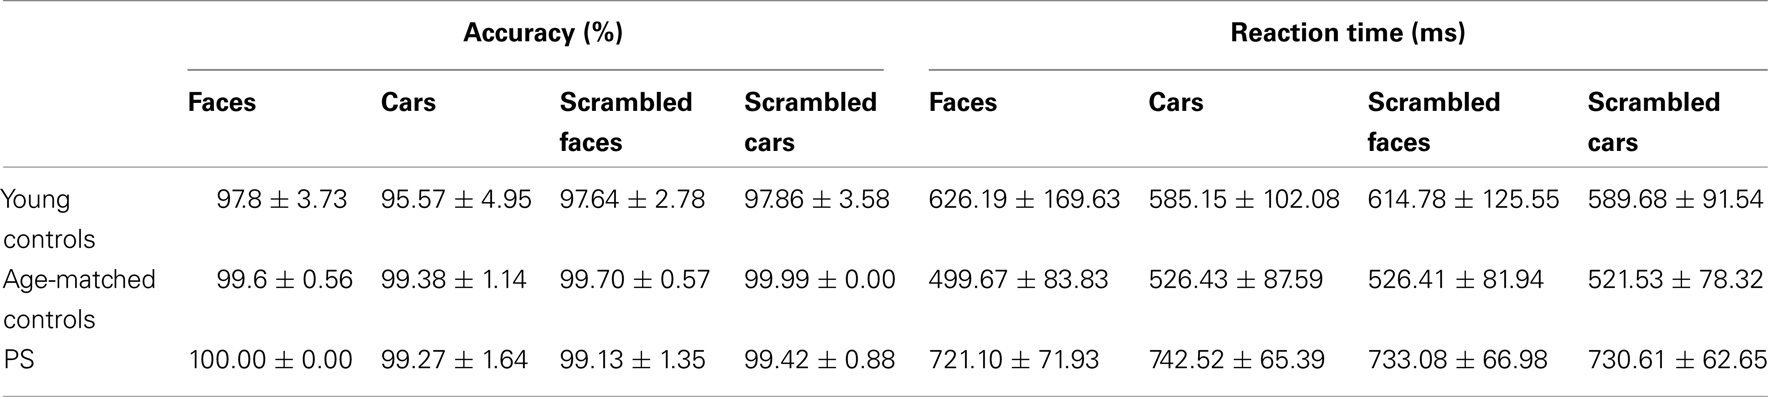
Table A1. Mean accuracy and response time achieved by each experimental group in Experiment 1, faces vs. objects.
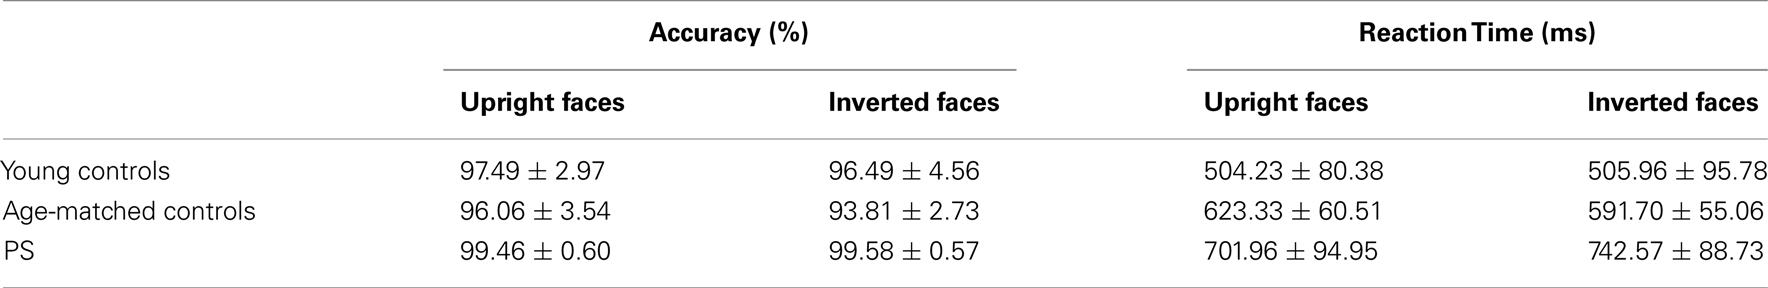
Table A2. Mean accuracy and response time achieved by each experimental group in Experiment 2, upright vs. inverted faces.
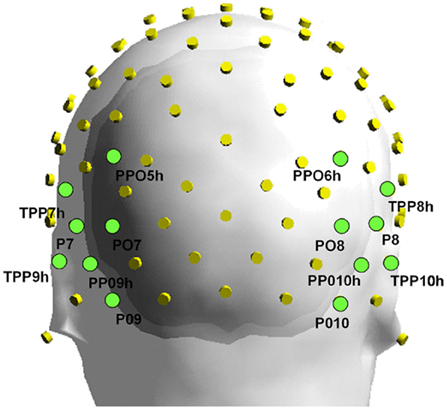
Figure A1. Electrodes layout used for EEG recordings. Back view. The electrodes included in the regions of interest are explicitly indicated.
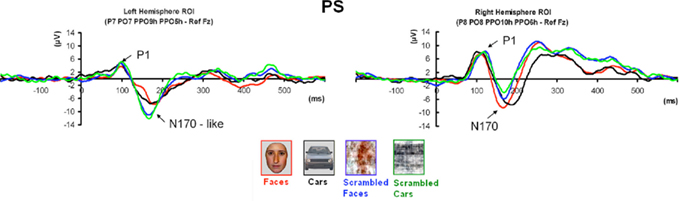
Figure A2. Grand averaged of all repetitions of the experiment performed by PS but with Fz as a reference.
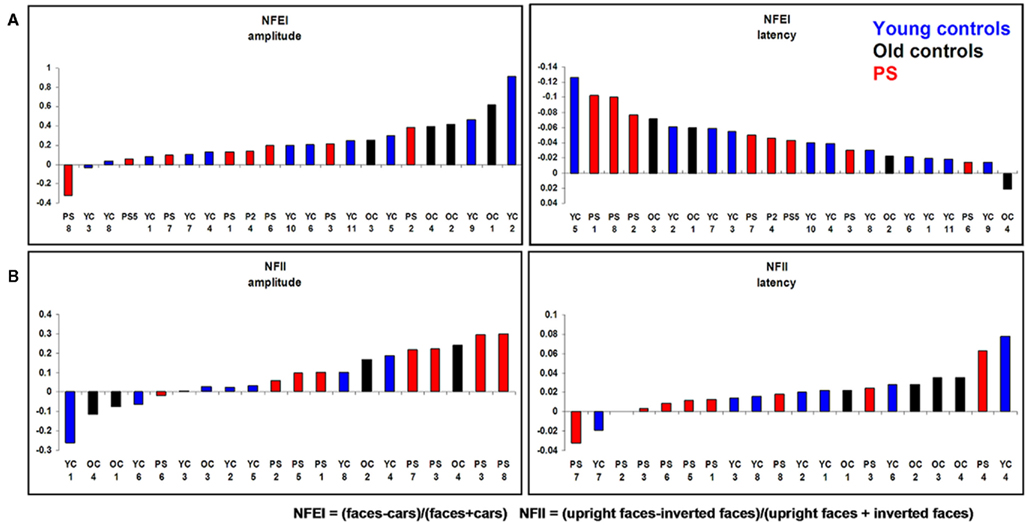
Figure A3. This figure shows both the mean NFEI [Normalized Face Effect Index = (faces − cars)/(faces + cars)] and the mean NFII [Normalized Face Inversion Index = (inverted faces − upright faces)/(inverted faces + upright faces)] of the individually based analysis for both PS and controls.
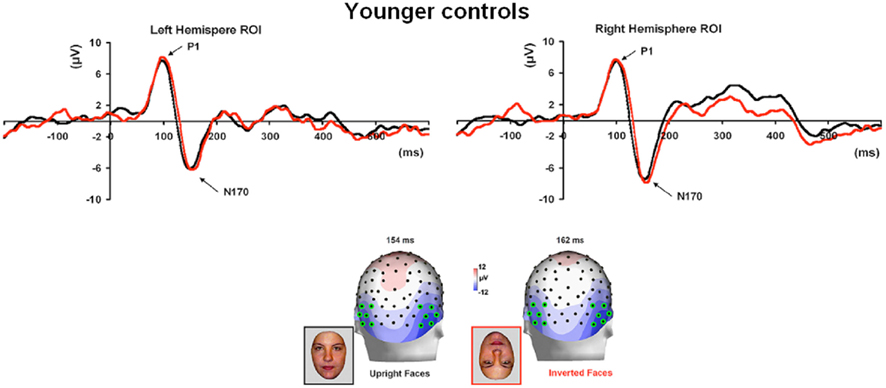
Figure A4. Waveforms and topographies of the N170 component of young participants in response to both upright and inverted faces.
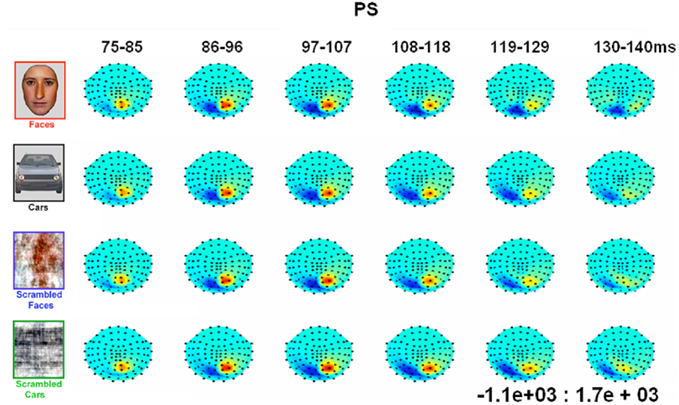
Figure A5. Evolution of magnetic fields evoked by visual stimulation as recorded by 102 magnetometers for patient PS averaged across time windows around the M100 component.
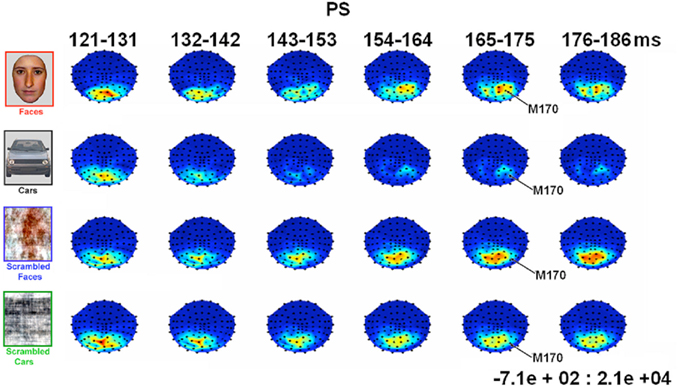
Figure A6. Evolution of magnetic fields evoked by visual stimulation as calculated from the root-mean-square (RMS) of signals recorded by each of the two orthogonal planar gradiometers at the 102 locations for patient PS averaged across 10 ms time windows around the M170 component in Experiment 1 (viewed from above, nasion upward; data are interpolated linearly between sensors, indicated by black dots, after their spherical projection onto a 2D surface). Red indicates increased signal magnitude (RMS) relative to pre-stimulus baseline (in units of fT/m).
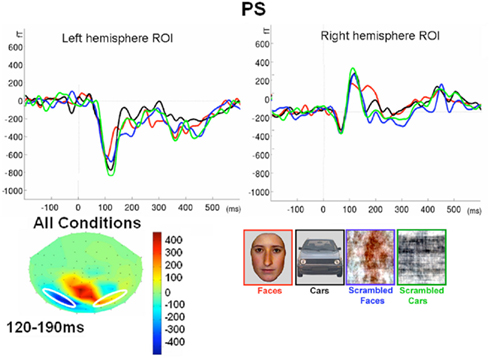
Figure A7. Evoked responses averaged across three channels for the more inferior left and right ROIs in Experiment 1 (see Figure 9 for more superior ROIs). These channels were chosen as those with the maximal negative deflection vs. baseline in the left hemisphere from 120 to 190 ms, averaged across conditions, highlighted in white on topography below (these are Neuromag channels “MEG2521,” “MEG2321,” and “MEG2341” for the right ROI, and “MEG1641,” “MEG1941,” and “MEG1921” for the left ROI).
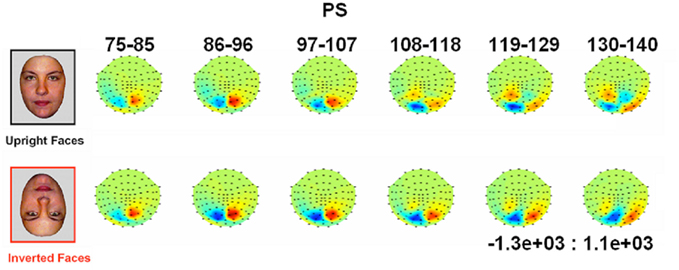
Figure A8. Evolution of magnetic fields evoked by visual stimulation as recorded by 102 magnetometers for patient PS averaged across 10 ms time windows around the M100 component in Experiment 2 (viewed from above, nasion upward; data are interpolated linearly between sensors, indicated by black dots, after their spherical projection onto a 2D surface). Red and blue indicate outward and inward radial direction of magnetic flux through single flux coils within the helmet (in units of fT).
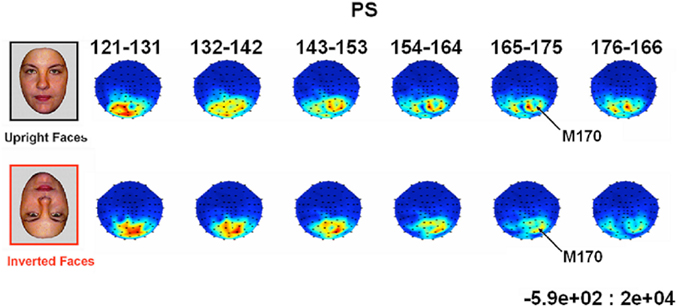
Figure A9. Evolution of magnetic fields evoked by visual stimulation as calculated from the root-mean-square (RMS) of signals recorded by each of the two orthogonal planar gradiometers at the 102 locations for patient PS averaged across 10 ms time windows around the M170 component in Experiment 2 (viewed from above, nasion upward; data are interpolated linearly between sensors, indicated by black dots, after their spherical projection onto a 2D surface). Red indicates increased signal magnitude (RMS) relative to pre-stimulus baseline (in units of fT/m).
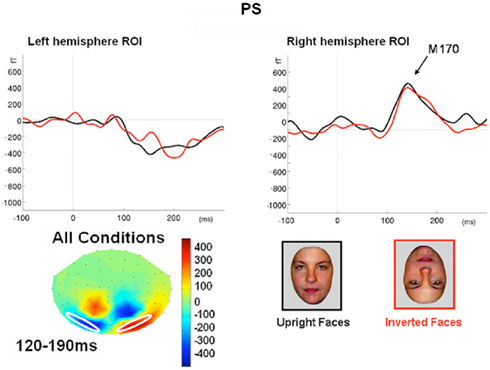
Figure A10. Evoked responses averaged across three channels for the more inferior left and right ROIs in Experiment 2 (see Figure 11 for more superior ROIs). These channels were chosen as those with the maximal negative deflection vs. baseline in the left hemisphere from 120 to 190 ms, averaged across conditions, highlighted in white on topography below (these are Neuromag channels “MEG2331,” “MEG2511,” and “MEG2521” for the right ROI, and “MEG1931,” “MEG1731,” and “MEG1721” for the left ROI).
Keywords: prosopagnosia, N170/M170, OFA, FFA
Citation: Prieto EA, Caharel S, Henson R and Rossion B (2011) Early (N170/M170) face-sensitivity despite right lateral occipital brain damage in acquired prosopagnosia. Front. Hum. Neurosci. 5:138. doi: 10.3389/fnhum.2011.00138
Received: 30 June 2011;
Accepted: 28 October 2011;
Published online: 05 December 2011.
Edited by:
Hans-Jochen Heinze, University of Magdeburg, GermanyCopyright: © 2011 Prieto, Caharel, Henson and Rossion. This is an open-access article subject to a non-exclusive license between the authors and Frontiers Media SA, which permits use, distribution and reproduction in other forums, provided the original authors and source are credited and other Frontiers conditions are complied with.
*Correspondence: Bruno Rossion, Unité de Cognition et Développement, Université Catholique de Louvain, Place Cardinal Mercier, 10, B-1348 Louvain-la-Neuve, Belgium. e-mail: bruno.rossion@uclouvain.be