The heterogeneous nature of number–space interactions
- 1 Department of Experimental Psychology, Ghent University, Ghent, Belgium
- 2 Department of Neurology and Rehabilitation, AZ-Turnhout, Turnhout, Belgium
- 3 Unité de Recherches en Neurosciences Cognitives, Université Libre de Bruxelles, Brussels, Belgium
- 4 Scientific Unit Rehabilitation Centre “Hof ter Schelde”, Antwerp, Belgium
It is generally accepted that the mental representation of numerical magnitude consists of a spatial “mental number line” (MNL) with smaller quantities on the left and larger quantities on the right. However, the amount of dissociations between tasks that were believed to tap onto this representational medium is accumulating, questioning the universality of this model. The aim of the present study was to unravel the functional relationship between the different tasks and effects that are typically used as evidence for the MNL. For this purpose, a group of right brain damaged patients (with and without neglect) and healthy controls were subjected to physical line bisection, number interval bisection, parity judgment, and magnitude comparison. Using principal component analysis, different orthogonal components were extracted. We discuss how this component structure captures the dissociations reported in the literature and how it can be considered as a first step toward a new unitary framework for understanding the relation between numbers and space.
Introduction
The representational nature of numbers has aroused the curiosity of many researchers. At present, one of the most influential and widely accepted model in numerical cognition is the triple code model of Dehaene (1992, Dehaene et al., 2003). This model postulates that, depending on the task, three independent representational systems are recruited: a visual system where numbers are encoded as strings of Arabic digits; a verbal system representing numbers lexically, phonologically, and syntactically; and a semantic quantity system which constitutes an abstract and non-verbal representation of numerical magnitude, the coding of which is thought to share functional properties and brain areas with the processing of space (e.g., Dehaene et al., 2003; Fias and Fischer, 2005; Hubbard et al., 2005; Umiltà et al., 2009).
One of the most convincing and robust observations that demonstrate the interaction between numbers and space is the spatial–numerical association of response codes (SNARC-) effect. When asked to judge whether a number is odd or even with a left or a right key press, people react faster to relatively large numbers (e.g., 9) with the right than with the left hand side, while the opposite is true for small numbers (e.g., 1). Dehaene et al. (1993) called this phenomenon the SNARC-effect and attributed it to the representation of number magnitude taking the shape of a horizontally oriented mental number line (MNL) with small numbers located on the left and large numbers on the right (at least in left-to-right reading cultures). Since then, this effect has been replicated in a wide variety of experimental settings and tasks, like for example parity judgment or magnitude comparison tasks.
Other convincing demonstrations of the tight relationship between number and spatial processing come from studies on neglect and pseudo-neglect (for a review see Umiltà et al., 2009). Patients with hemispatial neglect following right hemisphere lesion, suffer from deficient attentional orienting toward the contralesional left hemispace (for a review see Halligan et al., 2003). This deficit in spatial attention can be observed when these patients perform a physical line bisection task (e.g., Schenkenberg et al., 1980). Patients suffering from left sided neglect systematically shift their subjective midpoint of the line too far to the right (as if they neglect the left part of the line). Furthermore this bias progressively increases with longer lines, except for very short lines, where a paradoxical cross-over effect is typically found (Marshall and Halligan, 1989). Remarkably, patients suffering from neglect not only show a bias when bisecting physical lines, but also when they have to indicate the midpoint of a numerical interval (Zorzi et al., 2002). When asked for the number in the middle between two numbers (e.g., 1 and 9) they exhibited a bias toward a relatively large number (in this example, 7). Interestingly, the error pattern in this task is highly similar to that of the physical line bisection task, as also here, the misplacement of the midpoint was affected by the size of the number interval (i.e., a progressively larger bias toward larger numbers with increasing interval size, except for the shortest intervals where the crossover effect was observed).
Converging evidence for the functional link between spatial attention mechanisms and number processing comes from studies in other populations who are characterized by (subtle) attentional asymmetries. For example, in schizophrenic patients where a hemispheric imbalance is hampering the attentional orientating toward the right side of perceptual space (Michel et al., 2007), a bias toward smaller numbers in number interval bisection was observed (Cavezian et al., 2007). More recently, it has been shown that also in left brain damaged (right) neglect patients it is possible to observe a similar bias in number interval bisection (Pia et al., 2009). Finally, also healthy subjects show subtle biases in attentional processing toward the left side of space (i.e., pseudo-neglect; for a review see Jewell and McCourt, 2000). Here again, a similar leftward bias is found during the bisection of both physical lines and number intervals (Longo and Lourenco, 2007).
The phenomenological similarity between the error pattern of the physical line and the number interval bisection task in both patients and healthy subjects is considered as evidence that the neurocognitive mechanisms of number–space interactions are the same as those that subserve spatial attention. Indeed, a currently widely accepted view states that all behavioral signatures of the relation between number and space (regardless of being measured in patients or healthy subjects) have their origin in a single spatially defined representation of number magnitude, conceivable as a MNL that is spatially defined in a way that is isomorphic (i.e., are organized along Cartesian coordinates) to the representation of perceptual space. That is, although the MNL is a representation in imaginal space and physical lines in perceptual space (which can doubly dissociate in neglect, see, e.g., Anderson, 1993; Guariglia et al., 1993), the two spaces are generated by highly similar and interactive spatial attention mechanisms (e.g., Zorzi et al., 2002; Fias and Fischer, 2005; Hubbard et al., 2005; Umiltà et al., 2009).
The close link between numbers and space and the involvement of a common mechanism of spatial attention is further supported by psychophysiological studies in healthy subjects using spatial attention paradigms (e.g., Fischer et al., 2003; Stoianov et al., 2008), in studies where attentional asymmetries were induced by means of TMS (e.g., Gobel et al., 2006; Rusconi et al., 2011), and in additional neuropsychological investigations in neglect. Regarding the latter, Vuilleumier et al. (2004) asked neglect patients to perform several magnitude comparison tasks and observed that they were slower to respond to the numbers adjacent to the left of the reference, i.e., their distance-effect1 became asymmetrical, something which was not observed in right parietal patients without neglect and healthy controls. In addition, they also found that the magnitude comparison SNARC-effect selectively disappeared in the same neglect patients while it was clearly present in both control groups.
Although the MNL hypothesis provides a parsimonious account for the various empirical phenomena described above, evidence is beginning to accumulate that cannot be reconciled with the idea of a single underlying number representation that strongly depends on spatial-attentional resources. Where the MNL hypothesis predicts a strong relationship between neglect severity as measured with physical line bisection and the bias observed in several number–space tasks, recent studies indicate that physical line and number interval bisection can be doubly dissociated (e.g., Doricchi et al., 2005, 2009). At first sight this is reminiscent to the double dissociation reported between representational and perceptual neglect (e.g., Anderson, 1993; Guariglia et al., 1993). Indeed, number–space is usually considered as an instance of representational space (e.g., Vuilleumier et al., 2004), making it reasonable that it can be impaired independently from perceptual neglect (e.g., Umiltà et al., 2009). Recently however, a patient has been described who showed a clear within subject double dissociation between “right sided” perceptual and representational neglect on the one hand, and “left sided” neglect in number–space on the other (van Dijck et al., 2011). This observation suggests that the attentional difficulties associated with neglect (irrespective of being observed in representational or perceptual space) are neither a necessary nor a sufficient condition to evoke a bias when bisecting number intervals. Moreover, these observations also suggest that different cognitive processes underlie the interval bisection and the line bisection task. In line with this, Doricchi et al. (2009) observed a correlation between difficulties in the retention of verbal and spatial sequences in working memory and the number interval bisection task. Additionally, these functional results were complemented by anatomical findings demonstrating that the patients showing a rightward number interval bisection bias had a maximal lesion overlap in the prefrontal area’s that are associated with short-term working memory, whereas those showing a rightward bisection bias both in physical and number–space had supplementary lesion involvement of the temporal–parietal junction, an area that can be relevant for attentional neglect (Vallar and Perani, 1986; Corbetta and Shulman, 2002) but not for number processing.
The idea that the behavioral signatures of the interaction between numbers and space are not unequivocally attributable to a shared underlying mechanism was corroborated by other recent observations. For example, Priftis et al. (2006) described neglect patients who exhibited a number interval bisection bias while presenting a normal SNARC-effect in a parity judgment task. This suggests that number bisection and the SNARC-effect rely on (at least partially) distinct mechanisms. This is in line with recent studies in neurologically healthy subjects (Gevers et al., 2010) that cast doubt on the visuo-spatial nature of the SNARC-effect by demonstrating that the effect is the result of verbal–spatial coding of space (i.e., the association of the concepts small/large and left/right, see Proctor and Cho, 2006 for a theoretical elaboration on this principle), rather than of a spatial coding in the form of a MNL. Extending upon those findings, van Dijck et al. (2009) observed that the SNARC-effect selectively disappeared in parity judgment while (healthy) subjects were keeping verbal information in memory, and in magnitude comparison while keeping visuo-spatial information in memory (see also Herrera et al., 2008). They concluded that numbers can be associated with different spatial codes in different tasks and that those associations draw upon working memory resources (see also van Dijck and Fias, 2011), thereby supporting the idea that the representational nature of numbers is more complex than originally proposed by the MNL hypothesis.
Altogether, these recent findings suggest that the relation between numbers and space cannot be attributed to one single underlying mechanism (see Chen and Verguts, 2010 for an elegant computational model incorporating this idea). In the present study, we tried to shed more light on the diversity of the number–space interactions and their underlying cognitive mechanisms by directly comparing the different tasks and populations that are typically used to illustrate these interactions. For this purpose, we subjected a group of right brain damaged patients and age and education matched healthy participants to a battery of tasks comprising physical line bisection, number interval bisection, parity judgment, and magnitude comparison. Using principal component analysis (PCA), we unraveled the internal structure of the “number–space” by identifying groups of variables that are interrelated via latent factors. Based on the idea of a common MNL underlying the SNARC-effect and number interval bisection, which shares functional properties with the processing of perceptual lines, all measured variables should highly load on the same principal component. On the other hand, the different dissociations observed within the domain suggest a more complex interrelation from which it is predicted that the different tasks will load on different components. Although the exact pattern of relations is yet unclear, the differential contribution of verbal and spatial working memory resources to the parity judgment and magnitude comparison SNARC-effect (van Dijck et al., 2009), suggests that both tasks tap on different components. Similarly the observed dissociation between physical line and number interval bisection in neglect patients, suggests that the bias observed in both tasks can also be associated with different components. For the sake of comparability with previous studies, we also applied traditional ANOVA group analyses to verify whether all classically reported group effects could be replicated. Moreover, in addition to the group ANOVAs and PCA, we evaluated whether or not our data contained dissociations at the level of the individual subjects.
Materials and Methods
Participants
Seventeen patients with right brain damage were recruited based on the presence or absence of clinical neglect symptoms from the rehabilitation unit of Hof ter Schelde (Antwerp) and from the Neurological department of Erasmus University Hospital Brussels. Initial selection of patients was based on clinical manifestations reported in the medical file and the results of formal general neuropsychological evaluation. Since for some patients there was a gap of several weeks to months between the initial selection and participation in the current study, final assignment to the neglect or non-neglect group was based on the results of the physical line bisection at the time of the current study. For this purpose the data of the age and education matched healthy controls (see below) were used to calculate the 3 SD cut-off value which was used to determine abnormal asymmetries in spatial attention. For all except one patient (subject 2 of the control group), this procedure confirmed the clinical observations. For this patient, the clinical descriptions of neglect were not consistent. Given his normal performance in the current physical line bisection task, his normal performance in the other task and the time lag of more than 3 months between the final neuropsychological evaluation and the moment of participation, it was decided to include him in the control group (importantly, the results of the PCA reported below were virtually identical when this subject was excluded from the analyses or considered as a neglect patient). By means of this procedure, 10 patients were considered as neglect patients (nine males; average age: 65.50 years; SD = 13.03; average education: 10.6 years; SD = 4.79) and 7 as patients without neglect (four males; average age: 63.26 years: SD = 10.80; average education: 13.71 years; SD = 5.19) All brain damaged patients suffered from a recent right hemispheric stroke and suffered from left sided hemiplegia or hemiparesis. In the control group, 12 aged and education level matched healthy controls (four males; average age: 69 years; SD = 12; average education: 13.17 years; SD = 4.53) were included. The study was approved by the local ethical committee of the faculty of Psychology and Educational sciences of Ghent University. According to the Declaration of Helsinki, an informed consent was signed before participation. Demographic, clinical, and psychometric data of the patients are reported in Table 1.
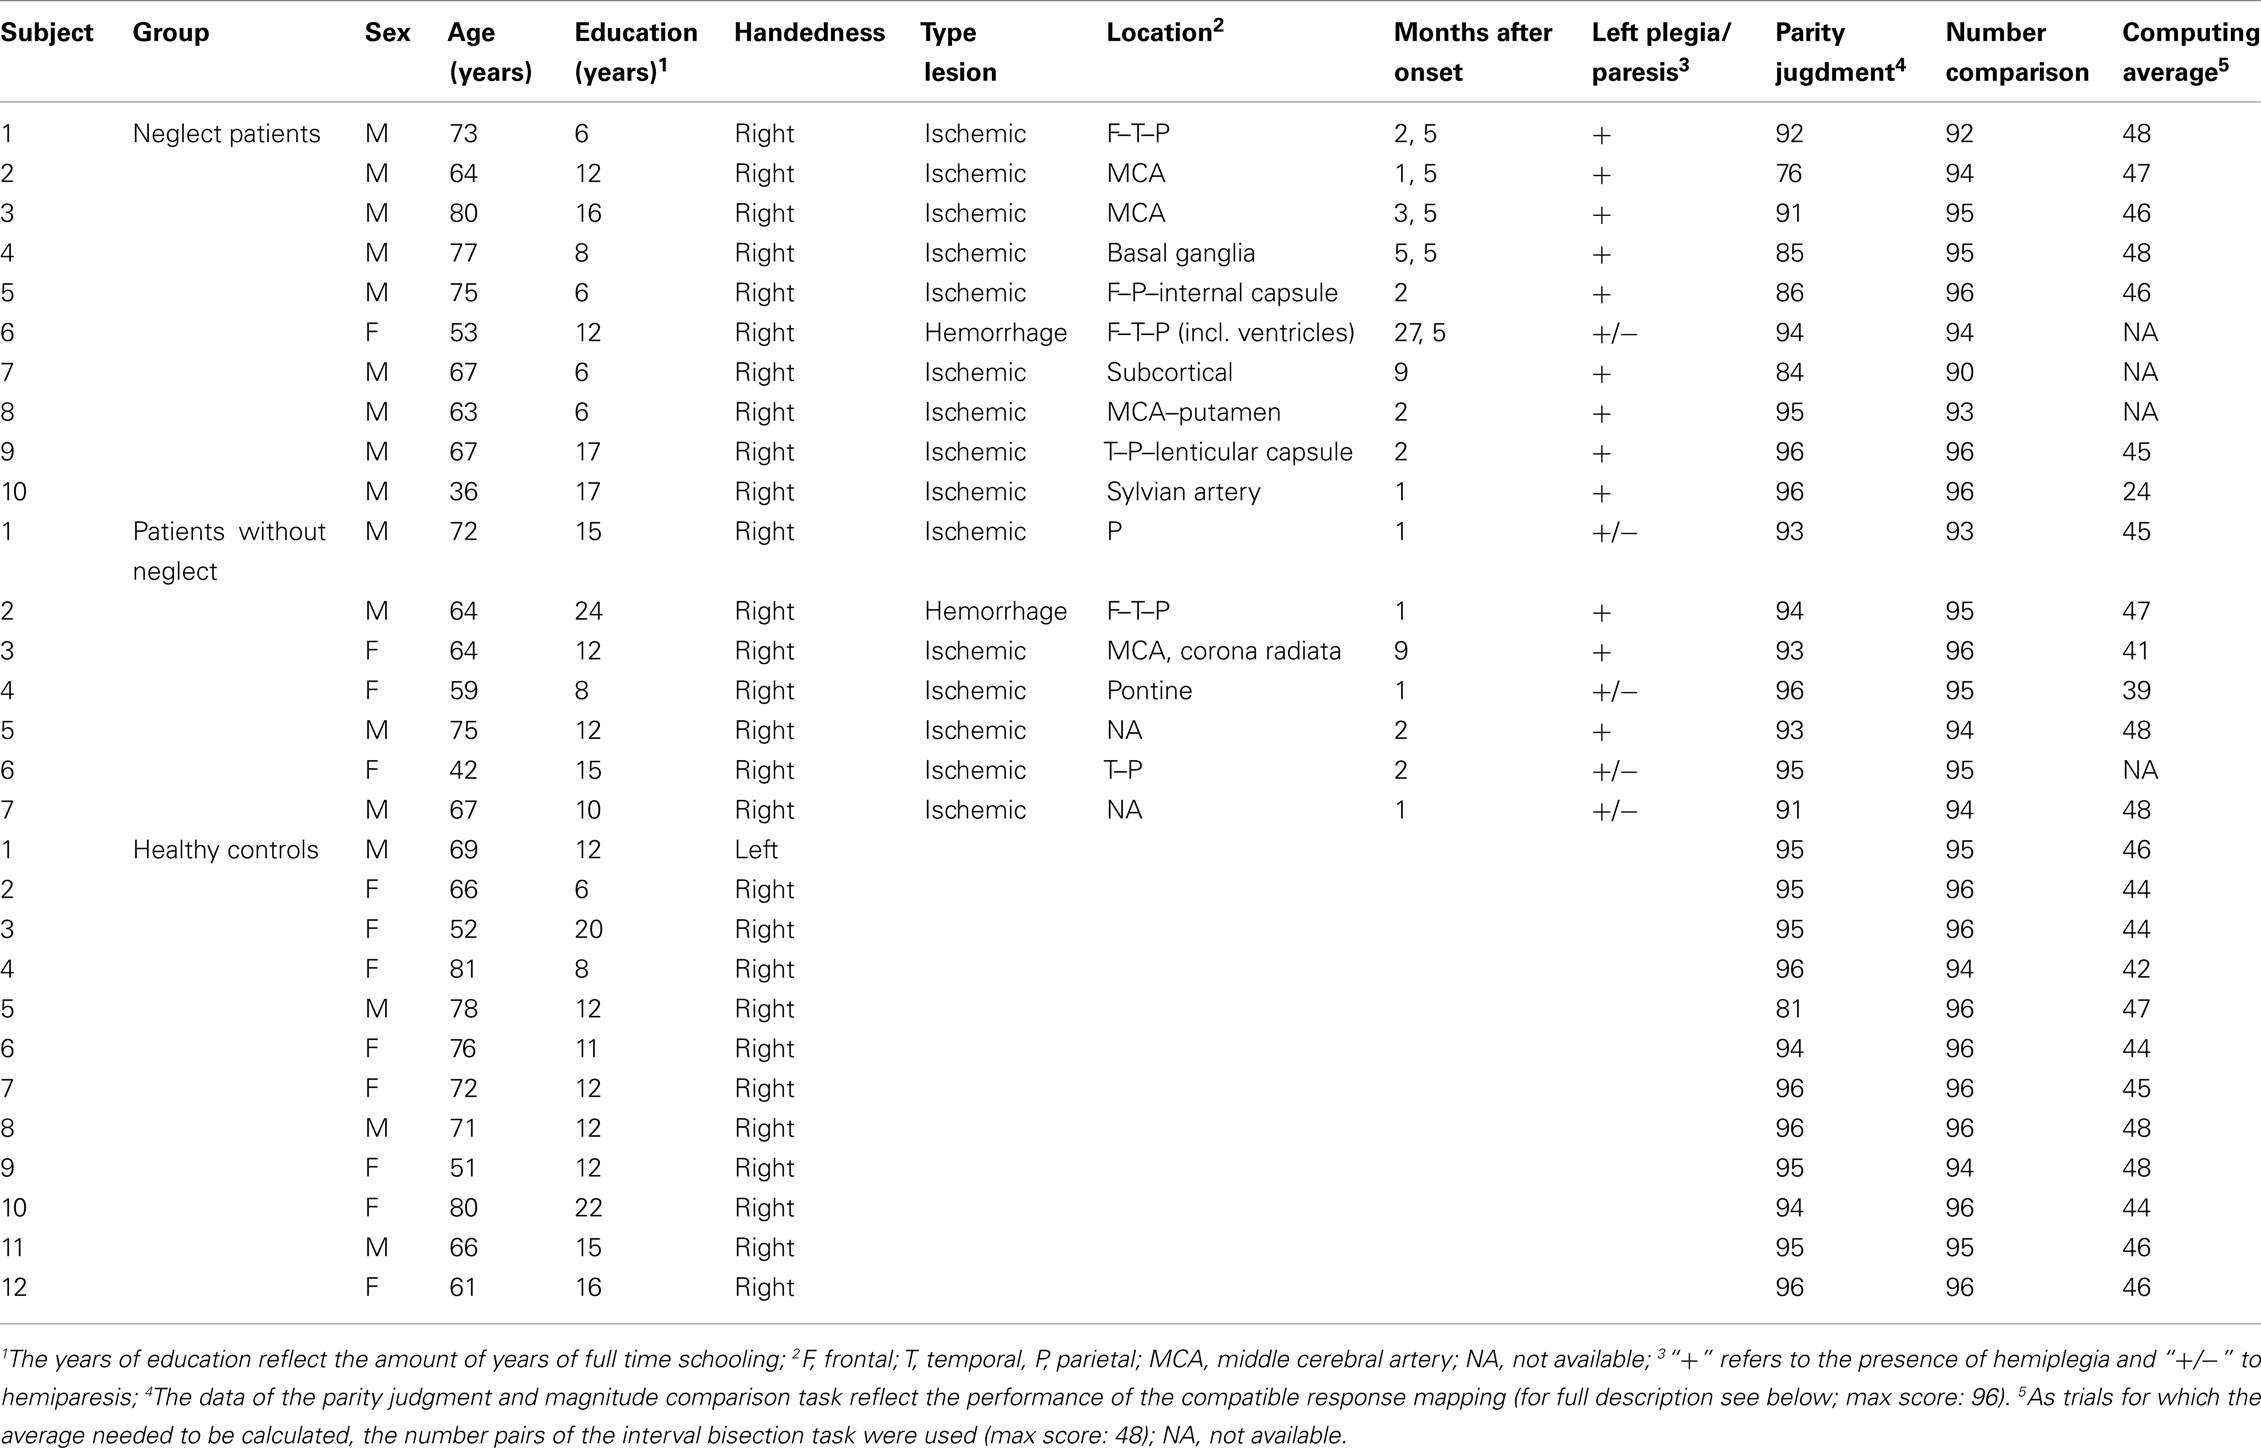
Table 1. Demographic, clinical, and psychometric data of the patient sample.
Design
In a session of approximately 1 h, all subjects participated in line bisection, number interval bisection, magnitude comparison and parity judgment. Tasks were presented in counterbalanced order with the restriction that the sessions started and ended with either the comparison or parity judgment task. Both the magnitude comparison and parity judgment task consisted of two blocks that differed in response mapping (i.e., assignment of magnitude (or parity) status to left or right response). These blocks were successively administered with a part of the line bisection task (consisting of three parts) administered in between. After the first SNARC-task was completed, the number interval bisection and the second part of the line bisection task were administered.
Both the order and response mapping of both SNARC-tasks were counterbalanced. In the patient group, eight started with the magnitude comparison task, of which four started with the compatible mapping (i.e., odd/smaller → left button, even/larger → right button). The other nine subjects began with parity judgment, of which five started with the compatible mapping. For the healthy controls both task order and response mapping were equally balanced across subjects.
Stimuli and Material
Line bisection
Fifteen horizontal lines of three different lengths (2, 10, and 20 cm; line thickness 2.5 mm) were presented one by one, each centered on a separate landscape A4 paper. The instructions were to mark the midpoint of these lines with a pencil. Lines of the same length were presented in separate blocks that were presented at different moments in the experimental session (see Design). The order of presentation of the different blocks was randomized across participants. All lines were aligned to the body midline. Head and eye movements were allowed, but moving the test sheet was not permitted. No time constraints were imposed.
Interval bisection
Forty-eight numerical intervals were orally presented and subjects were asked to verbally indicate the numerical midpoint with the explicit instruction not to calculate. The number pairs were constructed following the method described in Zorzi et al. (2002). All number intervals were presented randomly (e.g., which number is in the middle of 1 and 9?). For each interval, the smallest number was presented first. No time constraints were imposed and the intervals were repeated if requested. It was not explicitly encouraged to use spatial imagery.
Parity judgment and magnitude comparison
For both tasks, digits ranging from 1 to 9 (with the exception of 5) had to be judged on the basis of parity (odd or even) or magnitude (smaller or larger than 5). Both tasks consisted of two blocks differing in response mapping (odd-left and even-right or vice versa; small-left and large-right or vice versa). Each digit was presented 12 times for each response mapping condition. This resulted in a total of 192 trials per task.
For both tasks, a trial started with the presentation of a fixation point (#) for 700 ms. Thereafter the target number was presented until a response was given. Only reaction times below 10000 ms were considered as actual responses. The digits were presented in a random order in the center of the computer screen. Sitting distance from the screen was approximately 60 cm. Stimuli (1 by 1.4 visual degrees) were presented in white against a black background. Before running the experiment, it was verified whether the subjects could easily pay attention to the digits on the screen. To get used to the experimental procedure, each response mapping block of both tasks was preceded by eight exercise trials in which each digit was presented once. Twenty-eight subjects used a PC mouse as response interface and were asked to press the left button with their right index finger and the right button with the right middle finger (cf. Priftis et al., 2006). Due to difficulties in subtle movements, one neglect patient was asked to respond with a joystick by making left and rightward movements.
Results
Analyses of Group Differences
Bisection tasks
To evaluate the presence of (pseudo) neglect in physical line and number interval bisection, the response bias was evaluated by measuring the distance of the subjective midpoint from the actual midpoint. For the line bisection task, distances were measured with a ruler from the left side of the line with 0.5 mm accuracy and for the interval bisection bias from the smallest number. For each trial, these values were transformed to a deviation score by means of the following formula (Schenkenberg et al., 1980):

With this formula, a positive score is obtained when the subjective midpoint is shifted rightward when bisecting a line or when an overestimation is made in the number interval bisection task. For each subject separately, the deviation scores of all trials were entered into a regression analysis for repeated measures designs (Method 3 of Lorch and Myers, 1990) with line or interval length as predictor. The sign of the regression weights, obtained with this method, indicates the direction in which the midpoint is misplaced. The size of those weights reflects the degree in which this bias is modulated by line or interval length. In this way, a positive regression weight indicates that the midpoint is progressively overestimated/shifted more to the right of the true midpoint and is, when large enough, interpreted as a manifestation of neglect. A negative regression weight, on the contrary, indicates pseudo-neglect. The intercept is considered as an index of the cross-over effect. A negative intercept indicates a cross-over toward the left/smaller numbers.
To evaluate whether the average weights and intercepts significantly differ from zero, one-sample t-tests were performed for each subject group separately. Finally, one-way ANOVA’s were performed with the regression weights and the intercepts as dependent and group membership as independent variable, to verify the presence of group differences. In case the factor group membership turned out to be significant, Bonferroni corrected post hoc analyses were performed to get more insight in the nature of the effect.
Based on the existing literature (e.g., Zorzi et al., 2002), a positive regression weight and a negative intercept is to be expected in neglect patients, whereas in healthy controls a negative regression weight and a positive intercept should be found, indicating the presence of neglect and pseudo-neglect respectively (Longo and Lourenco, 2007).
Physical line bisection. The neglect group bisected 11% (SD = 8%) of the lines correctly, the patients without neglect 23% (SD = 13%), and the healthy controls 26% (SD = 13%). An overview of the average deviation scores for each line length of each subject group is provided in Figure 1A. The average regression weight of the neglect group was +1.00% (SD = 0.31%), [t(9) = 10.31, p < 0.001 (one-sided)] of the patient without neglect +0.02% (SD = 0.26%), [t(6) = 0.23, p > 0.99 (one-sided)] and of the healthy controls −0.20% (SD = 0.23%), [t(11) = −2.90, p < 0.01 (one-sided)]. A one-way ANOVA with these regression weights as dependent variable and subject group as factor indicated group differences in the magnitude of these weights [F(2,26) = 59.07, p < 0.001]. Post hoc comparisons revealed that the regressions weights of the neglect group differed from the patients without neglect and the healthy controls (both p’s < 0.01) but that no differences were observed between the two control groups. This pattern of results confirmed the presence of left sided neglect in the neglect group, and the presence of right sided pseudo-neglect in the healthy controls.
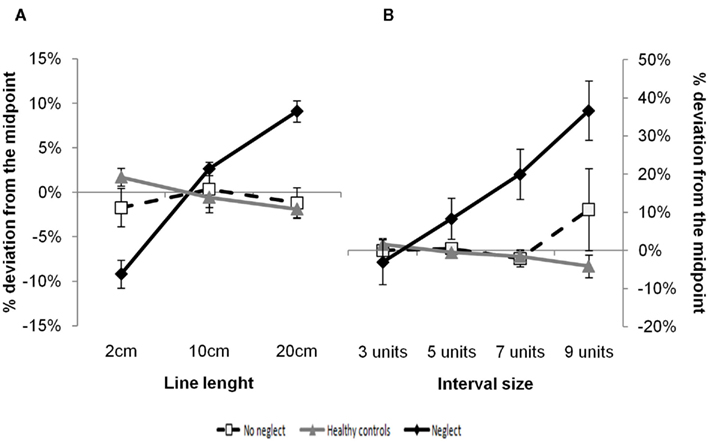
Figure 1. Physical line bisection (A) and number interval bisection (B) in neglect patients, patients without neglect and healthy controls. Both figures show the average proportional difference between reported and correct midpoints for the different line and interval lengths. Zero reflects a correct response, while positive values indicate a rightward shift or an overestimation of the midpoint and negative values a leftward shift or an underestimation. Error bars give the SEM across subjects.
To evaluate the presence of a cross-over effect, similar analyses were performed on the intercepts of the three subject groups. The presence of a (left sided) cross-over effect was confirmed in the neglect group as the average intercept was −9.83% (SD = 4.57%), [t(9) = −6.81, p < 0.001 (one-sided)]. Where the effect did not reach significance in the patient without neglect [average intercept: −1.09%; SD = 6.53%; t(6) = −0.44, p > 0.99(one-sided)], the healthy controls showed a (right sided) cross-over effect [average intercept: 1.86%; SD = 3.56%; t(11) = 1.81, p < 0.05 (one-sided)]. The one-way ANOVA showed again group differences [F(2,26) = 17.28, p < 0.001]. As for the regression weights, post hoc comparisons revealed that only for the neglect group the differences with the other groups were significant [both p’s < 0.001].
Number interval bisection. The neglect group bisected 70% (SD = 18%) of the intervals correctly, the patients without neglect 80% (SD = 12%), and the healthy controls 88% (SD = 5%). An overview of the average deviation scores for each interval size of each subject group is provided in Figure 1B. Like in the line bisection task, the presence of a significant bias was evaluated by means of the regression approach. The average regression weight of the neglect group was +6.16% (SD = 6.22%), [t(9) = 3.13, p < 0.01 (one-sided)] of the patient without neglect +0.58% (SD = 4.25%), [t(6) = 0.36, p > 0.99 (one-sided)] and of the healthy controls −0.88% (SD = 1.16%), [t(11) = −2.63, p = 0.01 (one-sided)]. A one-way ANOVA with these regression weights as dependent variable and subject group as factor indicated group differences in the magnitude of these weights [F(2,26) = 7.87, p < 0.01]. Post hoc comparisons revealed that the regressions weights of the neglect group differed from the patients without neglect and the healthy controls [both p’s < 0.05] but that no differences were observed between the two control groups.
The data were further inspected for the presence of a cross-over effect. For this purpose, the analyses reported above were repeated with the individual intercepts obtained from the regression analyses as dependent variable. The presence of a (left sided) cross-over effect was confirmed in the neglect group with an average intercept of −21.92% (SD = 32.90%), [t(9) = −2.16, p < 0.05 (one-sided)]. The effect did not reach significance in the patients without neglect [average intercept: −2.33%; SD = 23.40%; t(6) = −0.26, p > 0.99 (one-sided)], the healthy controls showed a (right sided) cross-over effect [average intercept: 4.14%; SD = 7.79%; t(11) = 1.84, p < 0.05 (one-sided)]. The one-way ANOVA showed again group differences [F(2,26) = 3.79, p < 0.05]. Post hoc comparisons revealed that only the neglect group differed significantly from the healthy controls [p < 0.05]. Altogether, this pattern of results replicates previous reports on number interval bisection (e.g., Zorzi et al., 2002; Priftis et al., 2006; Longo and Lourenco, 2007), and confirms the phenomenological similarity between neglect observed in physical line and number interval bisection both in neglect patients as in healthy controls.
Parity judgment and magnitude comparison SNARC-effect
For both tasks, only correct responses and RT’s larger than 150 ms and smaller than the individual 2.5 SD from the average RT cut-off were included in the analyses. For both the parity judgment and magnitude comparison task, the SNARC-effect was determined using the regression approach described in Fias et al. (1996). For this purpose, dRT’s (average RT right response – average RT left response) were computed for each number separately. Per subject, these dRT’s were entered in a regression analysis with magnitude as predictor. The regression weight of the magnitude predictor expresses the size of the SNARC-effect. A one-sample t-test was then used to evaluate whether the averages of the individual regression weights of each subject group significantly differed from zero. To verify the presence of group differences, similar one-way ANOVA’s were carried as in the bisection tasks.
Based on the existing literature, in parity judgment, comparable negative regression weights are expected in all subject groups (Priftis et al., 2006), while in magnitude comparison, negative regression weights are only expected in both control groups (Vuilleumier et al., 2004).
Parity judgment SNARC-effect. Given the inclusion criteria, for the neglect group, the control patients and the healthy controls, 88.59% (SD = 6.66%), 94.87% (SD = 2.39%), and 94.27% (SD = 4.77%) of the trials were included in the analyses, respectively. The overall average RT for those subject groups was 1092 ms (SD = 281 ms), 735 ms (SD = 173 ms), and 671 ms (SD = 107 ms) respectively. A preliminary analysis showed no influence of the different counterbalancing factors (order of presentation of SNARC-tasks, order of response mapping or their interaction) for the group effects described below, and confirmed the absence of a speed–accuracy trade of in any of the subject groups (for all positive correlations p-values were larger than 0.49).
For all subject groups a negative relation between the predictor variable (number) and the criterion variable (dRT) was observed (see Figure 2A). The average regression weight of the neglect group was −38.79 (SD = 47.69), of the control patients −11.76 (SD = 8.06) and of the healthy controls −22.59 (SD = 15.93). The obtained weights were compared against zero with a one-sample t-test. This test showed that for all subject groups the regression weights were significantly different from zero [all t’s(9,6,12) < −2.57, all p’s < 0.016 (one-sided)]. In line with the predictions, the size of the SNARC-effect was comparable in all subject groups as the one-way ANOVA with those regression weights as dependent and group membership as independent variable failed to reach significance [F(2,26) = 1.75, p = 0.19].
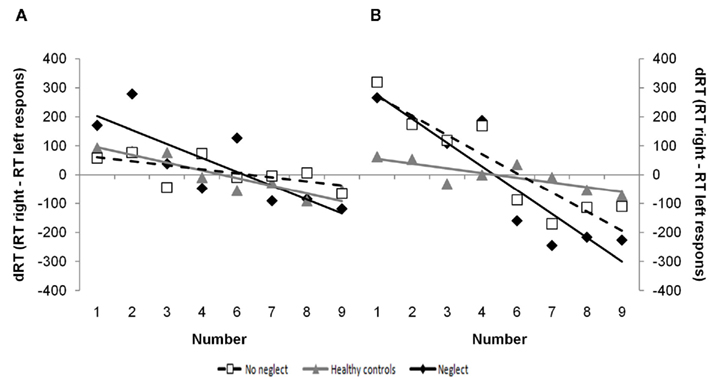
Figure 2. SNARC-effects of magnitude comparison and parity judgment in neglect patients, patients without neglect and healthy controls. The observed data and the regression line represent the response time differences (dRT) between right and left responses as a function of the numerical magnitude in parity judgment (A) and magnitude comparison (B).
Magnitude comparison SNARC-effect. Given the inclusion criteria, for the neglect group, the control patients and the healthy controls, 87.86% (SD = 6.81%), 92.49% (SD = 4.07%), and 97.09% (SD = 1.36%) of the trials were included in the analyses, respectively. The overall RT for those subject groups was 1069 ms (SD = 156 ms), 768 ms (SD = 189 ms), and 627 ms (SD = 119 ms). A preliminary analysis showed no influence of the different counterbalancing factors (order of presentation of SNARC-tasks, order of response mapping or their interaction) for the group effects described below, and confirmed the absence of a speed−accuracy trade of in any of the subject groups (for all positive correlations p-values were larger than 0.38).
In magnitude comparison too, all subject groups demonstrated a negative relation between the predictor variable (number) and the criterion variable (dRT; see Figure 2B). The average regression weight of the neglect group was −70.87 (SD = 73.22), of the control patients −56.99 (SD = 39.02) and of the healthy controls −12.97 (SD = 23.61). The obtained weights were compared against zero with a one-sample t-test. This test showed that for all subject groups the regression weights were significantly different from zero [all t’s(8,6,12) < −1.90, all p’s < 0.05 (one-sided)]. The one-way ANOVA with those regression weights as dependent and group membership as independent variable was significant [F(2,25) = 4.12, p = 0.028], indicating group differences in the size of the SNARC-effect. Post hoc analyses demonstrate that the SNARC-effect of the neglect group is larger compared to the healthy controls’ [p < 0.05] but that the effect of the control patients did not differ from the two other groups [both p’s > 0.19].
Asymmetry of the magnitude comparison distance-effect
Similar inclusion criteria were used as for the calculation of the SNARC-effect, leading to the same descriptive statistics. Preliminary analyses again showed no influence of the different counterbalancing factors (order of presentation of SNARC-tasks, order of response mapping and their interaction) on the effects found in the repeated measures ANOVA described below.
To investigate the presence of a potential asymmetry in the distance-effect, average RT’s were computed for each number separately, and submitted to repeated measures ANOVA with magnitude (two levels: smaller and larger than 5) and distance from the referent (four levels) as within subject and group membership as between subject variables. This analysis revealed a main effect of group membership [F(2,26) = 23.80, p < 0.01] and of distance [F(3,78) = 10.53, p < 0.01]. Slower responses were given by the neglect patients (1069 ms) than by the patients without neglect (769 ms) and the healthy controls (628 ms). Average RTs per distance, from distance 4 to distance 1, were 801, 803, 812, and 872 ms, respectively. A polynomial contrast confirmed a linear trend [F(1,26) = 25.95, p < 0.001], indicating the presence of a distance-effect. In addition, an interaction between magnitude and distance [F(3,78) = 3.97, p < 0.05], and a triple interaction [F(6,78) = 3.73, p < 0.01] between magnitude, distance, and group membership was observed (see Figure 3).
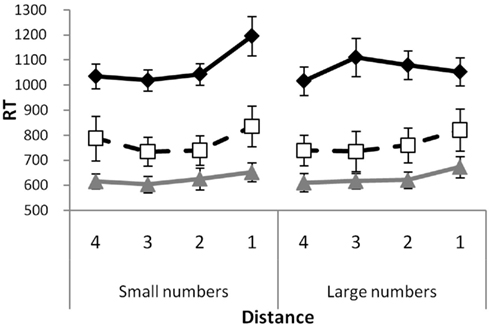
Figure 3. Distance effects for small and large numbers separately in neglect patients, patients without neglect and healthy controls. The data points reflect mean reaction times and the error bars give the SEM across subjects.
To get more insight in the nature of the triple interaction, the RT’s for the small and large numbers of each individual subject were entered into separate regression analyses with their distance toward the referent (number 5) as predictor. To obtain an index of the asymmetry, the obtained regression weights of large numbers were subtracted from the weights obtained for the small numbers. In this context, a negative asymmetry index reflects a stronger distance-effect for small numbers. Given the existing literature (Vuilleumier et al., 2004), a negative index is to be expected for neglect patients.
The average asymmetry index of the neglect group was −42.82 ms (SD = 38.80), of the control patients 12.27 (SD = 33.53), and of the healthy controls 5.89 (SD = 18.86). The obtained weights were compared against zero with a one-sample t-test. This test showed that only for the neglect group the asymmetry index were significantly different from zero [t(9) = −3.49, p < 0.01 (one-sided)]. The one-way ANOVA with those indexes as dependent and group membership as independent variable was significant [F(2,26) = 9.27, p < 0.01], indicating group differences. Bonferroni corrected post hoc analyses demonstrate that the asymmetry index of the neglect is significantly different from both control groups [both p’s < 0.01] and that no difference was observed between the healthy controls and the patients without neglect [p = 1.00].
The Search for (Double) Dissociations at the Individual Level
Although the group analyses described above demonstrate a phenomenological similarity between the performance on physical line and number interval bisection in neglect patients and healthy control subjects, one should be careful to draw conclusions, because averaging across individuals may obscure the possible presence of (double) dissociations within individuals. Therefore, we also performed a multiple case analysis. We first calculated the average effect sizes for all tasks in the healthy control group. Then, for each patient, we used + and – 3 SD of this control group average effect size as a boundary to define whether the patients performance was inside or outside the normal range. An overview of this analysis can be found in Figure 4. A visual inspection of this figure reveals that, like observed by Doricchi et al. (2005, 2009), a meaningful number of neglect patients (4 out of 10) showed a normal performance in number interval bisection, whereas 2 out of 7 patients without neglect, showed an abnormal rightward bias in number interval bisection. Interestingly, the same double dissociation was observed for the asymmetry of the distance-effect. Here 4 out of 10 neglect patients did not show an abnormal asymmetry, while 1 control patients without neglect showed an opposite asymmetry. These results clearly demonstrate that neglect in perceptual space is not sufficient to give rise to neglect in the number domain, and that a biased number processing is not in all cases an indication for the presence of neglect.
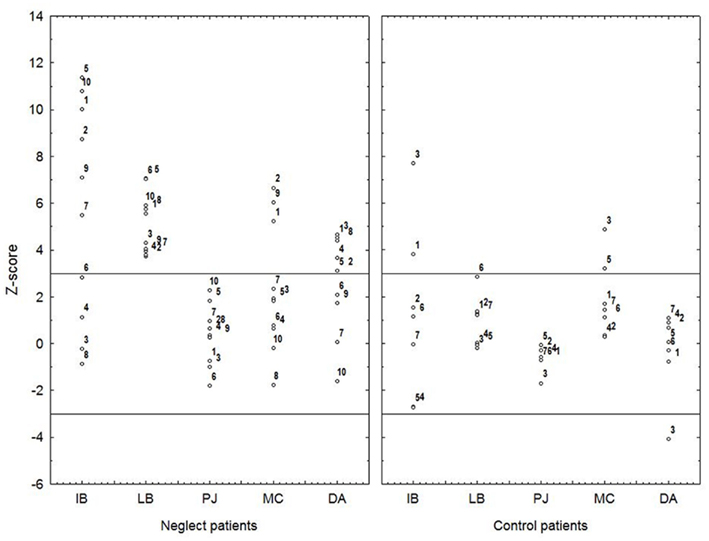
Figure 4. Overview of the individual data points for both patient groups separately of the different tasks that were used for the PCA. Each data-point reflects the z-score values based on the average and SD of the healthy controls, and the directionality of the dependent variables was adjusted so that a larger positive number always indicates a larger effect. The black lines indicate the ±3 SD from the average interval calculated on the data of the healthy controls. Each point reflects a data point of one subject for a specific task. Subject numbers were kept constant over the different tasks and correspond to the subject numbers reported in Table 1. IB, interval bisection; LB, line bisection; PJ, parity judgment; MC, magnitude comparison; DA, distance asymmetry.
Principal Component Analysis
Based on the results reported so far, it is clear that conclusions based on the analyses of group differences and on the multiple case approach diverge. Drawing conclusion about the nature of the relationship between variables based on binned data (or based on clinical observations, or on the use of cut-offs), however, has the potential risk of misinterpreting the actual relationship between the involved variables. As an alternative, correlational methods have been proposed (e.g., MacCallum et al., 2002). For this purpose, we further analyzed the available data by means of a PCA to get a clearer picture of the interrelation of the effects measured in the study. To prevent that the PCA would capture the subject group differences instead of the interrelation between the different tasks, the data of all variables were normalized to z-scores for each subject group separately in advance. The current PCA was conducted on the correlation matrix of the normalized regression weights of the interval bisection, physical line bisection, parity judgment SNARC-effect, magnitude comparison SNARC-effect, and the asymmetry index of the distance-effect. This data matrix contained one missing value (magnitude comparison SNARC-effect for neglect patient no 7) which was substituted by the neglect group’s average. No constraints in the amount of extracted factors were imposed. An overview of these individual data is presented in Figure 4. For the ease of interpretation, the directionality of the dependent variables was adjusted so that a larger positive number always indicates a larger effect.
Because PCA is a multivariate technique that assumes multivariate normal distributions, it is very sensitive to extreme uni- and multivariate outlier. Therefore, scrutinous evaluation of the normality assumption is needed (Raykov and Marcoulides, 2008). A careful verification revealed no uni- or multivariate outliers, as all values were within the ±3 SD from the average range and for all subjects the Mahalanobis distance was smaller than the 0.05 critical value. Furthermore, satisfactory uni- and multivariate distributions were obtained for all variables [Omnibus test of normality (Jarque and Bera, 1987): all LM’s < 3.50; all p’s > 0.17; Omnibus test of Multivariate normality (Looney, 1995) VQ3(10) = 12.63, p > 0.24].
Results
The Bartlett’s test of sphericity turned out to be significant (χ2 = 19.18, p < 0.05) indicating that the data matrix is suitable for PCA (Raykov and Marcoulides, 2008). According to Kaiser’s criterion, a three component solution (all eigenvalues >1.02), explaining 78% of the variance, was chosen. The initial solution was (raw) varimax rotated to obtain a simple structure (see Table 2). To evaluate the relevance of the obtained factor loadings, only statistically significant factor loadings (p-values obtained by correlating the dependent variables with the obtained individual factor scores on the three components) are reported. In this way, the first component had substantial loading from the number interval bisection [r = −0.80, p < 0.001] and the magnitude comparison SNARC-effect [r = −0.80, p < 0.001]. The second component was highly loaded by the line bisection task [r = 0.95, p < 0.001] and on the asymmetry index of the distance-effect [r = 0.39, p < 0.05] and the third component highly loaded on the parity judgment SNARC-effect [r = −0.71, p < 0.001], the asymmetry index of the distance-effect [r = 0.78, p < 0.001], and the interval bisection task [r = −0.40, p < 0.05]. Thus in contrast with the idea that only one cognitive mechanism determines the variability in number–space interactions, a clear three component solution was observed (note that a three component solution was also found when the PCA was conducted on the raw data, where no normalization procedure was applied to level out grouping effects). A discussion of how the obtained internal structure capture with the dissociations described in the literature is provided in the Section “General Discussion.”
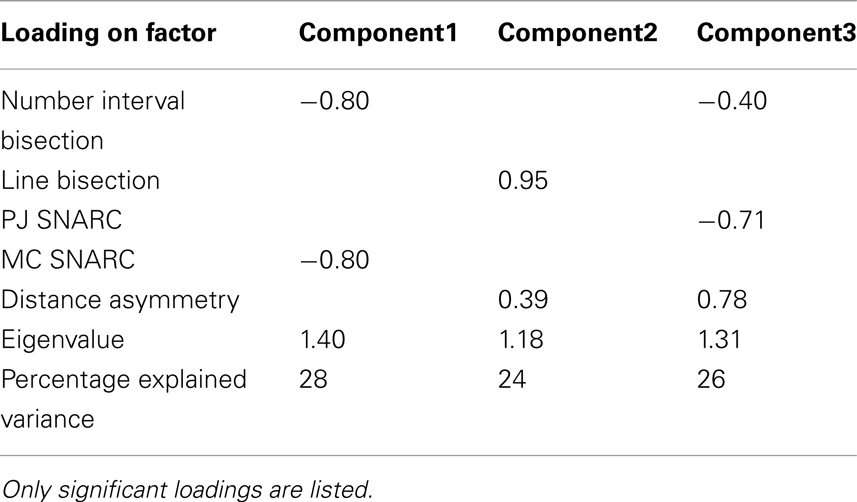
Table 2. Overview of the three component solution obtained from the PCA.
General Discussion
The aim of the present study was to uncover the relations between different effects that are assumed to reflect the interactions between numbers and space. For this purpose a group of right brain damaged patients with neglect, a group of right brain damaged patients without neglect and healthy controls participated in physical line bisection, number interval bisection, parity judgment, and magnitude comparison. First, using traditional group analyses we showed that the basic effects were obtained as expected. Subsequently, we went beyond the group level analysis and looked at the pattern of dissociations between the tasks at the level of the individual patients. Finally, the data from all tasks and subjects were entered into a PCA to reveal their internal structure.
Concerning the group analyses, as expected from the literature (Zorzi et al., 2002; Priftis et al., 2006), a phenomenological similarity in the error patterns of the physical line and number interval bisection task was found in left neglect patients, who showed a right systematic bias which increased as a function of the line/interval length, and a cross-over effect for the short lines/intervals. In addition, the error pattern (both in terms of the cross-over effect as the bias which is modulated by line length) was also similar in both tasks for the healthy controls, where right sided pseudo-neglect was observed. Furthermore, as observed by Vuilleumier et al. (2004), the influence of neglect was also manifest in the number comparison distance-effect of the neglect patients, which was more asymmetrical due to a stronger distance-effect for small numbers (that are on the left of the referent). In addition, replicating the observations described by Priftis et al. (2006), the parity judgment SNARC-effect was comparable for all subject groups. In contrast to the observations of Vuilleumier et al. (2004) however, a significant magnitude comparison SNARC-effect in neglect patients was found, which was comparable to the effect of the patients without neglect.
Further evaluation whether or not the data of the individual subjects fell within the normal range revealed that, despite the phenomenological similarities at the group level, not all neglect patients struggled with a bias in number interval bisection and with an asymmetric distance-effect, and that some of the patients without neglect showed a significant bias in interval bisection. These findings clearly demonstrate that perceptual neglect and neglect in number–space can be doubly dissociated.
Finally and most importantly, the PCA resulted in a three component structure that accounted for 78% of the variance. The first component had substantial loading from interval bisection and the magnitude comparison SNARC-effect. The second component was associated with physical line bisection and the asymmetry of the distance-effect, and the third component included interval bisection, parity judgment SNARC-effect, and the asymmetry of the distance-effect.
So far, it was a widely accepted idea that all behavioral signatures of the number–space interactions have their origin in a single spatially defined representation of number magnitude, conceivable as a MNL, which shared functional properties with the way how (perceptual) space is represented and processed (e.g., Zorzi et al., 2002; Hubbard et al., 2005; Priftis et al., 2006). A straightforward prediction of this account is that only one component should be extracted when PCA is used to get an idea about the latent components underlying the various behavioral effects. This is because the MNL hypothesis assumes strong mutual relationships between its behavioral signatures themselves and between those signatures and measures of attentional asymmetry. Such strong relationships are (to our knowledge) not yet described in the literature. On the contrary, the existence of several double dissociations between tasks assumed to reflect the operation of the MNL (e.g., Rossetti et al., 2004; Doricchi et al., 2005, 2009; Loetscher and Brugger, 2009; Loetscher et al., 2010; van Dijck et al., 2009, 2011), suggest that the internal structure of number–space is characterized by more than one component. In line with this idea, neglect in number–space is considered as a form of representational neglect (e.g., Umiltà et al., 2009), which is known to be dissociable from physical neglect (e.g., Guariglia et al., 1993). Although not necessarily in contradiction with this latter position, the PCA conducted in the present study extracted three components, thereby supporting the idea that even more cognitive mechanisms are involved in the realization of the interaction between numerical and spatial processing. Furthermore, as will be illustrated next, the obtained pattern of component loadings captures the dissociations described in the literature. Together, this provides useful information to come to an understanding of the nature of the underlying mechanisms.
Although the group analyses showed a joint bias between physical line bisection and number interval bisection, both tasks did not share the same component. This suggests that the attentional asymmetry in physical space is not associated with the bias in number interval bisection. This conclusion is strengthened by the observation that in our sample, interval bisection and physical line bisection were double dissociated in some patients. Similar observations were made by Doricchi et al. (2005, 2009), who in addition reported that the deficit in number interval bisection can be attributed to a problem in the retention of spatial and verbal sequences. In line with this idea, interval bisection significantly loaded on two other components, one shared with the magnitude comparison SNARC-effect, and one with parity judgment SNARC-effect and the asymmetry index of the distance-effect.
The classic explanation of the SNARC-effect is that it arises from a correspondence between the position of the number on the MNL and the position of the response, irrespective of the task used to obtain it (e.g., Dehaene et al., 1993). It has been proposed that in tasks where numerical magnitude is used explicitly, neglect should hamper access to the left side of this representation (Priftis et al., 2006). In contrast to this prediction, both the parity judgment (where numerical magnitude is not needed to solve the task) and magnitude comparison SNARC-effects of the present study were unaffected by neglect. This observation confirms alternative accounts on the SNARC-effect which propose conceptual spatial representations as the determining factor of the SNARC-effect, rather than perceptual spatial representations. For example Proctor and Cho (2006) assume that space, like many other cognitive representations, is organized in binary categories (e.g., left/right; small/large; hot/cold). Moreover, such conceptual categories have a polarity (e.g., left is negative and right is positive; small is negative and right is positive;…) and it is the correspondence between the polarity of the stimulus (viz. the magnitude of the number) and the response (viz. position of the response) that induces the SNARC-effect (for a similar account see Gevers et al., 2006; Santens and Gevers, 2008). Given the observation that conceptual and perceptual spatial representations rely on dissociable neural systems (Jager and Postma, 2003), it is no surprise that both SNARC-effects are spared in neglect.
This explanation however, is not complete as it does not account for the fact that both effects also differ from each other: whereas in parity judgment the effect was similar in all subjects, in magnitude comparison it was considerably larger in the patient groups. These observations are captured by our PCA, which extracted separate components for these tasks, indicating that both effects are associated with different cognitive processes. A possible explanation for this finding was recently proposed by the computational model of the relation between numbers and space (Chen and Verguts, 2010). This model proposes two independent sources for the SNARC-effect, one depending on conceptual congruency, and one on the use of visuo-spatial resources (probably via the use of mental imagery). The existence of those two sources was recently confirmed by van Dijck et al. (2009) who found that both SNARC-effects had a different origin. When neurologically intact subjects were asked to memorize verbal information while judging the parity status of numbers, the SNARC-effect disappeared, whereas the effect remained untouched under a spatial working memory load. In magnitude comparison, however, the opposite was observed (see also Herrera et al., 2008). Here the SNARC-effect vanished under spatial but not under verbal working memory load. Based on these observations, they concluded that numbers are associated with visuo-spatial or verbally mediated spatial codes, and that magnitude comparison and parity judgment engage these codes differentially.
When considering the results of the PCA, the number of components extracted together with their loading profiles, fit with the findings described above. Indeed, where the involvement of visuo-spatial working memory has been demonstrated in both number interval bisection (Doricchi et al., 2005) and the magnitude comparison SNARC-effect (Herrera et al., 2008; van Dijck et al., 2009), both effects load on the same component. Similarly, both the number interval bisection (Doricchi et al., 2009; van Dijck et al., 2011) and the parity judgment SNARC-effect (van Dijck et al., 2009; van Dijck and Fias, 2011) are previously associated with verbal working memory, and also load on the same component. At present however, the exact and detailed role of those working memory resources needs further experimentation and computational modeling work. For example, in the model of Chen and Verguts (2010), the involvement of spatial working memory has been interpreted in the context of mental imagery which is used to construct a spatial representation when solving certain tasks involving numbers. For both number interval bisection and for magnitude comparison, the use of spatial imagery can indeed be helpful to efficiently solve the task. In that sense, the independence of this spatial imagery component from the component involving physical line bisection could reflect the dissociation between physical and representational neglect as proposed by Umiltà et al. (2009). The role of verbal working memory, however, is at present less well understood (and not yet explicitly modeled). One possible explanation has recently been described by Fias and colleagues (Fias et al., 2011; van Dijck and Fias, 2011), who proposed that the parity judgment SNARC-effect is a reflection of the way numbers are mentally organized in verbal working memory. In a series of experiments, they asked participants to perform a parity judgment task on numbers that were maintained as a randomly ordered sequence in working memory. It was observed that it was the position of the number in this memorized sequence but not its numerical magnitude that determined the spatial coding of the number (viz. begin elements were associated with a left response, and end elements with a right one). A similar role of verbal working memory in number interval bisection has recently been proposed by van Dijck et al. (2011). They described a woman suffering from left hemisphere brain damage, who showed a double dissociation between right physical and representational neglect on the one hand, and left neglect for numbers, and other ordered sequences on the other hand. Further neuropsychological examination revealed that this seeming left sided neglect had a pure non-spatial origin and was based on defective memory for the initial items of verbal sequences. From this, they concluded that for efficient number interval bisection, the entire range of numbers comprising the interval needs to be collected and correctly ordered in verbal working memory. If the shared component is indeed reflecting the involvement of verbal working memory, those results suggest that the explanation proposed in this single case study can be generalized to the population, to explain at least a part of the variance of the interval bisection data.
In addition, the results also speak to the cognitive origin of the asymmetry of the distance-effect and how it relates to the other effects. While this effect became asymmetrical in neglect, the SNARC-effect obtained in the same task remained unaffected. This dissociation was again captured by the PCA, which associated both effects with different components. The dissociation between the distance-effect and the SNARC-effect has been reported previously. Herrera et al. (2008) and van Dijck et al. (2009) observed that in neurologically intact subjects, a spatial working memory load reduced the SNARC-effect, leaving the distance-effect unaffected. Both findings together provided strong evidence that both effects are indeed independent (see also Gevers et al., 2006; Chen and Verguts, 2010). Interestingly, the asymmetry index of the distance-effect is the only number–space signature in the present study that shares a component with physical line bisection, suggesting that the effect is mediated by spatial attention. In support of this idea, in the model of Chen and Verguts (2010) the asymmetry of the distance-effect is indeed the only effect for which damage to the attentional mechanisms of the right hemisphere should be sufficient to obtain it. It is remarkably, however, that again not all neglect patients showed an asymmetrical distance-effect. This can probably be explained by the fact that this effect also loads on the component shared with interval bisection and parity judgment SNARC-effect. Given the descriptions above, this finding suggest that the asymmetry index of the distance-effect also draws upon verbal resources. Interestingly, the component loading is reversed in sign compared to that of the parity judgment SNARC-effect and the interval bisection bias. If, like van Dijck et al. (2011) propose, verbal working memory resources are important to encode the ordinal relations between numbers, one would predict that such resources are also of relevance when comparing numbers with a fixed standard. A reduction of such resources would thus not only affect interval bisection and parity judgment, but also number comparison, and its associated distance-effect. It is obvious that when the distance-effect decreases due to a lack of verbal resources, its asymmetry will do so correspondingly. Whether or not the distance-effect depends on verbal resources is a matter of future investigations, and to our knowledge, no direct evidence for this position is described in the literature. Indirectly however, it is remarkable that in the second experiment described by Herrera et al. (2008), where the magnitude comparison task is administered under verbal and spatial working memory load, the overall reaction times increased selectively in the verbal load condition.
The question remains why we found a magnitude comparison SNARC-effect in neglect patients, while no such effect was found by Vuilleumier et al. (2004). Although speculative, this difference can be related to differences in the counterbalancing of the response mapping. In magnitude comparison, where SNARC-congruency changes block wise, it is important to ensure that the effect is not attenuated by learning effects [e.g., when a subject have to start with the compatible response mapping (small → left, large → right), RT’s of this condition can be higher due to time needed to get used to the experimental setup and the response device, in extreme cases masking the presence of a SNARC-effect]. For this reason it is of importance to properly counterbalance the response mapping of this task, especially when investigating elderly subjects who are often not very familiar with computerized response devices. No information of such counterbalancing has been provided by Vuilleumier et al. (2004), making it possible that the used counterbalancing scheme gave rise to the pattern of data they described. In our study on the other hand, the counterbalancing of the response mapping (and also the order in which both SNARC-tasks are presented) is controlled for, making it more likely to observe the actual effect.
Finally, it is important to emphasize that the results of the PCA are truly reflecting different components of number–space interactions, rather than general task differences. The reason is that we entered the behavioral effects as signatures of number–space interactions (SNARC-effect, bisection bias, asymmetry of the distance-effect) rather than the reaction times themselves. This guarantees that the PCA components reflect number-specific processing rather than general task factors like perceptual processing, the type of decisions that has to be made, the way responses are collected etc. In support of this idea, it is important to note that the pattern of loadings obtained in the PCA fits closer the theoretical interpretations derived from previously found dissociations and associations, than just task differences. For example, the asymmetry index of the distance-effect and the magnitude comparison SNARC-effect, which are obtained from the same task and data are not assigned to the same component, which would have been expected if the PCA would have extracted general task differences.
In conclusion, the results of the present study show that the MNL is insufficient to capture the variety of number–space interactions measured across different tasks. Instead of one single underlying representation associated with external space, the present study shows that at least two additional independent components, related to spatial and verbal working memory, are characterizing the internal structure of the “number–space.” How other tasks and effects (e.g., Rossetti et al., 2004; Stoianov et al., 2008; Salillas et al., 2009; Cattaneo et al., 2011; Kramer et al., 2011) that are assumed to be related to number–space interactions are situated with respect to the presently identified components is a matter of further investigation and cannot be determined a priori. We are convinced however that the components described in the present study can be considered as a first step toward a new unitary framework for understanding of the relation between numerical and spatial processing in general.
Conflict of Interest Statement
The authors declare that the research was conducted in the absence of any commercial or financial relationships that could be construed as a potential conflict of interest.
Acknowledgments
We like to express our gratitude toward Tom Verguts, Qi Chen, Massimo Silvetti, and Klaus Willmes for their useful comments and discussion during data collection and on early versions of the manuscript and toward Sophie Antoine for her contribution in the data collection. This work was supported by grant P6/29 from Interuniversitary Attraction Poles program of the Belgian federal government and by the Ghent University Multidisciplinary Research Partnership “The integrative neuroscience of behavioral control.”
Footnote
- ^The distance-effect in magnitude comparison is the observation that reaction times linearly increase in function of the distance of the to-be-compared number to the used reference number (see, e.g., Moyer and Landauer, 1967).
References
Anderson, B. (1993). Spared awareness for the left side of internal visual images in patients with left-sided extrapersonal neglect. Neurology 43, 213–216.
Cattaneo, Z., Fantino, M., Silvanto, J., Vallar, G., and Vecchi, T. (2011). Tapping effects on numerical bisection. Exp. Brain Res. 208, 21–28.
Cavezian, C., Rossetti, Y., Danckert, J., D’amato, T., Dalery, J., and Saoud, M. (2007). Exaggerated leftward bias in the mental number line of patients with schizophrenia. Brain Cogn. 63, 85–90.
Chen, Q., and Verguts, T. (2010). Beyond the mental number line: a neural network model of number-space interactions. Cogn. Psychol. 60, 218–240.
Corbetta, M., and Shulman, G. L. (2002). Control of goal-directed and stimulus-driven attention in the brain. Nat. Rev. Neurosci. 3, 201–215.
Dehaene, S., Bossini, S., and Giraux, P. (1993). The mental representation of parity and number magnitude. J. Exp. Psychol. Gen. 122, 371–396.
Dehaene, S., Piazza, M., Pinel, P., and Cohen, L. (2003). Three parietal circuits for number processing. Cogn. Neuropsychol. 20, 487–506.
Doricchi, F., Guariglia, P., Gasparini, M., and Tomaiuolo, F. (2005). Dissociation between physical and mental number line bisection in right hemisphere brain damage. Nat. Neurosci. 8, 1663–1665.
Doricchi, F., Merola, S., Aiello, M., Guariglia, P., Bruschini, M., Gevers, W., Gasparini, M., and Tomaiuola, F. (2009). Spatial orienting biases in the decimal numeral system. Curr. Biol. 19, 682–687.
Fias, W., Brysbaert, M., Geypens, F., and D’ydewalle, G. (1996). The importance of magnitude information in numerical processing: evidence from the SNARC effect. Math. Cogn. 2, 95–110.
Fias, W., and Fischer, M. H. (2005). “Spatial representation of number,” in Handbook of Mathematical Cognition, ed. J. I. D. Campbell (Hove: Psychology Press), 43–54.
Fias, W., Van Dijck, J.-P., and Gevers, W. (2011). “How number is associated with space? The role of working memory,” in Space, Time and Number in the Brain: Searching for the Foundations of Mathematical Thought, eds S. Dehaene, and E. M. Brannon (Amsterdam: Elsevier), 133–148.
Fischer, M. H., Castel, A. D., Dodd, M. D., and Pratt, J. (2003). Perceiving numbers causes spatial shifts of attention. Nat. Neurosci. 6, 555–556.
Gevers, W., Santens, S., Dhooge, E., Chen, Q., Fias, W., and Verguts, T. (2010). Verbal-spatial and visuo-spatial coding of number-space interactions. J. Exp. Psychol. Gen. 139, 180–190.
Gevers, W., Verguts, T., Reynvoet, B., Caessens, B., and Fias, W. (2006). Numbers and space: a computational model of the SNARC effect. J. Exp. Psychol. Hum. Percept. Perform. 32, 32–44.
Gobel, S. M., Calabria, M., Farne, A., and Rossetti, Y. (2006). Parietal rTMS distorts the mental number line: simulating ‘spatial’ neglect in healthy subjects. Neuropsychologia 44, 860–868.
Guariglia, C., Padovani, A., Pantano, P., and Pizzamiglio, L. (1993). Unilateral neglect restricted to visual-imagery. Nature 364, 235–237.
Halligan, P., Fink, G., Marchall, J., and Vallar, G. (2003). Spatial cognition: evidence from visual neglect. Trends Cogn. Sci. 7, 125–133.
Herrera, A., Macizo, P., and Semenza, C. (2008). The role of working memory in the association between number magnitude and space. Acta Psychol. (Amst) 128, 225–237.
Hubbard, E. M., Piazza, M., Pinel, P., and Dehaene, S. (2005). Interactions between number and space in parietal cortex. Nat. Rev. Neurosci. 6, 435–448.
Jager, G., and Postma, A. (2003). On the hemispheric specialization for categorical and coordinate spatial relations: a review of the current evidence. Neuropsychologia 41, 504–515.
Jarque, C. M., and Bera, A. K. (1987). A test for normality of observations and regression residuals. Int. Stat. Rev. 55, 163–172.
Jewell, G., and McCourt, M. E. (2000). Pseudoneglect: a review and meta-analysis of performance factors in line bisection tasks. Neuropsychologia 38, 93–110.
Kramer, P., Stoianov, I., Umiltà, C., and Zorzi, M. (2011). Interactions between perceptual and numerical space. Psychon. Bull. Rev. 18, 722–728.
Loetscher, T., and Brugger, P. (2009). Random number generation in neglect patients reveals enhanced response stereotypy, but no neglect in number space. Neuropsychologia 47, 276–279.
Loetscher, T., Nocholls, M. E., Towse, N. J., Bradshaw, J. L., and Brugger, P. (2010). Lucky numbers: spatial neglect affects physical, but not representational, choices in a Lotto task. Cortex 46, 685–690.
Longo, M. R., and Lourenco, S. F. (2007). Spatial attention and the mental number line: evidence for characteristic biases and compression. Neuropsychologia 45, 1400–1407.
Looney, S. W. (1995). How to use tests for univariate normality to assess multivariate normality. Am. Stat. 49, 64–70.
Lorch, R. F., and Myers, J. L. (1990). Regression-analyses of repeated measures data in cognitive research. J. Exp. Psychol. Learn. Mem. Cogn. 16, 149–157.
MacCallum, R. C., Zhang, S., Preacher, K. J., and Rucker, D. D. (2002). On the practice of dichotomization of quantitative variables. Psychol. Methods 7, 19–40.
Marshall, J. C., and Halligan, P. W. (1989). When right goes left – an investigation of line bisection in a case of visual neglect. Cortex 25, 503–515.
Michel, C., Cavezian, C., D’amato, T., Dalery, J., Rode, G., Saoud, M., and Rossetti, Y. (2007). Pseudoneglect in schizophrenia: a line bisection study with cueing. Cogn. Neuropsychiatry 12, 222–234.
Moyer, R. S., and Landauer, T. K. (1967). Time required for judgements of numerical inequality. Nature 215, 1519–1520.
Pia, L., Corazzini, L. L., Folegatti, A., Gindri, P., and Cauda, F. (2009). Mental number line disruption in a right-neglect patient after a left-hemisphere stroke. Brain Cogn. 69, 81–88.
Priftis, K., Zorzi, M., Meneghello, F., Marenzi, R., and Umiltà, C. (2006). Explicit versus implicit processing of representational space in neglect: dssociations in accessing the mental number line. J. Cogn. Neurosci. 18, 680–688.
Proctor, R. W., and Cho, Y. S. (2006). Polarity correspondence: a general principle for performance of speeded binary classification tasks. Psychol. Bull. 132, 416–442.
Raykov, T., and Marcoulides, G. A. (2008). An Introduction to Applied Multivariate Analysis. New York, NY: Lawrence Erlbaum Associates, Inc.
Rossetti, Y., Jacquin-Courtois, S., Rode, G., Ota, H., Michel, C., and Boisson, D. (2004). Does action make the link between number and space representation? Visuo-manual adaptation improves number bisection in unilateral neglect. Psychol. Sci. 15, 426–430.
Rusconi, E., Bueti, D., Walsh, V., and Butterworth, B. (2011). Contribution of frontal cortex to the spatial representation of number. Cortex 47, 2–13.
Salillas, E., Basso, D., Baldi, M., Semenza, C., and Vecchi, T. (2009). Motion on numbers: transcranial magnetic stimulation on the ventral intraparietal sulcus alters both numerical and motion processes. J. Cogn. Neurosci. 21, 2129–2138.
Santens, S., and Gevers, W. (2008). The SNARC effect does not imply a mental number line. Cognition 108, 263–270.
Schenkenberg, T., Bradford, D. C., and Ajax, E. T. (1980). Line bisection and unilateral visual neglect in patients with neurologic impairment. Neurology 30, 509–517.
Stoianov, I., Kramer, P., Umiltà, C., and Zorzi, M. (2008). Visuospatial priming of the mental number line. Cognition 106, 770–779.
Umiltà, C., Priftis, K., and Zorzi, M. (2009). The spatial representation of numbers: evidence from neglect and pseudoneglect. Exp. Brain Res. 192, 561–569.
Vallar, G., and Perani, D. (1986). The anatomy of unilateral neglect after right-hemisphere stroke lesions – a clinical ct-scan correlation study in man. Neuropsychologia 24, 609–622.
van Dijck, J.-P., and Fias, W. (2011). A working memory account for spatial numerical associations. Cognition 119, 114–119.
van Dijck, J.-P., Gevers, W., and Fias, W. (2009). Numbers are associated with different types of spatial information depending on the task. Cognition 113, 248–253.
van Dijck, J.-P., Gevers, W., Lafosse, C., Doricchi, F., and Fias, W. (2011). Non-spatial neglect for the mental number line. Neuropsychologia 49, 2570–2583.
Vuilleumier, P., Ortigue, S., and Brugger, P. (2004). The number space and neglect. Cortex 40, 399–410.
Keywords: numbers, space, attention, working memory, SNARC, neuropsychology
Citation: van Dijck J-P, Gevers W, Lafosse C and Fias W (2012) The heterogeneous nature of number–space interactions. Front. Hum. Neurosci. 5:182. doi: 10.3389/fnhum.2011.00182
Received: 13 September 2011; Accepted: 19 December 2011;
Published online: 10 January 2012.
Edited by:
Filip Van Opstal, Ghent University, BelgiumReviewed by:
Konstantinos Priftis, University of Padova, ItalyQi Chen, Moss Rehabilitation Research Institute, USA
Silke Melanie Goebel, University of York, UK
Copyright: © 2012 van Dijck, Gevers, Lafosse and Fias. This is an open-access article distributed under the terms of the Creative Commons Attribution Non Commercial License, which permits non-commercial use, distribution, and reproduction in other forums, provided the original authors and source are credited.
*Correspondence: Jean-Philippe van Dijck, Department of Experimental Psychology, Ghent University, H. Dunantlaan 2, B-9000 Ghent, Belgium. e-mail: jeanphilippe.vandijck@ugent.be