Temporal evolution of gamma activity in human cortex during an overt and covert word repetition task
- 1Department of Biomedical Engineering, Washington University in St. Louis, St. Louis, MO, USA
- 2Department of Neurological Surgery, School of Medicine, Washington University in St. Louis, St. Louis, MO, USA
- 3Brain-Computer Interface R&D Program, Wadsworth Center, New York State Department of Health, Albany, NY, USA
- 4Department of Neurology, Albany Medical College, Albany, NY, USA
- 5Department of Biomedical Engineering, Rensselaer Polytechnic Institute, Troy, NY, USA
- 6Department of Biomedical Sciences, State University of New York, Albany, NY, USA
- 7Department of Computer Science, Washington University in St. Louis, St. Louis, MO, USA
- 8Center for Innovation in Neuroscience and Technology, Washington University in St. Louis, St. Louis, MO, USA
Several scientists have proposed different models for cortical processing of speech. Classically, the regions participating in language were thought to be modular with a linear sequence of activations. More recently, modern theoretical models have posited a more hierarchical and distributed interaction of anatomic areas for the various stages of speech processing. Traditional imaging techniques can only define the location or time of cortical activation, which impedes the further evaluation and refinement of these models. In this study, we take advantage of recordings from the surface of the brain [electrocorticography (ECoG)], which can accurately detect the location and timing of cortical activations, to study the time course of ECoG high gamma (HG) modulations during an overt and covert word repetition task for different cortical areas. For overt word production, our results show substantial perisylvian cortical activations early in the perceptual phase of the task that were maintained through word articulation. However, this broad activation is attenuated during the expressive phase of covert word repetition. Across the different repetition tasks, the utilization of the different cortical sites within the perisylvian region varied in the degree of activation dependent on which stimulus was provided (auditory or visual cue) and whether the word was to be spoken or imagined. Taken together, the data support current models of speech that have been previously described with functional imaging. Moreover, this study demonstrates that the broad perisylvian speech network activates early and maintains suprathreshold activation throughout the word repetition task that appears to be modulated by the demands of different conditions.
Introduction
Understanding the temporal dynamics of speech processing has been a topic of intense scientific interest for over a century. Speech processing has been studied using different types of neuroimaging [e.g., using positron emission tomography (PET) or functional magnetic resonance imaging (fMRI)], neurophysiological functional mapping [e.g., magnetoencephalography (MEG), electrocorticography (ECoG)], lesional models, or behavioral studies (Price et al., 1996; Fiez and Petersen, 1998; Crone et al., 2001a; Dronkers et al., 2004; Sinai et al., 2005; Pulvermuller et al., 2006; Towle et al., 2008). These and other studies have shown that speech processing involves a widely distributed network of cortical areas that are located predominantly in peri-sylvian regions (Scott and Johnsrude, 2003; Specht and Reul, 2003). These regions include the superior temporal gyrus/sulcus, angular gyrus/supramarginal gyrus (i.e., Wernicke's area), posterior inferior frontal regions (i.e., Broca's area), and motor and premotor regions (Fiez and Petersen, 1998; Heim et al., 2002; Duffau et al., 2003; Billingsley-Marshall et al., 2007; Towle et al., 2008). How these sites interact to accomplish the multiple stages of spectral, acoustic, phonological, semantic, and motoric processing of human language remains is still studied today.
Several models have been proposed to explain the functional relevance and the interplay of these regions in accomplishing speech perception and production. Classically, the regions participating in language processing were thought to be modular in nature, namely, that certain cognitive operations (i.e., auditory, phonological, semantic, and motor preparation/execution) have specific circumscribed regions and interactions occur in hierarchical progression (Binder, 2000). Binder et al. proposed a hierarchical model that projects from the dorsal superior temporal gyrus ventrally to the superior temporal sulcus and the middle temporal gyrus, and then posteriorly to the angular gyrus and anteriorly to the temporal pole (Binder et al., 2000). This long-standing model has been supported by stroke studies dating back to the nineteenth century and by many recent brain imaging studies (Lichtheim, 1885; Price, 2000). More recently, modern theoretical models of language processing have emerged that posit a more distributed interaction of anatomic areas for the various stages of speech processing (Pulvermuller, 2005; Hickok and Poeppel, 2007). A fundamental difficulty in the assessment of these models has been the limitations of traditional functional neuroimaging and electrophysiological techniques. These techniques have either high spatial resolution (e.g., fMRI) or high temporal resolution (e.g., EEG or MEG) but not both (Boulton et al., 1990; Srinivasan et al., 1998; Freeman et al., 2003). Moreover, the cognitive process of speech is primarily a human phenomenon, thereby limiting practical utility of intracortical microelectrode recordings, which have proven useful in the study of other cortical functions in animal models.
A growing number of recent studies have taken advantage of recordings from the surface of the brain (ECoG) in human epilepsy patients (Figure 1). In these patients, electrodes are implanted subdurally on the cortical surface to localize seizure foci and eloquent cortex, and thus provide a unique opportunity to directly evaluate the cortical physiology of important functions such as human speech processing. ECoG combines relatively high spatial resolution (5–10 mm inter-electrode distance) with millisecond temporal resolution. In addition, because ECoG is recorded beneath the skull, it can detect a range of physiological phenomena, some of which are relatively inconspicuous on the scalp, in particular in single trials (Boulton et al., 1990; Srinivasan et al., 1998; Freeman et al., 2003). Of particular note, variations in the amplitude in high frequencies (i.e., >70 Hz) of ECoG signals, also known as high gamma (HG) activity, have consistently been demonstrated to reflect important details of cortical processing (Crone et al., 1998; Leuthardt et al., 2007; Ray et al., 2008). Moreover, gamma activity has been closely linked with single-neuron action potential firing and fMRI bold signal changes (Foucher et al., 2003; Manning et al., 2009). Recent studies have begun to utilize ECoG to assess the spatiotemporal characteristics of speech perception and expression (Crone et al., 1998, 2001a,b; Hart et al., 1998; Ray et al., 2003; Canolty et al., 2007; Brown et al., 2008; Towle et al., 2008; Chang et al., 2010; Edwards et al., 2010; Wu et al., 2010). These studies have shown that HG activity demonstrates robust changes associated with perception and expression. Summing data across human subjects has proven quite useful in identifying more generalized characteristics about cortical processing. This has been successfully implemented in human motor physiology (Miller et al., 2007). As of yet, however, the population-averaged temporal evolution of gamma activity has not been derived for a simple language task.
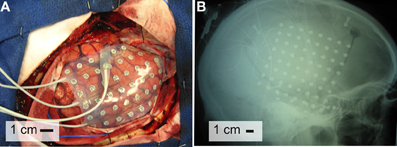
Figure 1. (A) Exemplar electrode array on the surface of the brain. (B) Electrodes as seen on a lateral skull radiograph.
To better define the interplay of the cortical regions that participate in the perception and production of speech, we evaluated how gamma activity changes while performing a simple overt and covert word repetition task. To do this, we studied eight patients with left hemispheric intracranial electrode arrays. Each patient repeated a word that was presented as either an auditory or visual cue. Anatomic regions known to be associated with the processing of language were selected. These included the middle superior temporal gyrus (mSTG), posterior superior temporal gyrus (pSTG), posterior middle temporal gyrus (pMTG), angular gyrus (Wernicke's area, WA), posterior inferior frontal gyrus (Broca's area, BA), primary motor cortex (M1), and premotor cortex (PM). Changes in HG activity in these areas were defined and related to the timing of cue presentation and subsequent word articulation.
In summary, our study reveals the temporal sequence of cortical activations as reflected by classic HG amplitude modulations. Specifically, our results show that subsequent to the reception of the cue, perisylvian regions are substantially co-activated during the perception of language. This occurs regardless of the type of cue (i.e., auditory or visual). For the overt tasks, all the perisylvian regions appear to be actively involved throughout the temporal evolution of perception to expression. While performing a covert expression, however, dorsal temporal regions and perirolandic cortex appear to take on a more dominant role. Taken together, the data supports previous findings of the early and sustained role that the perisylvian cortex plays in both the perceptual and expressive phases of speech.
Methods
Subjects
The subjects in this study were eight patients with intractable epilepsy who underwent temporary placement of subdural electrode arrays to localize seizure foci prior to surgical resection (see Figure 1 for an example). They included three men and five women (see Table 1 for additional information). All gave informed consent for the study, which was approved by the Institutional Review Board of the Washington University School of Medicine and the Human Research Protections Office of the U.S. Army Medical Research and Materiel Command. Each patient had an electrode grid (15, 48, or 64 contacts) placed over fronto-parietal-temporal regions (see Figure 2 for details). These grids consisted of flat electrodes with an exposed diameter of 2.3 mm and an inter-electrode distance of 1 cm, and were implanted for approximately 1 week. The electrodes for all subjects were localized over the left hemisphere; four of the subjects had coverage of the temporal lobe. Grid placement and duration of ECoG monitoring were based solely on the requirements of the clinical evaluation without any consideration of this study. Following placement of the subdural grid, each patient had postoperative anterior-posterior and lateral radiographs to verify grid location.
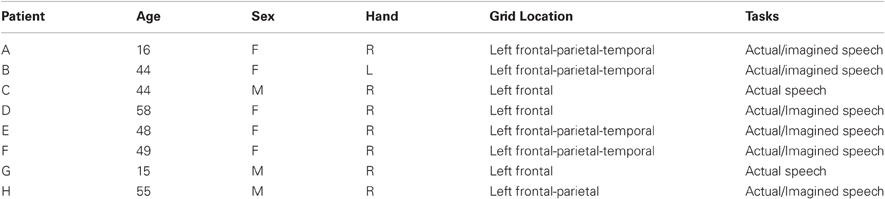
Table 1. Clinical profiles.
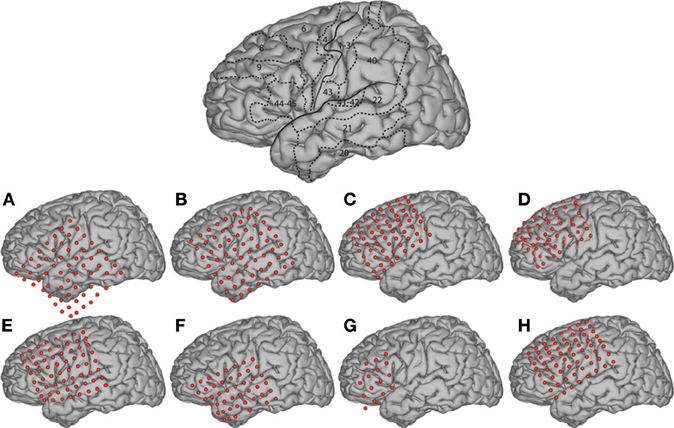
Figure 2. Electrode locations. The brain template on the top highlights the location of the central sulcus and Sylvian fissure, and also outlines the approximate location of relevant Brodmann areas.
Experimental Paradigm
During the study, each subject was in a semi-recumbent position in a hospital bed about 1 m from a video screen. In separate experimental runs, ECoG was recorded during four different conditions: word repetition using overt or covert speech in response to visual or auditory word stimuli (Figure 3). Visual/auditory stimuli consisted of 36 words that were presented on a video monitor or through headphones, respectively. These words were monosyllables with consonant-vowel-consonant (CVC) structure and were either consonant matched (i.e., contained one of nine consonant pairs) or vowel matched (i.e., contained one of four vowels). In each trial, the subject was randomly presented with one of the words either visually or auditorily. In different runs, the subject's task was to overtly or covertly repeat the presented word. Visual stimuli were displayed on the screen for 4 s, followed by a break of 0.5 s during which the screen was blank (i.e., 4.5 s per trial). For the auditory conditions, the total trial duration was identical, but the duration of the auditory stimuli varied with the different words (i.e., mean 0.53 s, standard deviation 0.09 s).
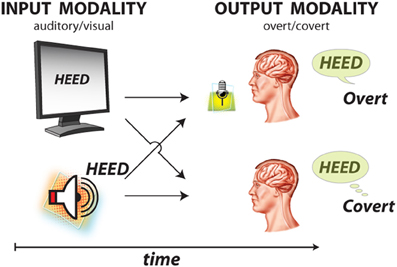
Figure 3. Experimental paradigm with four conditions. Subjects were presented with 1 of 36 words using two sensory/input odalities: visual and auditory stimulus presentation. Subjects were asked to respond using two output modalities: overt and covert word repetition.
Data Collection
In all experiments, we recorded ECoG from the electrode grid using the general-purpose BCI2000 software (Schalk et al., 2004) that was connected to five g.USBamp amplifier/digitizer systems (g.tec, Graz, Austria). Simultaneous clinical monitoring was achieved using a connector that split the cables coming from the patient into one set that was connected to the clinical monitoring system and another set that was connected to the BCI2000/g.USBamp system. Thus, at no time was clinical care or clinical data collection affected. All electrodes were referenced to an inactive electrode that was intracranial, but faced the skull rather than the brain. In a subset of subjects (subject B, D, E, F, H), the verbal response was recorded using a microphone; in the remaining subjects, speech onset was detected using the g.TRIGbox (g.tec, Graz, Austria). The ECoG signals and microphone signal were amplified, bandpass filtered (0.15–500 Hz), digitized at 1200 Hz, and stored by BCI2000. We collected 2–7 experimental runs of ECoG from each patient for each of the four conditions during one or two sessions. Each run included 36 trials (140 trials total per condition, on average). All eight subjects participated in the experiments using overt word repetition; a subset of six subjects participated in experiments using covert word repetition. Each dataset was visually inspected and all artifactual channels were removed prior to analysis.
Anatomical Mapping
We used lateral skull radiographs to identify the stereotactic coordinates of each grid electrode with software (Miller et al., 2007) that duplicated the manual procedure described in (Fox et al., 1985). We defined cortical areas using Talairach's Co-Planar Stereotaxic Atlas of the Human Brain (Talairach and Tournoux, 1988) and a Talairach transformation (Lancaster et al., 2000) (http://www.talairach.org). We obtained a 3D cortical brain model from source code provided on the AFNI SUMA website (http://afni.nimh.nih.gov/afni/suma). Finally, we projected each patient's electrode locations on this 3D brain model using a custom Matlab program. The standard error for localization with this type of methodology has been reported to be less than 3 mm (Miller et al., 2007).
Data Analysis
We first re-referenced the signal from each electrode using a common average reference (CAR) montage. To do this, we obtained the CAR-filtered signal S′h at channel h.
H was the total number of channels and Sh was the original signal sample at a particular time (Marple, 1987; Schalk et al., 2007).
Every 10 ms, we converted the time-series ECoG signals of the previous 167 ms into the frequency domain with an autoregressive model (Marple, 1987) of order 25. Using this model, we calculated the spectral amplitudes between 70 and 170 Hz in 2 Hz bins. With a window size of 167 ms, the temporal precision of the frequency estimates was ±83 ms. We then averaged these spectral amplitudes within this band, excluding the 116–124 Hz band, which produced a time course of HG power for each electrode. To determine the task-related difference in ECoG HG power, we calculated for each electrode the coefficient of determination (r2) (Wonnacott and Wonnacott, 1977) between the two distributions of ECoG HG power associated with a particular task (e.g., overt word repetition in response to visual presentation) and rest. This analysis determined, for a particular experimental task, location, and time point, the statistical difference between task and rest. (see Figure 4 for examples of the time-frequency distribution of r2 values for two locations in subject A). Values of r2 indicates how much of the variance in ECoG HG power can be explained by a particular task. Thus, as an example, if the amplitude increased in the HF every time the speech task was performed, the coefficient of determination would be 1 (r2 = 1). If the amplitude increased only some of the time that the speech task was performed, the coefficient of determination (r2) would be reduced but larger than 0 (Leuthardt et al., 2007; Miller et al., 2007; Pei et al., 2010).
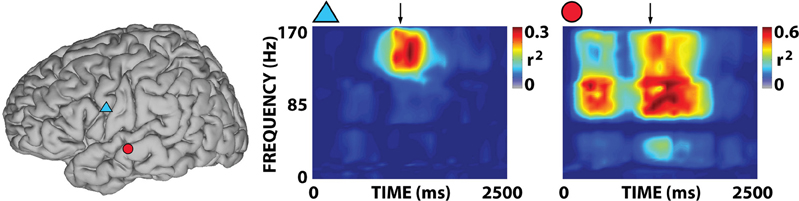
Figure 4. Examples of representative r2 time-frequency distributions for overt word repetition in response to auditory stimulation for subject A. The two time-frequency distributions were calculated for the corresponding locations indicated by symbols in the brain on the left. Arrows mark the onset of the subject's response. Activations are mostly focused on the gamma band.
Given these time courses of r2 values at each location, we then determined the average time course of r2 for different cortical areas that have been shown to be involved in speech processing. These areas were Premotor area [PM, Brodmann's Area (BA) 6], primary motor area (M1, BA4), middle superior temporal gyrus (mSTG, middle portion of BA22), posterior superior temporal gyrus (pSTG, BA41+42), Broca's Area (BA44+45), Angular gyrus—Wernicke's area (WA, BA39+40) and also posterior middle temporal gyrus (pMTG, posterior part of BA21), and are shown in Figure 5. To calculate the r2 time course for each area, we first identified all electrodes in the particular area according to their Talairach coordinates, and then averaged r2 time courses for all electrodes in that area. Each region had electrode contributions from at least four subjects. It is important to note here that the electrode locations are determined by lateral skull radiographs to identify the stereotactic coordinates of each grid electrode using automated software (Miller et al., 2007) which invariably leads to several millimeters of variance in the anatomic localization. Thus, there is likely to be some degree of ambiguity of cortical localization and some overlap in areas once they are aggregated across subjects. At the same time, the areas that we selected were much larger than this expected localization error; thus, our results should provide meaningful temporal trends of cortical activation for these areas. To determine which r2 values (i.e., which task-related ECoG activations) were statistically different from rest, we first randomly reshuffled the labels for task and rest and calculated the r2 between speech and rest. We then repeated this process 5000 times to generate a distribution of random r2 values. We then determined the significance level as the r2 value that was at the 99.7th percentile of that distribution (p = 0.03). Thus, each of the four conditions resulted in different significance thresholds that were used to produce Figures 6 and 7.
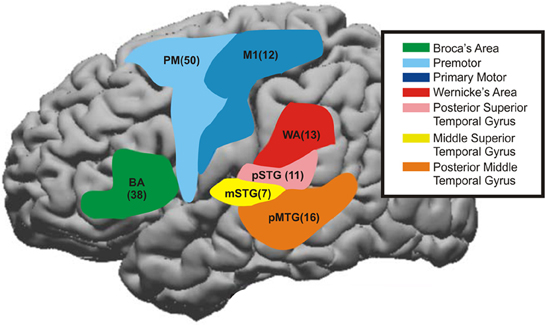
Figure 5. The time course for cortical areas that have been shown to be involved in speech processing were summated across patients. These areas were Premotor area [PM, Brodmann's Area (BA) 6], primary motor area (M1, BA4), middle superior temporal gyrus (mSTG, middle portion of BA22), posterior superior temporal gyrus (pSTG, BA41+42), Broca's Area (BA44+45), Angular gyrus—Wernicke's area (WA, BA39+40) and also posterior middle temporal gyrus (pMTG, posterior part of BA21). The number in parentheses represents the number of electrodes taken from these regions across patients. The color maps are the approximate regions of these electrode locations on a stereotactic brain.
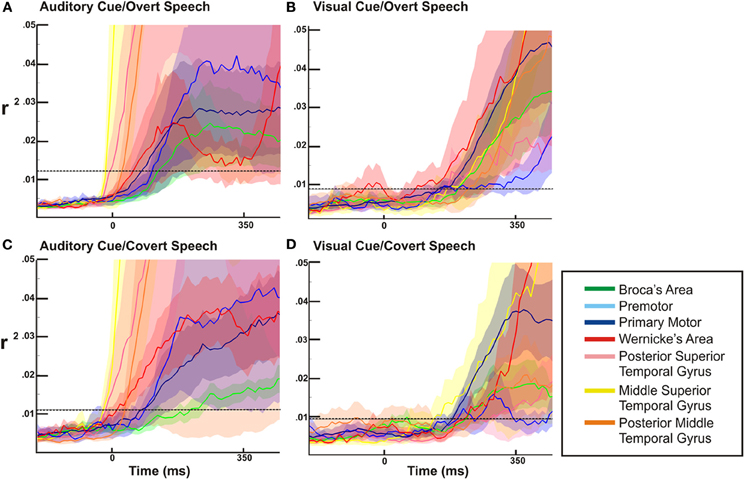
Figure 6. ECoG high gamma r2 time courses as a function of time relative to auditory or visual stimulation. The dotted line represents the statistical threshold for significance (p < 0.03). In all four conditions (auditory/visual cues and overt/covert speech) there is a widespread activation of all sites early in the perceptual phase of the task.
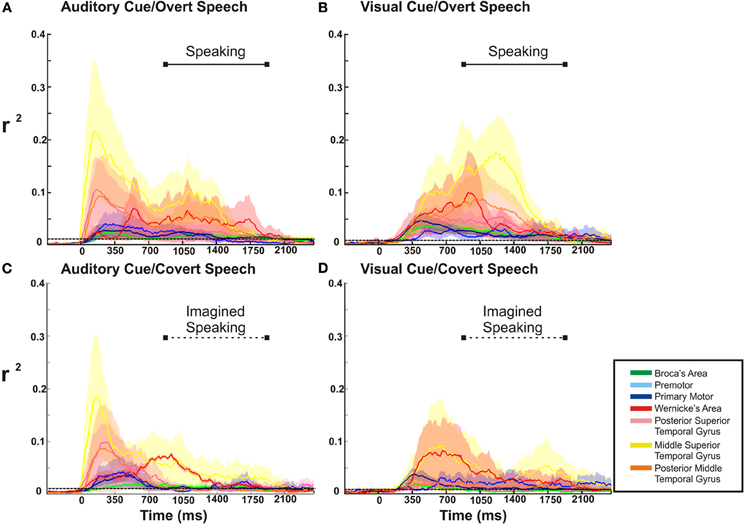
Figure 7. ECoG high gamma r2 time courses throughout the whole task period (0 represents the time of stimulus presentation). In the over speech conditions, the barred solid horizontal line in the upper quadrant of each figure represents the mean time duration of voice recorded speech. This time duration of speaking is replicated for the covert speech condition, as represented by the barred dotted line. The dotted line spanning each figure represents the statistical threshold for significance (p < 0.03). In all conditions there is a substantial temporal overlap of cortical activation throughout the perceptual and expressive phases of the tasks.
In addition, we calculated the temporal envelopes of the auditory stimuli and the subject's verbal response. To calculate the temporal envelope of the auditory stimuli, we first squared the amplitude of the time course of the auditory stimulus for each word. Then, we applied to each of these squared amplitude time courses a low pass filter (cut-off frequency 6 Hz, Butterworth IIR filter of order 3) to extract the temporal envelope of each word stimulus. Finally, we normalized each temporal envelope by its maximum and averaged those envelopes across all 36 words. The resulting average time course of the auditory stimuli indicated their general onset, offset, and duration. We applied the same procedure to determine the average verbal response from the microphone recordings, which indicated the onset, offset, and duration of word production.
Results
Onset of Cortical Activation During Word Repetition Task
We first characterized the ECoG activations early after presentation of the stimuli (Figures 6 and 8). The results presented in these figures show that, with both the auditory and visual cues and with both overt and covert conditions, statistically significant ECoG activations occurred in all speech-associated areas that we interrogated (i.e., all had statistically significant r2 values during the perceptual phase of the word repetition task).
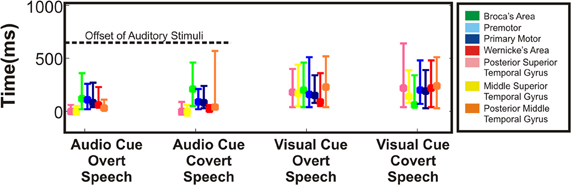
Figure 8. Variability in onset of cortical activation. Timing of statistically significant cortical activations in terms of onset (earliest time at which site achieved significance) was averaged across all regions and across all patients. Height of the bar represents mean time of onset for the respective regions. Error bars represent standard error. Onset of all interrogated cortical regions showed activations within the perceptual phase of the stimulus presentation. The dashed line represents the offset of the auditory stimulus.
Trends in Cortical Activation Through Word Repetition Task
We next defined the activation time courses across the entire word repetition task to identify trends in cortical activation throughout the perceptual and expressive phase of the word repetition task. The perceptual phase of the task was defined as the first 500 ms subsequent to stimulus presentation, which encompassed the time of auditory presentation of all cues. This was also in keeping with the time duration of perceptual activations defined by previous ECoG and MEG studies that reported onset and peak activation between 100 and 400 ms, respectively (Rogers et al., 1990; Halgren et al., 2002; Marinkovic et al., 2003; Canolty et al., 2007). The expressive phase was defined as 795–1923 ms after stimulus presentation for the visually cued task and 866–1923 ms after stimulus presentation for the auditory cued task. Visually cued expressive phase preceded auditory cued expression by 173 ms. The expressive phases were derived from the recorded microphone data of the overt speech tasks. The period of time in which the recorded volume was greater than 20% the maximum volume was considered to be speech. The same time periods were also used for the covert tasks.
For the overt tasks, we found a prolonged cortical activation of nearly all cortical sites through the perceptual and expressive phase of the task (Figures 7A,B). Distinct between the visual and auditory cued task, dorsal temporal lobe (mSTG and pSTG) showed a very large activation early in the perceptual phase of activation with the auditory cue, while this region activated much later with the visual cue (i.e., during the expressive phase of the task). For the covert speech condition (Figures 7C,D), all cortical regions demonstrated activations during the perceptual phase of the visual or auditory cued task. The expressive portion of the covert speech task was different from the overt conditions. When a visual cue was presented, there was a more prominent activation of dorsal and posterior regions of the temporal lobe and rolandic cortex (WA, M1, and pMTG) through the expressive phase of covert articulation. With auditory cues, the pattern was somewhat different. There was a more prominent temporal activation (WA) activation early in the expressive phase with a subsequent prominent activation of the rolandic cortex (M1) in the mid-portion of the expressive phase of the task. The other cortical sites showed a lower level of activation that were still statistically significant.
Variability of Activation for Different Cortical Regions
Across cortical regions, the variability in timing of onset of cortical activation and relative cortical activation was defined across the four different speech tasks. As mentioned previously, the majority of mean cortical activation onset times occurred early within the first 500 ms. Thus, regardless of task, all perisylvian areas activated during the perceptual phase of the task (Figure 8). Given the substantial temporal overlap of cortical activation after onset, we defined the cortical activation as a ratio of total cortical activation at any given time to better define the changing level of contribution of a given region during the speech task. Thus, the magnitude of cortical activation (as measured by statistically significant r2 of HG power changes) for a given region was defined relative to the other sites over time for each of the four tasks (Figure 9). Thus, the activation of one region (as defined by the average statistically significant r2 from all subjects) could be defined as a percentage relative to the total cortical activation (the sum of all statistically significant r2 values at all regions across all patients for a given point in time). As an all or none phenomenon, there is substantial temporal overlap for cortical activation through all the tasks. When viewed relative to other activations, however, there is an alteration in contributing activation over time. There were several notable variations (Figure 9A). First, mSTG and pSTG (in yellow and pink) have different levels of contribution to total cortical activation in the early perceptual phase (0–350 ms after cue) through the auditory and visual cued overt speech tasks. In the auditory condition, there was a larger representation of cortical activity (approx. 60–100%) that accounts for the total cortical activation. This was reduced in the visual condition (Figure 9B) to approximately 30–40%. Second, in the overt speaking conditions, when speaking after an auditory cue there was a larger representation of WA (approx. 50%) and an absence of PM activity when compared to visual cued overt activations (15% and present, respectively). Conversely, for visual cued overt speech, there was a larger representation of mSTG (50% vs. 35%) when compared to auditory cued overt speech. Third, when overt and covert speech are compared there is a larger representation of mSTG, PM, and WA in the latter half of the imagined speaking as compared to actual speaking.
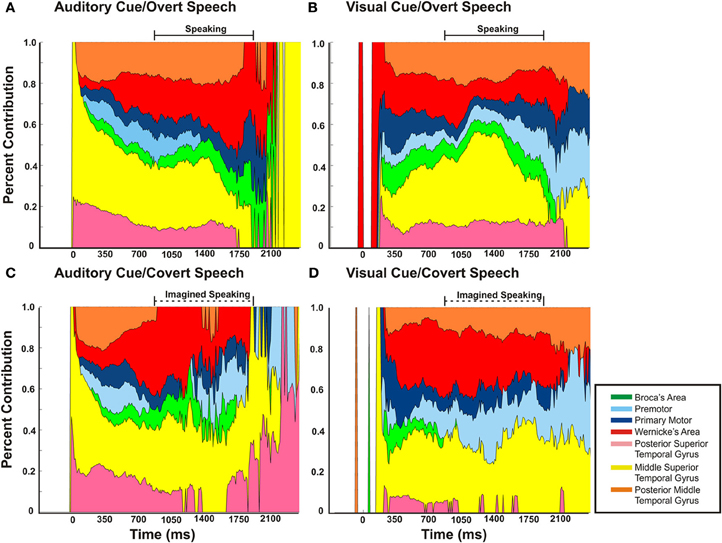
Figure 9. The magnitude of cortical activation for a given region relative to the other sites over time for each of the four conditions. The activation of one region [as defined by the average of statistically significant r2 (p < 0.03) from all subjects] is defined as percentage relative to the total cortical activation (the sum of all statistically significant r2 values at all regions across all patients for a given point in time). The barred solid horizontal line represents the mean time duration of voice recorded speech. This time duration of speaking is replicated to the covert speech condition, as represented by the barred dotted line. Though there is substantial coactivation of perisylvian cortical regions during a speech task, the proportion of a given region varies with the task.
Discussion
In this study, we characterized ECoG HG activity changes across multiple human subjects that performed a simple overt and covert word repetition task to better define the temporal evolution of speech-related cortical changes in relevant areas of cortex. We found that during visually and auditory cued overt word repetition, there was substantial perisylvian cortical activation early in the perceptual phase of the task, and this activation was maintained through the expressive portion of the word articulation. However, This broad activation was attenuated during the expressive phase of covert word repetition. Across the different repetition tasks, the utilization of the different cortical sites within the perisylvian region varied to a more limited degree by modality of stimuli and type of articulation. The pattern of activation was dependent on which stimulus was provided (auditory or visual) and whether the word was to be overtly or covertly spoken.
Relationship to Existing Timing Literature
Generally, the results of this study confirm and supplement previous studies performed to analyse the temporal evolution of cortical activity during various word repetition tasks (Canolty et al., 2007; Dalal et al., 2009; Chang et al., 2010; Edwards et al., 2010; Steinschneider et al., 2011). Beyond ECoG analysis, the number of studies on the temporal analysis of speech perception and expression in humans has utilized MEG, which detects magnetic dipoles associated with synaptic transmission in the cortical sulci (Babiloni et al., 2009; Pulvermuller and Shtyrov, 2009). From a perceptual standpoint, all sounds have been thought to activate middle and pSTG at approximately 100 ms after stimulus (Rogers et al., 1990). When listening to words and sentences, there is a sustained activation that starts at 200 ms after the stimulus, reaches a maximum at 400 ms, and is sustained until approximately 600–800 ms post stimulus (Halgren et al., 2002; Marinkovic et al., 2003). However, using ECoG, Canolty et al showed that pSTG showed somewhat earlier activation with word specific processing at 120 ms that subsequently progressed to mid-superior temporal gyrus at 200 ms post stimulus auditory stimuli (Canolty et al., 2007). Since this was a specific word to non-word comparison this was the earliest activation associated with semantic and phonological processing. Our current study demonstrates that onset of significant activation in temporal regions occurs still earlier within the first 0–40 ms of stimulus onset, which likely represents the earliest acoustic related activations (Figure 6). Notably, in addition to temporal areas activating early, so to do other frontal regions (BA, M1, PM) activate early within the first 200 ms. These areas remain active throughout the perceptual and expressive phase of auditory word perception for overt repetition, and become more attenuated during the expressive phase of covert repetition (Figure 7). Generally, this same phenomenon is true with visual reading of words as well, with some notable caveats. The summated coverage across all patients was largely frontal and temporal. Thus, the earliest MEG activations associated with basic visual feature analysis detected in the occipital lobe at 100 ms and subsequent left lateralized activations in the occipital temporal junction at 150 ms after stimulus (Tarkiainen et al., 1999, 2002) could not be verified in our study. Reading comprehension has been posited to occur in the left superior temporal cortex at approximately 200–600 ms (Simos et al., 1997; Helenius et al., 1998; Halgren et al., 2002; Pylkkanen and Marantz, 2003). In this study, onset of activation occurred in dorsal temporal lobe (regions labeled WA, mSTG, pSTG) within the first 200 ms. This activation, as with auditory stimuli, was not specific to these regions, but was rather associated with a general activation of all perisylvian areas (Buckner et al., 2000). Also, similar to the auditory condition, there was a maintained cortical activation throughout word articulation, which was reduced to primarily posterior dorsal temporal lobe (i.e., area labeled Wernicke's area) and rolandic cortex during covert word expression. The earlier and broader nature of cortical findings that seem to be present in both this study and those found by others (Canolty et al., 2007) likely resides in the signal substrate being evaluated. Even though signals at high frequencies have been detected using EEG and MEG (Lenz et al., 2008), and even though it has been argued that MEG is more sensitive to high frequencies than EEG (Gruber et al., 2008), the analyses most commonly performed using EEG or MEG rely on frequency components below 40 Hz. This is in contrast to the present study, where we study the temporal progression of activations in the gamma band. These different frequency ranges represent distinct physiological phenomena. Rhythms at frequencies below 40 Hz are thought to represent inter-regional communication in the brain (e.g., the mu rhythm that can be detected over sensorimotor cortex, which is thought to be produced by thalamocortical circuits). These low-frequency rhythms tend to have relatively broad cortical distributions (Pfurtscheller and Aranibar, 1977; Pfurtscheller, 1989, 1992, 1999). Amplitudes in higher frequencies (i.e., gamma activity, >40 Hz) are thought to be associated with local neural activation underneath the electrode (Crone et al., 2006; Leuthardt et al., 2007; Miller et al., 2007; Ray et al., 2008). They also tend to have a more focused spatial distribution than do low-frequency rhythms (Chen and Herrmann, 2001; Miller et al., 2007). Thus, the differences between the two modalities may represent the timing differences between intrinsic cortical changes (seen in ECoG detected gamma changes) versus the modulation of cortex by deeper structures (which were likely detected by earlier studies using MEG).
Modality and Task-Dependent Findings
A number of functional MRI studies (Buckner et al., 2000; Carpentier et al., 2001; Braze et al., 2011) have defined the dependence of stimulus modality on topographic cortical activation during speech processing. Similarly, a number of studies have also compared overt versus covert speech articulation (Palmer et al., 2001; Shuster and Lemieux, 2005; Christoffels et al., 2007). To date, only a few studies have compared the temporal relationship of these different regional activations relative to the stimuli or to the output [e.g., (Pei et al., 2010)]. With regard to stimulus modality, similar to results presented by studies by Braze et al. and Carpentier et al., there appears to be a significant degree of modality independence in the timing profiles of HG activation between the visual and auditory cue. One notable feature is the early activation of all regions in the perisylvian network. While the auditory cue appears to be slightly earlier, all regions were significantly active within 500 ms. Notably, this included Broca's area. This early activation of Broca's area supports the notion that modality-independent abstract linguistic representations are created quite early in perception. Once active all these regions remained significantly active through the expressive phase of the task. These same trends held true of covert speech articulations as well. An important caveat to these similarities is the degree to which a region was active relative to others (i.e., the difference between “active—not active” versus level of activation). While the majority of perisylvian regions were statistically above threshold throughout the task, some regions showed more substantial and consistent activations than other regions depending on the stage of cognitive operation. As an example there was a much higher level of HG amplitude modulation in the superior temporal gyrus early during auditory cue (relative to other regions) than with the visual cue, which occurred later during the overt speaking phase. Thus taken together, while there is a substantial degree of modality independence (visual vs. auditory) and task independence (overt vs. covert) for whether the perisylvian network is active or not active (i.e., on or off) there is some modality dependence on the degree to which it is active over time.
Clinical Relevance
The relative similarity in the temporal activations, which appear to be substantially modality independent, could also have implications in the use of HG changes as a clinical technique for brain mapping. The use of HG changes has been proposed as a potential adjunct to current techniques in neurosurgical brain mapping (Sinai et al., 2005; Crone et al., 2006; Leuthardt et al., 2007; Wu et al., 2010). The identification of eloquent cortex prior to resection has been important in reducing the risk of morbidity following surgery (Berger et al., 1989; Burchiel et al., 1989; Keles et al., 2004). Due to the inter-individual variability in the anatomic location of language areas, the mapping of these speech areas is especially critical (Price et al., 1996; Srinivasan et al., 1998; Pulvermuller, 2005). To date, electrocortical stimulation (ECS) is considered the current “gold standard” for clinical localization. However, ECS mapping is inefficient (sample one anatomic site at time) and can be hampered by the induction of seizures, which can be clinically dangerous (Blume et al., 2004). Given these constraints, an additional approach to defining speech cortex is the use of ECoG signals that capture the endogenous cortical activations associated with a particular speech task. These signals can be acquired without the risk of seizures and can interrogate a broad region of cortex simultaneously. Several studies to date have attempted to use this approach to map speech cortex and compare those findings to the results derived using ECS mapping (Sinai et al., 2005; Wu et al., 2010). Thus far, the results have been mixed. Specifically, the sensitivity and specificity of HG changes predicting a stimulation positive site has varied considerably across studies. A proposed explanation for this variability has been the different nature of the experimental paradigms (auditory repetition vs. visual reading vs. picture naming). The findings in this study would argue against that possibility if speech network activation is highly modality-independent. Another possible explanation is that a single HG band (70–170 Hz) cannot sufficiently capture the full complexity of cortical activity. As suggested by Gaona et al. (2011), gamma sub-bands may be necessary to more fully capture the impact of differing cognitive operations.
Relation to Current Models of Language Processing
The broadly co-activated behavior of the perisylvian regions that varies over time could provide evidence to integrate the theories put forward by the Pulvermuller group and by the Hickock and Poeppel group (Pulvermuller, 2005; Hickok and Poeppel, 2007). The early activation of all the perisylvian regions within the early perceptual phase of cue presentation supports the associative network theory described by Pulvermuller. Pulvermuller asserts that the semantic lexicon is implemented by an associative network of activity where distinct neuronal assemblies represent different word and word classes. All word types, however, share a perisylvian assembly. More specific subclasses integrate regions outside this core network. Certainly, the early activation of all areas of the perisylvian network shown in this study would be consistent with that assertion. At the same time, the variable nature of these cortical activations over time could also facilitate an integration with some of the proposed theories put forward by supporters of a dual stream model of speech processing. In the auditory cued task, when the ratio of cortical activation is examined, there is clearly an early temporal cortical activation that is dominant. This would be consistent with assertions from Hickock and Peoppel and others that there is an early spectrotemporal analysis that involves the superior spectrotemporal plane (i.e., STG and superior temporal sulcus) (Hickok and Poeppel, 2004). However, it is important to note that, though dominant in early perception, this area is not exclusively activated. Taken together, some of the differences proposed by groups such as Pulvermuller and Hickock and Poeppel may be a matter of threshold. A high threshold for detecting cortical activations would show only early activations in STG, whereas a low threshold would show the entire perisylvian apparatus. Thus, rather than it being one or the other, the model supported here using cortical electrophysiology is one in which there is altering cortical prominence of contributing members of a broadly engaged network. What will be prominent and when varies to a degree depending on the stimulus and on the linguistic output.
Limitations
Though the findings of this study reveal temporal details of cortical activations for distinct cortical areas, which have been difficult or impossible to acquire with other modalities, there are several limitations to this work that merit discussion. It is important to note that the patients recruited from this study are patients with intractable epilepsy who have been on chronic anti-epileptic medications. Anti-epileptic medications can alter normal cortical physiology (Clemens et al., 2006). Averaging across a number of subjects should aid in reducing any individual abnormality that could potentially skew the results. In addition to variability in the cortical physiology due to individual pharmacologic effects, there may also be inter-subject variability of functional localization (Ojemann et al., 1989). This subject-specific anatomic variance could create overlap of timescales that are an artifact of mixing different functional sites. The techniques used in this study were similar to those employed previous ECoG studies, such as (Miller et al., 2007), which summated data across a high number of patients from a similar clinical population for the purpose of mapping cortical physiology as it related to simple motor movements. Given that motor localization is subject to the same inter-subject variability, the results demonstrated localization and timescales similar to that identified in other functional and primate models. Thus, despite the limitations described above, we posit that consolidated information for speech should provide similar generalizable results. Finally, the cognitive paradigm employed in this study was a simple word repetition task. This approach may not strongly engage higher semantic processing. Even if this study only explicitly tested acoustic and phonologic processing, this does not change the fundamental finding that there is a broad cortical activation of cortex with significantly overlapping time courses to accomplish this task.
Conclusion
In this study, we examined the evolving changes of ECoG gamma power as a marker of focal cortical activation during an overt and covert word repetition task that was either cued with an auditory or visual stimulus. We find that there is substantial co-activation of the entire perisylvian apparatus during the perceptual phase that is maintained through overt expression and differentially activated during covert expression. This level of regional activation within the network varied by stimulus, expression, and time.
Conflict of Interest Statement
The authors declare that the research was conducted in the absence of any commercial or financial relationships that could be construed as a potential conflict of interest.
Acknowledgments
We would like to thank our patients for their efforts, without which this research would not have been possible. This work was supported by: James S. McDonnell Foundation; Higher Brain Function; Department of Defense (No. W911NF-07-1-0415 and W911NF-08-1-0216); National Institutes of Health (No. R01-EB000856-06); and the Children's Discovery Institute.
References
Babiloni, C., Pizzella, V., Gratta, C. D., Ferretti, A., and Romani, G. L. (2009). Fundamentals of electroencefalography, magnetoencefalography, and functional magnetic resonance imaging. Int. Rev. Neurobiol. 86, 67–80.
Berger, M. S., Kincaid, J., Ojemann, G. A., and Lettich, E. (1989). Brain mapping techniques to maximize resection, safety, and seizure control in children with brain tumors. Neurosurgery 25, 786–792.
Billingsley-Marshall, R. L., Clear, T., Mencl, W. E., Simos, P. G., Swank, P. R., Men, D., Sarkari, S., Castillo, E. M., and Papanicolaou, A. C. (2007). A comparison of functional MRI and magnetoencephalography for receptive language mapping. J. Neurosci. Methods 161, 306–313.
Binder, J. R., Frost, J. A., Hammeke, T. A., Bellgowan, P. S., Springer, J. A., Kaufman, J. N., and Possing, E. T. (2000). Human temporal lobe activation by speech and nonspeech sounds. Cereb. Cortex 10, 512–528.
Blume, W. T., Jones, D. C., and Pathak, P. (2004). Properties of after-discharges from cortical electrical stimulation in focal epilepsies. Clin. Neurophysiol. 115, 982–989.
Boulton, A. A., Baker, G. B., and Vanderwolf, C. H. (1990). Neurophysiological Techniques, II: Applications to Neural Systems, Clifton, NJ: Humana Press.
Braze, D., Mencl, W. E., Tabor, W., Pugh, K. R., Constable, R. T., Fulbright, R. K., Magnuson, J. S., Van Dyke, J. A., and Shankweiler, D. P. (2011). Unification of sentence processing via ear and eye: an fMRI study. Cortex 47, 416–431.
Brown, E. C., Rothermel, R., Nishida, M., Juhasz, C., Muzik, O., Hoechstetter, K., Sood, S., Chugani, H. T., and Asano, E. (2008).In vivo animation of auditory-language-induced gamma-oscillations in children with intractable focal epilepsy. Neuroimage 41, 1120–1131.
Buckner, R. L., Koutstaal, W., Schacter, D. L., and Rosen, B. R. (2000). Functional MRI evidence for a role of frontal and inferior temporal cortex in amodal components of priming. Brain 123 (Pt 3), 620–640.
Burchiel, K. J., Clarke, H., Ojemann, G. A., Dacey, R. G., and Winn, H. R. (1989). Use of stimulation mapping and corticography in the excision of arteriovenous malformations in sensorimotor and language-related neocortex. Neurosurgery 24, 322–327.
Canolty, R. T., Soltani, M., Dalal, S. S., Edwards, E., Dronkers, N. F., Nagarajan, S. S., Kirsch, H. E., Barbaro, N. M., and Knight, R. T. (2007). Spatiotemporal dynamics of word processing in the human brain. Front. Neurosci. 1, 185–196.
Carpentier, A., Pugh, K. R., Westerveld, M., Studholme, C., Skrinjar, O., Thompson, J. L., Spencer, D. D., and Constable, R. T. (2001). Functional MRI of language processing: dependence on input modality and temporal lobe epilepsy. Epilepsia 42, 1241–1254.
Chang, E. F., Edwards, E., Nagarajan, S. S., Fogelson, N., Dalal, S. S., Canolty, R. T., Kirsch, H. E., Barbaro, N. M., and Knight, R. T. (2010). Cortical spatio-temporal dynamics underlying phonological target detection in humans. J. Cogn. Neurosci. 23, 1437–1446.
Chen, A. C., and Herrmann, C. S. (2001). Perception of pain coincides with the spatial expansion of electroencephalographic dynamics in human subjects. Neurosci. Lett. 297, 183–186.
Christoffels, I. K., Formisano, E., and Schiller, N. O. (2007). Neural correlates of verbal feedback processing: an fMRI study employing overt speech. Hum. Brain Mapp. 28, 868–879.
Clemens, B., Menes, A., Piros, P., Bessenyei, M., Altmann, A., Jerney, J., Kollar, K., Rosdy, B., Rozsavolgyi, M., Steinecker, K., and Hollody, K. (2006). Quantitative EEG effects of carbamazepine, oxcarbazepine, valproate, lamotrigine, and possible clinical relevance of the findings. Epilepsy Res. 70, 190–199.
Crone, N. E., Boatman, D., Gordon, B., and Hao, L. ((2001a)). Induced electrocorticographic gamma activity during auditory perception. Brazier Award-winning article, 2001. Clin. Neurophysiol. 112, 565–582.
Crone, N. E., Hao, L., Hart, J. Jr. Boatman, D., Lesser, R. P., Irizarry, R., and Gordon, B. (2001b). Electrocorticographic gamma activity during word production in spoken and sign language. Neurology 57, 2045–2053.
Crone, N. E., Miglioretti, D. L., Gordon, B., and Lesser, R. P. (1998). Functional mapping of human sensorimotor cortex with electrocorticographic spectral analysis. II. Event-related synchronization in the gamma band. Brain 121 (Pt 12), 2301–2315.
Crone, N. E., Sinai, A., and Korzeniewska, A. (2006). High-frequency gamma oscillations and human brain mapping with electrocorticography. Prog. Brain Res. 159, 275–295.
Dalal, S. S., Baillet, S., Adam, C., Ducorps, A., Schwartz, D., Jerbi, K., Bertrand, O., Garnero, L., Martinerie, J., and Lachaux, J. P. (2009). Simultaneous MEG and intracranial EEG recordings during attentive reading. Neuroimage 45, 1289–1304.
Dronkers, N. F., Wilkins, D. P., Van Valin, R. D. Jr., Redfern, B. B., and Jaeger, J. J. (2004). Lesion analysis of the brain areas involved in language comprehension. Cognition 92, 145–177.
Duffau, H., Capelle, L., Denvil, D., Gatignol, P., Sichez, N., Lopes, M., Sichez, J. P., and Van Effenterre, R. (2003). The role of dominant premotor cortex in language: a study using intraoperative functional mapping in awake patients. Neuroimage 20, 1903–1914.
Edwards, E., Nagarajan, S. S., Dalal, S. S., Canolty, R. T., Kirsch, H. E., Barbaro, N. M., and Knight, R. T. (2010). Spatiotemporal imaging of cortical activation during verb generation and picture naming. Neuroimage 50, 291–301.
Fiez, J. A., and Petersen, S. E. (1998). Neuroimaging studies of word reading. Proc. Natl. Acad. Sci. U.S.A. 95, 914–921.
Foucher, J. R., Otzenberger, H., and Gounot, D. (2003). The BOLD response and the gamma oscillations respond differently than evoked potentials: an interleaved EEG-fMRI study. BMC Neurosci. 4, 22.
Fox, P. T., Perlmutter, J. S., and Raichle, M. E. (1985). A stereotactic method of anatomical localization for positron emission tomography. J. Comput. Assist. Tomogr. 9, 141–153.
Freeman, W. J., Holmes, M. D., Burke, B. C., and Vanhatalo, S. (2003). Spatial spectra of scalp EEG and EMG from awake humans. Clin. Neurophysiol. 114, 1053–1068.
Gaona, C., Sharma, M., Freudenburg, Z., Breshears, J., Bundy, D., Roland, J., Barbour, D., Schalk, G., and Leuthardt, E. (2011). Nonuniform high-gamma (60–500 Hz) power changes dissociate cognitive task and anatomy in human cortex. J. Neurosci. 31, 2091–2100.
Gruber, T., Maess, B., Trujillo-Barreto, N. J., and Muller, M. M. (2008). Sources of synchronized induced Gamma-Band responses during a simple object recognition task: a replication study in human MEG. Brain Res. 1196, 74–84.
Halgren, E., Dhond, R. P., Christensen, N., Van Petten, C., Marinkovic, K., Lewine, J. D., and Dale, A. M. (2002). N400-like magnetoencephalography responses modulated by semantic context, word frequency, and lexical class in sentences. Neuroimage 17, 1101–1116.
Hart, J. Jr. Crone, N. E., Lesser, R. P., Sieracki, J., Miglioretti, D. L., Hall, C., Sherman, D., and Gordon, B. (1998). Temporal dynamics of verbal object comprehension. Proc. Natl. Acad. Sci. U.S.A. 95, 6498–6503.
Heim, S., Opitz, B., and Friederici, A. D. (2002). Broca's area in the human brain is involved in the selection of grammatical gender for language production: evidence from event-related functional magnetic resonance imaging. Neurosci. Lett. 328, 101–104.
Helenius, P., Salmelin, R., Service, E., and Connolly, J. F. (1998). Distinct time courses of word and context comprehension in the left temporal cortex. Brain 121 (Pt 6), 1133–1142.
Hickok, G., and Poeppel, D. (2004). Dorsal and ventral streams: a framework for understanding aspects of the functional anatomy of language. Cognition 92, 67–99.
Hickok, G., and Poeppel, D. (2007). The cortical organization of speech processing. Nat. Rev. Neurosci. 8, 393–402.
Keles, G. E., Lundin, D. A., Lamborn, K. R., Chang, E. F., Ojemann, G., and Berger, M. S. (2004). Intraoperative subcortical stimulation mapping for hemispherical perirolandic gliomas located within or adjacent to the descending motor pathways: evaluation of morbidity and assessment of functional outcome in 294 patients. J. Neurosurg. 100, 369–375.
Lancaster, J. L., Woldorff, M. G., Parsons, L. M., Liotti, M., Freitas, C. S., Rainey, L., Kochunov, P. V., Nickerson, D., Mikiten, S. A., and Fox, P. T. (2000). Automated Talairach atlas labels for functional brain mapping. Hum. Brain Mapp. 10, 120–131.
Lenz, D., Jeschke, M., Schadow, J., Naue, N., Ohl, F. W., and Herrmann, C. S. (2008). Human EEG very high frequency oscillations reflect the number of matches with a template in auditory short-term memory. Brain Res. 1220, 81–92.
Leuthardt, E. C., Miller, K. J., Anderson, N., Schalk, G., Dowling, J., Moran, D., Miller, J., and Ojemann, J. G. (2007). Electrocorticographic frequency alteration mapping (EFAM), a novel clinical technique for mapping motor cortex. Neurosurgery 60, 260–271.
Manning, J. R., Jacobs, J., Fried, I., and Kahana, M. J. (2009). Broadband shifts in local field potential power spectra are correlated with single-neuron spiking in humans. J. Neurosci. 29, 13613–13620.
Marinkovic, K., Dhond, R. P., Dale, A. M., Glessner, M., Carr, V., and Halgren, E. (2003). Spatiotemporal dynamics of modality-specific and supramodal word processing. Neuron 38, 487–497.
Marple, S. L. (1987). Digital Spectral Analysis: With Applications. Englewood Cliffs, NJ: Prentice Hall.
Miller, K. J., Leuthardt, E. C., Schalk, G., Rao, R. P., Anderson, N. R., Moran, D. W., Miller, J. W., and Ojemann, J. G. (2007). Spectral changes in cortical surface potentials during motor movement. J. Neurosci. 27, 2424–2432.
Miller, K. J., Makeig, S., Hebb, A. O., Rao, R. P., den Nijs, M., and Ojemann, J. G. (2007). Cortical electrode localization from X-rays and simple mapping for electrocorticographic research: the “Location on Cortex” (LOC) package for MATLAB. J. Neurosci. Methods 162, 303–308.
Ojemann, G., Ojemann, J., Lettich, E., and Berger, M. (1989). Cortical language localization in left, dominant hemisphere. An electrical stimulation mapping investigation in 117 patients. J. Neurosurg. 71, 316–326.
Palmer, E. D., Rosen, H. J., Ojemann, J. G., Buckner, R. L., Kelley, W. M., and Petersen, S. E. (2001). An event-related fMRI study of overt and covert word stem completion. Neuroimage 14, 182–193.
Pei, X., Leuthardt, E. C., Gaona, C. M., Brunner, P., Wolpaw, J. R., and Schalk, G. (2010). Spatiotemporal dynamics of electrocorticographic high gamma activity during overt and covert word repetition. Neuroimage 54, 2960–2972.
Pfurtscheller, G. (1989). Functional topography during sensorimotor activation studied with event-related desynchronization mapping. J. Clin. Neurophysiol. 6, 75–84.
Pfurtscheller, G. (1992). Event-related synchronization (ERS): an electrophysiological correlate of cortical areas at rest. Electroencephalogr. Clin. Neurophysiol. 83, 62–69.
Pfurtscheller, G. (1999). Event-Related Desynchronization (ERD) and Event Related Synchronization (ERS). Baltimore, MD: Williams and Wilkins.
Pfurtscheller, G., and Aranibar, A. (1977). Event-related cortical desynchronization detected by power measurements of scalp EEG. Electroencephalogr. Clin. Neurophysiol. 42, 817–826.
Price, C. J. (2000). The anatomy of language: contributions from functional neuroimaging. J. Anat. 197 (Pt 3), 335–359.
Price, C. J., Wise, R. J., Warburton, E. A., Moore, C. J., Howard, D., Patterson, K., Frackowiak, R. S., and Friston, K. J. (1996). Hearing and saying. The functional neuro-anatomy of auditory word processing. Brain 119 (Pt 3), 919–931.
Pulvermuller, F. (2005). Brain mechanisms linking language and action. Nat. Rev. Neurosci. 6, 576–582.
Pulvermuller, F., and Shtyrov, Y. (2009). Spatiotemporal signatures of large-scale synfire chains for speech processing as revealed by MEG. Cereb. Cortex 19, 79–88.
Pulvermuller, F., Shtyrov, Y., Ilmoniemi, R. J., and Marslen-Wilson, W. D. (2006). Tracking speech comprehension in space and time. Neuroimage 31, 1297–1305.
Pylkkanen, L., and Marantz, A. (2003). Tracking the time course of word recognition with MEG. Trends Cogn. Sci. 7, 187–189.
Ray, S., Crone, N. E., Niebur, E., Franaszczuk, P. J., and Hsiao, S. S. (2008). Neural correlates of high-gamma oscillations (60–200 Hz) in macaque local field potentials and their potential implications in electrocorticography. J. Neurosci. 28, 11526–11536.
Ray, S., Jouny, C. C., Crone, N. E., Boatman, D., Thakor, N. V., and Franaszczuk, P. J. (2003). Human ECoG analysis during speech perception using matching pursuit: a comparison between stochastic and dyadic dictionaries. IEEE Trans. Biomed. Eng. 50, 1371–1373.
Rogers, R. L., Papanicolaou, A. C., Baumann, S. B., Saydjari, C., and Eisenberg, H. M. (1990). Neuromagnetic evidence of a dynamic excitation pattern generating the N100 auditory response. Electroencephalogr. Clin. Neurophysiol. 77, 237–240.
Schalk, G., Kubánek, J., Miller, K. J., Anderson, N. R., Leuthardt, E. C., Ojemann, J. G., Limbrick, D., Moran, D., Gerhardt, L. A., and Wolpaw, J. R. (2007). Decoding two-dimensional movement trajectories using electrocorticographic signals in humans. J. Neural Eng. 4, 264–275.
Schalk, G., McFarland, D. J., Hinterberger, T., Birbaumer, N., and Wolpaw, J. R. (2004). BCI2000, a general-purpose brain-computer interface (BCI) system. IEEE Trans. Biomed. Eng. 51, 1034–1043.
Scott, S. K., and Johnsrude, I. S. (2003). The neuroanatomical and functional organization of speech perception. Trends Neurosci. 26, 100–107.
Shuster, L. I., and Lemieux, S. K. (2005). An fMRI investigation of covertly and overtly produced mono- and multisyllabic words. Brain Lang. 93, 20–31.
Simos, P. G., Basile, L. F., and Papanicolaou, A. C. (1997). Source localization of the N400 response in a sentence-reading paradigm using evoked magnetic fields and magnetic resonance imaging. Brain Res. 762, 29–39.
Sinai, A., Bowers, C. W., Crainiceanu, C. M., Boatman, D., Gordon, B., Lesser, R. P., Lenz, F. A., and Crone, N. E. (2005). Electrocorticographic high gamma activity versus electrical cortical stimulation mapping of naming. Brain 128, 1556–1570.
Specht, K., and Reul, J. (2003). Functional segregation of the temporal lobes into highly differentiated subsystems for auditory perception: an auditory rapid event-related fMRI-task. Neuroimage 20, 1944–1954.
Srinivasan, R., Nunez, P. L., and Silberstein, R. B. (1998). Spatial filtering and neocortical dynamics: estimates of EEG coherence. IEEE Trans. Biomed. Eng. 45, 814–826.
Steinschneider, M., Nourski, K. V., Kawasaki, H., Oya, H., Brugge, J. F., and Howard, M. A. 3rd. (2011). Intracranial study of speech-elicited activity on the human posterolateral superior temporal gyrus. Cereb. Cortex. 21, 2332–2347.
Talairach, J., and Tournoux, I. P. (1988). Co-Planar Sterotaxic Atlas of the Human Brain. New York, NY: Thieme Medical Publishers.
Tarkiainen, A., Cornelissen, P. L., and Salmelin, R. (2002). Dynamics of visual feature analysis and object-level processing in face versus letter-string perception. Brain 125, 1125–1136.
Tarkiainen, A., Helenius, P., Hansen, P. C., Cornelissen, P. L., and Salmelin, R. (1999). Dynamics of letter string perception in the human occipitotemporal cortex. Brain 122 (Pt 11), 2119–2132.
Towle, V. L., Yoon, H. A., Castelle, M., Edgar, J. C., Biassou, N. M., Frim, D. M., Spire, J. P., and Kohrman, M. H. (2008). ECoG gamma activity during a language task: differentiating expressive and receptive speech areas. Brain 131, 2013–2027.
Keywords: cortex, electrocorticography, gamma rhythms, human, speech
Citation: Leuthardt EC, Pei X-M, Breshears J, Gaona C, Sharma M, Freudenberg Z, Barbour D and Schalk G (2012) Temporal evolution of gamma activity in human cortex during an overt and covert word repetition task. Front. Hum. Neurosci. 6:99. doi: 10.3389/fnhum.2012.00099
Received: 24 January 2012; Paper pending published: 24 February 2012;
Accepted: 05 April 2012; Published online: 03 May 2012.
Edited by:
Hans-Jochen Heinze, University of Magdeburg, GermanyReviewed by:
Christoph S. Herrmann, Carl von Ossietzky University, GermanyAlexandra Golby, Harvard Medical School, USA
Copyright: © 2012 Leuthardt, Pei, Breshears, Gaona, Sharma, Freudenberg, Barbour and Schalk. This is an open-access article distributed under the terms of the Creative Commons Attribution Non Commercial License, which permits non-commercial use, distribution, and reproduction in other forums, provided the original authors and source are credited.
*Correspondence: Eric C. Leuthardt, Department of Neurosurgery, School of Medicine, Washington University in St. Louis, Campus Box 8057, 660 South Euclid, St. Louis, MO 63130, USA. e-mail: leuthardte@wustl.edu