Dynamic Correlations between Intrinsic Connectivity and Extrinsic Connectivity of the Auditory Cortex in Humans
 Zhuang Cui1,2†
  Qian Wang1,3†
  Yayue Gao3
  Jing Wang1 Mengyang Wang1 Pengfei Teng1 Yuguang Guan1 Jian Zhou1 Tianfu Li1,4
  Guoming Luan1,4*
  Liang Li3,4*
- 1Beijing Key Laboratory of Epilepsy, Epilepsy Center, Department of Functional Neurosurgery, Sanbo Brain Hospital, Capital Medical University, Beijing, China
- 2Beijing Hospital, Beijing, China
- 3School of Psychological and Cognitive Sciences and Beijing Key Laboratory of Behavior and Mental Health, Key Laboratory of Machine Perception (Ministry of Education), Peking University, Beijing, China
- 4Beijing Institute for Brain Disorders, Beijing, China
The arrival of sound signals in the auditory cortex (AC) triggers both local and inter-regional signal propagations over time up to hundreds of milliseconds and builds up both intrinsic functional connectivity (iFC) and extrinsic functional connectivity (eFC) of the AC. However, interactions between iFC and eFC are largely unknown. Using intracranial stereo-electroencephalographic recordings in people with drug-refractory epilepsy, this study mainly investigated the temporal dynamic of the relationships between iFC and eFC of the AC. The results showed that a Gaussian wideband-noise burst markedly elicited potentials in both the AC and numerous higher-order cortical regions outside the AC (non-auditory cortices). Granger causality analyses revealed that in the earlier time window, iFC of the AC was positively correlated with both eFC from the AC to the inferior temporal gyrus and that to the inferior parietal lobule. While in later periods, the iFC of the AC was positively correlated with eFC from the precentral gyrus to the AC and that from the insula to the AC. In conclusion, dual-directional interactions occur between iFC and eFC of the AC at different time windows following the sound stimulation and may form the foundation underlying various central auditory processes, including auditory sensory memory, object formation, integrations between sensory, perceptional, attentional, motor, emotional, and executive processes.
Introduction
In humans, passive listening to sound stimuli activates both the auditory cortex (AC) and some cortical regions that do not belong to the typical auditory system (Ackermann et al., 2001; Brown et al., 2004; Londei et al., 2007). Listening to either speech or music sounds not only initializes the bottom-up and top-down signal propagations between the early-stage AC and the association AC (Fontolan et al., 2014; Potes et al., 2014) and those between the association AC and the inferior frontal cortex (Potes et al., 2014), but also activates both the superior and inferior regions of ventral motor cortex (Cheung et al., 2016) and the posterior part of the superior temporal gyrus (STG) and the precentral gyrus (PreG) (Potes et al., 2012). These reports suggest that the AC both sends bottom-up signals to and receives top-down signals from higher-order cortical regions that underlie various auditory processes, such as speech and music perception. Also, cortical auditory activity can be enhanced by both top-down endogenous interpretation (Iversen et al., 2009) and attentional processing (Sussman et al., 2002; Debener et al., 2003), leading to task-specific response plasticity of the AC (Polley et al., 2006). Thus, investigation of the temporal dynamics of signal propagations between the AC and its connected cortical regions (even under passive listening conditions) is critical for understanding the cortical mechanism underlying auditory processing.
Intracranial electroencephalographic (EEG) recordings have been used for investigating neural mechanisms underlying auditory processing with both a high spatial resolution and a high temporal resolution (Lachaux et al., 2007; Edwards et al., 2009; Sinai et al., 2009; Korzeniewska et al., 2011; Mesgarani and Chang, 2012; Pasley et al., 2012; Mesgarani et al., 2014; Nourski and Howard, 2015). Importantly, intracranial EEG recordings can be used for clarifying the direction of signal propagations across brain regions. However, studies using intracranial EEG recordings in humans to examine the temporal dynamic of signal propagations between the AC and its connected cortical regions have rarely been reported.
Although both the bottom-up and top-down processes can be triggered automatically by a sound and play a role in exchanging information between the AC and non-auditory regions (O’Connor, 2012; Sohoglu et al., 2012), it is not clear how extrinsic functional connectivity (eFC) between the AC and higher-order non-AC cortices is associated with intrinsic functional connectivity (iFC) within the AC.
One of the core questions about brain networks is how different networks cooperate during perceptual/cognitive processing (Bressler and Menon, 2010). If investigation of interactions between the inter-regional bottom-up eFC and top-down eFC is critical for understanding the mechanisms underlying perceptual/cognitive processing (Pardo et al., 1991; Corbetta et al., 2000; Alain et al., 2001; Serences et al., 2005; Bonte et al., 2006; Buschman and Miller, 2007; Budinger et al., 2008; Chiu and Yantis, 2009; Elhilali et al., 2009; Salmi et al., 2009; Chica et al., 2011; Fontolan et al., 2014), it is even more critical for understanding these mechanisms to investigate the relationship between iFC and eFC of sensory cortices (Ghazanfar and Schroeder, 2006; Buschman and Miller, 2007; Bressler and Menon, 2010; Fontolan et al., 2014).
Bidirectional interactions have been discovered between the primary AC and the associate AC (Fontolan et al., 2014). iFC of the AC is important for spectro-temporal analyses, feature extraction/integration, and learning-induced reorganization (Griffiths and Warren, 2002; Eggermont, 2007; Gourévitch and Eggermont, 2010). It is of interest to know whether iFC of the AC both bottom-up modulates higher-order non-auditory cortices and is top-down modulated by the high-order cortices.
In this study, using simultaneously recorded, multiple intracranial stereo-electroencephalographic (sEEG) recordings, we examined the dynamic pattern of correlation between iFC of the AC and either bottom-up eFC from the AC to higher-order cortices or top-down eFC from higher-order cortices toward the AC. The directionality and strength of iFC and eFC were examined by Granger causality (GC) analyses using broadband electrophysiological signals. The test-retest reliability were also examined for further clinical applications. The hypothesis of this study is that iFC within the AC may be associated with not only bottom-up eFC from the AC to some higher-order non-auditory cortices but also top-down eFC from certain higher-order non-auditory cortices to the AC. More in detail, in the earlier time windows after the sound onset, iFC of the AC may be more associated with out-going eFC with higher-order non-auditory cortices, but in the later time windows, iFC of the AC may be more associated with in-coming top-down eFC from higher-order auditory cortices.
Materials and Methods
Participants
Ten people suffering from drug-refractory (pharmaco-resistant) epilepsy (3 females and 7 males, aged from 15 to 28 years old; mean = 22.7 years, SD = 4.1 years, see in Table 1), who were recruited in the Sanbo Hospital of Capital Medical University, participated in this study. The participants were undergoing long-term invasive sEEG monitoring to identify their seizure foci. All the participants had normal pure-tone hearing thresholds between 0.125 and 4 kHz (confirmed by tuning-fork tests, Tschiassny, 1946) and provided informed consent for their participation. The experimental procedures were approved by the Ethics Committee of the Sanbo Hospital of Capital Medical University.
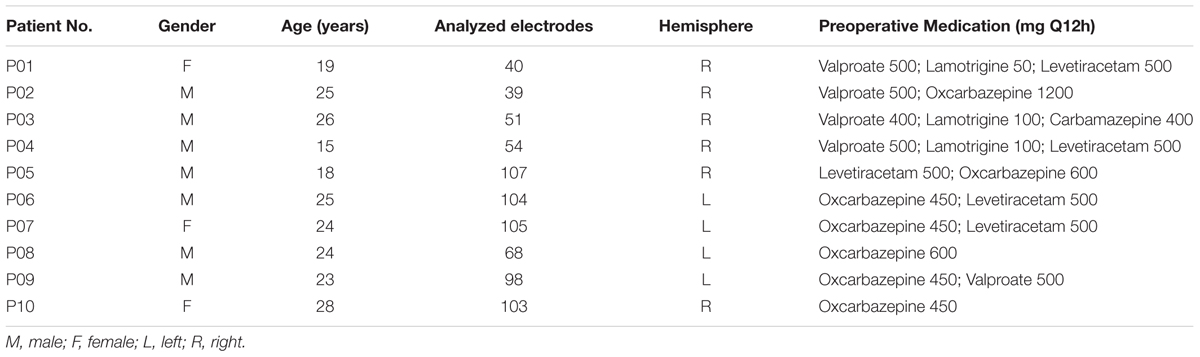
TABLE 1. Clinical and demographic characteristics of the patient participants.
The participants were weaned from their antiepileptic medications during the monitoring period. The electrophysiological recordings for each participant were suspended for at least 4 h after a seizure to avoid the seizure-induced cortical suppression effect. The sEEG recordings were conducted only in a single hemisphere in each of the participants (six participants with right-hemisphere recordings, four participants with left-hemisphere recordings, Figure 1). To estimate the test-retest reliability, three participants (P04, P08, and P09) were tested twice on two different monitoring days.
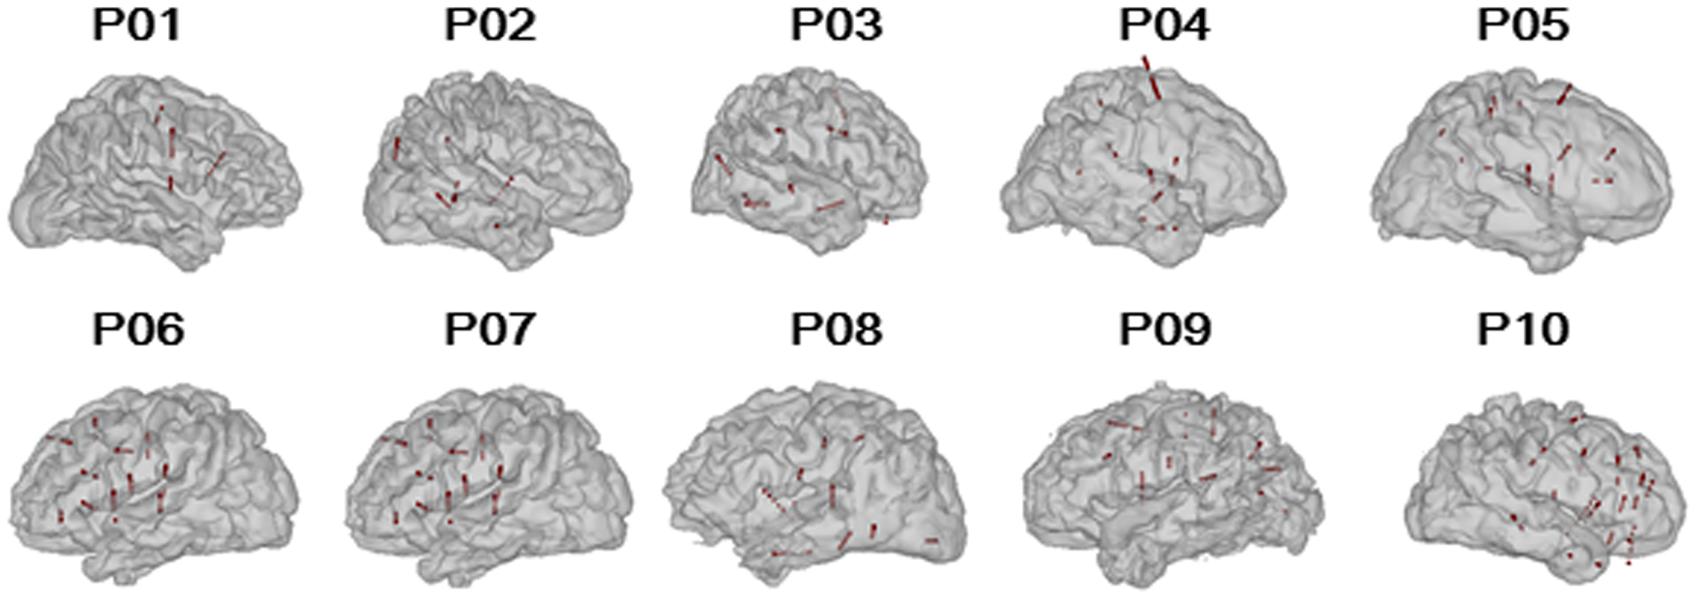
FIGURE 1. Reconstructed participant-specific brain models and locations of implanted electrodes. The black lines represent the paths of the depth electrodes and the red spheres represent the valid nodes (n = 769).
Apparatus and Stimuli
Gaussian wideband-noise stimuli were synthesized using the MATLAB version 2014b (MathWorks, Natick, MA, United States) at the sampling rate of 48 kHz with 16-bit amplitude quantization and low-pass filtered at 10 kHz. The duration of a noise-burst stimulus was 50 ms including the 5-ms linear ramp and damp. The acoustic stimulus was transferred using Creative Sound Blaster (Creative SB X-Fi Surround 5.1 Pro, Creative Technology Ltd., Singapore) and presented to participants with insert earphones (ER-3, Etymotic Research, Elk Grove Village, IL, United States) at the sound pressure level of 65 dB SPL. Calibration of the sound level was carried out with the Larson Davis Audiometer Calibration and Electroacoustic Testing System (AUDit and System 824, Larson Davis, Depew, NY, United States).
Procedures and Electrophysiological Recordings
Each participant was reclining on a bed of a quiet room in the hospital during the experiment. To avoid unwanted effects of top-down modulation on neural responses, participants were instructed to watch a quiet TV show of their choice during the recording sessions. Thus, participants listened to the noise bursts passively without any task. For each of the two recording sessions, the noise burst was repeated 320 times. The inter-stimulus interval (ISI) between the two stimulus presentations was random between 900 to 1000 ms. The noise used in each trial was identical. The time required for each recording session was about 5–7 min. Three patients (P04, P08, and P09) were repeatedly recorded for the two recording sessions on different days.
Stereo-EEG responses were recorded using a Nicolet video-EEG monitoring system (Thermo Nicolet Corporation, United States), digitized at the rate of 1024 Hz and collected with a 0.05–200 Hz online bandpass filter. The sEEG electrodes were manufactured by Huake Hengsheng Medical Technology Co. Ltd., Beijing, China. The diameter of a depth electrode was 0.8 mm. The length of each node was 2 mm, which were spaced 1.5 mm apart from each other. The reference electrode was placed on the forehead. On a recording day, the impedance of all the recording electrode nodes was kept below 50 kΩ and the nodes whose impedances were higher than this value were excluded from analyses.
Data Analyses
Three-dimensional brain images were reconstructed by pre-implantation MR images (T1 or contrast-enhanced) using BrainVoyager QX (Version 2.8, Brain Innovation B.V., Maastricht, Netherlands), and then were transferred into MATLAB data structures and further analyzed using NeuralAct toolbox (Kubanek and Schalk, 2015) in the MATLAB environment. Using BioImage software1, the original coordinates of electrode nodes were extracted from the images with the fusion between the pre-implantation MR and the post-implantation CT scans. The fused images were rotated to AC-PC plane, and were then registered to the standard brain2 (Cox and Hyde, 1997; RRID: nif-0000-00259). The original coordinates were transferred to Talairach coordinates and used for identifying brain areas with Talairach Client3.
In each participant, epileptic foci had been identified before the recordings, and the electrode nodes which were located within the epileptic foci were excluded from data analyses. The pre-processing of electrophysiological data was conducted by the functions of the EEGLAB toolbox (Delorme and Makeig, 2004) in the MATLAB environment.
The long-term EEGs of each depth electrode were filtered by a band-pass filter (2–120 Hz) and segmented into epochs from -100 to 800 ms around the sound onset. The baseline correction was conducted by the time window from -100 to 0 ms before the sound onset. The epochs which contained more than ±1 mV potentials were rejected as artifacts. The remaining epochs were then averaged to obtain an event-related potential (ERP) for each electrode node. The evoked neural activities were calculated by the root mean square (RMS) of time windows of interest and then divided by the RMS of the pre-stimulus level (-50 to 0 ms). The time-frequency spectrum (Morlet wavelets approach, frequency step = 1 Hz) and GC analyses (time domain) were calculated using the Brainstorm toolbox4 (Tadel et al., 2011) in the MATLAB environment. Mother wavelet parameters were set to full width half maximum value of 3 s for the Gaussian kernel at a center frequency of 1 Hz.
The GC is considered from X to Y (i.e., X→Y) if including past values of X and Y (i.e., full model) provides more information about future values of Y compared to when only the past values of Y (i.e., restricted model) are considered (Seth, 2010). Here, X or Y are time series representing sound-evoked (broadband) potentials for a particular electrode location and participant. Note that electrode nodes only from the same person are paired and used for GC analyses. The higher GC value represents a stronger interaction from X to Y. To assess the statistical significance (p-value) of the GC value between two electrodes X→Y, we tested the null hypothesis (i.e., the full model did not fit the data better than the restricted model) using the F-statistic. Only the significant GC values were entered into further analyses.
Statistical analyses were performed with IBM SPSS Statistics 20 (SPSS Inc., Chicago, Illinois 60606). To analyze dynamic changes in either amplitudes or GC values of sound-evoked responses, (within-subjects) repeated-measures analyses of variance (ANOVAs), t-tests, Pearson correlation, and Bonferroni post hoc tests were conducted. The vegan package of R (version 2.15.0) was used to test correlations among GC matrixes (Mantel r tests). The null-hypothesis rejection level was set at 0.05.
Results
The electrode nodes with over threshold impedances (>50 kΩ), artifacts, and/or within epilepsy foci were excluded from data analyses. Data obtained from 769 electrode nodes in 10 participants (Figure 1) were used for further analyses (the number of electrodes for each patient: P01, n = 40; P02, n = 39; P03, n = 51; P04, n = 54; P05, n = 107; P06, n = 104; P07, n = 105; P08, n = 68; P09, n = 98; and P10, n = 103).
Noise-Burst-Evoked Potentials in the Auditory Cortex and Non-auditory Cortices
Using the Talairach coordinates, all the 769 depth electrodes were located in the following brain areas: the AC (n = 61), middle frontal gyrus (MFG, n = 48), inferior frontal gyrus (IFG, n = 23), precentral gyrus (n = 64), postcentral gyrus (PoG, n = 27), inferior parietal lobule (IPL, n = 35), superior temporal gyrus (n = 26), middle temporal gyrus (MTG, n = 37), inferior temporal gyrus (ITG, n = 11), parahippocampal gyrus (ParaHipp, n = 35), insula (n = 33), cingulate gyrus (n = 72), fusiform gyrus (n = 31), and precuneus (n = 43). Examples of original ERPs and time-frequency analyses see in Supplementary Figures S1, S2. The electrode nodes that were located in subcortical structures were not analyzed. The electrode distribution in individual participants is presented in Table 2.
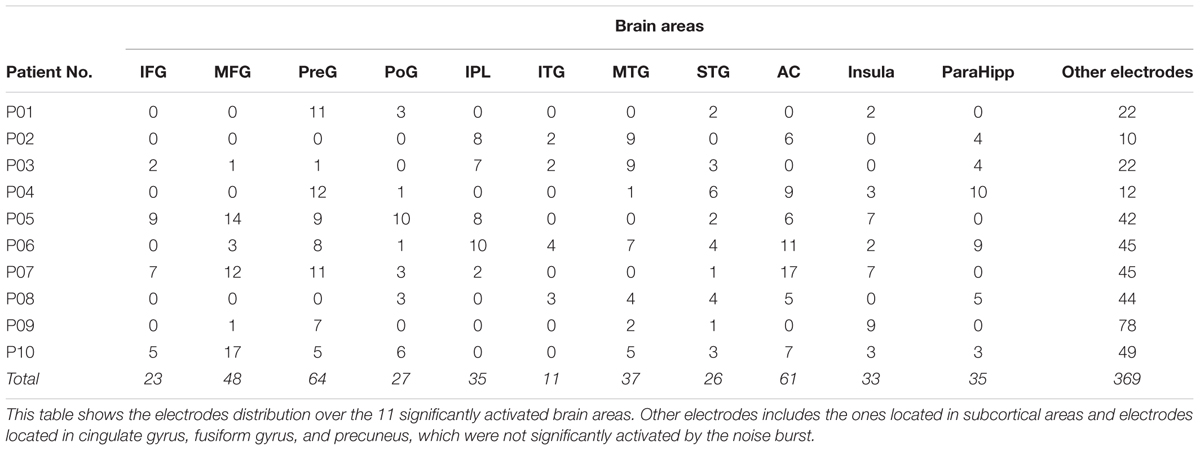
TABLE 2. Electrodes distribution of individual participants.
The dynamic neural activities of recorded cortical regions were calculated as the relative amplitude indices (using RMS) in the five time windows after the sound onset (i.e., 0–50, 50–100, 100–150, 150–200, and 200–250 ms) with the baseline level within the time window from -50 to 0 ms. Repeat-measured t-tests between the RMS in each time windows of interest and the RMS from the baseline time window were conducted (with Bonferroni correction).
The results showed that there were in total 11 out of 14 recorded brain areas (MFG, IFG, preG, poG, IPL, ITG, MTG, STG, AC, ParaHipp, and Insula) that were significantly activated by the noise burst within at least one of five time windows. The noise-burst-evoked potentials in the AC were markedly different from those in the non-AC areas: Potentials in the AC were larger, occurred earlier, and lasted longer than those in the non-AC areas. As shown in Figure 2A, the activation cores distributed around the Sylvian fissure, where the AC was located.
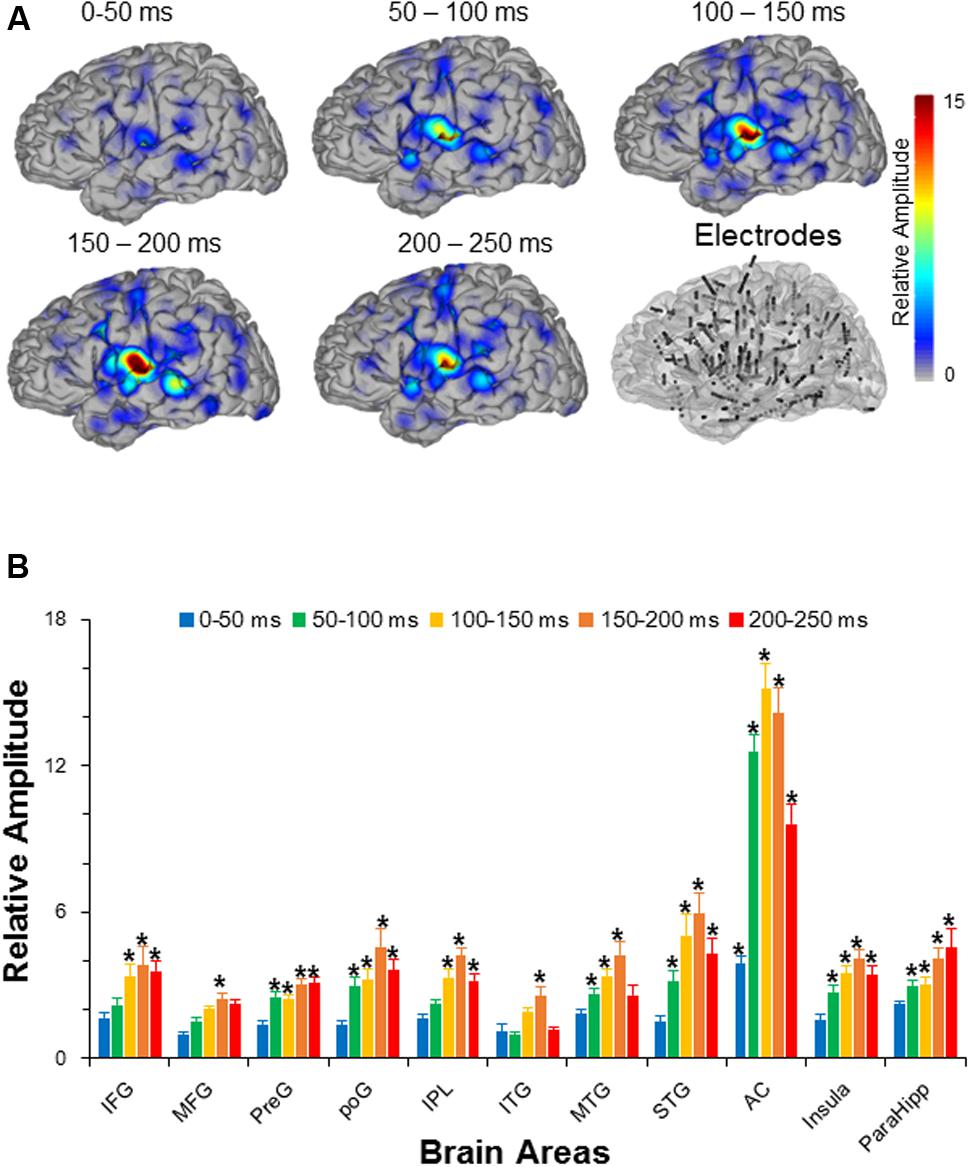
FIGURE 2. (A) The grand averaged activation maps calculated by relative amplitudes within the five time windows after the sound onset. Locations of all the depth electrodes are transferred into the left hemisphere for exhibition. The bottom right panel shows the electrode node distribution on a standard brain. (B) Comparisons in relative amplitudes across the 11 significantly activated brain areas within the five time windows after the sound onset. The root mean squares in the five time windows (0–50, 50–100, 100–150, 150–200, and 200-250 ms after the sound onset) were divided by the root mean square in the time window from –50 to 0 ms to obtain relative amplitudes, respectively. AC, auditory cortex; PreG, precentral gyrus; STG, superior temporal gyrus; poG, postcentral gyrus; IPL, inferior parietal lobule; IFG, inferior frontal gyrus; MFG, middle frontal gyrus; MTG, middle temporal gyrus; ParaHipo, para-hippocampus; ITG, inferior temporal gyrus. ∗ p <0.05.
Independent t-tests confirmed that the relative amplitudes of AC were significantly larger than those of the non-AC areas in each of the five time windows (all Bonferroni corrected p < 0.05). In addition, only the evoked amplitudes of the AC, but not those of the non-AC areas, were significant in the first time window (0–50 ms) after the sound onset (Bonferroni corrected p < 0.05, repeat-measured t-tests).
The relative amplitudes for the following brain areas, including the preG, poG, STG, ParaHipp, and insula, started to be significant in the second (50–100 ms) time window (all Bonferroni corrected p < 0.05, repeat-measured t-tests). The relative amplitudes for the IFG and IPL started to be significant in the third time window (100–150 ms), and the relative amplitudes for the MFG and ITG were significant only in fourth time window (150–200 ms) (all Bonferroni corrected p < 0.05, repeat-measured t-tests) (Figures 2B, 3). For longer temporal window analyses see in Supplementary Figure S3.
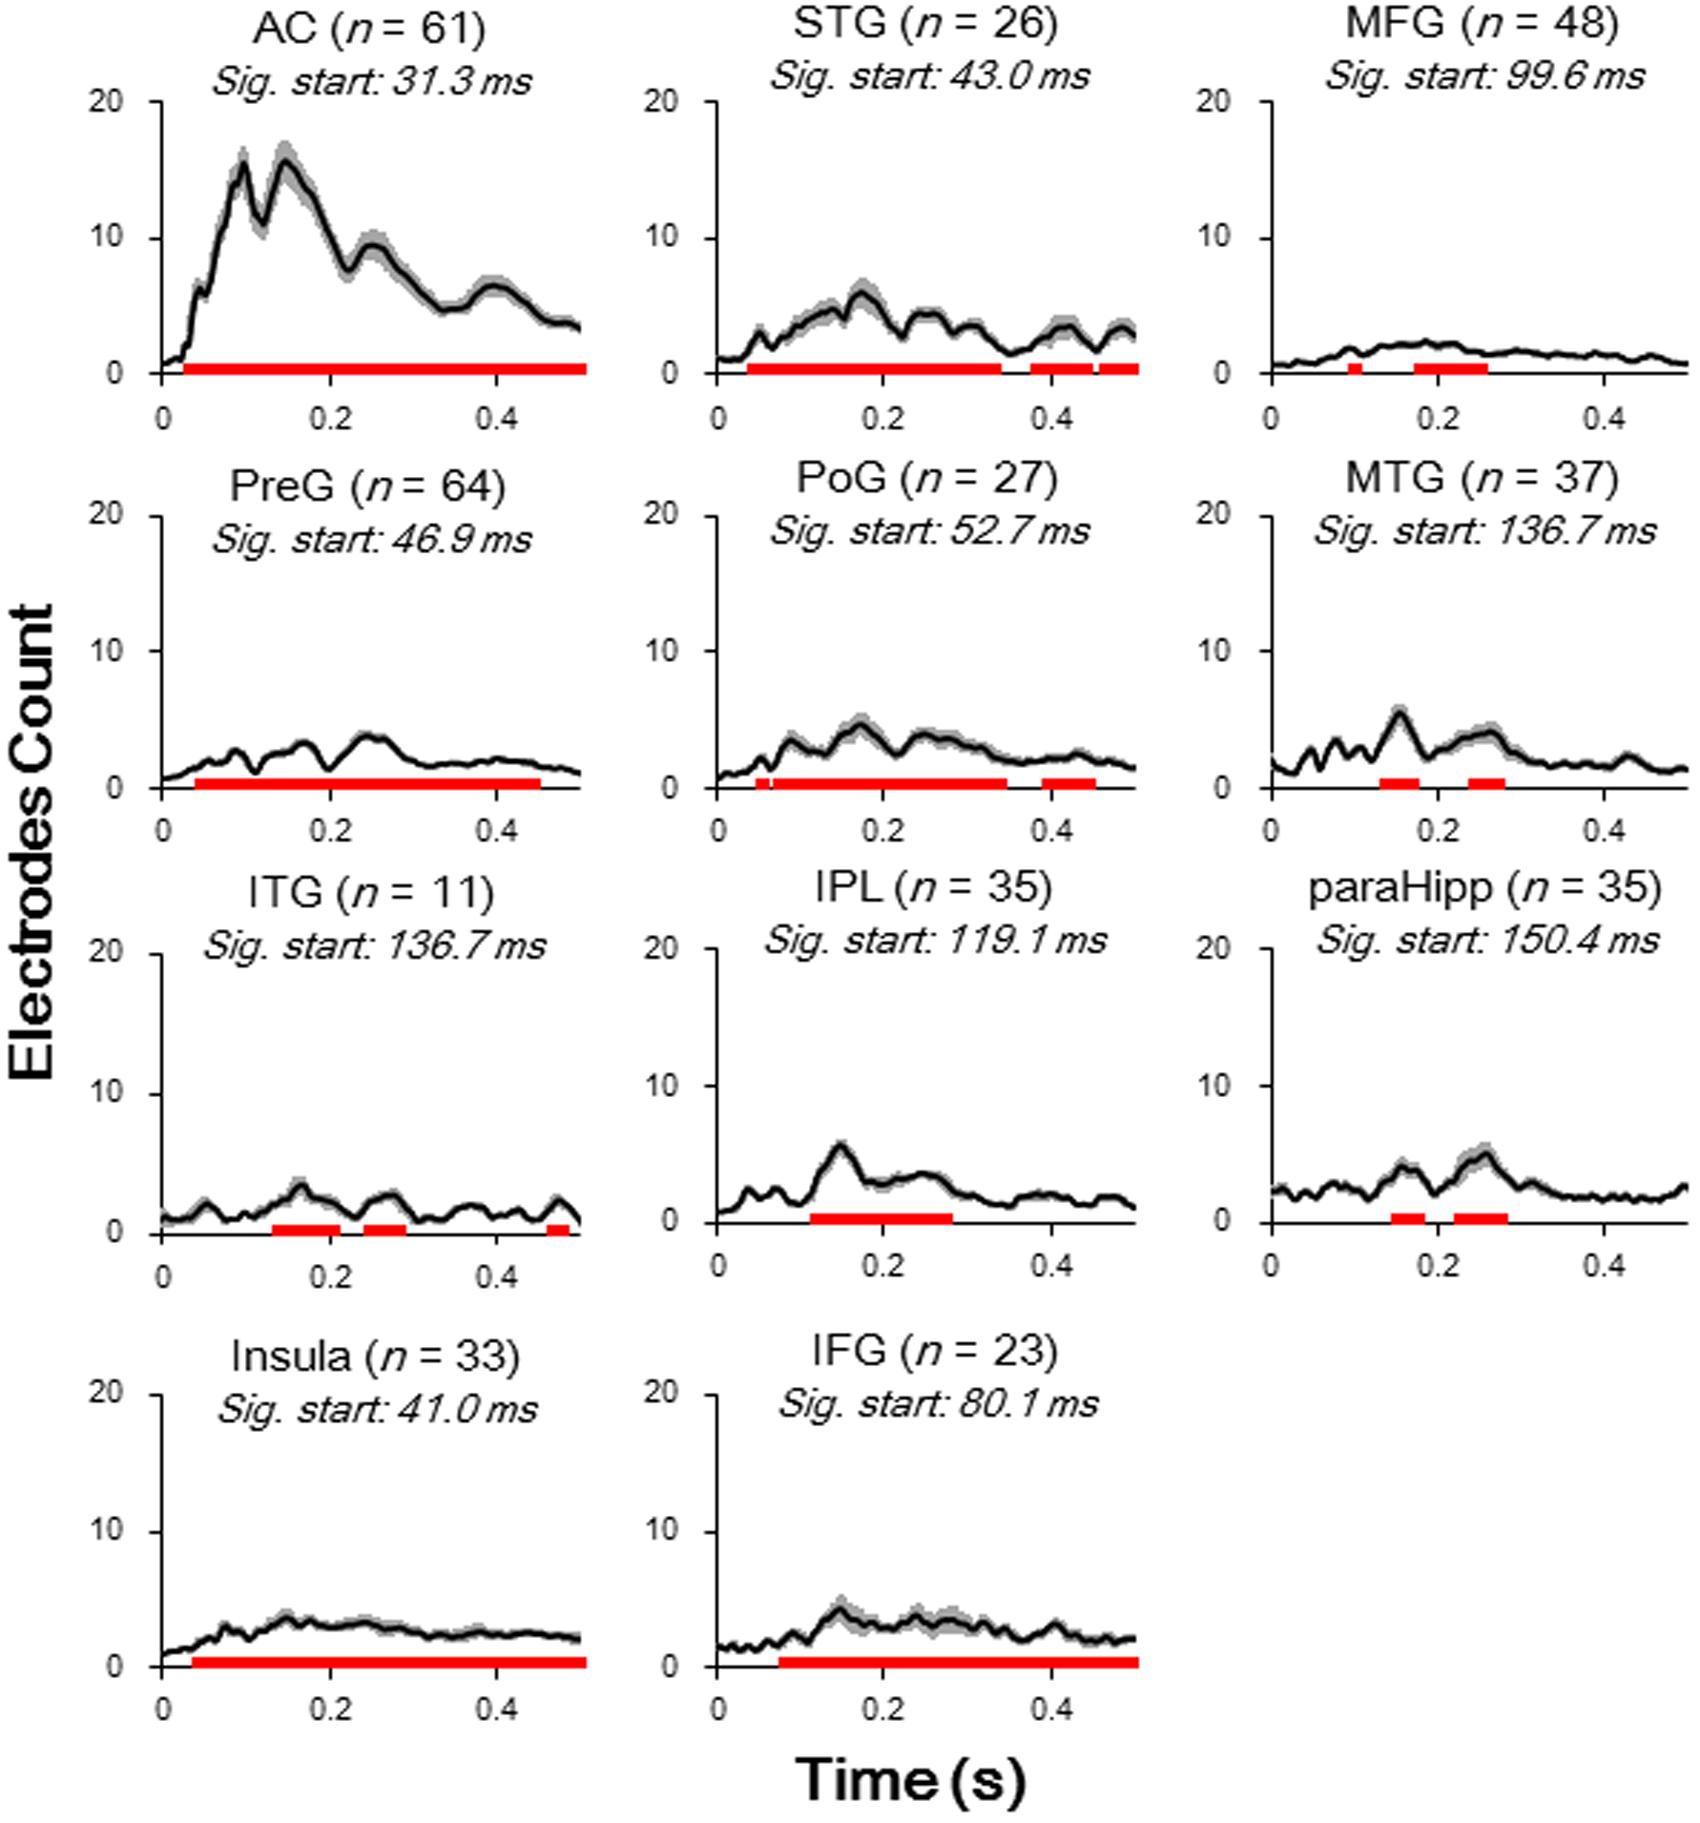
FIGURE 3. Averaged waveform (absolute value) for each of significantly activated brain areas. Student t-tests against baseline (–50 to 0 ms before sound onset) with Bonferroni correction were conducted to decide the significance. Black lines, mean value; Gray areas, standard error; Red bars, significant temporal area; Sig. start, the time point when the significance started to occur; AC, auditory cortex; PreG, precentral gyrus; STG, superior temporal gyrus; poG, postcentral gyrus; IPL, inferior parietal lobule; IFG, inferior frontal gyrus; MFG, middle frontal gyrus; MTG, middle temporal gyrus; ParaHipp, para-hippocampus; ITG, inferior temporal gyrus.
Furthermore, latencies of these 11 (out of 14) brain areas to the noise-burst stimulus were extracted from the first peak response (with either positive or negative polarity). Single-trial statistical analyses for each electrode were conducted. As shown in Figure 4, the first peak was defined as the first significant data point while the latency was defined as the time from sound onset to the first peak. The latencies of the AC (M = 52.3, SD = 25.3, here and below in ms) were significantly shorter than all those of the non-AC areas, including the preG (M = 84.4, SD = 42.9), ITG (M = 88.6, SD = 27.3), insula (M = 91.2, SD = 43.1), STG (M = 92.7, SD = 38.6), poG (M = 97.4, SD = 45.2), IPL (M = 104.1, SD = 47.6), IFG (M = 104.6, SD = 43.8), MFG (M = 107.6, SD = 32.0), MTG (M = 118.7, SD = 49.6), and ParaHipp (M = 127.6, SD = 44.8) (all Bonferroni corrected p < 0.05, independent t-tests).
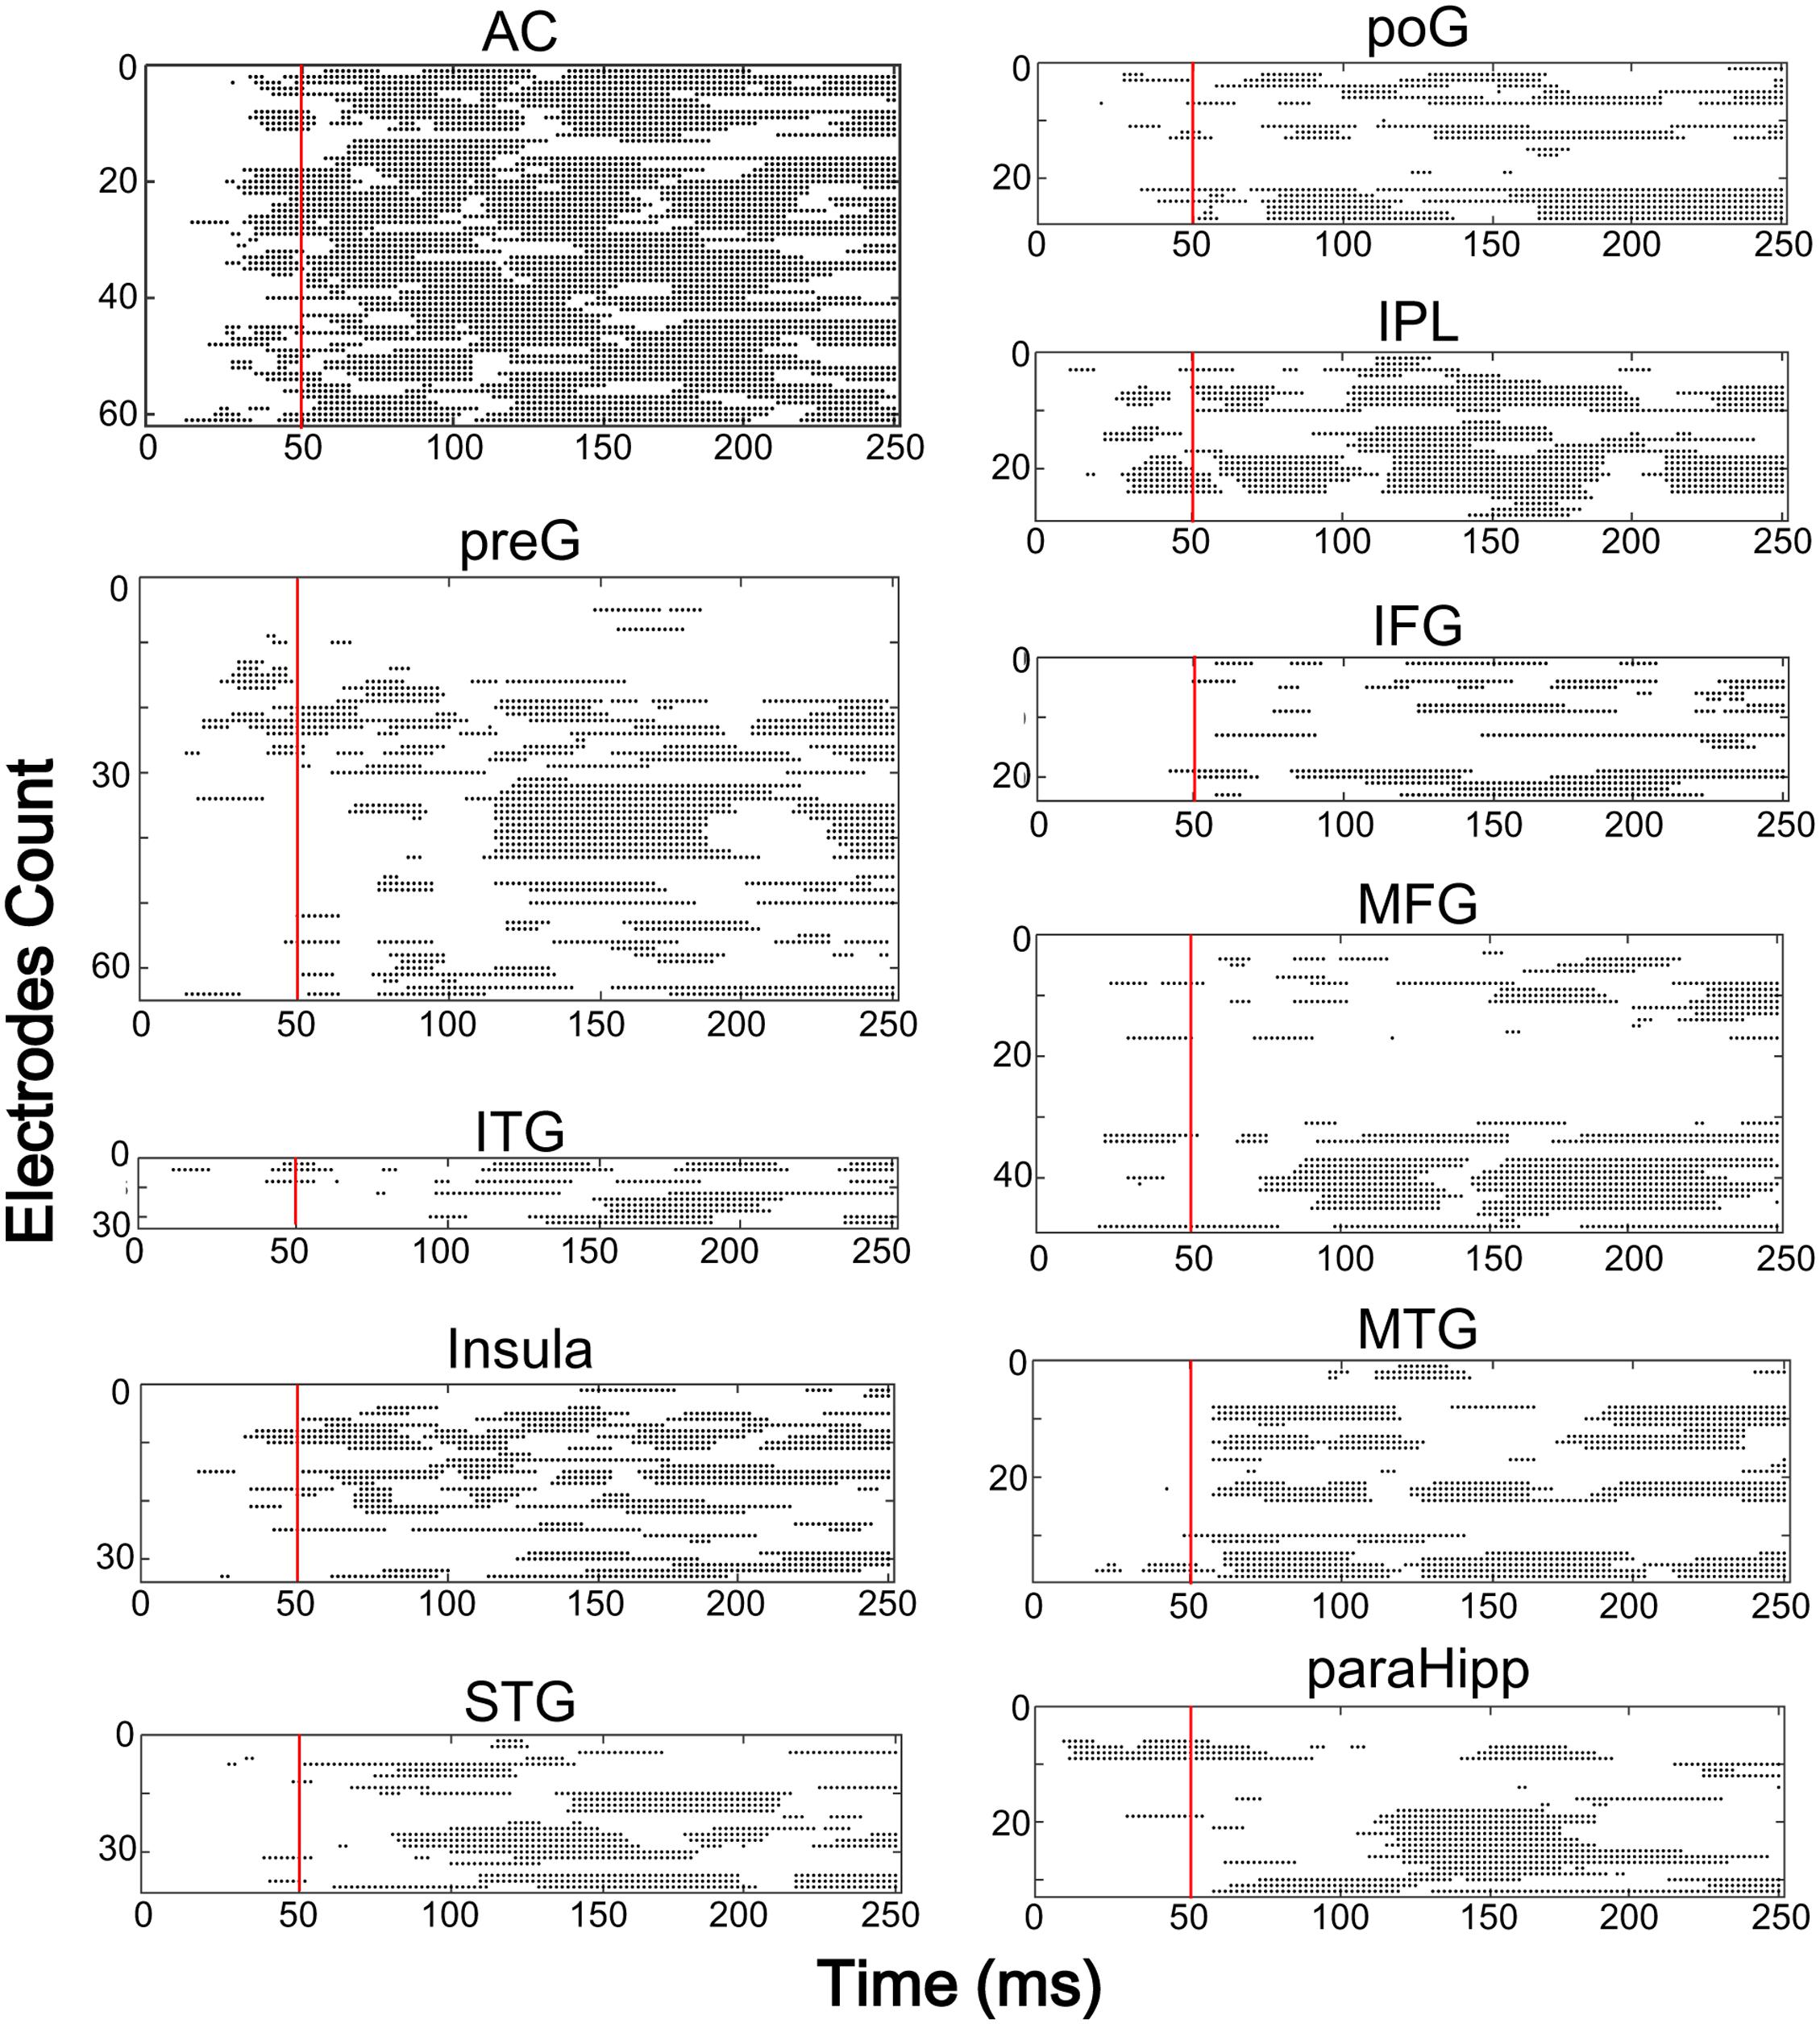
FIGURE 4. The results of single trial statistical analysis within each electrode, respectively. Each line represents the significance across time and each black dot represented this time point was significantly different with the baseline. Red lines, time points at 50 ms. AC, auditory cortex; PreG, precentral gyrus; STG, superior temporal gyrus; poG, postcentral gyrus; IPL, inferior parietal lobule; IFG, inferior frontal gyrus; MFG, middle frontal gyrus; MTG, middle temporal gyrus; ParaHipp, para-hippocampus; ITG, inferior temporal gyrus.
Intrinsic and Extrinsic Networks of the AC
Granger causality analyses were used to estimate the sound-evoked functional networks including the local network within the AC (electrode-node pairs were located within the AC area) and external networks interacting with the AC (electrode-node pairs between the AC and non-AC areas) for the following three time windows after the sound onset (0–100, 100–200, and 200–300 ms). There were in total 601 AC-AC electrode pairs that were entered into analyses. Generally, the results of one-way repeated-measure ANOVA showed that the GC value within the AC (iFC) gradually attenuated with time (F2,1200 = 56.14, p < 0.001; post hoc: all p < 0.01, with Bonferroni adjustment) (Figure 5A).
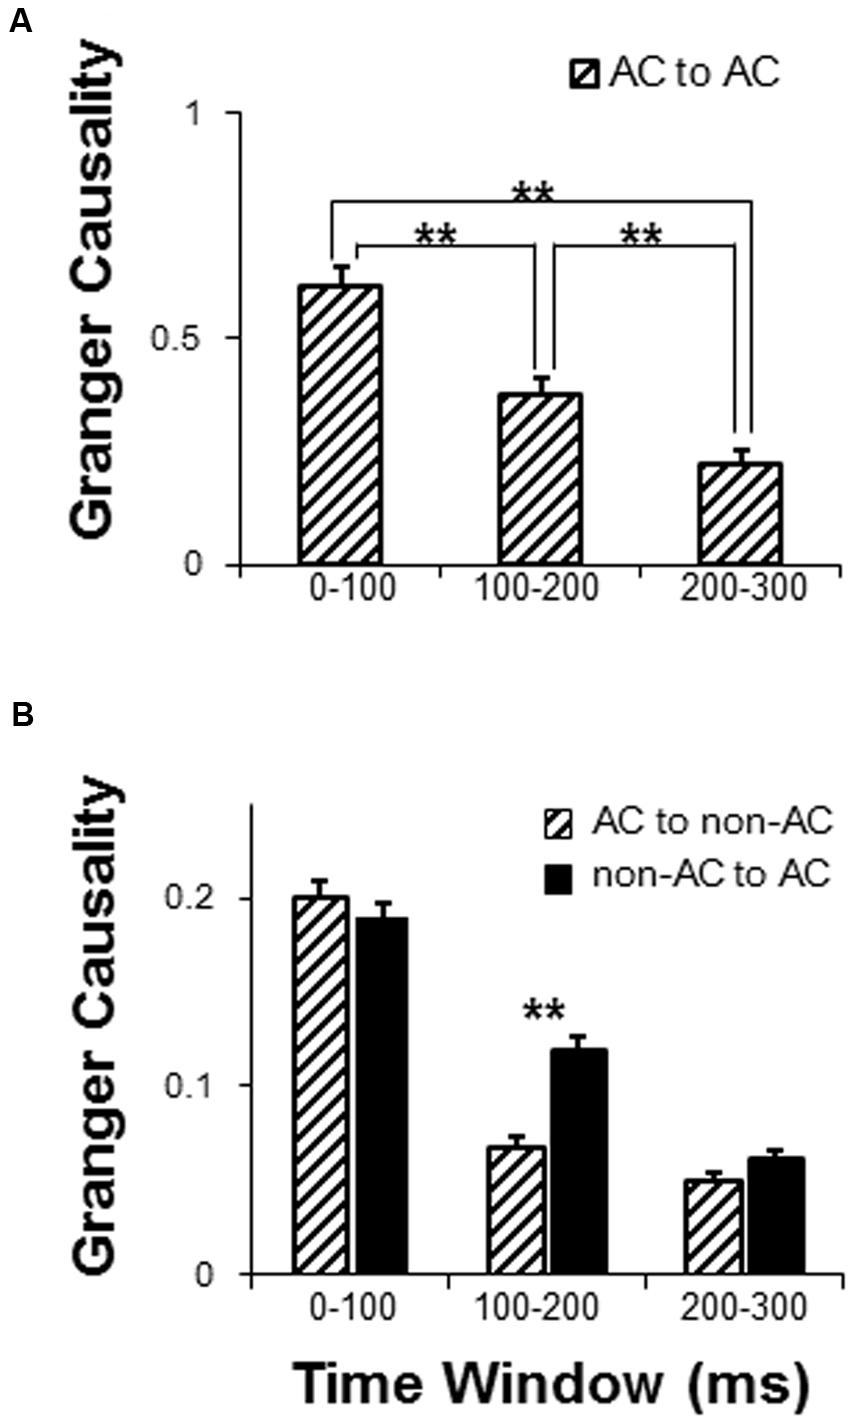
FIGURE 5. Comparison of dynamic networks with in the following three time windows: 0–100, 100–200, and 200–300 ms. (A) Granger causality (GC) analyses of the auditory cortex local network. (B) GC analyses of functionally connected networks of the AC. AC, auditory cortex. ∗∗ p < 0.01.
There were in total 4108 AC to non-AC electrode pairs that were entered into analyses. For the external network of the AC, a 2 (connectivity direction: AC to non-AC, non-AC to AC) by 3 (time window: 0–100, 100–200, and 200–300 ms) two-way repeated-measures ANOVA showed that the main effect of connectivity direction was significant (F1,4108 = 9.58, p = 0.002), the main effect of time window was significant (F2,8216 = 228.05, p < 0.001), and the interaction was significant (F2,8216 = 10.83, p < 0.001) (Figure 5B). Post hoc results showed that the GC values significantly attenuated across time windows for both the AC to non-AC direction and the non-AC to AC direction (all p < 0.05, with Bonferroni adjustment). In addition, the connectivity-direction effect was significant for the time window of 100–200 ms (p < 0.001, with Bonferroni adjustment) but not for the time windows of 0–100 ms and 200–300 ms (p = 0.420 and p = 0.091, respectively, with Bonferroni adjustment) (Figure 5B).
A 2 (connectivity direction: from AC to non-AC, from non-AC to AC) by 3 (time window: 0–100, 100–200, and 200–300 ms) two-way repeated-measures ANOVA was conducted for each of the 10 non-AC areas. As shown in Table 3, the main effect of time window was significant for each of the non-AC areas (all p < 0.05), indicating that the strength of connectivity with the AC generally decayed with time. The main effect of connectivity direction was significant for five non-AC areas, including the MTG, ITG, ParaHipp, IPL, and preG (all p < 0.05). The interaction effect was significant for five non-AC areas, including the STG, ITG, IPL, preG, and MFG.
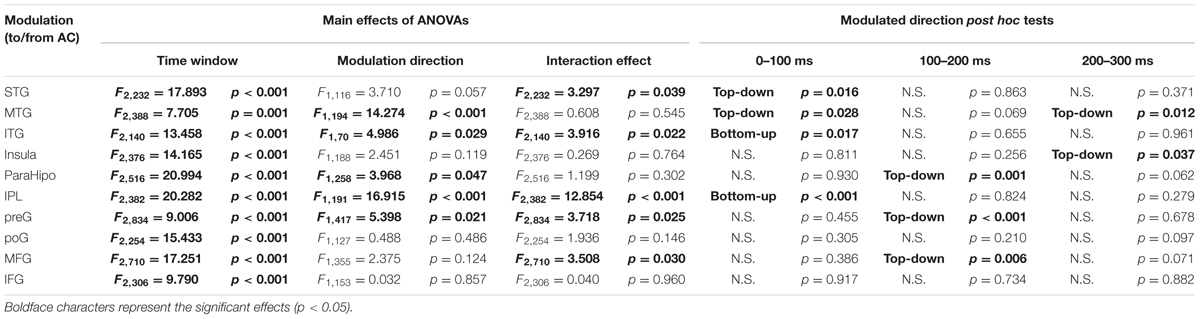
TABLE 3. Statistical results of granger causalities between the auditory cortex (AC) and non-auditory cortices.
Post hoc tests of the connectivity-direction effect showed that (1) in the 0–100 ms time window, the AC mainly sent bottom-up outputs to the ITG and IPL, and received top-down inputs from the STG and MTG (all p < 0.05, with Bonferroni adjustment); (2) in the 100–200 ms time window, the AC was mainly top-down modulated by the ParaHipp, preG, and MFG (all p < 0.05, with Bonferroni adjustment); (3) in the 200–300 ms time window, the AC was mainly top-down modulated by the MTG and insula (all p < 0.05, with Bonferroni adjustment); (4) within any time windows, no significant top-down or bottom-up connectivity effect was found between the AC with either the poG or the IFG (all p > 0.05, with Bonferroni adjustment) (Figure 6 and Table 3).
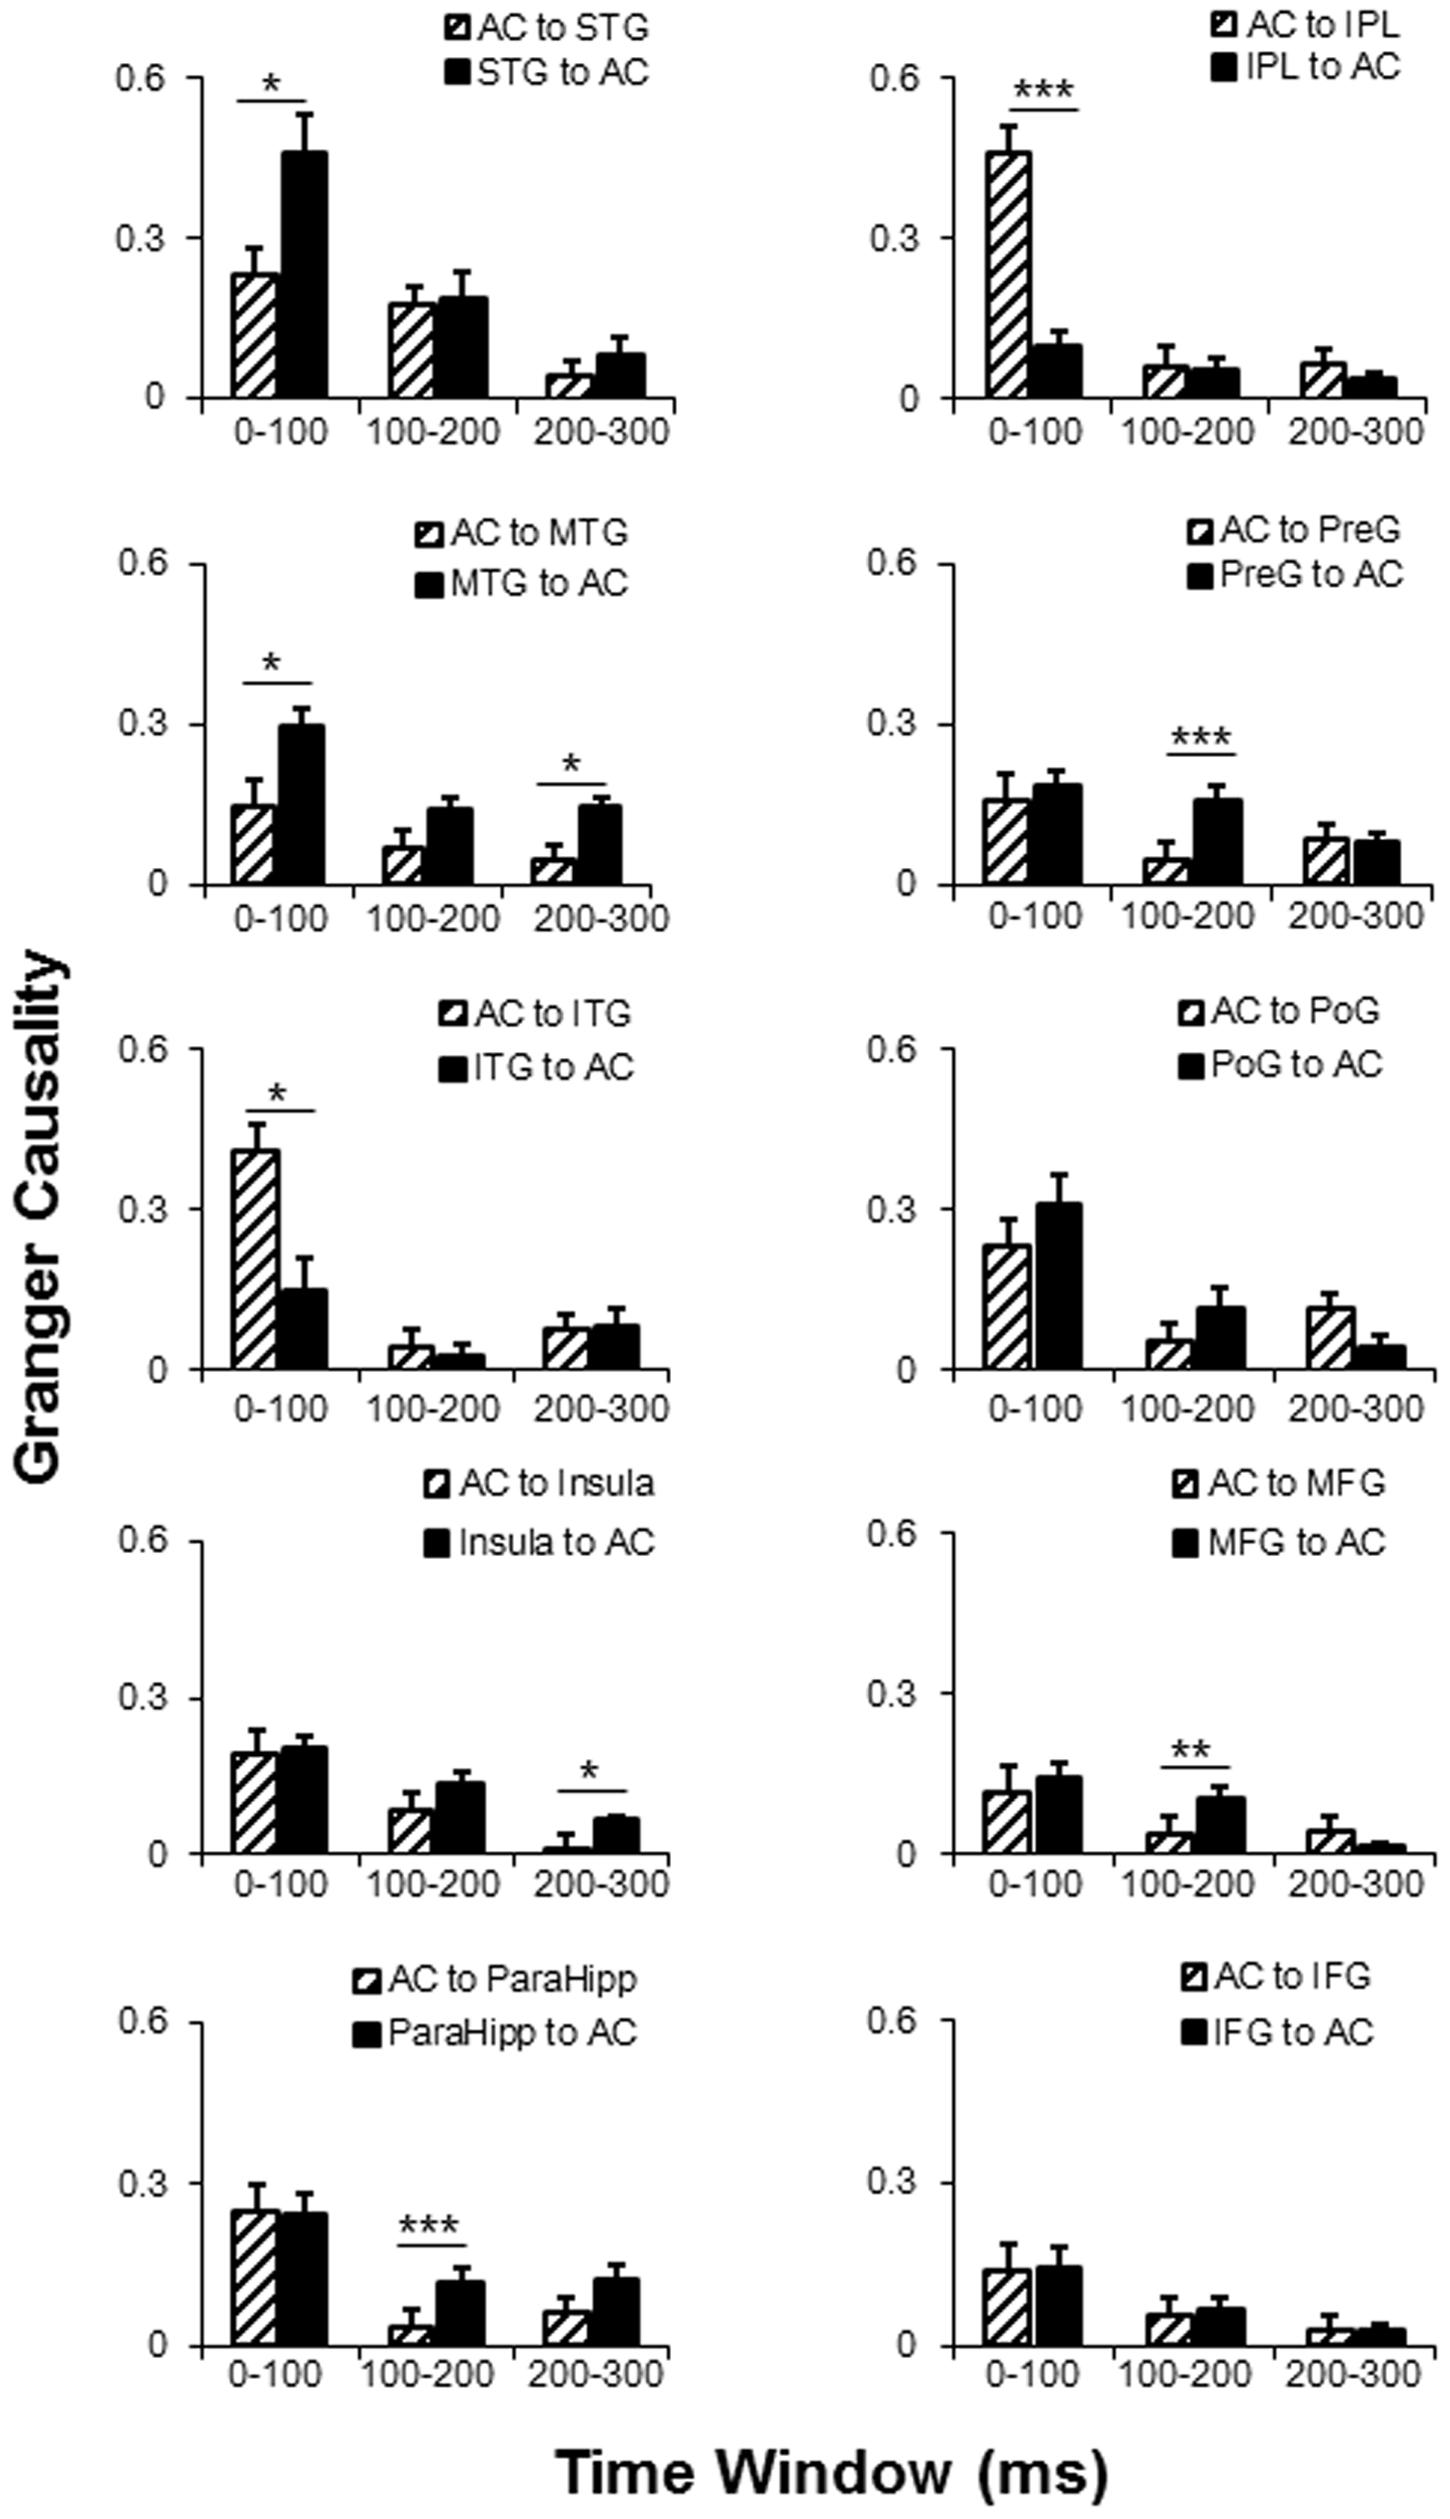
FIGURE 6. Comparisons of the dynamic GC analyses between AC and the 10 non-auditory cortical areas. AC, auditory cortex; PreG, precentral gyrus; STG, superior temporal gyrus; poG, postcentral gyrus; IPL, inferior parietal lobule; IFG, inferior frontal gyrus; MFG, middle frontal gyrus; MTG, middle temporal gyrus; ParaHipo, para-hippocampus; ITG, inferior temporal gyrus. ∗ p < 0.05; ∗∗ p < 0.01; ∗∗∗ p < 0.001.
Interactions between Intrinsic Connectivity and Extrinsic Connectivity of the AC
To evaluate the dynamic interactions between iFC and eFC of the AC, Pearson correlation tests were conducted between GCs of iFC of the AC and GCs of the significantly modulated non-AC areas within each of the three time windows (0–100, 100–200, and 200-300 ms). In each of the pairwise correlation tests, the GC from AC-Node1 to AC-Node 2 and the GC from AC-Node1 to non-AC-Node1 (for example, ITG) were one-to-one matched. Note that the iFC pair that could not match any eFC was excluded from the correlation test. The results showed that in the 0–100 ms time window, iFC of the AC was significantly correlated with bottom-up eFC from the AC to both the ITG (r16 = 0.657, p= 0.004) and the IPL (r33 = 0.693, p< 0.001). In the 100–200 ms time window, iFC of the AC was significantly correlated with eFC from the preG to the AC (r43 = 0.346, p= 0.021; adjusted by Bonferroni approach). In the 200–300 ms time window, iFC of the AC was significantly correlated with eFC from the insula to AC (r43 = 0.424, p= 0.004; adjusted by Bonferroni approach, Figure 7 and Table 4).
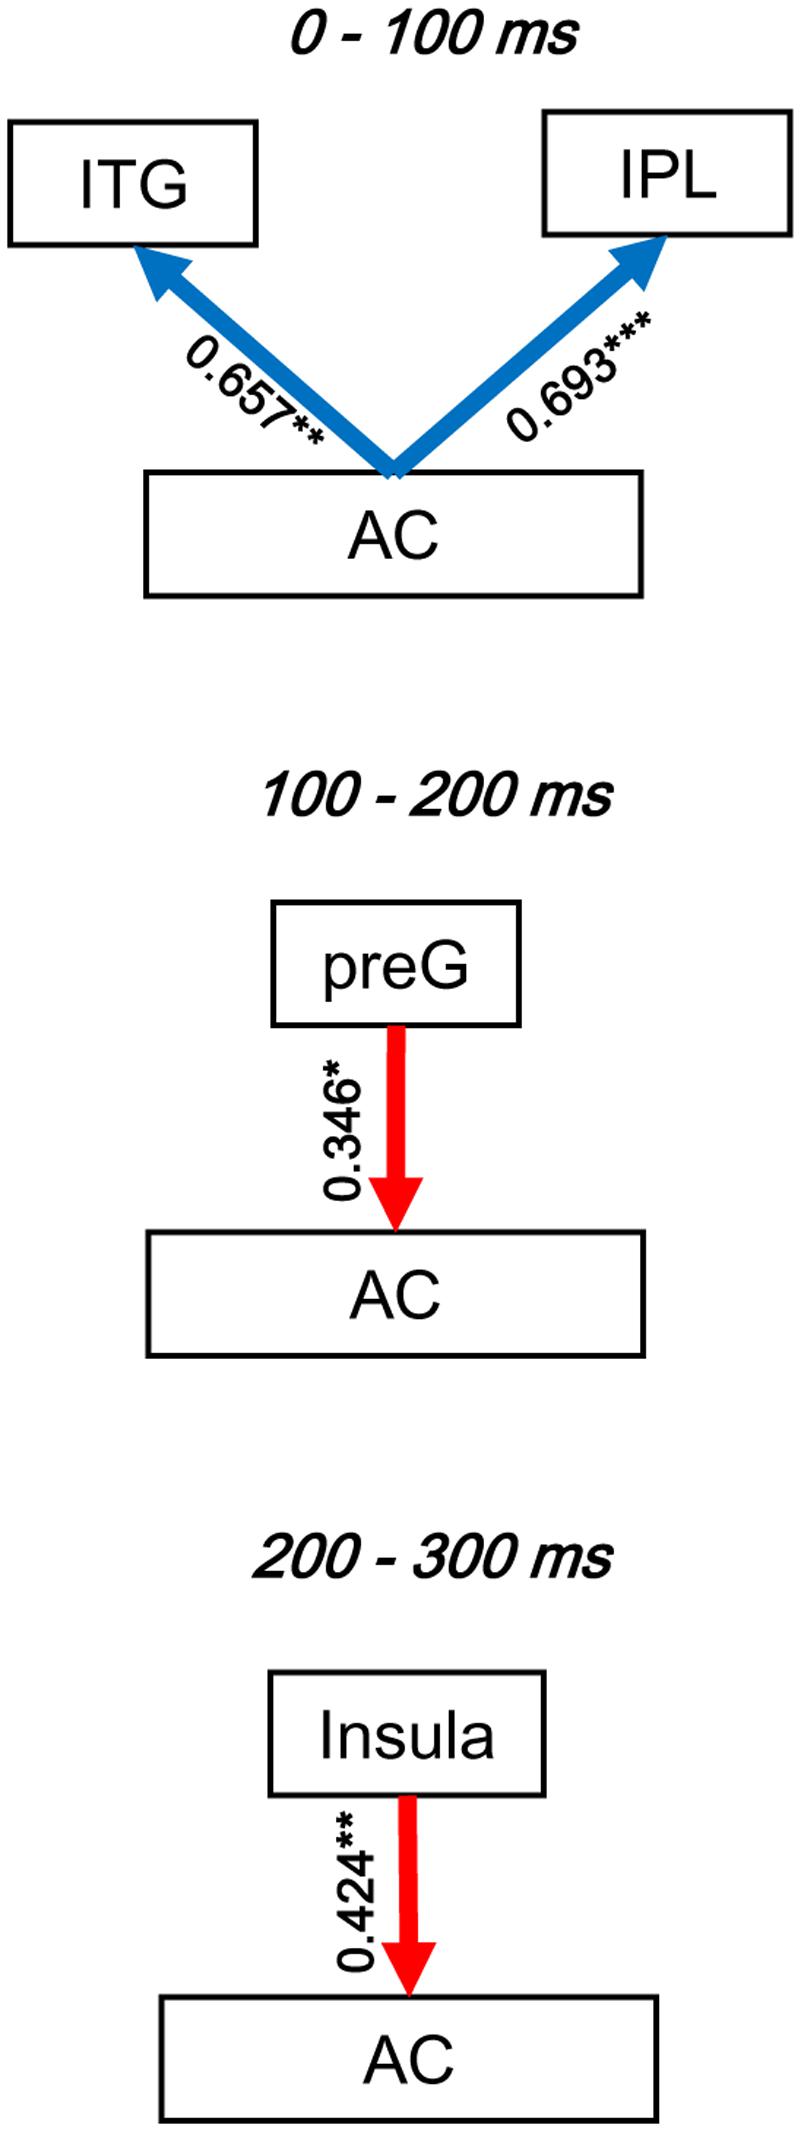
FIGURE 7. Illustration of the dynamic interactions between the AC local network and functionally connected networks of the AC. The correlation coefficients were obtained by Pearson correlation tests. Blue arrows, bottom-up modulation from the AC to non-auditory areas. Red arrows, top-down modulation from non-auditory areas to the AC. Bold arrows, significant correlation. ∗ p < 0.05; ∗∗ p< 0.01; ∗∗∗ p < 0.001.
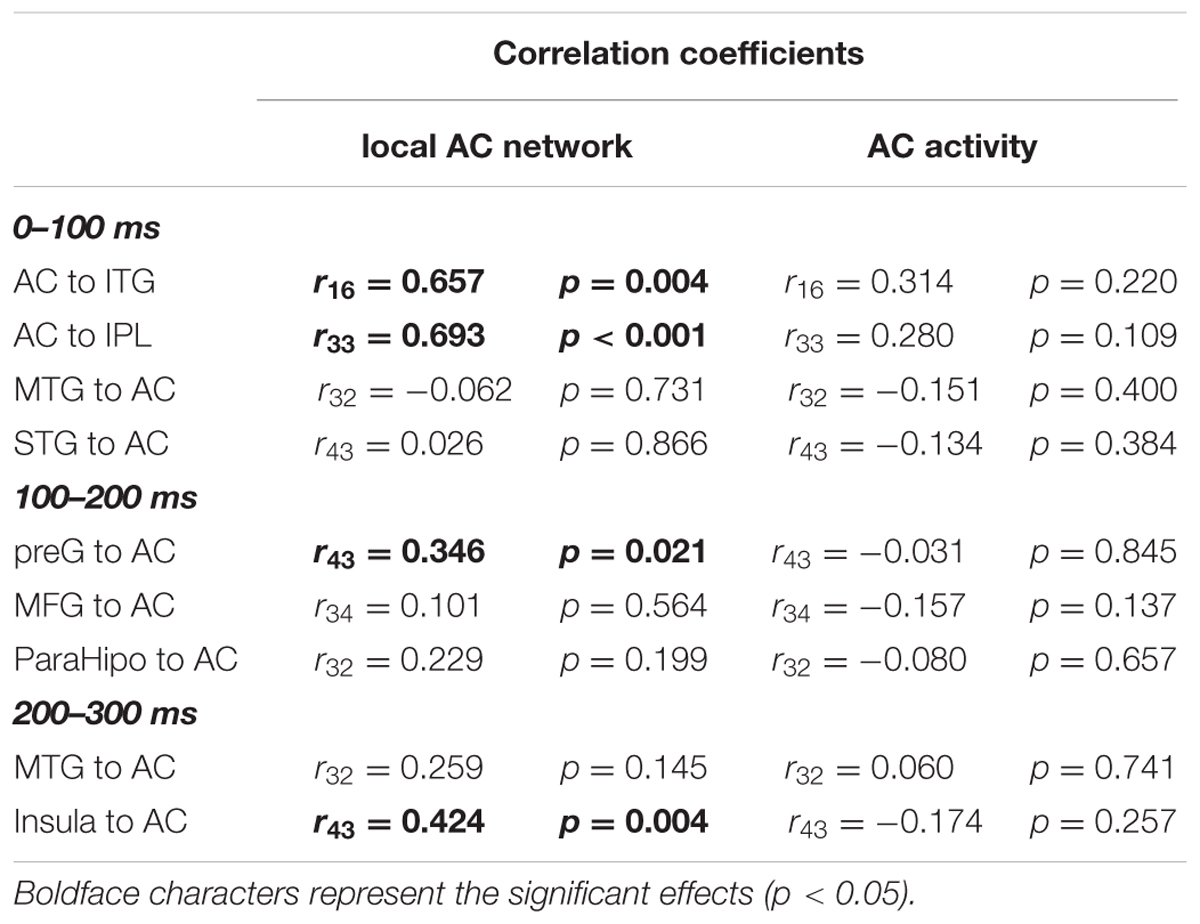
TABLE 4. Pearson correlation coefficients between extrinsic networks and the local AC network.
Test-Retest Reliability
To examine the test-retest reliability of the auditory functional networks obtained by the sEEG procedure used in this study, three participants (P04, P08, and P09) were recorded on two different days. The consistency of the two recordings were examined by correlation analyses. Pearson correlations between the relative amplitudes in the five temporal windows (0–50, 50–100, 100–150, 150–200, and 200–250 ms) on the first recording day and those on the second recording day were remarkably significant (all p < 0.05, with Bonferroni adjustment, Figure 8), indicating that the noise burst-evoked potentials in these brain areas exhibited a high consistence.
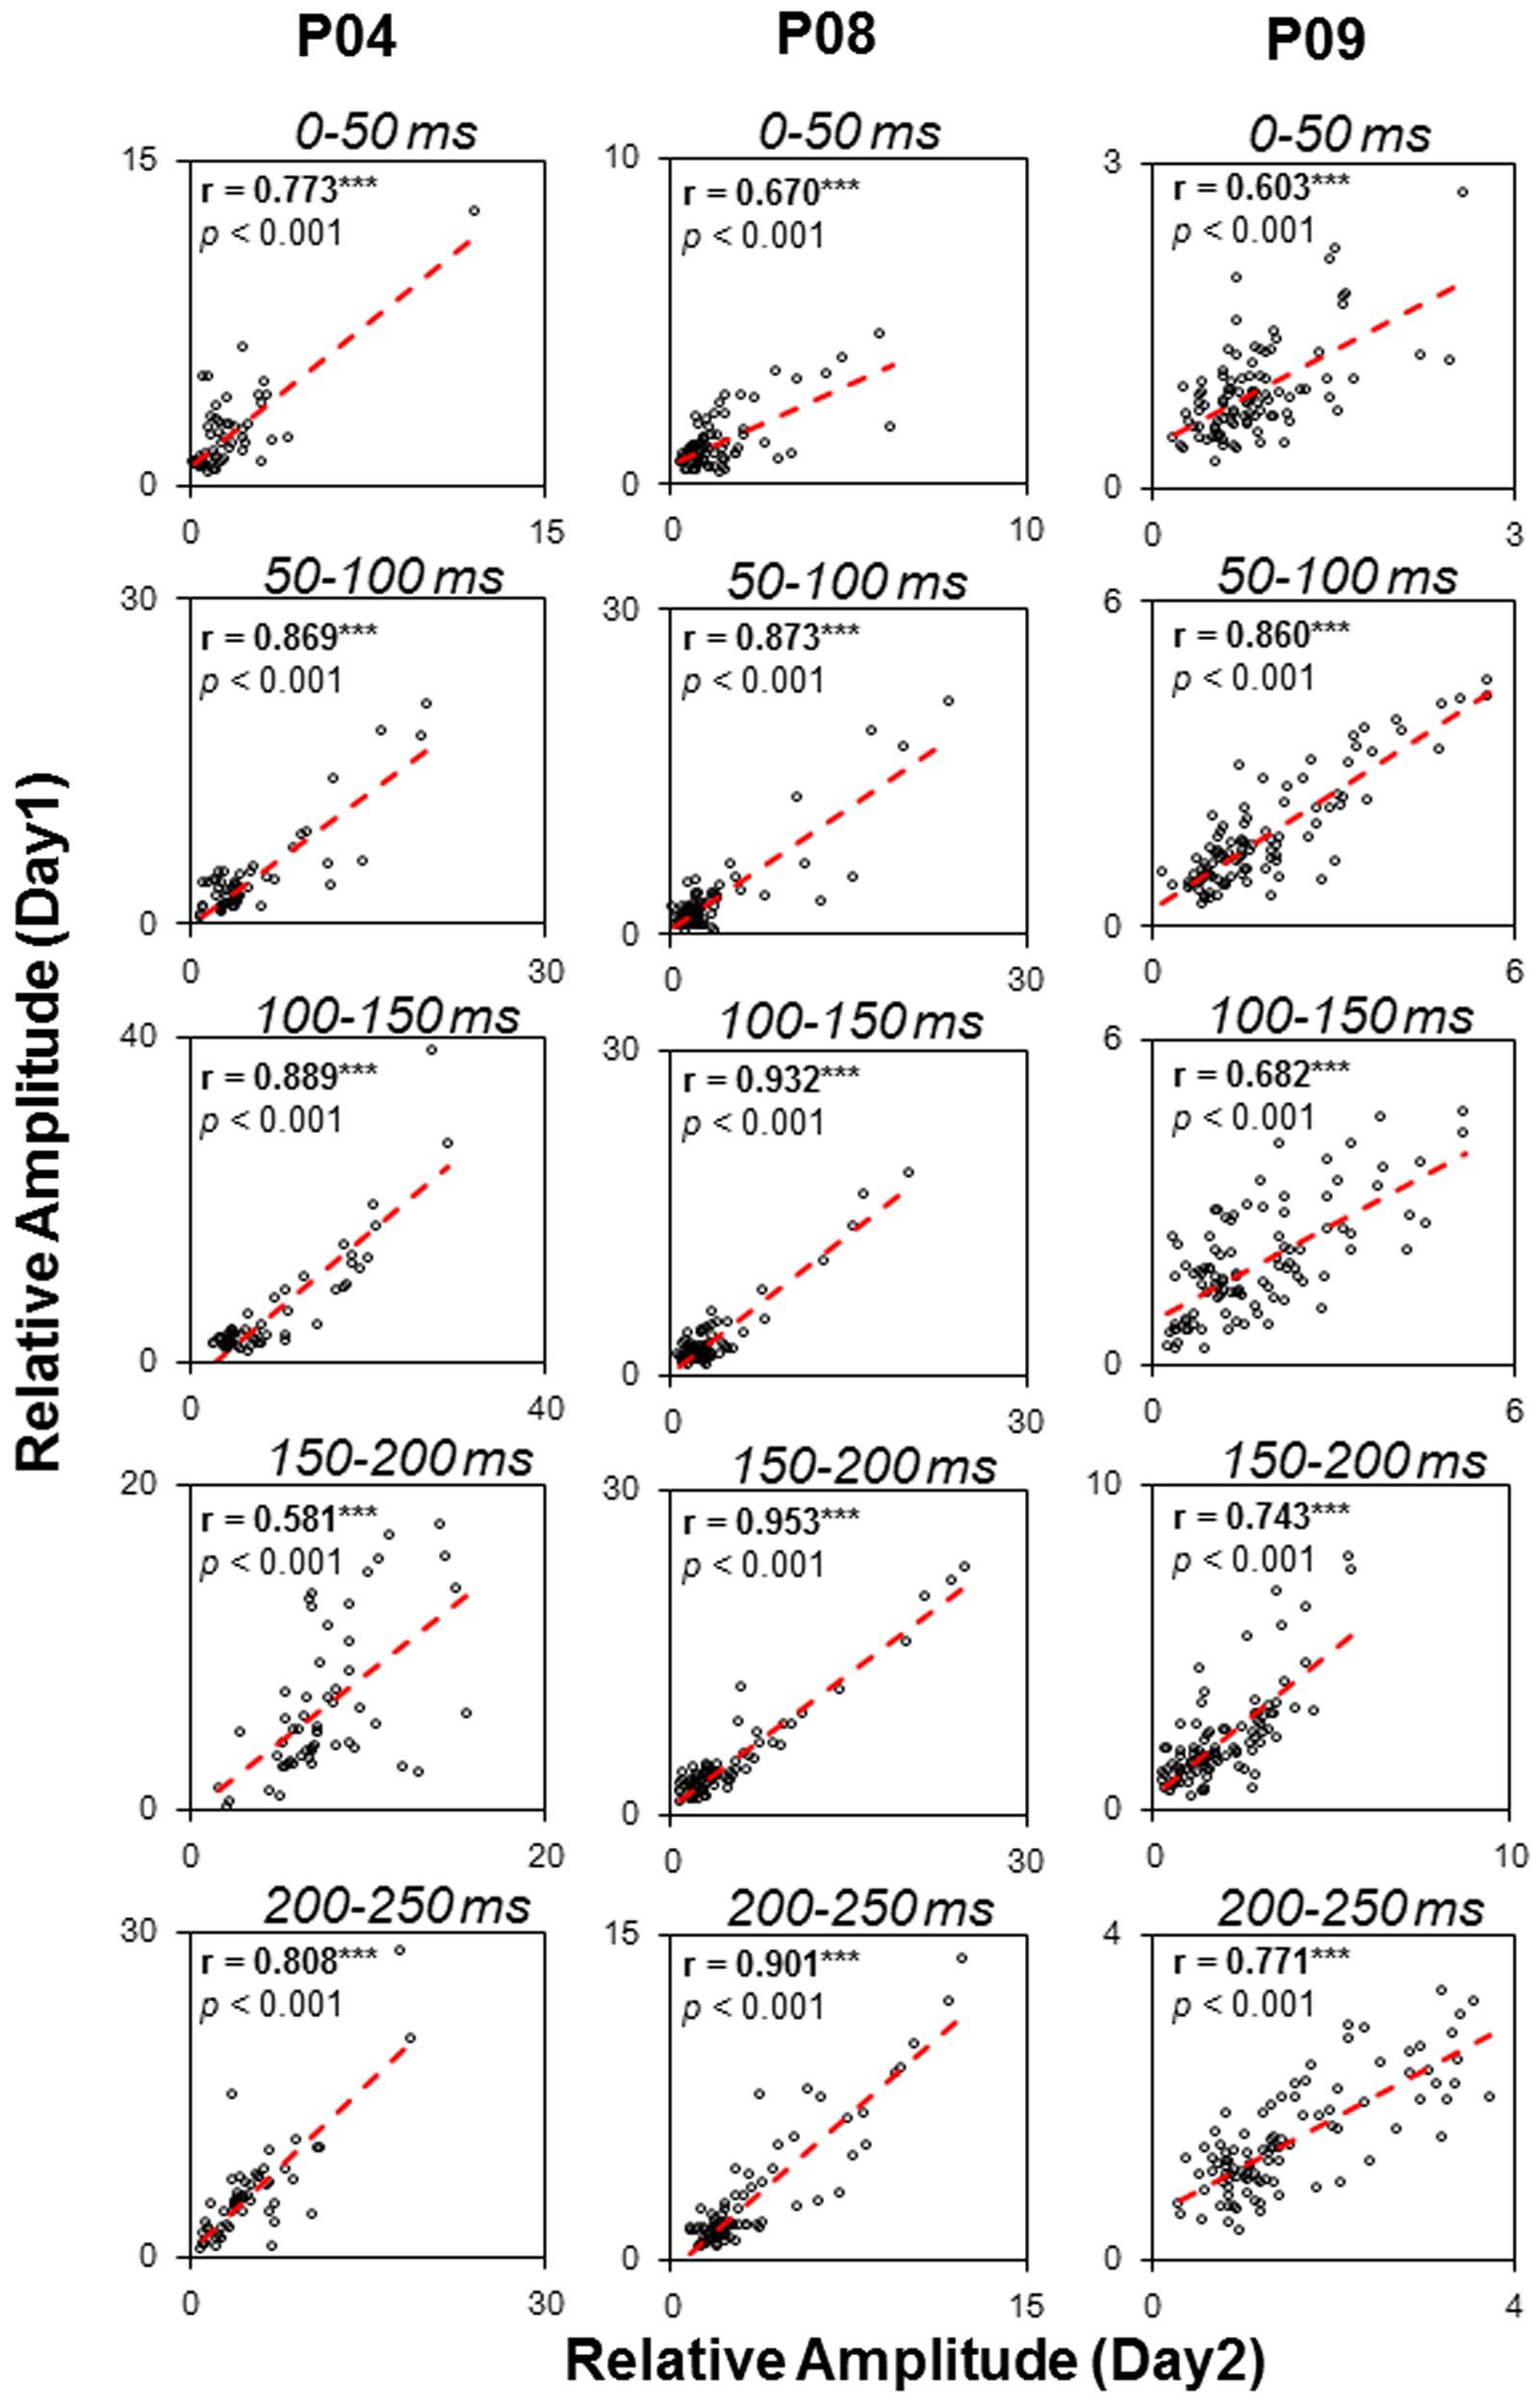
FIGURE 8. Test-retest reliability (Pearson correlation tests) of noise-burst-evoked activities in three participants (P04, P08, and P09). ∗∗∗ p < 0.001.
Furthermore, the correlations between the noise-burst-evoked GC network matrixes (from or to the AC, 0–300 ms) of one participant on the first recording day and those of the same participant on the second recording day were significant (Mantel r tests, all p < 0.05, with Bonferroni adjustment, Figure 9), indicating that the procedure for estimating auditory function networks had a high test-retest reliability.
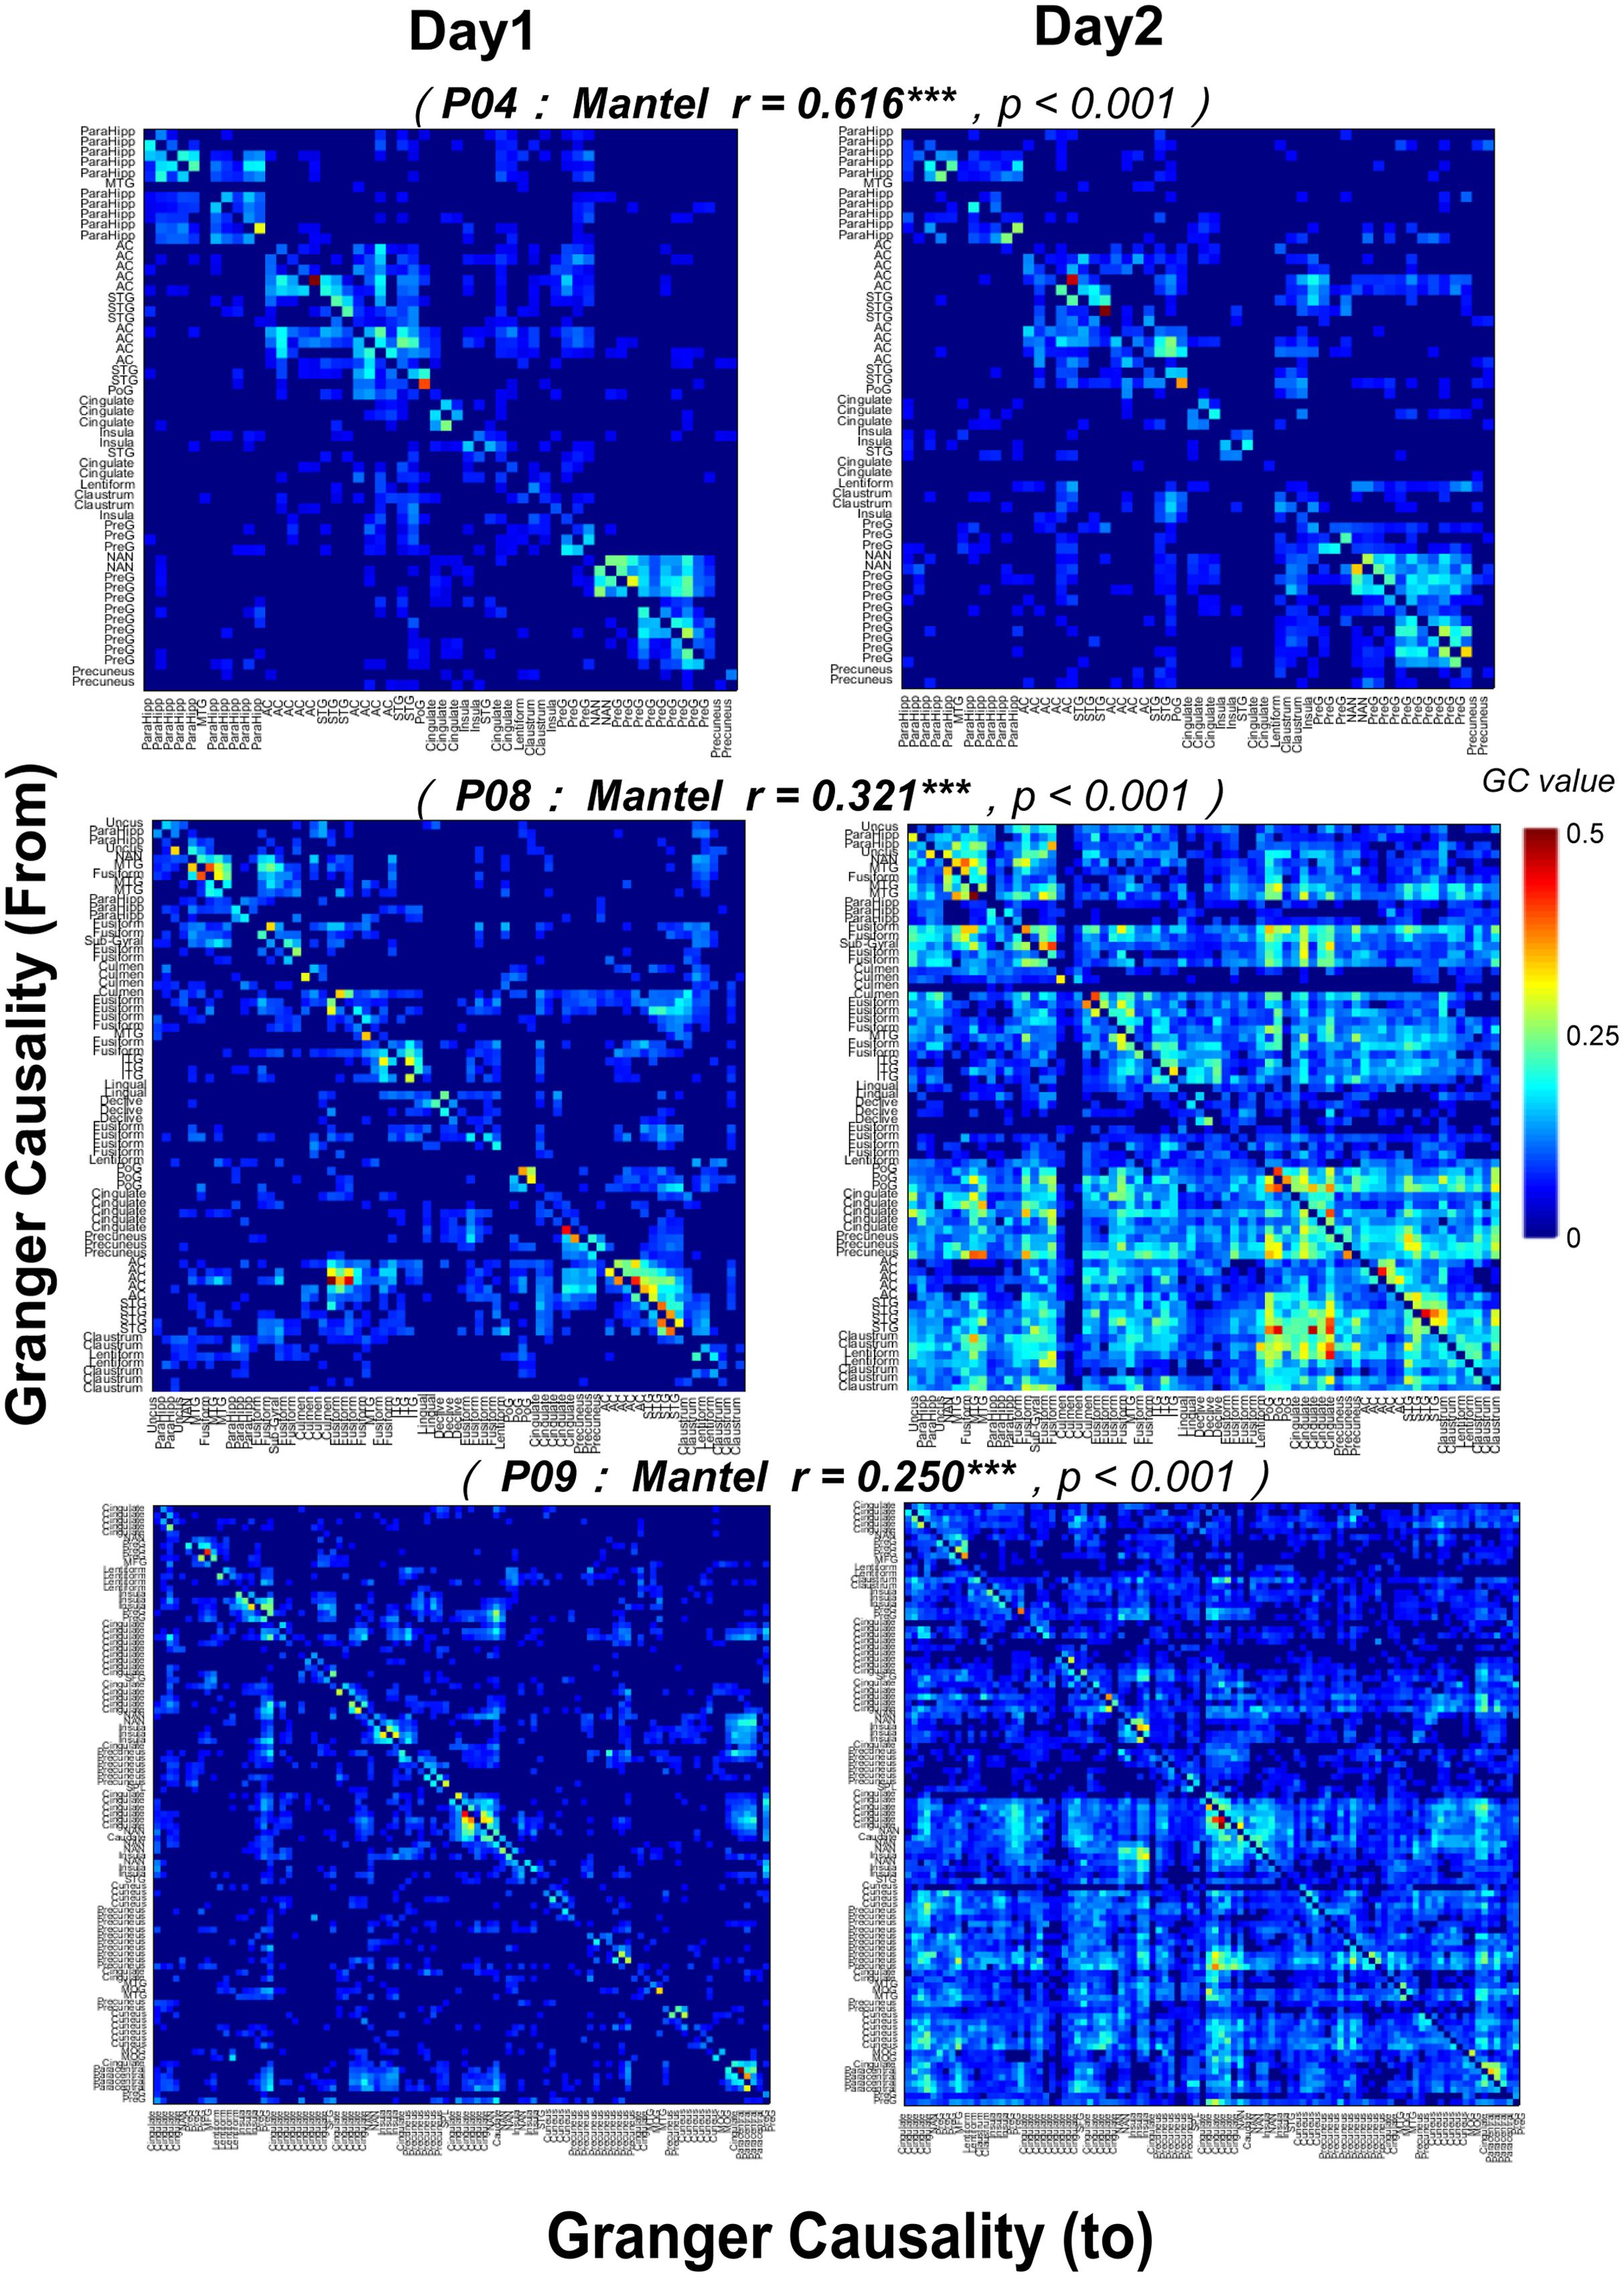
FIGURE 9. Test-retest reliability (Mantel r tests) of noise-burst-evoked GC networks in three participants (P04, P08, and P09). Each of the colorful pixel represents a certain GC value from one electrode to another. The colorful pixel on the diagonal, which represents the GC from a certain electrode to itself and is irrelevant to cross-electrodes analyses, is kept to be zero. The total number of electrodes in each of three participants was 54 (P04), 68 (P08), and 98 (P09), respectively. ∗∗∗ p< 0.001.
Discussion
This study confirms previous reports that in humans both the AC and higher-order cortices can be activated by a sound burst under passive listening conditions (Engelien et al., 1995; Cheung et al., 2016). Utilizing the intracranial sEEG recording method with both high spatial and high temporal resolutions, this study reveals not only dynamic patterns of sound-evoked activation in the AC and some non-auditory cortices, but also interactions between the AC and the higher-order non-auditory cortices.
Earlier and Later Cortical Processing of Auditory Signals
According to the prevalent view, ascending sensory signals reach modality-specific sensory cortices first and then propagate to other higher-order cortices (Pickles, 1982). For example, some scalp-ERP studies have shown that the lower-order AC contributes to the earlier potentials (e.g., P50 and N100) to sound stimulation and the higher-order non-auditory cortices contribute to the later potentials (e.g., P200) (Picton et al., 1974; Scherg et al., 1989). The results of this study indicate that the sound-evoked first-peak potentials with latencies shorter than 50 ms occur only in the AC. Also, the relative amplitudes of ERPs in the AC are consistently larger than those in the non-auditory cortices. Some non-auditory cortices, including the PreG, ITG, insula, STG, and PoG exhibit the first-peak potentials with latencies between 50 and 100 ms. The non-auditory cortices that exhibit the first-peak potentials with latencies longer than 100 ms include the IPL, IFG, MFG, MTG, and ParaHipp. Since these higher-order non-auditory cortices respond to sound-stimulus signals at different time windows, it is of interest to investigate how these non-auditory cortices contribute differentially to the processing of sound signals.
Note that since both the PreG and insula also receive direct axonal projections from the auditory thalamus (Burton and Jones, 1976; Mesulam and Mufson, 1985; Henschke et al., 2015), the first-peak potentials of the PreG and insula may also be driven by the auditory thalamus.
The results of GC analyses of this study suggest that the neural networks with the time window within the first 100 ms after the sound onset show a directional complexity of eFC of the AC: Both bottom-up and top-down signal flow occur between the AC and some non-auditory cortices in this early time window (bottom-up: from the AC to the ITG and IPL; top-down: from the MTG and STG to the AC). Previous neuroimaging studies have suggested that the STG, MTG, and ITG belong to the ventrolateral cortical pathway for sound discrimination (Waberski et al., 2001) and speech perception (Binder et al., 1996, 2000). On the other hand, as a key structure in the dorsal cortical pathway for spatial processing, the IPL is essential for auditory spatial perception (Heilman and Valenstein, 1972; Weeks et al., 1999). The bottom-up eFC from the AC to the ITG and that to the IPL indicate that the sound representation in the AC initializes the sound representation in both the ventrolateral cortical pathway for sound discrimination and the sound representation in the dorsal cortical pathway for spatial processing. The top-down eFC from the MTG/STG to the AC may enhance the sound discrimination process. Thus, further studies in the future should be carried out to examine how the bi-directional eFC between the AC and the higher-order non-auditory cortices plays a role in establishing auditory detection, identification, localization, and/or speech analyses.
Functional Interaction between Intrinsic Connectivity and Extrinsic Connectivity of the Auditory Cortex
The AC receives auditory inputs from both cortical and subcortical structures that are implicated in auditory processing, attention, and learning (Kilgard and Merzenich, 1998; Eliades and Wang, 2003; Polley et al., 2006; Froemke et al., 2007; Budinger et al., 2008; Letzkus et al., 2011). It is of interest to know whether fluctuations of the sound-evoked local activities over time in the AC is associated with these auditory functions.
The AC contains neuronal circuits at multiple scales (Mitani et al., 1985; Barbour and Callaway, 2008; Lee and Winer, 2011; Winer, 2011), forming a hub that both extracts and integrates ascending auditory spectro-temporal features (Griffiths and Warren, 2002; Eggermont, 2007; Gourévitch and Eggermont, 2010; Atencio and Schreiner, 2016). Although previous studies have suggested that iFC within the AC is functionally related with the pitch perception (Albouy et al., 2013), auditory stream segregation (Giani et al., 2015), and integration of different auditory features (Tardif and Clarke, 2001), it is still not clear how iFC of the AC interacts with eFC of the AC for achieving this functions.
This study reveals that although the GC strength of iFC of the AC gradually decays, it does not reach the baseline level within the period of 100–200 ms following the sound onset (up to 150 ms after the sound offset). In the same time period, the information flow from the non-auditory cortices to the AC are significantly stronger than those from the AC to the non-auditory cortices. Thus, the non-auditory cortices may have a strong top-down modulation on the local AC network.
Cognitive functions are based on interactions of various networks in the brain (Bressler and Menon, 2010). The temporal dynamic of the interactions between iFC and eFC of the AC with non-auditory cortices has not been addressed in the literature. The current study for the first time reveals that iFC of the AC is positively correlated with not only the earlier bottom-up flow from the AC to the ITG and IPL, but also the later top-down flow from the PreG and insula to the AC.
It has been known that motor cortices and sensory cortices are not functionally separated. In fact, both sensory and motor cortices are engaged at the same time during perception (Gallese et al., 1996; Wilson and Moss, 2004; Tkach et al., 2007; Cogan et al., 2014). Particularly, listening to speech sounds also evokes robust neural activities in motor cortices (Wilson et al., 2004; Pulvermüller et al., 2006; Edwards et al., 2010; Cogan et al., 2014). Also, motor cortical areas have bidirectional connections with the STG (Zatorre et al., 2007; Rauschecker and Scott, 2009; Cheung et al., 2016), AC (Nelson et al., 2013; Schneider et al., 2014), and the auditory thalamus (Henschke et al., 2015). Thus, the AC integrates both bottom-up signals concerning sound features and top-down signals concerning impending movements and motor planning (Nelson and Mooney, 2016). The modulation from the motor area to the local auditory network revealed by this study reflects a feedback in sensory-motor integration (Hickok et al., 2011).
Moreover, anatomically, the insula receives afferents from the auditory thalamus (Burton and Jones, 1976; Mesulam and Mufson, 1985) and also has connections with the AC (Mesulam and Mufson, 1985) and other association cortices (Augustine, 1985). The insula participates in several auditory processes (Bamiou et al., 2003). Lesions of the bilateral insular lead to auditory agnosia (Fifer, 1993; Habib et al., 1995). Previous studies have also shown that the insula is essential to auditory decision processing (Binder et al., 2004), auditory temporal processing (Ackermann et al., 2001), and sound movement detection (Lewis et al., 2000). The modulation of the AC by the insula will be an interesting issue in future studies.
It should be noted that although the intracranial EEG recording method provides an opportunity to obtaining electrophysiological responses of neuron populations, it bears some shortcomings such as that the electrode placements are sparse compared to the total brain size and each patient has a different coverage of different brain areas. Particularly note that GC analysis may only reveal linear relationships between brain areas, and some non-linear relationships may be either approximated or missed. One important issue that should be addressed in the future is whether interactions between iFC and eFC of the AC are critical for target-sound (such as target-speech) listening under “cocktail-party” conditions.
Conclusion
This study reveals three types of functional connectivity that declines over time after the sound onset: (1) iFC within the AC, (2) bottom-up eFC from the AC to non-auditory cortices, and (3) top-down eFC from non-auditory cortices to the AC. Shortly after the sound onset, iFC of the AC drives out-going eFC to the ITG in the ventral cortical pathway and out-going eFC to the IPL in the dorsal pathway. And then, iFC of the AC reflects top-down eFC from the motor region (PreG) and that from the insula. Interactions between iFC and eFC of the AC following the sound stimulation may be fundamental not only to auditory sensory memory and object formation, but also to integration across sensory, perception, attention, motor, emotion, and executive processes.
Author Contributions
ZC, QW, YaG, and JW: Experimental design, experiment set up, experiment conduction, data analyses, figure/table construction, and paper writing. MW and PT: Experimental design, data analyses, and paper writing. YuG: Experimental design and paper writing. JZ: Experimental design, experiment set up, and paper writing. TL, GL, and LL: Experimental design, figure/table construction, and paper writing.
Funding
This work was supported by Beijing Municipal Science and Technology Commission (Z161100002616016), the “973” National Basic Research Program of China (2015CB351800) and “985” grants from Peking University, the National Natural Science Foundation of China (31470987 and 81571275), Scientific Research Common Program of Beijing Commission of Education (KM201410025027), the China Postdoctoral Science Foundation (2016M601066), the Capital Health Research and Development of Special (2016-1-8012), Beijing Municipal Science and Technology Commission (Z131107002213171, Z161100000516230, and Z161100000116085), and Beijing Nova Program (Z141107001814042).
Conflict of Interest Statement
The authors declare that the research was conducted in the absence of any commercial or financial relationships that could be construed as a potential conflict of interest.
Acknowledgment
We would like to thank Dr. Xing Tian for his valuable comments on the manuscript.
Supplementary Material
The Supplementary Material for this article can be found online at: https://www.frontiersin.org/article/10.3389/fnhum.2017.00407/full#supplementary-material
Footnotes
- ^ http://bioimagesuite.yale.edu
- ^ http://afni.nimh.nih.gov/
- ^ http://www.talairach.org/client.html
- ^ http://neuroimage.usc.edu/brainstorm/
References
Ackermann, H., Hertrich, I., Mathiak, K., and Lutzenberger, W. (2001). Contralaterality of cortical auditory processing at the level of the M50/M100 complex and the mismatch field: a whole-head magnetoencephalography study. Neuroreport 12, 1683–1687. doi: 10.1097/00001756-200106130-00033
Alain, C., Arnott, S. R., and Picton, T. W. (2001). Bottom–up and top–down influences on auditory scene analysis: evidence from event-related brain potentials. J. Exp. Psychol. Hum. Percept. Perform. 27, 1072–1089. doi: 10.1037/0096-1523.27.5.1072
Albouy, P., Mattout, J., Bouet, R., Maby, E., Sanchez, G., Aguera, P. E., et al. (2013). Impaired pitch perception and memory in congenital amusia: the deficit starts in the auditory cortex. Brain 136, 1639–1661. doi: 10.1093/brain/awt082
Atencio, C. A., and Schreiner, C. E. (2016). Functional congruity in local auditory cortical microcircuits. Neuroscience 316, 402–419. doi: 10.1016/j.neuroscience.2015.12.057
Augustine, J. R. (1985). The insular lobe in primates including humans. Neurol. Res. 7, 2–10. doi: 10.1080/01616412.1985.11739692
Bamiou, D. E., Musiek, F. E., and Luxon, L. M. (2003). The insula (Island of Reil) and its role in auditory processing: literature review. Brain Res. Rev. 42, 143–154. doi: 10.1016/S0165-0173(03)00172-3
Barbour, D. L., and Callaway, E. M. (2008). Excitatory local connections of superficial neurons in rat auditory cortex. J. Neurosci. 28, 11174–11185. doi: 10.1523/JNEUROSCI.2093-08.2008
Binder, J. R., Frost, J. A., Hammeke, T. A., Bellgowan, P. S., Springer, J. A., Kaufman, J. N., et al. (2000). Human temporal lobe activation by speech and nonspeech sounds. Cereb. Cortex 10, 512–528. doi: 10.1093/cercor/10.5.512
Binder, J. R., Frost, J. A., Hammeke, T. A., Rao, S. M., and Cox, R. W. (1996). Function of the left planum temporale in auditory and linguistic processing. Brain 119, 1239–1247. doi: 10.1093/brain/119.4.1239
Binder, J. R., Liebenthal, E., Possing, E. T., Medler, D. A., and Ward, B. D. (2004). Neural correlates of sensory and decision processes in auditory object identification. Nat. Neurosci. 7, 295–301. doi: 10.1038/nn1198
Bonte, M., Parviainen, T., Hytönen, K., and Salmelin, R. (2006). Time course of top-down and bottom-up influences on syllable processing in the auditory cortex. Cereb. Cortex 16, 115–123. doi: 10.1093/cercor/bhi091
Bressler, S. L., and Menon, V. (2010). Large-scale brain networks in cognition: emerging methods and principles. Trends Cogn. Sci. 14, 277–290. doi: 10.1016/j.tics.2010.04.004
Brown, S., Martinez, M. J., and Parsons, L. M. (2004). Passive music listening spontaneously engages limbic and paralimbic systems. Neuroreport 15, 2033–2037. doi: 10.1097/00001756-200409150-00008
Budinger, E., Laszcz, A., Lison, H., Scheich, H., and Ohl, F. W. (2008). Non-sensory cortical and subcortical connections of the primary auditory cortex in Mongolian gerbils: bottom-up and top-down processing of neuronal information via field AI. Brain Res. 1220, 2–32. doi: 10.1016/j.brainres.2007.07.084
Burton, H., and Jones, E. G. (1976). The posterior thalamic region and its cortical projection in New World and Old World monkeys. J. Comp. Neurol. 168, 249–301. doi: 10.1002/cne.901680204
Buschman, T. J., and Miller, E. K. (2007). Top-down versus bottom-up control of attention in the prefrontal and posterior parietal cortices. Science 315, 1860–1862. doi: 10.1126/science.1138071
Cheung, C., Hamilton, L. S., Johnson, K., and Chang, E. F. (2016). The auditory representation of speech sounds in human motor cortex. ELife 5:e12577. doi: 10.7554/eLife.12577
Chica, A. B., Bartolomeo, P., and Valero-Cabré, A. (2011). Dorsal and ventral parietal contributions to spatial orienting in the human brain. J. Neurosci. 31, 8143–8149. doi: 10.1523/JNEUROSCI.5463-10.2010
Chiu, Y. C., and Yantis, S. (2009). A domain-independent source of cognitive control for task sets: shifting spatial attention and switching categorization rules. J. Neurosci. 29, 3930–3938. doi: 10.1523/JNEUROSCI.5737-08.2009
Cogan, G. B., Thesen, T., Carlson, C., Doyle, W., Devinsky, O., and Pesaran, B. (2014). Sensory-motor transformations for speech occur bilaterally. Nature 507, 94–98. doi: 10.1038/nature12935
Corbetta, M., Kincade, J. M., Ollinger, J. M., McAvoy, M. P., and Shulman, G. L. (2000). Voluntary orienting is dissociated from target detection in human posterior parietal cortex. Nat. Neurosci. 3, 292–297. doi: 10.1038/73009
Cox, R. W., and Hyde, J. S. (1997). Software tools for analysis and visualization of fMRI data. NMR Biomed. 10, 171–178. doi: 10.1002/(SICI)1099-1492(199706/08)10:4/5<171::AID-NBM453>3.0.CO;2-L
Debener, S., Herrmann, C. S., Kranczioch, C., Gembris, D., and Engel, A. K. (2003). Top-down attentional processing enhances auditory evoked gamma band activity. Neuroreport 14, 683–686. doi: 10.1097/00001756-200304150-00005
Delorme, A., and Makeig, S. (2004). EEGLAB: an open source toolbox for analysis of single-trial EEG dynamics including independent component analysis. J. Neurosci. Methods 134, 9–21. doi: 10.1016/j.jneumeth.2003.10.009
Edwards, A. D., Brocklehurst, P., Gunn, A. J., Halliday, H., Juszczak, E., Levene, M., et al. (2010). Neurological outcomes at 18 months of age after moderate hypothermia for perinatal hypoxic ischaemic encephalopathy: synthesis and meta-analysis of trial data. BMJ 340:c363. doi: 10.1136/bmj.c363
Edwards, E., Soltani, M., Kim, W., Dalal, S. S., Nagarajan, S. S., Berger, M. S., et al. (2009). Comparison of time–frequency responses and the event-related potential to auditory speech stimuli in human cortex. J. Neurophysiol. 102, 377–386. doi: 10.1152/jn.90954.2008
Eggermont, J. J. (2007). Correlated neural activity as the driving force for functional changes in auditory cortex. Hear. Res. 229, 69–80. doi: 10.1016/j.heares.2007.01.008
Elhilali, M., Xiang, J., Shamma, S. A., and Simon, J. Z. (2009). Interaction between attention and bottom-up saliency mediates the representation of foreground and background in an auditory scene. PLoS Biol. 7:e1000129. doi: 10.1371/journal.pbio.1000129
Eliades, S. J., and Wang, X. (2003). Sensory-motor interaction in the primate auditory cortex during self-initiated vocalizations. J. Neurophysiol. 89, 2194–2207. doi: 10.1152/jn.00627.2002
Engelien, A., Sibersweig, D., Stern, E., Huber, W., Frith, C., and Frackowiak, R. S. J. (1995). The functional anatomy of recovery from auditory agnosia. Brain 118, 1395–1409. doi: 10.1093/brain/118.6.1395
Fifer, R. C. (1993). Insular stroke causing unilateral auditory processing disorder: case report. J. Am. Acad. Audiol. 4, 364–369.
Fontolan, L., Morillon, B., Liegeois-Chauvel, C., and Giraud, A. L. (2014). The contribution of frequency-specific activity to hierarchical information processing in the human auditory cortex. Nat. Commun. 5, 4694. doi: 10.1038/ncomms5694
Froemke, R. C., Merzenich, M. M., and Schreiner, C. E. (2007). A synaptic memory trace for cortical receptive field plasticity. Nature 450, 425–429. doi: 10.1038/nature06289
Gallese, V., Fadiga, L., Fogassi, L., and Rizzolatti, G. (1996). Action recognition in the premotor cortex. Brain 119, 593–609. doi: 10.1093/brain/119.2.593
Ghazanfar, A. A., and Schroeder, C. E. (2006). Is neocortex essentially multisensory? Trends Cogn. Sci. 10, 278–285.
Giani, A. S., Belardinelli, P., Ortiz, E., Kleiner, M., and Noppeney, U. (2015). Detecting tones in complex auditory scenes. Neuroimage 122, 203–213. doi: 10.1016/j.neuroimage.2015.07.001
Gourévitch, B., and Eggermont, J. J. (2010). Maximum decoding abilities of temporal patterns and synchronized firings: application to auditory neurons responding to click trains and amplitude modulated white noise. J. Comput. Neurosci. 29, 253–277. doi: 10.1007/s10827-009-0149-3
Griffiths, T. D., and Warren, J. D. (2002). The planum temporale as a computational hub. Trends Neurosci. 25, 348–353. doi: 10.1016/S0166-2236(02)02191-4
Habib, M., Daquin, G., Milandre, L., Royere, M. L., Rey, M., Lanteri, A., et al. (1995). Mutism and auditory agnosia due to bilateral insular damage—role of the insula in human communication. Neuropsychologia 33, 327–339. doi: 10.1016/0028-3932(94)00108-2
Heilman, K. M., and Valenstein, E. (1972). Auditory neglect in man. Arch. Neurol. 26, 32–35. doi: 10.1001/archneur.1972.00490070050007
Henschke, J. U., Noesselt, T., Scheich, H., and Budinger, E. (2015). Possible anatomical pathways for short-latency multisensory integration processes in primary sensory cortices. Brain Struct. Funct. 220, 955–977. doi: 10.1007/s00429-013-0694-4
Hickok, G., Houde, J., and Rong, F. (2011). Sensorimotor integration in speech processing: computational basis and neural organization. Neuron 69, 407–422. doi: 10.1016/j.neuron.2011.01.019
Iversen, J. R., Repp, B. H., and Patel, A. D. (2009). Top-down control of rhythm perception modulates early auditory responses. Ann. N. Y. Acad. Sci. 1169, 58–73. doi: 10.1111/j.1749-6632.2009.04579.x
Kilgard, M. P., and Merzenich, M. M. (1998). Plasticity of temporal information processing in the primary auditory cortex. Nat. Neurosci. 1, 727–731. doi: 10.1038/3729
Korzeniewska, A., Franaszczuk, P. J., Crainiceanu, C. M., Kuś, R., and Crone, N. E. (2011). Dynamics of large-scale cortical interactions at high gamma frequencies during word production: event related causality (ERC) analysis of human electrocorticography (ECoG). Neuroimage 56, 2218–2237. doi: 10.1016/j.neuroimage.2011.03.030
Kubanek, J., and Schalk, G. (2015). NeuralAct: a tool to visualize electrocortical (ECoG) activity on a three-dimensional model of the cortex. Neuroinformatics 13, 167–174. doi: 10.1007/s12021-014-9252-3
Lachaux, J. P., Jerbi, K., Bertrand, O., Minotti, L., Hoffmann, D., Schoendorff, B., et al. (2007). A blueprint for real-time functional mapping via human intracranial recordings. PLoS ONE 2:e1094. doi: 10.1371/journal.pone.0001094
Lee, C. C., and Winer, J. A. (2011). Convergence of thalamic and cortical pathways in cat auditory cortex. Hear. Res. 274, 85–94. doi: 10.1016/j.heares.2010.05.008
Letzkus, J. J., Wolff, S. B., Meyer, E. M., Tovote, P., Courtin, J., Herry, C., et al. (2011). A. disinhibitory microcircuit for associative fear learning in the auditory cortex. Nature 480, 331–335. doi: 10.1038/nature10674
Lewis, J. W., Beauchamp, M. S., and DeYoe, E. A. (2000). A comparison of visual and auditory motion processing in human cerebral cortex. Cereb. Cortex 10, 873–888. doi: 10.1093/cercor/10.9.873
Londei, A., D’Ausilio, A., Basso, D., Sestieri, C., Del Gratta, C., Romani, G. L., et al. (2007). Brain network for passive word listening as evaluated with ICA and Granger causality. Brain Res. Bull. 72, 284–292. doi: 10.1016/j.brainresbull.2007.01.008
Mesgarani, N., and Chang, E. F. (2012). Selective cortical representation of attended speaker in multi-talker speech perception. Nature 485, 233–236. doi: 10.1038/nature11020
Mesgarani, N., Cheung, C., Johnson, K., and Chang, E. F. (2014). Phonetic feature encoding in human superior temporal gyrus. Science 343, 1006–1010. doi: 10.1126/science.1245994
Mesulam, M. M., and Mufson, E. J. (1985). The Insula of Reil in Man and Monkey. Association and Auditory Cortices. Boston, MA: Springer, 179–226. doi: 10.1007/978-1-4757-9619-3_5
Mitani, A., Shimokouchi, M., Itoh, K., Nomura, S., Kudo, M., and Mizuno, N. (1985). Morphology and laminar organization of electrophysiologically identified neurons in the primary auditory cortex in the cat. J. Comp. Neurol. 235, 430–447. doi: 10.1002/cne.902350403
Nelson, A., and Mooney, R. (2016). The basal forebrain and motor cortex provide convergent yet distinct movement-related inputs to the auditory cortex. Neuron 90, 635–648. doi: 10.1016/j.neuron.2016.03.031
Nelson, A., Schneider, D. M., Takatoh, J., Sakurai, K., Wang, F., and Mooney, R. (2013). A circuit for motor cortical modulation of auditory cortical activity. J. Neurosci. 33, 14342–14353. doi: 10.1523/JNEUROSCI.2275-13.2013
Nourski, K. V., and Howard, M. A. (2015). Invasive recordings in the human auditory cortex. Handb. Clin. Neurol. 129, 225–244. doi: 10.1016/B978-0-444-62630-1.00013-5
O’Connor, K. (2012). Auditory processing in autism spectrum disorder: a review. Neurosci. Biobehav. Rev. 36, 836–854. doi: 10.1016/j.neubiorev.2011.11.008
Pardo, J. V., Fox, P. T., and Raichle, M. E. (1991). Localization of a human system for sustained attention by positron emission tomography. Nature 349, 61–64. doi: 10.1038/349061a0
Pasley, B. N., David, S. V., Mesgarani, N., Flinker, A., Shamma, S. A., Crone, N. E., et al. (2012). Reconstructing speech from human auditory cortex. PLoS Biol. 10:e1001251. doi: 10.1371/journal.pbio.1001251
Pickles, J. O. (1982). An Introduction to the Physiology of Hearing, 3rd Edn. Cambridge, MA: Academic Press.
Picton, T. W., Hillyard, S. A., Krausz, H. I., and Galambos, R. (1974). Human auditory evoked potentials. I: evaluation of components. Electroencephalogr. Clin. Neurophysiol. 36, 179–190. doi: 10.1016/0013-4694(74)90155-2
Polley, D. B., Steinberg, E. E., and Merzenich, M. M. (2006). Perceptual learning directs auditory cortical map reorganization through top-down influences. J. Neurosci. 26, 4970–4982. doi: 10.1523/JNEUROSCI.3771-05.2006
Potes, C., Brunner, P., Gunduz, A., Knight, R. T., and Schalk, G. (2014). Spatial and temporal relationships of electrocorticographic alpha and gamma activity during auditory processing. Neuroimage 97, 188–195. doi: 10.1016/j.neuroimage.2014.04.045
Potes, C., Gunduz, A., Brunner, P., and Schalk, G. (2012). Dynamics of electrocorticographic (ECoG) activity in human temporal and frontal cortical areas during music listening. Neuroimage 61, 841–848. doi: 10.1016/j.neuroimage.2012.04.022
Pulvermüller, F., Huss, M., Kherif, F., del Prado Martin, F. M., Hauk, O., and Shtyrov, Y. (2006). Motor cortex maps articulatory features of speech sounds. Proc. Natl. Acad. Sci. U.S.A. 103, 7865–7870. doi: 10.1073/pnas.0509989103
Rauschecker, J. P., and Scott, S. K. (2009). Maps and streams in the auditory cortex: nonhuman primates illuminate human speech processing. Nat. Neurosci. 12, 718–724. doi: 10.1038/nn.2331
Salmi, J., Rinne, T., Koistinen, S., Salonen, O., and Alho, K. (2009). Brain networks of bottom-up triggered and top-down controlled shifting of auditory attention. Brain Res. 1286, 155–164. doi: 10.1016/j.brainres.2009.06.083
Scherg, M., Hari, R., and Hämäläinen, M. (1989). “Frequency-specific sources of the auditory N19-P30-P50 response detected by a multiple source analysis of evoked magnetic fields and potentials,”,” in Advances in Biomagnetism, eds S. J. Williamson, M. Hoke, G. Stroink, and M. Kotani (Boston, MA: Springer), 97–100. doi: 10.1007/978-1-4613-0581-1_11
Schneider, D. M., Nelson, A., and Mooney, R. A. (2014). synaptic and circuit basis for corollary discharge in the auditory cortex. Nature 513, 189–194. doi: 10.1038/nature13724
Serences, J. T., Shomstein, S., Leber, A. B., Golay, X., Egeth, H. E., and Yantis, S. (2005). Coordination of voluntary and stimulus-driven attentional control in human cortex. Psychol. Sci. 16, 114–122. doi: 10.1111/j.0956-7976.2005.00791.x
Seth, A. K. (2010). A MATLAB toolbox for Granger causal connectivity analysis. J. Neurosci. Methods 186, 262–273. doi: 10.1016/j.jneumeth.2009.11.020
Sinai, A., Crone, N. E., Wied, H. M., Franaszczuk, P. J., Miglioretti, D., and Boatman-Reich, D. (2009). Intracranial mapping of auditory perception: event-related responses and electrocortical stimulation. Clin. Neurophysiol. 120, 140–149. doi: 10.1016/j.clinph.2008.10.152
Sohoglu, E., Peelle, J. E., Carlyon, R. P., and Davis, M. H. (2012). Predictive top-down integration of prior knowledge during speech perception. J. Neurosci. 32, 8443–8453. doi: 10.1523/JNEUROSCI.5069-11.2012
Sussman, E., Winkler, I., Huotilainen, M., Ritter, W., and Näätänen, R. (2002). Top-down effects can modify the initially stimulus-driven auditory organization. Cogn. Brain Res. 13, 393–405. doi: 10.1016/S0926-6410(01)00131-8
Tadel, F., Baillet, S., Mosher, J. C., Pantazis, D., and Leahy, R. M. (2011). Brainstorm: a user-friendly application for MEG/EEG analysis. Comput. Intell. Neurosci. 2011, 13. doi: 10.1155/2011/879716
Tardif, E., and Clarke, S. (2001). Intrinsic connectivity of human auditory areas: a tracing study with DiI. Eur. J. Neurosci. 13, 1045–1050. doi: 10.1046/j.0953-816x.2001.01456.x
Tkach, D., Reimer, J., and Hatsopoulos, N. G. (2007). Congruent activity during action and action observation in motor cortex. J. Neurosci. 27, 13241–13250. doi: 10.1523/JNEUROSCI.2895-07.2007
Tschiassny, K. (1946). Tuning fork tests; a historical review. Ann. Otol. Rhinol. Laryngol. 55, 423–430. doi: 10.1177/000348944605500215
Waberski, T. D., Kreitschmann-Andermahr, I., Kawohl, W., Darvas, F., Ryang, Y., Gobbelé, R., et al. (2001). Spatio-temporal source imaging reveals subcomponents of the human auditory mismatch negativity in the cingulum and right inferior temporal gyrus. Neurosci. Lett. 308, 107–110. doi: 10.1016/S0304-3940(01)01988-7
Weeks, R. A., Aziz-Sultan, A., Bushara, K. O., Tian, B., Wessinger, C. M., Dang, N., et al. (1999). A PET study of human auditory spatial processing. Neurosci. Lett. 262, 155–158. doi: 10.1016/S0304-3940(99)00062-2
Wilson, S. M., Saygin, A. P., Sereno, M. I., and Iacoboni, M. (2004). Listening to speech activates motor areas involved in speech production. Nat. Neurosci. 7, 701–702. doi: 10.1038/nn1263
Wilson, W. W., and Moss, C. F. (2004). “Sensory-motor behavior of free-flying FM bats during target capture,” in Echolocation in Bats and Dolphins, eds J. A. Thomas, C. F. Moss, and M. Vater (Chicago, IL: The University of Chicago Press), 22–27.
Winer, J. A. (2011). “A profile of auditory forebrain connections and circuits,” in The Auditory Cortex, eds J. Winer and C. Schreiner (Boston, MA: Springer), 41–74.
Keywords: auditory evoked potential, auditory cortex, granger causal analysis, stereo-electroencephalography, intrinsic/extrinsic connectivity
Citation: Cui Z, Wang Q, Gao Y, Wang J, Wang M, Teng P, Guan Y, Zhou J, Li T, Luan G and Li L (2017) Dynamic Correlations between Intrinsic Connectivity and Extrinsic Connectivity of the Auditory Cortex in Humans. Front. Hum. Neurosci. 11:407. doi: 10.3389/fnhum.2017.00407
Received: 13 March 2017; Accepted: 25 July 2017;
Published: 11 August 2017.
Edited by:
Juliana Yordanova, Institute of Neurobiology, Bulgarian Academy of Sciences, BulgariaReviewed by:
Márk Molnár, Institute of Cognitive Neuroscience and Psychology, Centre of Natural Sciences, Hungarian Academy of Sciences, HungaryJulia Stephen, The Mind Research Network, United States
Copyright © 2017 Cui, Wang, Gao, Wang, Wang, Teng, Guan, Zhou, Li, Luan and Li. This is an open-access article distributed under the terms of the Creative Commons Attribution License (CC BY). The use, distribution or reproduction in other forums is permitted, provided the original author(s) or licensor are credited and that the original publication in this journal is cited, in accordance with accepted academic practice. No use, distribution or reproduction is permitted which does not comply with these terms.
*Correspondence: Guoming Luan, luangm3@163.com Liang Li, liangli@pku.edu.cn
†These authors have contributed equally to this work.