Longitudinal Diffusion Tensor Imaging-Based Assessment of Tract Alterations: An Application to Amyotrophic Lateral Sclerosis
 Dobri Baldaranov1
  Andrei Khomenko1
  Ines Kobor1
  Ulrich Bogdahn1
  Martin Gorges2
  Jan Kassubek2
  Hans-Peter Müller2*
- 1Department of Neurology, University of Regensburg, Regensburg, Germany
- 2Department of Neurology, University of Ulm, Ulm, Germany
Objective: The potential of magnetic resonance imaging (MRI) as a technical biomarker for cerebral microstructural alterations in neurodegenerative diseases is under investigation. In this study, a framework for the longitudinal analysis of diffusion tensor imaging (DTI)-based mapping was applied to the assessment of predefined white matter tracts in amyotrophic lateral sclerosis (ALS), as an example for a rapid progressive neurodegenerative disease.
Methods: DTI was performed every 3 months in six patients with ALS (mean (M) = 7.7; range 3 to 15 scans) and in six controls (M = 3; range 2–5 scans) with the identical scanning protocol, resulting in a total of 65 longitudinal DTI datasets. Fractional anisotropy (FA), mean diffusivity (MD), axonal diffusivity (AD), radial diffusivity (RD), and the ratio AD/RD were studied to analyze alterations within the corticospinal tract (CST) which is a prominently affected tract structure in ALS and the tract correlating with Braak’s neuropathological stage 1. A correlation analysis was performed between progression rates based on DTI metrics and the revised ALS functional rating scale (ALS-FRS-R).
Results: Patients with ALS showed an FA and AD/RD decline along the CST, while DTI metrics of controls did not change in longitudinal DTI scans. The FA and AD/RD decrease progression correlated significantly with ALS-FRS-R decrease progression.
Conclusion: On the basis of the longitudinal assessment, DTI-based metrics can be considered as a possible noninvasive follow-up marker for disease progression in neurodegeneration. This finding was demonstrated here for ALS as a fast progressing neurodegenerative disease.
Introduction
Diffusion tensor imaging (DTI) allows analysis of the structural connectivity in neurodegenerative diseases such as amyotrophic lateral sclerosis (ALS; Bede and Hardiman, 2014; Agosta et al., 2015; Kassubek and Müller, 2016), Alzheimer’s disease (Teipel et al., 2014), and Parkinsonism (Cochrane and Ebmeier, 2013; Meijer et al., 2013). DTI can quantify the integrity of large white matter tracts in vivo using metrics such as fractional anisotropy (FA), mean diffusivity (MD), and axial (AD) and radial diffusivity (RD; Pierpaoli and Basser, 1996; Le Bihan et al., 2001). The statistical analysis can be performed by various approaches, e.g., whole brain-based spatial statistics (WBSS; Müller and Kassubek, 2013) or tract-based quantification by analyzing DTI metrics along tract systems (Sarica et al., 2017). Well established techniques in this field are tract based spatial statistics (TBSS—Smith et al., 2006), tracts constrained by underlying anatomy (TRACULA—Sarica et al., 2014), or tractwise fractional anisotropy statistics (TFAS—Müller et al., 2007b). An overview of standardized DTI analysis tools is given in Soares et al. (2013).
Specifically, the use of DTI has substantially improved the understanding of the in vivo cerebral and spinal neuropathology of the neurodegenerative disorder ALS (Turner, 2011; Turner et al., 2011, 2012; Filippi et al., 2015) as a rapidly progressive neurodegenerative disease with a well-defined neuroanatomical propagation pattern (Braak et al., 2013; Brettschneider et al., 2013; Jucker and Walker, 2013). The extensive application to the study of ALS has undoubtedly improved the understanding of disease pathophysiology and is likely to have a role in the identification of potential biomarkers of disease progression (Agosta et al., 2010). The recently introduced neuropathological staging system in ALS (Braak et al., 2013; Brettschneider et al., 2013, 2015) has already been transferred to a DTI-based in vivo imaging concept, indicating that ALS may disseminate in regional patterns (Kassubek et al., 2014; Müller et al., 2016). The initially affected CNS tract structure is the corticospinal tract (CST), as the correlate of histopathological ALS-stage 1 (Kassubek et al., 2014; Müller et al., 2016).
To this end, longitudinal studies in neurodegeneration are superior to cross-sectional studies in characterizing specific disease phenotypes and genotypes (Schuster et al., 2015). Previous longitudinal magnetic resonance imaging (MRI) studies in ALS have already been applied to subject groups with follow-up visits and reported FA reduction in the CST (Cardenas-Blanco et al., 2016; Kassubek et al., 2017). However, longitudinal MRI studies are rare particularly in ALS, due to the strains that MRI data acquisition puts on severely handicapped patients with this fast progressive disease so that longitudinal studies usually include a baseline and one or two follow-up scans (Zhang et al., 2011; Keil et al., 2012; Kwan et al., 2012; Abhinav et al., 2014; Menke et al., 2014; Steinbach et al., 2015; Cardenas-Blanco et al., 2016). In the current study, an investigation by DTI-based metrics in ALS patients with up to 14 follow-up scans was performed.
The aim of this study was to correlate in vivo imaging markers with the clinical performance (ALS-FRS-R score) over time in order to assess the DTI-based correlates of clinical progression and, mechanistically, to analyze the biomarker potential of DTI to assess disease progression. The hypothesis of this study was that DTI metrics alterations in ALS related tract systems correlate to parameters of clinical progression and thus might be used as an additional marker for disease progression.
Materials and Methods
Subjects and Scanning Protocol
Sixty-five longitudinal DTI data sets from six ALS patients and six healthy subjects were recorded with the identical scanning protocol after informed consent; the average time interval between the scans was 3 months (interquartile range 3–4 months). Patients were assessed only if they felt capable for MRI examination. The mean follow-up time was 26 months (range 9–48 months). Patients were 5 males and 1 female (mean age 43 years, range 26–60), and controls were 5 males and 1 female (mean 40 years, range 24–54). All ALS patients were diagnosed according to revised El Escorial criteria (Ludolph et al., 2015) and had spinal onset (3 with upper limb). Mean ALS-FRS-R was initially 41 (range 22–48), mean disease duration from diagnosis was 5 months (range 1–14 months), mean time from first symptom was 18 months (range 8–41 months). For the assessment of the clinical condition, the revised ALS functional rating scale (ALS-FRS-R; Cedarbaum et al., 1999) was determined each month. All ALS patients had received longterm G-CSF (Zhang et al., 2009; Pollari et al., 2011) after informed consent on a named patient basis (compassionate use, local ethics committee of the University of Regensburg, project # 15-101-0106). The details about the participants and the participants’ toxicology can be found in Grassinger et al. (2014). All subjects gave written informed consent in accordance with the Declaration of Helsinki. Scan statistics and subjects characterization are summarized in Table 1.
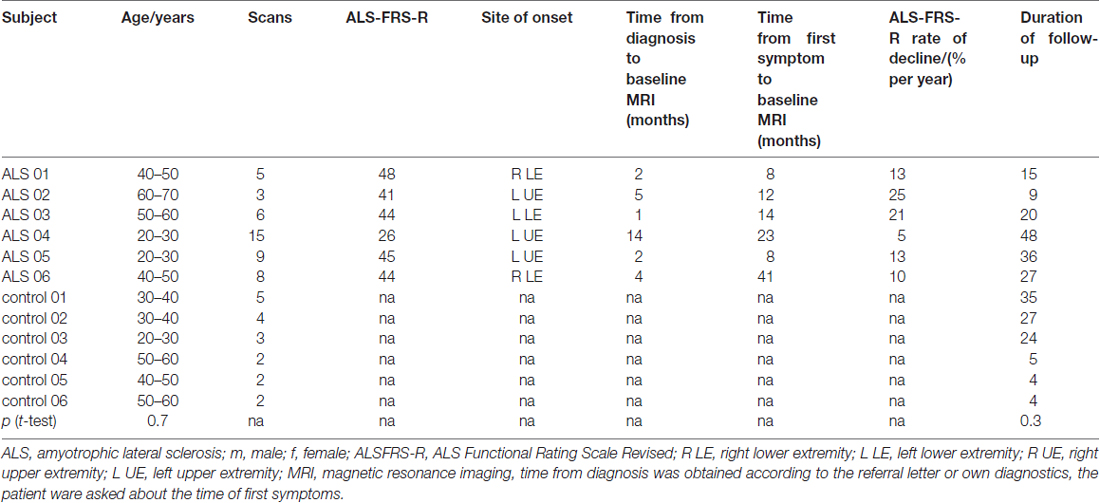
Table 1. Baseline characteristics of patients and controls.
Scanning was performed on a 1.5 Tesla clinical scanner (Aera, Siemens Medical, Erlangen, Germany). The DTI protocol consisted of 3 × 21 volumes (25 slices, 128 × 128 pixels, slice thickness 5.0 mm, in-plane pixel size 1.8 × 1.8 mm2), representing 20 gradient directions (GD) and one scan with gradient 0 (b0); repetition time (TR) was 3500 ms, echo time (TE) was 83 ms, and the b-value was 1000 s/mm2, acquisition time was 7 min.
Data Analysis
The DTI analysis software Tensor Imaging and Fiber Tracking (TIFT; Müller et al., 2007a) was used for the data processing. For an overview of the analysis procedure, a schematic description is provided in Figure 1.
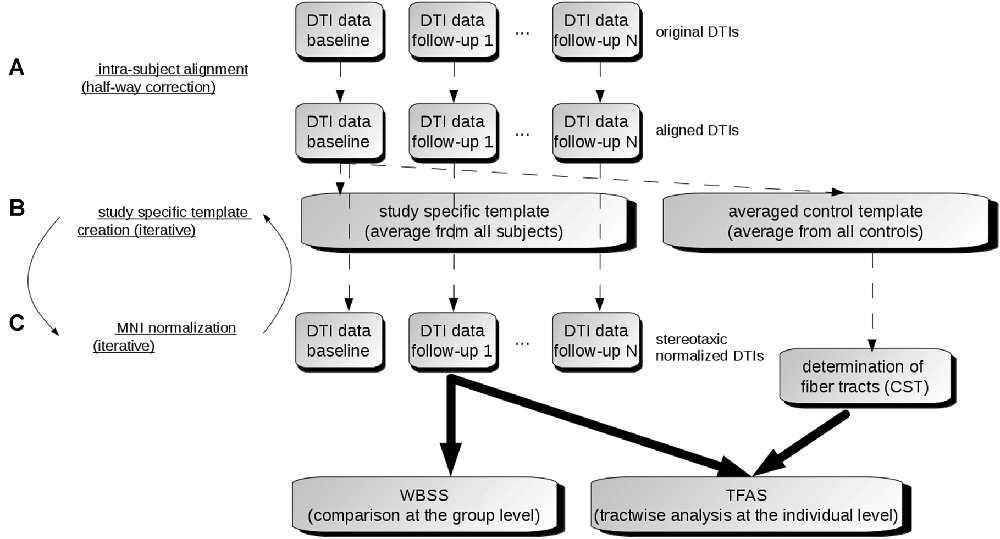
Figure 1. Data analysis scheme. (A) In order to obtain a common coordinate frame, all diffusion tensor imaging (DTI) data (b0) were aligned to baseline data. From these b0, a subject-specific template was created for each subject separately. In the next step, b0 of baseline and follow-ups were aligned to the subject-specific template. (B) After creation of a study-specific template in the Montreal Neurological Institute (MNI) coordinate frame, DTI data of all visits were stereotaxically normalized (C). DTI metrics maps were calculated from normalized DTI data. Then, the voxelwise statistical comparison between the patients and the control group was performed. After averaging controls’ data sets, fiber tracts were calculated from this averaged data set. Finally, tractwise fractional anisotropy statistics (TFAS) was applied.
Alignment of Individual Longitudinal Scans
In a first step, b0 maps of longitudinal scans were aligned to the b0 map of the baseline scan for all individuals separately by a conjugate simplex fitting procedure, thus minimizing the intensity differences. In a second step, an average b0 map was calculated for each individual from all aligned b0 maps, and then all b0 maps (including the baseline scan) were aligned to that b0 template. Thus, the bias of the baseline scan (Menke et al., 2014) was minimized (Figure 1A).
Stereotaxic Normalization and DTI Metrics
Spatial normalization to the Montreal Neurological Institute (MNI) stereotaxic standard space (Brett et al., 2002) was performed by creating a study-specific (b0)-template and FA-template in an iterative manner (Müller and Kassubek, 2013; Figure 1B). DTI-based maps, i.e., FA, AD, MD, RD and the ratio AD/RD, were calculated from these MNI normalized data sets. FA is a summary measure of microstructural integrity. While FA is highly sensitive to microstructural changes, it is less specific to the type of change. MD is an inverse measure of the membrane density, AD tends to be variable in WM changes and axonal injury, and RD increases in WM with dysmyelination. Changes in the axonal diameters or density may also influence RD (Song et al., 2002). The ratio AD/RD correlates with white matter disruption in pathological states whereas these data suggest myelination and/or inflammation in gray matter (Wang et al., 2015). Finally, these DTI metrics maps were smoothed with an 8 mm full width at half-maximum Gaussian filter in order to achieve a good balance between sensitivity and specificity (Unrath et al., 2010; Rosenbohm et al., 2016).
Whole Brain-Based Spatial Statistics (WBSS)—Comparison at the Group Level
WBSS for all DTI metrics was performed as a voxelwise comparison by Student’s t-test. Voxels with FA values below 0.2 were not considered for statistical analysis as cortical gray matter shows FA values up to 0.2 (Kunimatsu et al., 2004). Results were corrected for multiple comparisons at p < 0.05 using the false-discovery-rate (FDR) algorithm (Genovese et al., 2002). Clustering procedure for further reduction of type I and type II errors was applied with a threshold cluster size of 512 voxels, corresponding to a sphere with a radius of approximately two acquisition voxels (Figure 1C).
Fiber Tracking and Tractwise Fractional Anisotropy Statistics (TFAS)
For fiber tracking (FT), an averaged DTI data set was calculated from control data sets by arithmetic averaging of the MNI transformed data while preserving directional information of individual data sets (Müller et al., 2009). This averaged control DTI data set was then used to identify the tract structures with a seed-to-target approach for which seed and target region had a radius of 10 mm each, defining a tract of interest (TOI). For the FT technique, a modified deterministic streamline tracking approach was used (Müller et al., 2007b). Parameters for FT were an FA-threshold of 0.2 and an Eigenvector scalar product threshold of 0.9. In a consecutive step, the technique of TFAS (Müller et al., 2009, 2012) was applied for quantification by use of a TOI-based selection of FA values underlying the FT (Figure 1C). TFAS has originally been developed for FA analysis and has been extended to analyze also further DTI metrics as AD, RD, MD and the ratio AD/RD (Rosenbohm et al., 2016).
TFAS was performed for each scan of each individual, and the changes of averaged DTI metrics’ values were used to calculate the progression rate (in % per year) by
where 0.365 is the mean FA value of controls in the CST and s is the elevation obtained by fitting a regression line. The progression rate (in % per year) for ALS-FRS-R was defined by
In order to provide an estimation of the reproducibility, the coefficient of variation was determined for the different DTI metrics of controls.
Results
Mapping of the Corticospinal Tract by Fiber Tracking
The ALS patients showed ALS-associated white matter alterations in general agreement with previous studies (e.g., Salat et al., 2005; Müller et al., 2016), i.e., an FA decrease along the CST. In order to avoid an unequal weighting in the statistical analysis for the subjects with five or more scans compared to subjects with lower scan numbers, WBSS results were limited to a maximum of two scans from each subject. MD, AD and RD showed an increase in regions along the CST, while FA and the ratio AD/RD showed a decrease in these areas (Figure 2A). For FT along the CST, seed and target MNI coordinates were ±22/−20/14 and ±24/−30/50, respectively. Figure 2B shows an overlay of cross-sectional FA results clusters and fiber tracts.
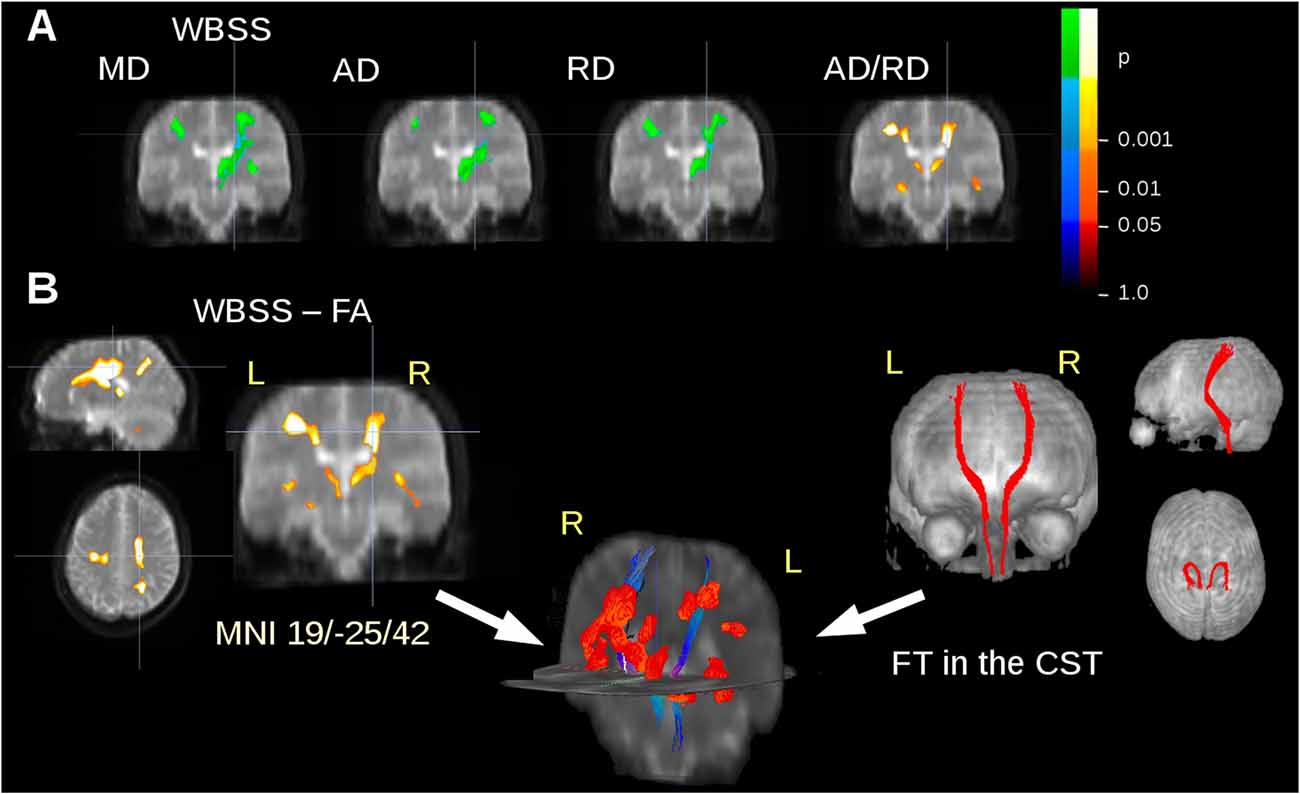
Figure 2. DTI metrics alterations at the group level. (A) Whole brain-based spatial statistics (WBSS) of the comparison amyotrophic lateral sclerosis (ALS) patients vs. controls: results clusters of mean diffusivity (MD), axial diffusivity (AD), radial diffusivity (RD), and the ratio AD/RD for coronal slice at y = −25. (B) Results clusters for Fractional anisotropy (FA) maps (as an example representative for all calculated DTI metrics) and projectional views of fiber tracking (FT) of the corticospinal tract (CST). Overlap of fiber tracts along the CST and FA differences at the group level in 3-D view. Increase is displayed in cold colors, decrease is displayed in hot colors.
Longitudinal Screening of FA-Values in the CST
The coefficient of variation demonstrated a high reproducibility in DTI metrics (Table 2). Figure 3A shows exemplary charts of DTI metrics alterations (AD, FA, MD, RD, AD/RD) and ALS-FRS-R decrease progression over time from two ALS patients and one control. FA and AD/RD decrease progression were less than 0.4% per year for controls (compare Salat et al., 2005), whereas in ALS patients, FA decrease progression ranged between 0.2% to 5.6% per year and AD/RD decrease progression ranged between 1.6% to 12.3% per year. The remaining DTI metrics (AD, MD, RD) partially overlapped between patients and controls (Table 3). Figure 3B shows the different patterns of the FA and AD/RD decrease progression rates in ALS patients and controls.
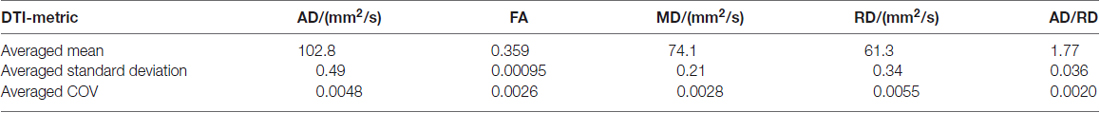
Table 2. Arithmetically averaged standard deviation and coefficient of variation (COV) as a reproducibility measure of controls’ DTI metrics axial diffusivity (AD), fractional anisotropy (FA), mean diffusivity (MD), radial diffusivity (RD), and AD/RD.

Figure 3. (A) Charts of DTI metrics (FA, MD, AD, RD, the ratio AD/RD) and ALS-FRS-R alterations during the course of disease of two representative ALS patients (one fast progressor, one slow progressor) and one representative control. (B) FA and AD/RD decrease progression in the CST for six ALS patients and six controls. FA and AD/RD decrease progression correlated significantly with ALSFRS-R decrease.
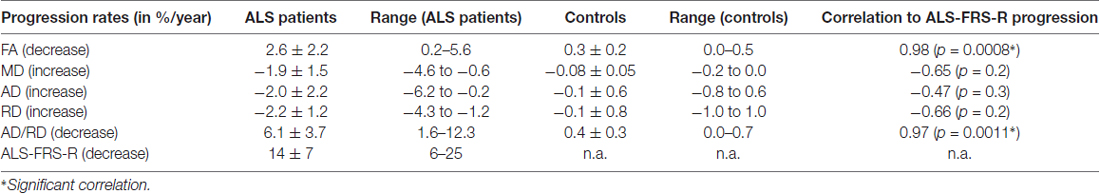
Table 3. Arithmetically averaged progression rates (in %/year) for ALS patients and controls (mean ± standard deviation) for DTI metrics—axial diffusivity (AD), fractional anisotropy (FA), mean diffusivity (MD), radial diffusivity (RD) and AD/RD.
Both FA and AD/RD decrease progression correlated significantly with ALS-FRS-R decrease progression (r = 0.98, p = 0.0008 and r = 0.97, p = 0.0011, respectively; Table 3). In this sample of ALS patients, four subjects showed a slower progression rate of less than 2% per year, whereas two ALS patients showed higher progression rate between 3% and 6% per year (Figure 3B). These latter two patients also showed a rapid worsening in ALS-FRS-R between 10 and 15 points per year.
Discussion
In this methodological study, a longitudinal DTI analysis concept was applied to assess the disease progression in ALS patients with a high number of follow-up scans. Patients with ALS showed alterations along the CST correlating with the clinical progression (ALS-FRS-R decline). Therefore, this study provides a framework for the analysis of longitudinal DTI data in order to map progressive neurodegeneration. ALS was chosen as an example for a neurodegenerative disease with a generally rapid progression in which a prominent tract structure, i.e., the CST, is affected in the early course of the disease, corresponding to neuropathological stage 1 (Braak et al., 2013; Kassubek et al., 2014).
In the small sample of subjects, different progression trends could be identified, i.e., controls showed DTI metrics alterations that were in line with standard ageing-related alterations (Salat et al., 2005; Lim et al., 2015), while ALS patients showed different progression types in terms of alterations along the CST. From the clinical viewpoint, the patients (who all had spinal ALS onset) were also heterogeneous in their clinical presentations. In patients with faster progression, both clinical disease severity according to ALS-FRS-R and DTI metrics alterations showed a marked decline during the observation period. The effect of G-CSF on ALS-progression rate was not the topic of this imaging study and will be the subject of a separate data analysis. In the same line, we did not perform a genetic analysis in this imaging oriented context, all the more since there was no obvious evidence of family history in all individuals. In future studies, additional analyses like the vascular density index might be used.
The present study is limited by the number of subjects but can be considered as an indicator for the potential of the methodology. As an advantage, the identification of tract structures by DTI techniques can be considered rather operator independent in contrast to a region-of-interest analysis. Further, the methodological approach is independent of age so that age-related changes of the DTI metrics (Salat et al., 2005; Lim et al., 2015) could be neglected for the follow-up interval of about 2 years. A bias of the baseline scan in terms of alignment (Menke et al., 2014) could be assumed, but was minimized by the creation of subject-specific templates. Final progression results in DTI metrics (Figure 3) showed no systematic bias for the baseline scans (see Menke et al., 2014), i.e., the values of the baseline scan fitted the regression line of all DTI metrics values of all scans. The highly significant correlation between DTI metrics alterations (both FA and AD/RD) with ALS-FRS-R decrease might offer an opportunity to assess disease progression with a lower number of patient visits: an accuracy assessment of the disease progression might either be obtained by a higher number of patient visits (with ALS-FRS-R scores at each visit) or by a less frequent number of visits and a determination of disease progression by ALS-FRS-R in combination with DTI metrics.
There are some limitations in the acquisition protocol. The examination was done at 1.5T with 20 directions, 1 b-value, and 5 mm slice thickness. The slice thickness was relatively large for FT. However, we have identified the CST with straightforward superior-inferior directionality with sufficient accuracy. If more subtle fronto-dorsal or lateral tract structures or a mixture of the three directions are to be analyzed, a slice thickness of 5 mm might be too large. However, it could be demonstrated that DTI metrics could be assessed as a technical marker even with such a restricted DTI protocol, which should be available at each clinical scanner and could be run in any routine data acquisition. Moreover, the protocol with a short acquisition time of 7 min was well tolerated by ALS patients also in an advanced clinical condition so that it was possible to acquire this higher number of follow-up scans.
This longitudinal DTI-based analysis of structural tract changes addressed the identification of a straightforward, non-invasive, quantitative in vivo biomarker of neurodegeneration which correlates with clinical progression. Potentially, these results will encourage future longitudinal studies in neurodegenerative diseases. Here, the applied methodology might be used to study other tract structures that are specific for the given neurodegenerative disease, e.g., Braak stages in Alzheimer’s Disease (Braak and Braak, 1991) or Braak stages in Parkinson’s Disease (Braak and Del Tredici, 2009).
Author Contributions
DB and AK: substantial contribution to the conception of the study, data acquisition, data analysis, critical revision of the manuscript, final approval of the version to be published. IK: substantial contribution to the data acquisition, critical revision of the manuscript, final approval of the version to be published. UB: substantial contribution to the conception and design of the study and the interpretation of the data, critical revision of the manuscript, final approval of the version to be published. MG: substantial contribution to the data analysis, critical revision of the manuscript, final approval of the version to be published. JK: substantial contribution to the design of the study and the interpretation of the data, critical revision of the manuscript, final approval of the version to be published. H-PM: substantial contribution to the conception of the study and the data analysis, critical revision of the manuscript, final approval of the version to be published.
Conflict of Interest Statement
The authors declare that the research was conducted in the absence of any commercial or financial relationships that could be construed as a potential conflict of interest.
References
Abhinav, K., Yeh, F. C., El-Dokla, A., Ferrando, L. M., Chang, Y. F., Lacomis, D., et al. (2014). Use of diffusion spectrum imaging in preliminary longitudinal evaluation of amyotrophic lateral sclerosis: development of an imaging biomarker. Front. Hum. Neurosci. 8:270. doi: 10.3389/fnhum.2014.00270
Agosta, F., Chiò, A., Cosottini, M., De Stefano, N., Falini, A., Mascalchi, M., et al. (2010). The present and the future of neuroimaging in amyotrophic lateral sclerosis. AJNR Am. J. Neuroradiol. 31, 1769–1777. doi: 10.3174/ajnr.A2043
Agosta, F., Weiler, M., and Filippi, M. (2015). Propagation of pathology through brain networks in neurodegenerative diseases: from molecules to clinical phenotypes. CNS Neurosci. Ther. 21, 754–767. doi: 10.1111/cns.12410
Bede, P., and Hardiman, O. (2014). Lessons of ALS imaging: pitfalls and future directions—a critical review. Neuroimage Clin. 4, 436–443. doi: 10.1016/j.nicl.2014.02.011
Braak, H., and Braak, E. (1991). Neuropathological stageing of Alzheimer-related changes. Acta Neuropathol. 82, 239–259. doi: 10.1007/bf00308809
Braak, H., Brettschneider, J., Ludolph, A. C., Lee, V. M., Trojanowski, J. Q., and Del Tredici, K. (2013). Amyotrophic lateral sclerosis—a model of corticofugal axonal spread. Nat. Rev. Neurol. 9, 708–714. doi: 10.1038/nrneurol.2013.221
Braak, H., and Del Tredici, K. (2009). Neuroanatomy and pathology of sporadic Parkinson’s disease. Adv. Anat. Embryol. Cell Biol. 201, 1–119.
Brett, M., Johnsrude, I. S., and Owen, A. M. (2002). The problem of functional localization in the human brain. Nat. Rev. Neurosci. 3, 243–249. doi: 10.1038/nrn756
Brettschneider, J., Del Tredici, K., Lee, V. M., and Trojanowski, J. Q. (2015). Spreading of pathology in neurodegenerative diseases: a focus on human studies. Nat. Rev. Neurosci. 16, 109–120. doi: 10.1038/nrn3887
Brettschneider, J., Del Tredici, K., Toledo, J. B., Robinson, J. L., Irwin, D. J., Grossman, M., et al. (2013). Stages of pTDP-43 pathology in amyotrophic lateral sclerosis. Ann. Neurol. 74, 20–38. doi: 10.1002/ana.23937
Cardenas-Blanco, A., Machts, J., Acosta-Cabronero, J., Kaufmann, J., Abdulla, S., Kollewe, K., et al. (2016). Structural and diffusion imaging versus clinical assessment to monitor amyotrophic lateral sclerosis. Neuroimage Clin. 11, 408–414. doi: 10.1016/j.nicl.2016.03.011
Cedarbaum, J. M., Stambler, N., Malta, E., Fuller, C., Hilt, D., Thurmond, B., et al. (1999). The ALSFRS-R: a revised ALS functional rating scale that incorporates assessments of respiratory function. BDNF ALS study group (Phase III). J. Neurol. Sci. 169, 13–21. doi: 10.1016/s0022-510x(99)00210-5
Cochrane, C. J., and Ebmeier, K. P. (2013). Diffusion tensor imaging in parkinsonian syndromes: a systematic review and meta-analysis. Neurology 80, 857–864. doi: 10.1212/wnl.0b013e318284070c
Filippi, M., Agosta, F., Grosskreutz, J., Benatar, M., Kassubek, J., Verstraete, E., et al. (2015). Progress towards a neuroimaging biomarker for amyotrophic lateral sclerosis. Lancet Neurol. 14, 786–788. doi: 10.1016/s1474-4422(15)00134-9
Genovese, C. R., Lazar, N. A., and Nichols, T. (2002). Thresholding of statistical maps in functional neuroimaging using the false discovery rate. Neuroimage 15, 870–878. doi: 10.1006/nimg.2001.1037
Grassinger, J., Khomenko, A., Hart, C., Baldaranov, D., Johannesen, S. W., Mueller, G., et al. (2014). Safety and feasibility of long term administration of recombinant human granulocyte-colony stimulating factor in patients with amyotrophic lateral sclerosis. Cytokine 67, 21–28. doi: 10.1016/j.cyto.2014.02.003
Jucker, M., and Walker, L. C. (2013). Self-propagation of pathogenic protein aggregates in neurodegenerative diseases. Nature 501, 45–51. doi: 10.1038/nature12481
Kassubek, J., and Müller, H.-P. (2016). Computer-based magnetic resonance imaging as a tool in clinical diagnosis in neurodegenerative diseases. Expert Rev. Neurother. 16, 295–306. doi: 10.1586/14737175.2016.1146590
Kassubek, J., Müller, H.-P., Del Tredici, K., Brettschneider, J., Pinkhardt, E. H., Lulé, D., et al. (2014). Diffusion tensor imaging analysis of sequential spreading of disease in amyotrophic lateral sclerosis confirms patterns of TDP-43 pathology. Brain 137, 1733–1740. doi: 10.1093/brain/awu090
Kassubek, J., Müller, H.-P., Del Tredici, K., Lulé, D., Gorges, M., Braak, H., et al. (2017). Imaging the pathoanatomy of amyotrophic lateral sclerosis in vivo: targeting a propagation-based biological marker. J. Neurol. Neurosurg. Psychiatry doi: 10.1136/jnnp-2017-316365 [Epub ahead of print].
Keil, C., Prell, T., Peschel, T., Hartung, V., Dengler, R., and Grosskreutz, J. (2012). Longitudinal diffusion tensor imaging in amyotrophic lateral sclerosis. BMC Neurosci. 13:141. doi: 10.1186/1471-2202-13-141
Kunimatsu, A., Aoki, S., Masutani, Y., Abe, O., Hayashi, N., Mori, H., et al. (2004). The optimal trackability threshold of fractional anisotropy for diffusion tensor tractography of the corticospinal tract. Magn. Reson. Med. Sci. 3, 11–17. doi: 10.2463/mrms.3.11
Kwan, J. Y., Meoded, A., Danielian, L. E., Wu, T., and Floeter, M. K. (2012). Structural imaging differences and longitudinal changes in primary lateral sclerosis and amyotrophic lateral sclerosis. Neuroimage Clin. 2, 151–160. doi: 10.1016/j.nicl.2012.12.003
Le Bihan, D., Mangin, J. F., Poupon, C., Clark, C. A., Pappata, S., Molko, N., et al. (2001). Diffusion tensor imaging: concepts and applications. J. Magn. Reson. Imaging 13, 534–546. doi: 10.1002/jmri.1076
Lim, S., Han, C. E., Uhlhaas, P. J., and Kaiser, M. (2015). Preferential detachment during human brain development: age- and sex-specific structural connectivity in diffusion tensor imaging (DTI) data. Cereb. Cortex 25, 1477–1489. doi: 10.1093/cercor/bht333
Ludolph, A., Droy, V., Hardiman, O., Nakano, I., Ravits, J., Robberecht, W., et al. (2015). A revision of the El Escorial criteria—2015. Amyotroph. Lateral Scler. Frontotemporal Degener. 16, 291–292. doi: 10.3109/21678421.2015.1049183
Meijer, F. J., Bloem, B. R., Mahlknecht, P., Seppi, K., and Goraj, B. (2013). Update on diffusion MRI in Parkinson’s disease and atypical parkinsonism. J. Neurol. Sci. 332, 21–29. doi: 10.1016/j.jns.2013.06.032
Menke, R. A., Körner, S., Filippini, N., Douaud, G., Knight, S., Talbot, K., et al. (2014). Widespread grey matter pathology dominates the longitudinal cerebral MRI and clinical landscape of amyotrophic lateral sclerosis. Brain 137, 2546–2555. doi: 10.1093/brain/awu162
Müller, H.-P., and Kassubek, J. (2013). Diffusion tensor magnetic resonance imaging in the analysis of neurodegenerative diseases. J. Vis. Exp. 77:e50427. doi: 10.3791/50427
Müller, H.-P., Turner, M. R., Grosskreutz, J., Abrahams, S., Bede, P., Govind, V., et al. (2016). A large-scale multicentre cerebral diffusion tensor imaging study in amyotrophic lateral sclerosis. J. Neurol. Neurosurg. Psychiatry 87, 570–579. doi: 10.1136/jnnp-2015-311952
Müller, H.-P., Unrath, A., Huppertz, H. J., Ludolph, A. C., and Kassubek, J. (2012). Neuroanatomical patterns of cerebral white matter involvement in different motor neuron diseases as studied by diffusion tensor imaging analysis. Amyotroph. Lateral Scler. 13, 254–264. doi: 10.3109/17482968.2011.653571
Müller, H.-P., Unrath, A., Ludolph, A. C., and Kassubek, J. (2007a). Preservation of diffusion tensor properties during spatial normalization by use of tensor imaging and fibre tracking on a normal brain database. Phys. Med. Biol. 52, N99–N109. doi: 10.1088/0031-9155/52/6/n01
Müller, H.-P., Unrath, A., Sperfeld, A. D., Ludolph, A. C., Riecker, A., and Kassubek, J. (2007b). Diffusion tensor imaging and tractwise fractional anisotropy statistics: quantitative analysis in white matter pathology. Biomed. Eng. Online 6:42. doi: 10.1186/1475-925x-6-42
Müller, H.-P., Unrath, A., Riecker, A., Pinkhardt, E. H., Ludolph, A. C., and Kassubek, J. (2009). Inter-subject variability in the analysis of diffusion tensor imaging at the group level: fractional anisotropy mapping and fiber tracking techniques. Magn. Reson. Imaging 27, 324–334. doi: 10.1016/j.mri.2008.07.003
Pierpaoli, C., and Basser, P. J. (1996). Toward a quantitative assessment of diffusion anisotropy. Magn. Reson. Med. 36, 893–906. doi: 10.1002/mrm.1910360612
Pollari, E., Savchenko, E., Jaronen, M., Kanninen, K., Malm, T., Wojciechowski, S., et al. (2011). Granulocyte colony stimulating factor attenuates inflammation in a mouse model of amyotrophic lateral sclerosis. J. Neuroinflammation 8:74. doi: 10.1186/1742-2094-8-74
Rosenbohm, A., Müller, H. P., Hübers, A., Ludolph, A. C., and Kassubek, J. (2016). Corticoefferent pathways in pure lower motor neuron disease: a diffusion tensor imaging study. J. Neurol. 263, 2430–2437. doi: 10.1007/s00415-016-8281-2
Salat, D. H., Tuch, D. S., Greve, D. N., van der Kouwe, A. J., Hevelone, N. D., Zaleta, A. K., et al. (2005). Age-related alterations in white matter microstructure measured by diffusion tensor imaging. Neurobiol. Aging 26, 1215–1227. doi: 10.1016/j.neurobiolaging.2004.09.017
Sarica, A., Cerasa, A., Valentino, P., Yeatman, J., Trotta, M., Barone, S., et al. (2017). The corticospinal tract profile in amyotrophic lateral sclerosis. Hum. Brain Mapp. 38, 727–739. doi: 10.1002/hbm.23412
Sarica, A., Cerasa, A., Vasta, R., Perrotta, P., Valentino, P., Mangone, G., et al. (2014). Tractography in amyotrophic lateral sclerosis using a novel probabilistic tool: a study with tract-based reconstruction compared to voxel-based approach. J. Neurosci. Methods 224, 79–87. doi: 10.1016/j.jneumeth.2013.12.014
Schuster, C., Elamin, M., Hardiman, O., and Bede, P. (2015). Presymptomatic and longitudinal neuroimaging in neurodegeneration-from snapshots to motion picture: a systematic review. J. Neurol. Neurosurg. Psychiatry 86, 1089–1096. doi: 10.1136/jnnp-2014-309888
Smith, S. M., Jenkinson, M., Johansen-Berg, H., Rueckert, D., Nichols, T. E., Mackay, C. E., et al. (2006). Tract-based spatial statistics: voxelwise analysis of multi-subject diffusion data. Neuroimage 31, 1487–1505. doi: 10.1016/j.neuroimage.2006.02.024
Soares, J. M., Marques, P., Alves, V., and Sousa, N. (2013). A hitchhiker’s guide to diffusion tensor imaging. Front. Neurosci. 7:31. doi: 10.3389/fnins.2013.00031
Song, S.-K., Sun, S.-W., Ramsbottom, M. J., Chang, C., Russell, J., and Cross, A. H. (2002). Dysmyelination revealed through MRI as increased radial (but unchanged axial) diffusion of water. Neuroimage 17, 1429–1436. doi: 10.1006/nimg.2002.1267
Steinbach, R., Loewe, K., Kaufmann, J., Machts, J., Kollewe, K., Petri, S., et al. (2015). Structural hallmarks of amyotrophic lateral sclerosis progression revealed by probabilistic fiber tractography. J. Neurol. 262, 2257–2270. doi: 10.1007/s00415-015-7841-1
Teipel, S. J., Walter, M., Likitjaroen, Y., Schönknecht, P., and Gruber, O. (2014). Diffusion tensor imaging in Alzheimer’s disease and affective disorders. Eur. Arch. Psychiatry Clin. Neurosci. 264, 467–483. doi: 10.1007/s00406-014-0496-6
Turner, M. R. (2011). MRI as a frontrunner in the search for amyotrophic lateral sclerosis biomarkers? Biomark. Med. 5, 79–81. doi: 10.2217/bmm.10.120
Turner, M. R., Agosta, F., Bede, P., Govind, V., Lulé, D., and Verstraete, E. (2012). Neuroimaging in amyotrophic lateral sclerosis. Biomark. Med. 6, 319–337. doi: 10.2217/bmm.12.26
Turner, M. R., Grosskreutz, J., Kassubek, J., Abrahams, S., Agosta, F., Benatar, M., et al. (2011). Towards a neuroimaging biomarker for amyotrophic lateral sclerosis. Lancet Neurol. 10, 400–403. doi: 10.1016/S1474-4422(11)70049-7
Unrath, A., Müller, H.-P., Riecker, A., Ludolph, A. C., Sperfeld, A. D., and Kassubek, J. (2010). Whole brain-based analysis of regional white matter tract alterations in rare motor neuron diseases by diffusion tensor imaging. Hum. Brain Mapp. 31, 1727–1740. doi: 10.1002/hbm.20971
Wang, Y., Sun, P., Wang, Q., Trinkaus, K., Schmidt, R. E., Naismith, R. T., et al. (2015). Differentiation and quantification of inflammation, demyelination and axon injury or loss in multiple sclerosis. Brain 138, 1223–1238. doi: 10.1093/brain/awv046
Zhang, Y., Schuff, N., Woolley, S. C., Chiang, G. C., Boreta, L., Laxamana, J., et al. (2011). Progression of white matter degeneration in amyotrophic lateral sclerosis: a diffusion tensor imaging study. Amyotroph. Lateral Scler. 12, 421–429. doi: 10.3109/17482968.2011.593036
Keywords: magnetic resonance imaging, diffusion tensor imaging, neurodegeneration, neurodegenerative disease, DTI metrics
Citation: Baldaranov D, Khomenko A, Kobor I, Bogdahn U, Gorges M, Kassubek J and Müller H-P (2017) Longitudinal Diffusion Tensor Imaging-Based Assessment of Tract Alterations: An Application to Amyotrophic Lateral Sclerosis. Front. Hum. Neurosci. 11:567. doi: 10.3389/fnhum.2017.00567
Received: 08 September 2017; Accepted: 07 November 2017;
Published: 05 December 2017.
Edited by:
Peter Sörös, University of Oldenburg, GermanyReviewed by:
Manoj Kumar Jaiswal, Icahn School of Medicine at Mount Sinai, United StatesAlessia Sarica, Istituto di Bioimmagini e Fisiologia Molecolare (CNR), Italy
Copyright © 2017 Baldaranov, Khomenko, Kobor, Bogdahn, Gorges, Kassubek and Müller. This is an open-access article distributed under the terms of the Creative Commons Attribution License (CC BY). The use, distribution or reproduction in other forums is permitted, provided the original author(s) or licensor are credited and that the original publication in this journal is cited, in accordance with accepted academic practice. No use, distribution or reproduction is permitted which does not comply with these terms.
*Correspondence: Hans-Peter Müller, hans-peter.mueller@uni-ulm.de