Conditional mutual information maps as descriptors of net connectivity levels in the brain
- 1 Unitat de Recerca, Benito Menni C.A.S.M. - CIBERSAM, Sant Boi de Llobregat, Barcelona, Spain
- 2 Brain Mapping Unit, University of Cambridge, Cambridge, UK
There is a growing interest in finding ways to summarize the local connectivity properties of the brain through single brain maps. Here we propose a method based on the conditional mutual information (CMI) in the frequency domain. CMI maps quantify the amount of non-redundant covariability between each site and all others in the rest of the brain, partialling out the joint variability due to gross physiological noise. Average maps from a sample of 45 healthy individuals scanned in the resting state show a clear and symmetric pattern of connectivity maxima in several regions of cortex, including prefrontal, orbitofrontal, lateral–parietal, and midline default mode network components; and in subcortical nuclei, including the amygdala, thalamus, and basal ganglia. Such cortical and subcortical hotspots of functional connectivity were more clearly evident at lower frequencies (0.02–0.1 Hz) than at higher frequencies (0.1–0.2 Hz) of endogenous oscillation. CMI mapping can also be easily applied to perform group analyses. This is exemplified by exploring effects of normal aging on CMI in a sample of healthy controls and by investigating correlations between CMI and positive psychotic symptom scores in a sample of 40 schizophrenic patients. Both the normative aging and schizophrenia studies reveal functional connectivity trends that converge with reported findings from other studies, thus giving further support to the validity of the proposed method.
Introduction
In recent years there has been a growing interest in finding ways to summarize connectivity properties of the brain through maps based on sets of functional magnetic resonance images (fMRI). Although these maps may use different measures of connectivity and have been named differently (e.g., maps of cortical hubs, Buckner et al., 2009; global brain connectivity maps, Cole et al., 2010; overall brain connectivity maps, Salvador et al., 2010) they aim at describing the general levels of connectivity between each site of the brain and the remaining brain.
In the core of most of these methods there are bivariate measures of association such as Pearson correlations (Buckner et al., 2009; Cole et al., 2010; Sepulcre et al., 2010) or coherences (Salvador et al., 2010). Although these measures are clear, simple, and computationally efficient, they are not adequate to quantify what can be called non-redundant connectivity (see Figure 1), which will require the use of multivariate measures of association. On the other hand, while Pearson correlations may be appropriate to capture instantaneous patterns of covariability in the brain, which probably account for the largest proportion of covariance in the brain (at least at the coarse temporal resolutions of fMRI time series), they will fail at quantifying non-instantaneous or dephased relations. This non-synchronicity will be also relevant in the steps involved in removing physiological artifacts, as these have an uneven spatiotemporal distribution in the brain (Shmueli et al., 2007; Majeed et al., 2009). In consequence, procedures that quantify instantaneous covariability between physiological factors (or their surrogates like global or CSF data) and time series in the brain parenchyma may be significantly non-efficient or inaccurate. This, in turn, may lead to spurious covariances in areas of the brain like those located near prominent vascular structures.
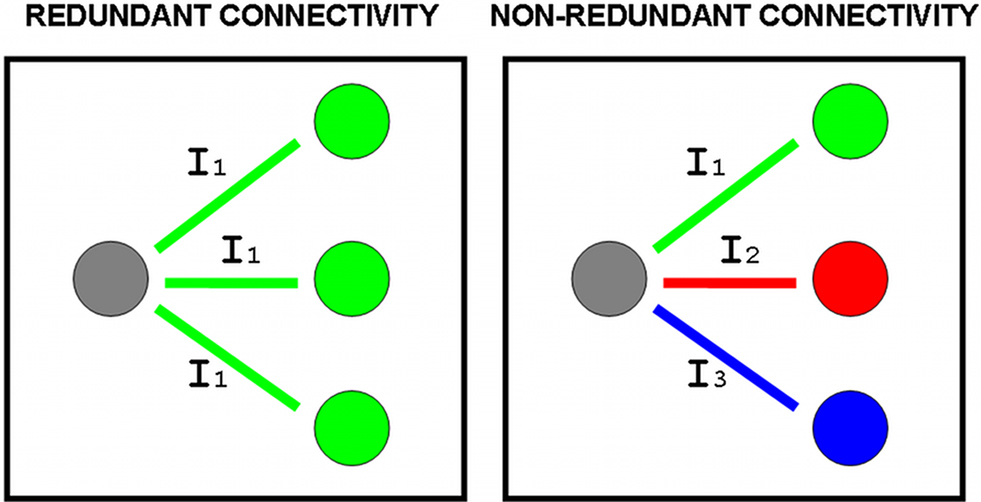
Figure 1. The covariability or information shared between a site in the brain (gray circle) and other sites (remaining circles) may be equal or redundant (same information I1) or different or non-redundant (informations I1, I2, I3). In the simple case where all In have the same intensity, averages of bivariate measures of association will assign the same amount of connectivity in both redundant and non-redundant scenarios, and truly multivariate measures will be required to quantify non-redundant connectivity.
Here we describe a method to deliver maps of net connectivity levels that quantifies non-redundant connectivity and that takes into account synchronous and non-synchronous (non-instantaneous) covariability. The proposed method uses the conditional mutual information (CMI) in the frequency domain, which is a truly multivariate association measure, and stems from previous work (Salvador et al., 2007, 2008, 2010). Prior probabilistic models are adapted to include a third set of stochastic processes, which characterize the gross physiological noise, and formulas for the mutual information (MI) are updated to partial out the common variability related to this third set by conditioning. Finally, output connectivity maps are delivered at the voxel level, avoiding some of the biases and lack of anatomical resolution found in Salvador et al. (2008). Being summaries of net connectivity levels (each individual’s connectivity is summarized in a single image) CMI brain maps can be easily used on group analyses to look for differences or trends in connectivity. To illustrate the method, first we show average CMI maps from a sample of healthy individuals and, later, we evaluate possible patterns in CMI related to age in the healthy brain and related to clinical symptoms in a sample of patients with schizophrenia.
Materials and Methods
fMRI Data Acquisition and Processing
The proposed method was applied to a sample of resting-state fMRI datasets from 45 healthy individuals, and another sample from 40 chronic schizophrenic patients. All datasets had been acquired in the same 1.5 T GE scanner, where a time series of 266 volumes (with 16 slices each) was obtained while the individuals were resting with the eyes open. The following parameters were used in the acquisition: TR = 2000 ms, TE = 20 ms, flip angle = 70°, section thickness = 7 mm, section skip = 0.7 mm, in-plane resolution = 3 × 3 mm. The first 10 volumes were discarded to avoid T1 saturation effects. Apart from five added controls, both samples had been previously used in Salvador et al. (2010). All participants gave written informed consent prior to involvement in accordance to the Declaration of Helsinki, and the research protocol was approved by the local ethics committee of the Benito Menni Hospital.
The preprocessing steps also matched those followed in this previous work. Several FSL functions were used (Smith et al., 2004) finally obtaining normalized (to the T1 2 mm MNI template) and spatially smoothed images (Gaussian filter with SD = 3 mm). The minimization of residual movement effects, though, was carried out through regression of independent components with clear edge effects extracted by individual ICA on the co-registered time series (instead of regressing out the time series of movement parameters).
The multivariate nature of the CMI rendered the inclusion of the time series of all voxels of the brain parenchyma computationally unfeasible. Although the CMI was calculated for each voxel, the joint time dynamics of each brain was summarized by the mean time series of the 90 regions in the AAL template (Tzourio-Mazoyer et al., 2002). Gross physiological noise was characterized as in Salvador et al. (2010) which was based on a selection of a set of noisy voxels with high variance but low redundancy. This set included five points placed outside the brain parenchyma (see Figure 2). These were located in (1) left middle cerebral artery [MNI: −34, 8, −22], (2) straight sinus [MNI: 0, −86, −16], (3) cisterna superior [MNI: 0, −44, 0], (4) anterior cerebral artery [MNI: 0, 30, 12] and (5) superior sagittal sinus [MNI: 0, 0, 68]. In summary, for each voxel of the brain we estimated its MI with the mean time series from all 90 AAL regions (i.e., a multivariate measure) partialling out (conditioning on) the common variability shared with the five time series characterizing the gross physiological noise.
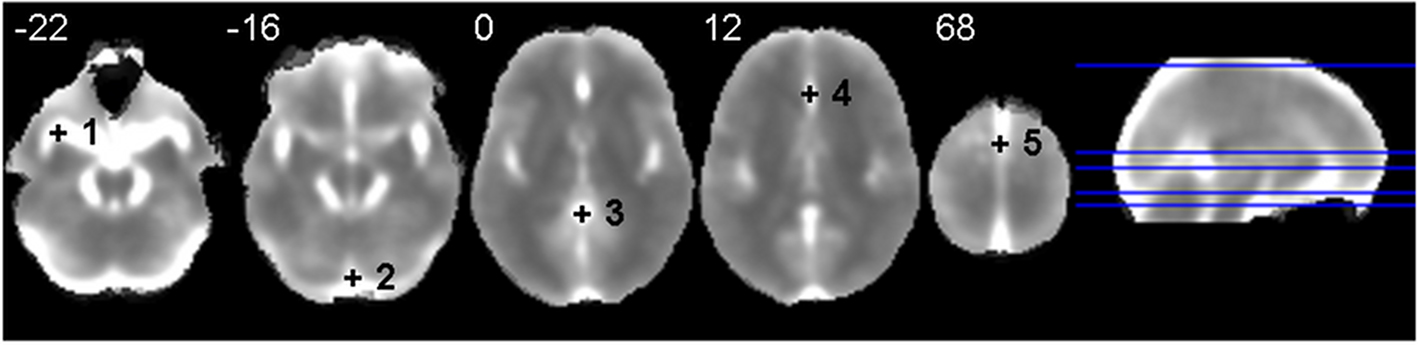
Figure 2. Anatomical location of the five points selected to characterize major physiological noise in Salvador et al. (2010). The background image is an average of individual normalized and filtered standard deviation images. Left side of image is left side of brain. White numbers give the z MNI coordinate of each slice shown.
The CMI images from the sample of 45 healthy individuals were used to derive mean maps of CMI of the healthy brain and to explore relations between the CMI and age. The CMI images from the sample of 40 chronic schizophrenics were used to explore possible relations between CMI and clinical symptoms. Liddle factors (Liddle, 1987) which in turn are based on values of the positive and negative syndrome scale (PANSS) (Kay et al., 1987) were used as clinical scores. In all individuals, averaged CMI were estimated for an interval of low frequencies (0.02–0.1 Hz) and an interval of higher frequencies (0.1–0.2 Hz).
Definition of the Conditional Mutual Information
In this work the CMI is used to relate the temporal dynamics of a voxel Xv(t) with the dynamics of a set of other points or regions of the brain Xr(t) (summarized here by the mean time series of the 90 AAL regions), discarding the common patterns linked to a set of physiological factors or processes Xn(t) (characterized by the time series of the five high variance points shown in Figure 2). From a theoretical point of view, all three components can be considered as a finite realization of a joint multivariate stochastic process

If a discrete Fourier transform (DFT) is applied to this finite realization of, say, length 2q (which in our study equals the number of non-dummy scans [2q = 256]) it will deliver q Fourier coefficients. Under the assumption of multivariate normality, stationarity, and summable cross-covariances for X(t), any Fourier frequency (say ωk) will have now a multivariate vector of DFT coefficients

which will follow a complex multivariate normal law (Brillinger, 1981; Salvador et al., 2007). The CMI between Yv(ωk) and Yr(ωk), given Yn(ωk), may be given through the chain rule for MI (Cover and Thomas, 1991)
And both individual MI on the right hand side of the equation can be written in terms of multiple coherences of components of the original stochastic process X(t) at frequency ωk (see Eq. 2 in Salvador et al., 2008)
These two multiple coherences, in turn, are functions of subsets of the spectral density matrix of X(t) at ωk. Specifically, if we denote fXn(ωk), f{Xr,Xn}(ωk), fXv(ωk) as the spectral density matrices of Xn, {Xr,Xn}, and Xv (the latter a scalar), and VXv,{Xr,Xn}(ωk), VXv,Xn(ωk) as the column vectors containing the spectral densities between Xv and each of the components of {Xr,Xn} and of Xn, then (see Brillinger, 1981 for a general formula for the multiple coherence)
where superscript t indicates the transpose and superscript bar stands for the conjugate. Both Eqs. 4 and 5 can be combined to give an alternative formula for the CMI
Now, Eq. 6 can be extended to give the CMI for the whole set of Fourier coefficients (k = 1, …, q) from the DFT. The asymptotic independence between Fourier coefficients at different frequencies (Shumway and Stoffer, 2000) allows giving the MI as a simple sum over frequencies. Alternatively, one can take averages over the q Fourier coefficients, to avoid the clear dependence of this sum on q

which may be seen as a finite version of the MI rate for stochastic processes (Ihara, 1993).
Inference on the Conditional Mutual Information
Inference on the CMI is based on non-parametric estimates of the spectral density matrices and their components found in Eq. 6. This requires several operations on the extracted time series, including: (1) window tapering to reduce leakage, (2) a FFT on the tapered time series, (3) to calculate the cross-product of Fourier coefficients to obtain initial estimates of the cross-spectrums, and (4) filtering to reduce variance of the cross-periodograms.
The filtered cross-periodograms, though, cannot be directly plugged-in Eq. 6 as, rather frequently, high levels of redundancy between some of the time series in Xr(t) will render the estimate of f{Xr,Xn}(ωk) nearly singular, making its inversion unreliable. To avoid such problems, we follow the approach proposed in Salvador et al. (2008) which is based on the diagonalization of f{Xr,Xn}(ωk)

where L(ωk) and Δ(ωk) are the matrices containing the eigenvectors and real positive eigenvalues of f{Xr,Xn}(ωk), and L*(ωk) is the transposed conjugate of L(ωk).
Taking the s biggest eigenvalues, accounting for a large portion of the variability (e.g., 99%), and their related eigenvectors, we can now calculate the multiple coherence between the voxel and the s principal component time series (see Appendix B in Salvador et al., 2008), which is a non-collinear surrogate of the multiple coherence given in first formula of Eq. 5.

with

This leads to a modified version of Eq. 6
where estimates of the spectral densities from their diagonalization in Eq. 8 will be plugged-in to deliver the estimates of the MI. Finally, we use Eq. 7 to take averages over the two frequency bands (0.02–0.1 and 0.1–0.2 Hz).
Results
The averaged (over the sample of 45 healthy controls) CMI map for the low frequencies is shown in Figure 3A. In this Figure the most evident pattern of differences is observed between a significant proportion of gray matter and the rest of the brain, including all white matter regions, where the lowest values of connectivity are found. Within the cortex there are many local maxima, which appear as hot spots or connectivity hubs. Among others, these include, bilaterally, the orbitofrontal cortex, the lateral prefrontal cortex, the primary visual cortex, the primary auditory and neighboring cortex, and the main components of the default mode network (DMN) (the medial anterior node, the medial posterior nodes, and both lateral–parietal posterior nodes). Additionally, there are clear local maxima in subcortical nuclei, including bilaterally the amygdala, the pallidum–putamen, both caudate nuclei, and, with lower values, the thalami.
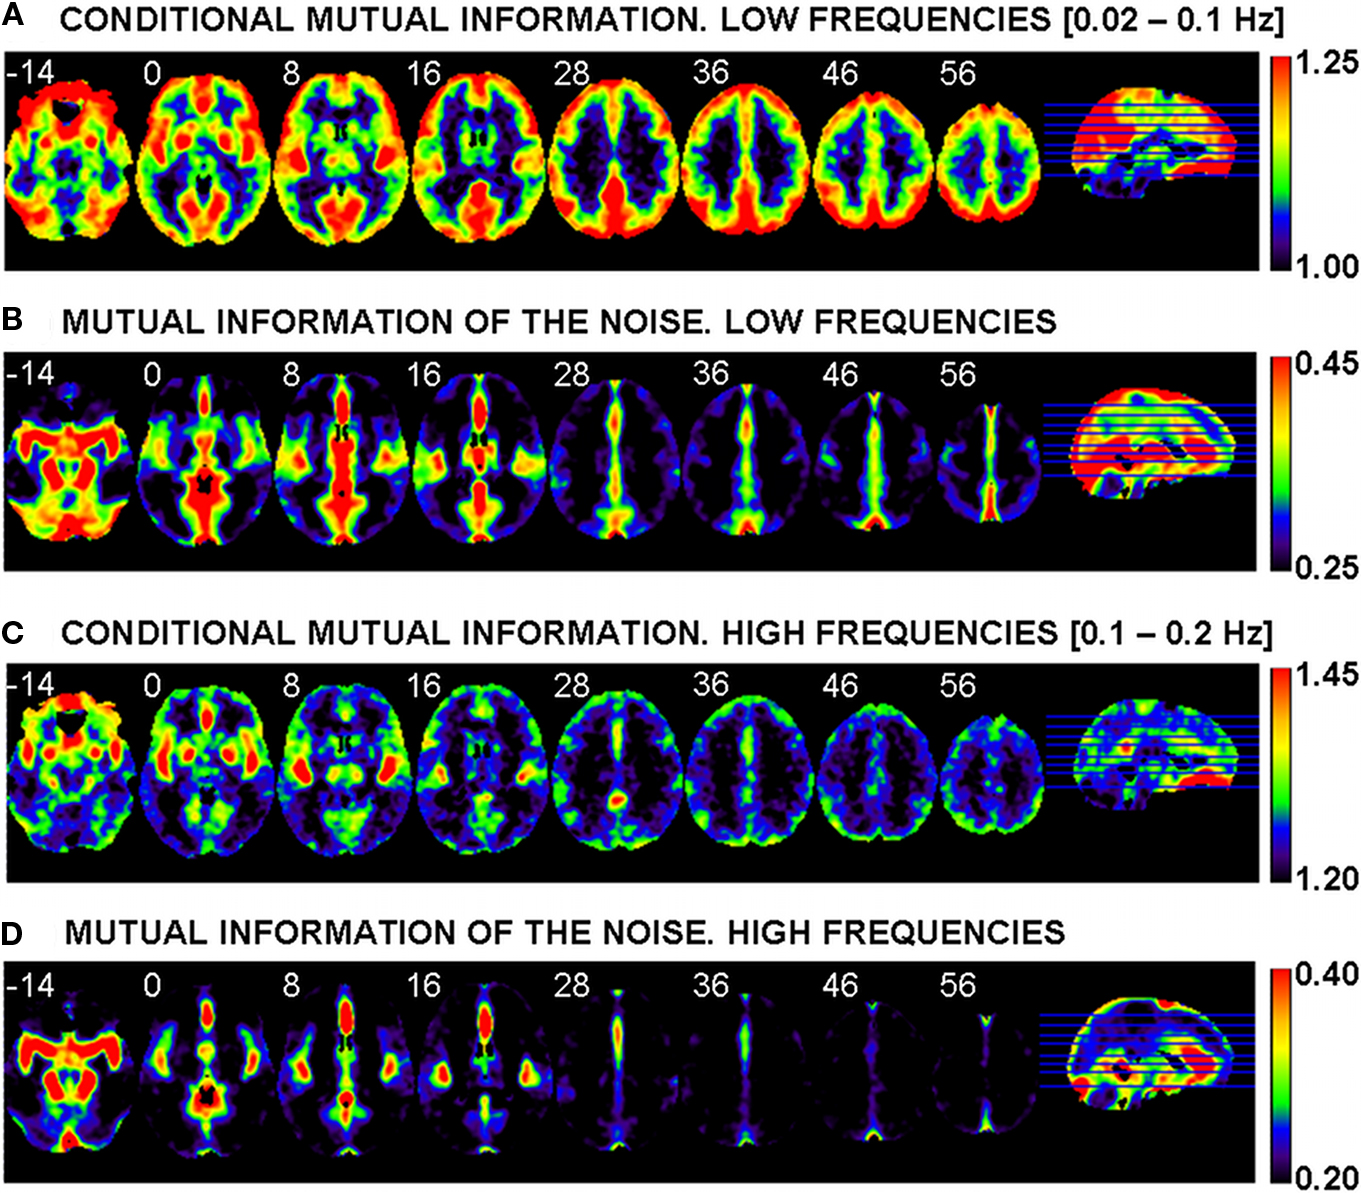
Figure 3. Averages, over the sample of 45 healthy controls, of the conditional mutual information (MI) for the low frequencies (A) and the high frequencies (C). Averages of the MI of the noise (MI with the five points of high variance shown in Figure 2) for the low (B) and high (D) frequencies. Left side of image is left side of brain. White numbers give the z MNI coordinate of each slice shown.
An alternative view of the cortical variation in CMI values at the low frequencies is given through a cortical overlay (Figure 4). High values of connectivity are present in a large portion of the cortex following a clear inter-hemispheric symmetry. Midline views portray both medial anterior and posterior DMN nodes, but extending, as well, to the cuneus. The lateral views include high values in both left/right lateral–parietal nodes of the DMN, in the superior temporal gyri (including the primary auditory cortices), in the lateral frontal cortex (specially in the inferior parts), and in ventral occipital areas. With more moderate values of the CMI mainly restricted to the primary sensory cortices, to motor areas (primary and supplementary motor areas), the dorsal cingulate, middle and lower parts of the temporal lobes, and a fraction of the occipital cortex.
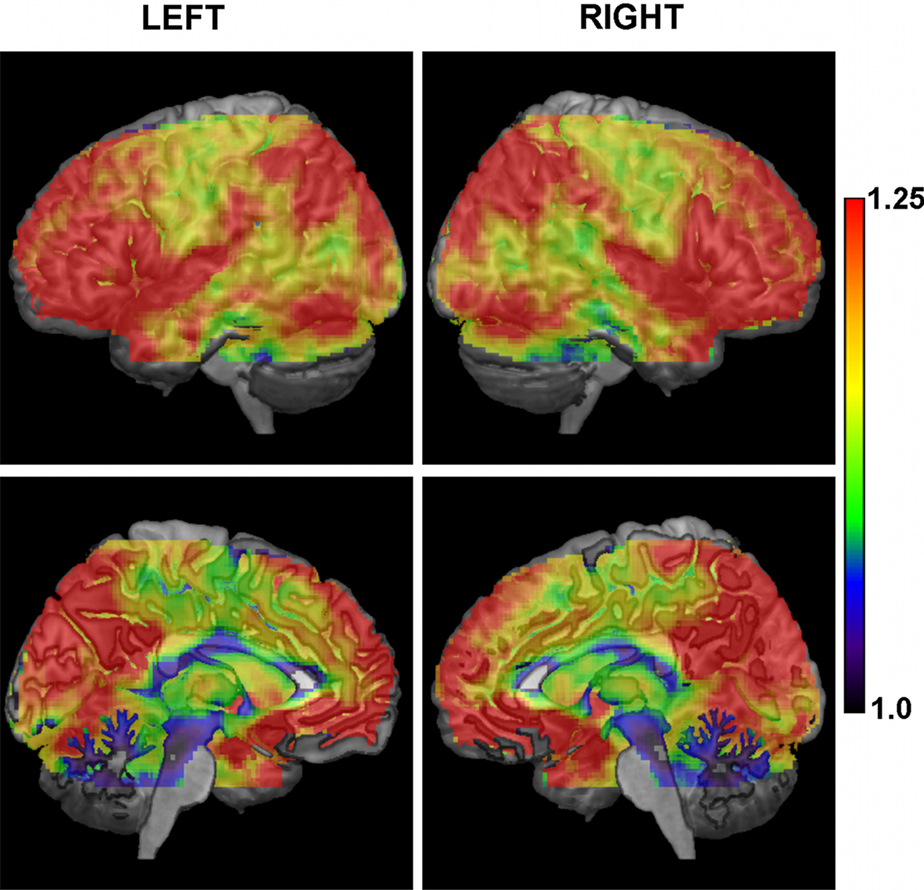
Figure 4. Overlay of the conditional mutual information at the low frequencies on a 3D representation of the brain based on the T1 MNI template. There is a clear symmetrical pattern between both hemispheres, with a large portion of the cortex having high levels of connectivity, and lower values mostly restricted to central areas (e.g., somatosensory cortex, motor related areas, middle and ventral parts of temporal lobes).
Figure 3B shows, for the low frequencies, the mutual information between each voxel and the five points selected as descriptors of gross physiological noise (see Figure 2). This MI of the noise is used in Eq. 3 (see second term at right hand side of this equation) to partial out the effect of physiology through a subtraction. As may be expected, many of the patterns observed in Figure 3B are similar to those seen in the image of standard deviations included as background of Figure 2, suggesting a proper characterization of noise by the five selected points. While in the ventral brain there are high values in CSF and in vascular structures such as the circle of Willis or both middle cerebral arteries, more dorsally we see other maxima in the anterior cerebral artery and in several venous sinuses like the superior sagittal sinus and the straight sinus.
Figure 3C portraits the CMI map at higher frequencies. Here, the contrast between gray and white matter is much less intense than at low frequencies, and local connectivity maxima are limited to the primary auditory cortex and neighboring insula, ventromedial frontal cortex, a local peak in the posterior cingulated cortex, and amygdala, putamen/pallidum, and thalamus bilaterally (the latter with less intensity). Figure 3D shows the MI of the noise for this frequency band, which has a clear resemblance to the image of the MI of the noise at low frequencies (Figure 3B) but with less extended maxima. When CMI and MI of the noise maps are compared some overlap between local maxima in both images becomes evident.
In the analysis of linear trends between age and CMI in the sample of healthy controls, some areas of the brain showed significant associations (using a p < 0.05 corrected threshold). As seen in Figure 5, while a cluster of voxels located posteriorly in the cingulate showed a negative relation (reduction in connectivity) in the low frequencies, two orbitofrontal clusters presented an increase in CMI with age at high frequencies.
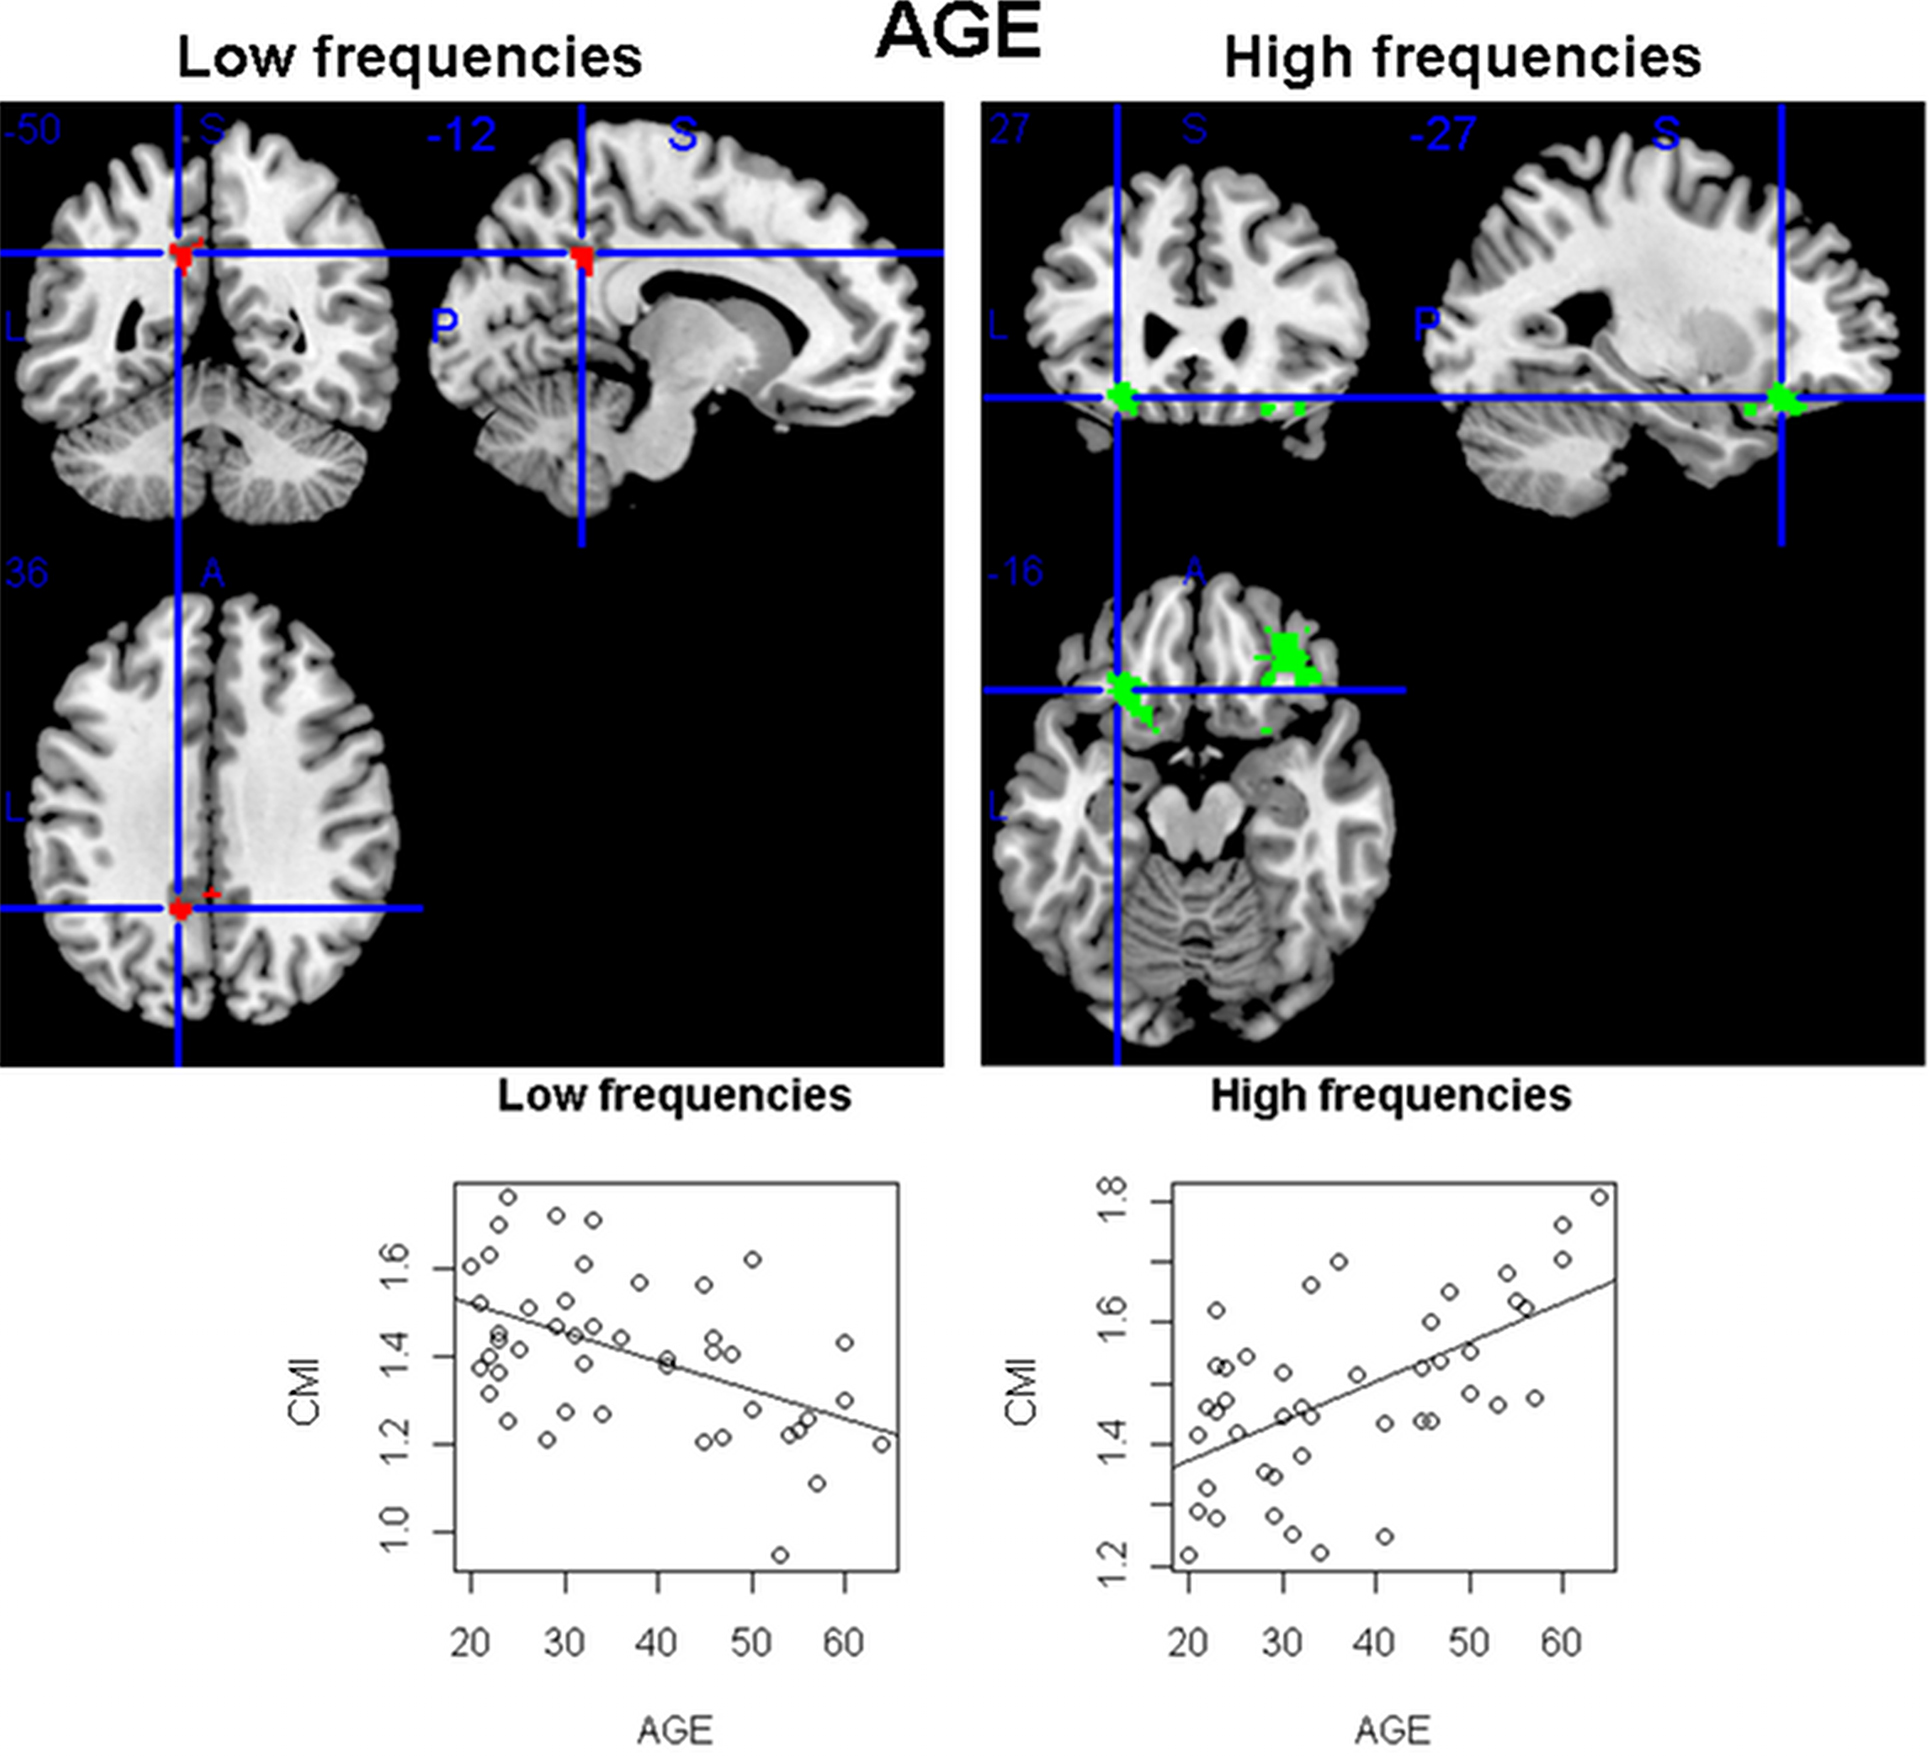
Figure 5. Areas of the brain having a significant linear relation (at p < 0. 05 corrected) between the conditional mutual information and age, for the sample of 45 healthy individuals (ages from 18 to 65). While in the low frequencies a single area (in the cingulate) was found having a decrease in connectivity with age, in the high frequencies two orbitofrontal clusters had the opposite pattern (increase of CMI with age).
Finally, in the analysis of psychotic symptom scores (Liddle factors) and functional connectivity in schizophrenia, clearest results were obtained between CMI and positive factor scores; positive factor scores account for what are known as positive symptoms, such as delusions or hallucinations, that are present in schizophrenic patients but not usually in healthy subjects. Figure 6 shows the set of clusters that are significantly related to the Positive factor scores (with p < 0.05 corrected). If the direction of the relation is taken into account, this set can be split in two groups. There is a group of clusters located near the medial line of the frontal cortex that shows a positive relation between CMI and positive symptoms (increased connectivity with symptoms). This group includes all significant clusters at high frequencies and one cluster from the low frequencies. The remaining three significant clusters from the low frequency band (one in the right posterior cingulate, another in the right frontal cortex, and the later in the right parietal cortex), all show a decrease in connectivity with positive symptoms. An additional analysis comparing neuroleptic dose (quantified in chlorpromazine equivalents) and CMI values was performed to check for potential confounding effects due to medication, but no significant relations were found.
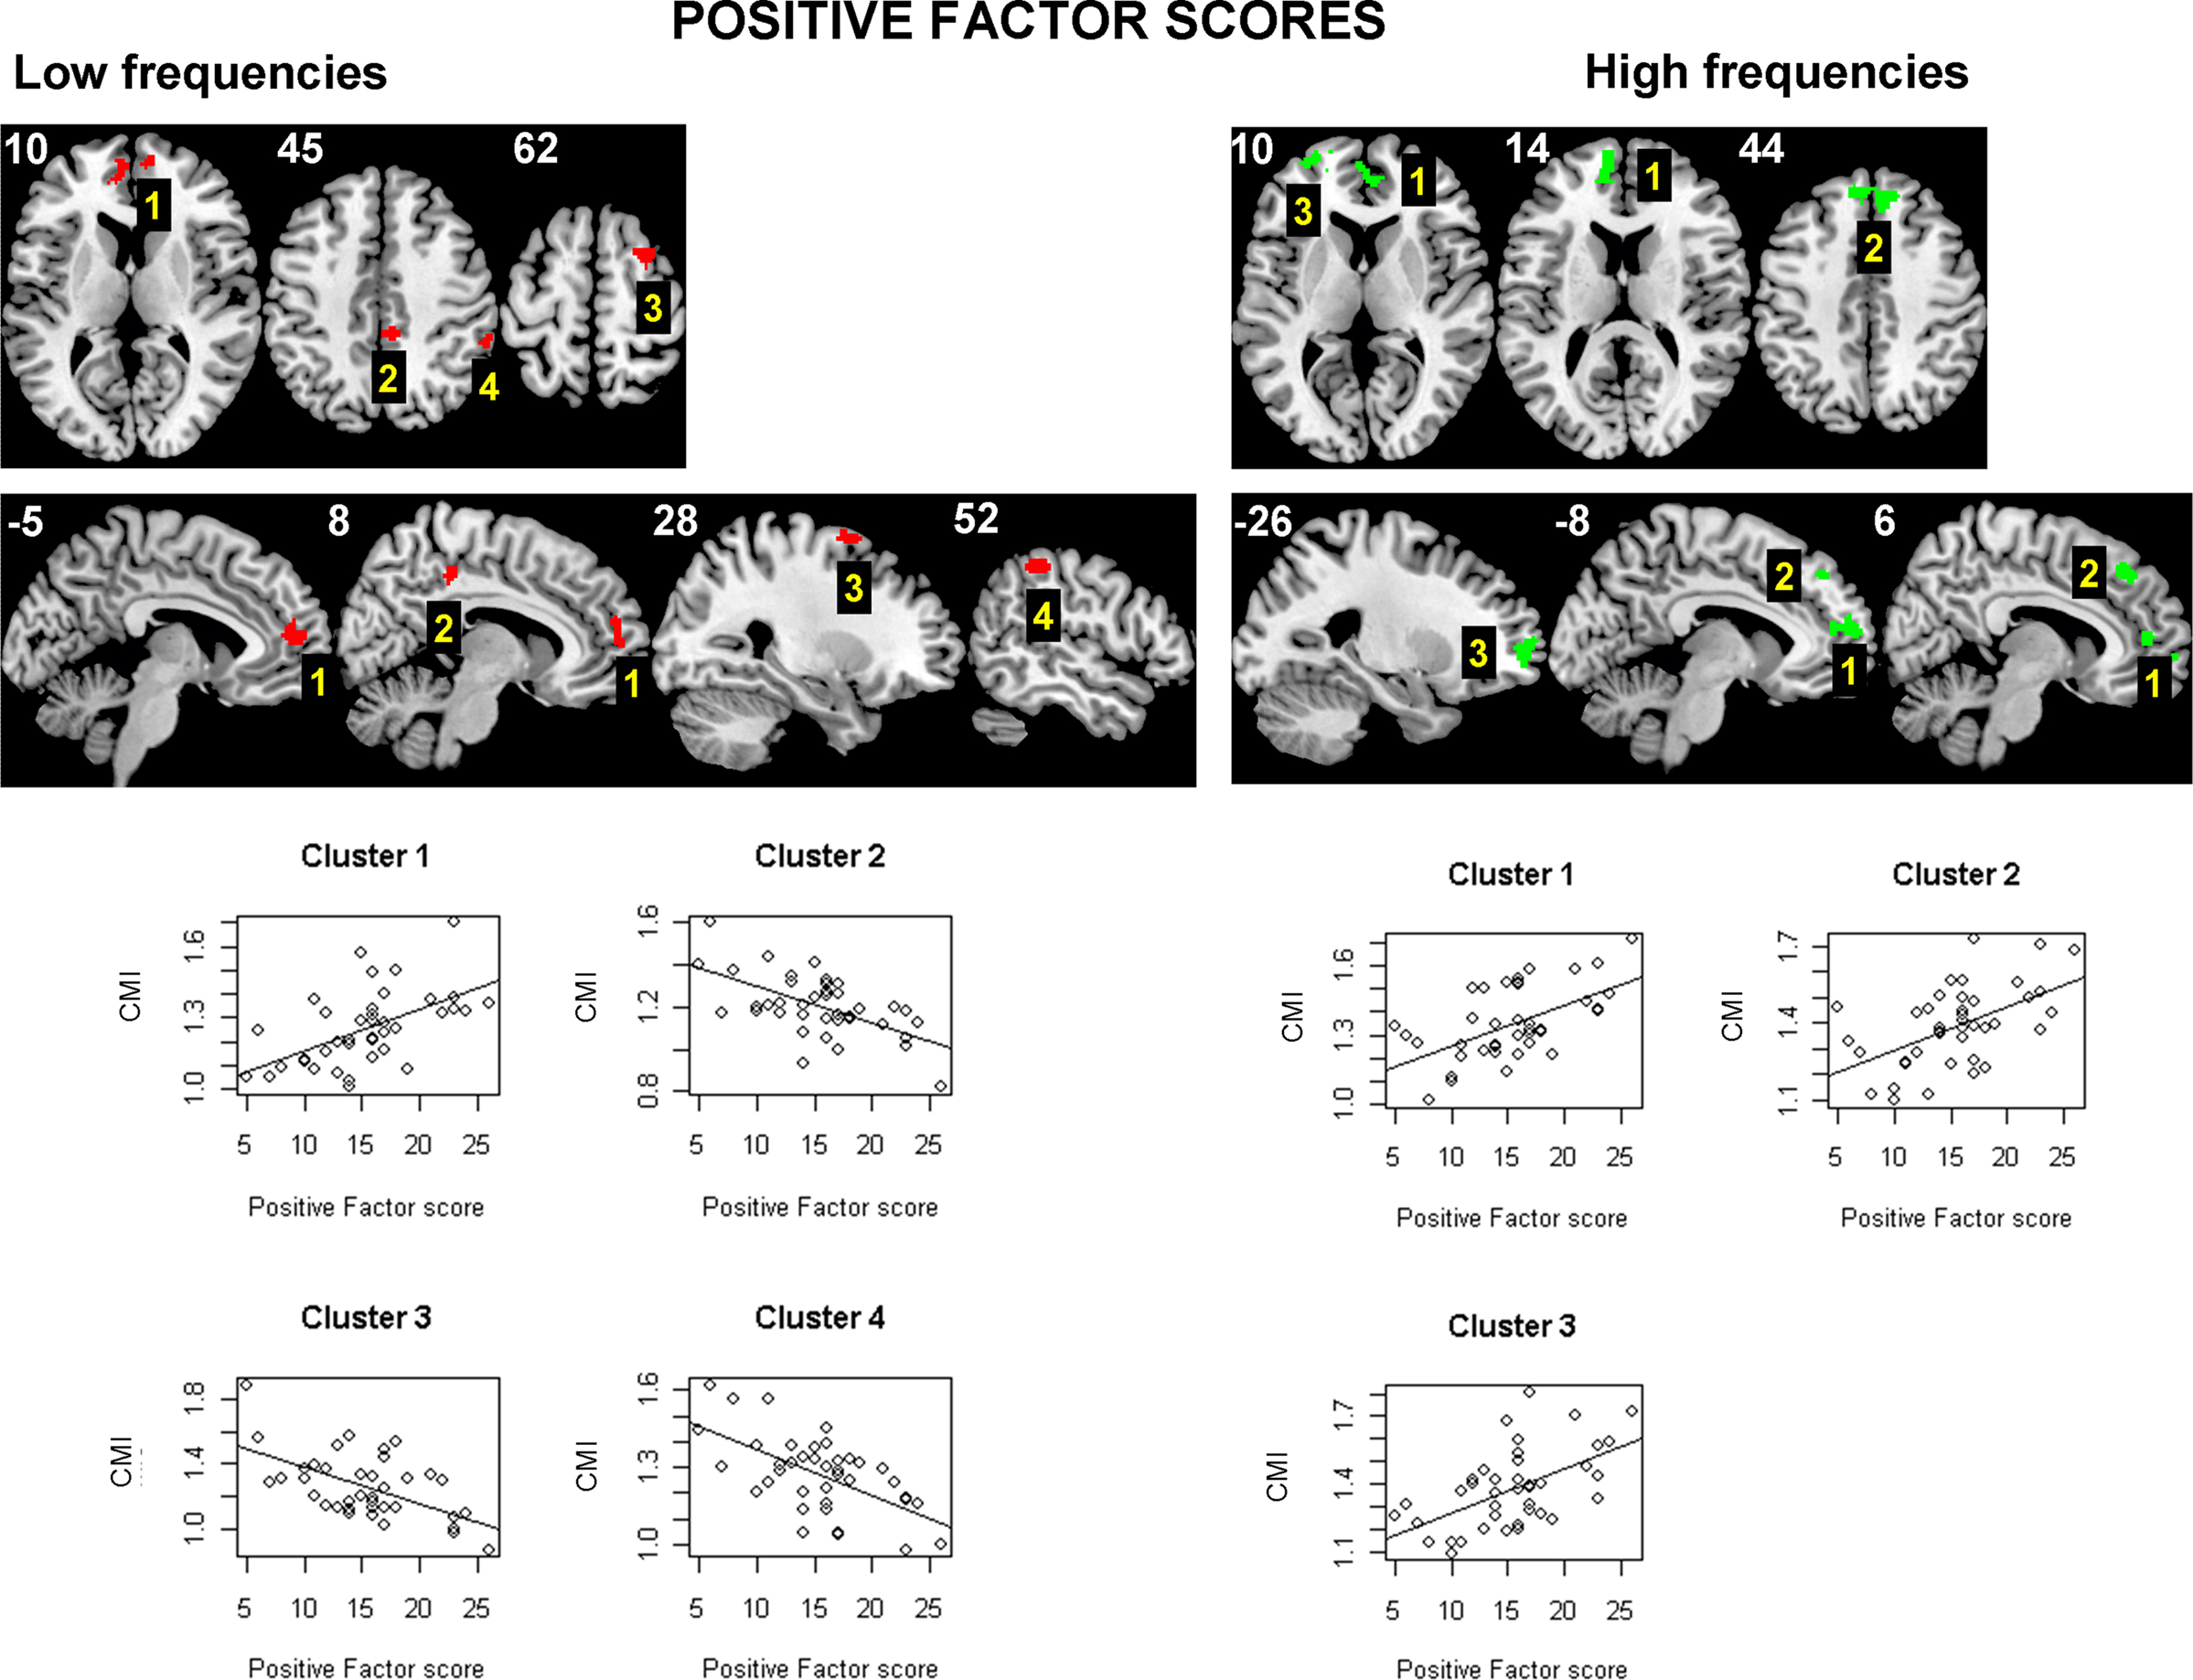
Figure 6. Areas of the brain having a significant linear relation (at p < 0. 05 corrected) between the Liddle’s positive factor scores and the conditional mutual information, in the sample of 40 chronic schizophrenic patients. While there is a set of clusters located near and in the medial frontal cortex (all clusters at high frequencies and Cluster 1 at low frequencies) that show a positive relation between positive symptoms and connectivity, there are three clusters (Clusters 2–4 at low frequencies) which have the opposite pattern (decreased connectivity with positive scores).
Discussion
We propose an alternative way of calculating maps of net levels of connectivity in the brain based on resting-state fMRI images. The benefit of the proposed method over similar approaches relies on its truly multivariate nature, on its ability to quantify both synchronous and asynchronous relations, and on its capacity to minimize the confounding effect of gross physiological noise. When applied to a sample of healthy controls, most informative CMI maps were obtained for the low frequency band (0.02–0.1 Hz) where high values of the CMI were found in cortical and subcortical gray matter structures.
The local maxima in MI observed in both auditory and visual primary cortices may be explained, in a parsimonious way, by direct external stimulation (aliased scanner noise and vision, as individuals where instructed to keep the eyes open), while the well-known levels of connectivity observed in the different nodes of the DMN agree with the relevant role of this network in the resting brain (Raichle et al., 2001). Indeed, the DMN has previously shown high connectivity in similar analyses like the maps of cortical hubs of Buckner et al. (2009) or the global connectivity maps by Cole et al. (2010).
A similar agreement is found, as well, for some of the areas with low CMI like the primary and supplementary motor areas and the somatosensory cortices, as these have low connectivity levels in both Buckner et al. (2009) and Cole et al. (2010) maps, probably as a consequence of their inactivity under the resting condition. Yet another relevant pattern in our maps is the neat symmetrical distribution of high values in some subcortical nuclei such as the amygdala and the basal ganglia, which may be explained by their known integrative role and for being part of well described brain networks (Kandel et al., 2000).
The proposed method minimizes the confounding effect of physiology by conditioning on a set of points which characterize the gross physiological noise in the images. However, when maps of MI of the noise are compared with maps of CMI there is overlap in some of the maxima (more noticeable in the high frequencies). Such agreement, though, does not necessarily have to be attributed to residual noise. Some of the areas of overlap, like the cortex around both insulae and orbitofrontal midline, have been reported to have both high levels of blood flow and of oxygen consumption in a resting-state PET study (Raichle et al., 2001). This high oxygen consumption may, in turn, be related to higher brain activity and higher connectivity levels.
Results from the correlations between age and the CMI can also be linked to previous studies. While the observed increased connectivity with age in the high frequencies is a new finding, the age-related reduction of connectivity in the posterior cingulate is one of the most consistent age-related patterns (see Koch et al., 2010 and references within) and which has been recently replicated in a multicentric fMRI study based on 1414 resting-state fMRI datasets (Biswal et al., 2010).
We find, as well, a reasonable agreement between results from correlations with clinical scores (in the sample of schizophrenics) and previous published work. Most notably, the positive relation with symptoms found in frontomedial areas can be related to several studies which have found abnormalities in this same region. On the one hand, there is the multimodal study by Pomarol-Clotet et al. (2010) that combining structural, diffusion and functional MRI, points to that region as the primary area of alteration in schizophrenia. This result is complemented by the resting-state connectivity study by Salvador et al. (2010) which finds a single primary focus of abnormal hyper-connectivity in this same area.
In turn, such hyper-connectivity, in both clinical symptoms and disease, may be underlying the “failure-to-deactivate” of the anterior node of the DMN, observed in schizophrenics while performing working memory tasks (Pomarol-Clotet et al., 2008; Whitfield-Gabrieli et al., 2009). In this last study they also found abnormal connectivity in very similar areas to those described here (in the anterior and posterior cingulate) reinforcing this convergence in results.
Finally, although the evidence presented through the examples points to reasonable levels of reliability for the proposed method, there are some aspects of it that may be improved. Among them, there is the characterization of both physiological noise and of the joint temporal dynamics of the brain. Due to computational constraints, some sort of data reduction had to be applied to characterize the dynamics of the brain (here we used mean time series of regions in the AAL brain parcellation), and results, to some extent, will depend on the specific choice of the data reduction method used.
Conflict of Interest Statement
Ed Bullmore is employed half-time by GlaxoSmithKline and half-time by University of Cambridge.
Acknowledgments
This study has been supported by three grants from the Spanish Ministry of Health. Two of them (PI05/1874 and CP07/00048) given to Raymond Salvador and one (FI05/00322) to Jesús Gomar. Futher support has been received, as well, from the Instituto de Salud Carlos III, Centro de Investigación en Red de Salud Mental, CIBERSAM.
References
Biswal, B. B., Mennes, M., Zuo, X. N., Gohel, S., Kelly, C., Smith, S. M., Beckmann, C. F., Adelstein, J. S., Buckner, R. L., Colcombe, S., Dogonowski, A. M., Ernst, M., Fair, D., Hampson, M., Hoptman, M. J., Hyde, J. S., Kiviniemi, V. J., Kötter, R., Li, S. J., Lin, C. P., Lowe, M. J., Mackay, C., Madden, D. J., Madsen, K. H., Margulies, D. S., Mayberg, H. S., McMahon, K., Monk, C. S., Mostofsky, S. H., Nagel, B. J., Pekar, J. J., Peltier, S. J., Petersen, S. E., Riedl, V., Rombouts, S. A., Rypma, B., Schlaggar, B.L., Schmidt, S., Seidler, R. D., Siegle, G.J., Sorg, C., Teng, G. J., Veijola, J., Villringer, A., Walter, M., Wang, L., Weng, X.C., Whitfield-Gabrieli, S., Williamson, P., Windischberger, C., Zang, Y. F., Zhang, H. Y., Castellanos, F. X., and Milham, M. P. (2010). Toward discovery science of human brain function. Proc. Natl. Acad. Sci. U.S.A. 107, 4734–4739.
Buckner, R. L., Sepulcre, J., Talukdar, T., Krienen, F. M., Liu, H., Hedden, T., Andrews-Hanna, J. R., Sperling, R. A., and Johnson, K. A. (2009). Cortical hubs revealed by intrinsic functional connectivity: mapping, assessment of stability, and relation to Alzheimer’s disease. J. Neurosci. 29, 1860–1873.
Cole, M. W., Pathak, S., and Schneider, W. (2010). Identifying the brain’s most globally connected regions. Neuroimage 15, 3132–3148.
Kandel, E. R., Schwartz, J. H., and Jessell, T. M. (2000). Principles of Neural Science, 4th Edn. New York: McGraw-Hill.
Kay, S. R., Fiszbein, A., and Opler, L. A. (1987). The positive and negative syndrome scale (PANSS) for schizophrenia. Schizophr. Bull. 13, 261–276.
Koch, W., Teipel, S., Mueller, S., Buerger, K., Bokde, A. L., Hampel, H., Coates, U., Reiser, M., and Meindl, T. (2010). Effects of aging on default mode network activity in resting state fMRI: does the method of analysis matter? Neuroimage 51, 280–287.
Liddle, P. F. (1987). The symptoms of chronic schizophrenia. A re-examination of the positive-negative dichotomy. Br. J. Psychiatry 151, 145–151.
Majeed, W., Magnuson, M., and Keilholz, S. D. (2009). Spatiotemporal dynamics of low frequency fluctuations in BOLD fMRI of the rat. J. Magn. Reson. Imaging 30, 384–393.
Pomarol-Clotet, E., Canales-Rodríguez, E. J., Salvador, R., Sarró, S., Gomar, J. J., Vila, F., Ortiz-Gil, J., Iturria-Medina, Y., Capdevila, A., and McKenna, P. J. (2010). Medial prefrontal cortex pathology in schizophrenia as revealed by convergent findings from multimodal imaging. Mol. Psychiatry 15, 823–830.
Pomarol-Clotet, E., Salvador, R., Sarró, S., Gomar, J., Vila, F., Martínez, A., Guerrero, A., Ortiz-Gil, J., Sans-Sansa, B., Capdevila, A., Cebamanos, J.M., and McKenna, P. J. (2008), Failure to deactivate in the prefrontal cortex in schizophrenia: dysfunction of the default mode network? Psychol. Med. 38, 1185–1193.
Raichle, M. E., MacLeod, A. M., Snyder, A. Z., Powers, W. J., Gusnard, D. A., and Shulman, G. L. (2001). A default mode of brain function. Proc. Natl. Acad. Sci. U.S.A. 98, 676–682.
Salvador, R., Martínez, A., Pomarol-Clotet, E., Gomar, J. J., Vila, F., Sarró, S., Capdevila, A., and Bullmore, E. (2008). A simple view of the brain through a frequency-specific functional connectivity measure. Neuroimage 39, 279–289.
Salvador, R., Martínez, A., Pomarol-Clotet, E., Sarró, S., Suckling, J., and Bullmore, E. (2007). Frequency based mutual information measures between clusters of brain regions in functional magnetic resonance imaging. Neuroimage 35, 83–88.
Salvador, R., Sarró, S., Gomar, J. J., Ortiz-Gil, J., Vila, F., Capdevila, A., Bullmore, E., McKenna, P. J., and Pomarol-Clotet, E. (2010). Overall brain connectivity maps show cortico-subcortical abnormalities in schizophrenia. Hum Brain Mapp. doi: 10.1002/hbm.20993
Sepulcre, J., Liu, H., Talukdar, T., Martincorena, I., Yeo, B. T., and Buckner, R. L. (2010). The organization of local and distant functional connectivity in the human brain. PLoS Comput. Biol. 6, e1000808. doi: 10.1371/journal.pcbi.1000808.
Shmueli, K., van Gelderen, P., de Zwart, J. A., Horovitz, S. G., Fukunaga, M., Jansma, J. M., and Duyn, J. H. (2007). Low-frequency fluctuations in the cardiac rate as a source of variance in the resting-state fMRI BOLD signal. Neuroimage 38, 306–320.
Shumway, H., and Stoffer, D. S. (2000). Time Series Analysis and its Applications. New York: Springer.
Smith, S. M., Jenkinson, M., Woolrich, M. W., Beckmann, C. F., Behrens, T. E., Johansen-Berg, H., Bannister, P. R., De Luca, M., Drobnjak, I., Flitney, D. E., Niazy, R. K., Saunders, J., Vickers, J., Zhang, Y., De Stefano, N., Brady, J. M., and Matthews, P. M. (2004). Advances in functional and structural MR image analysis and implementation as FSL. Neuroimage 23(Suppl. 1), S208–S2019.
Tzourio-Mazoyer, N., Landeau, B., Papathanassiou, D., Crivello, F., Etard, O., Delcroix, N., Mazoyer, B., and Joliot, M. (2002). Automated anatomical labeling of activations in SPM using a macroscopic anatomical parcellation of the MNI MRI single-subject brain. Neuroimage 15, 273–289.
Whitfield-Gabrieli, S., Thermenos, H. W., Milanovic, S., Tsuang, M. T., Faraone, S. V., McCarley, R. W., Shenton, M. E., Green, A. I., Nieto-Castanon, A., LaViolette, P., Wojcik, J., Gabrieli, J. D., and Seidman, L. J. (2009). Hyperactivity and hyperconnectivity of the default network in schizophrenia and in first-degree relatives of persons with schizophrenia. Proc. Natl. Acad. Sci. U.S.A. 106, 1279–1284.
Keywords: brain connectivity, mutual information, resting state, schizophrenia, positive symptoms, default mode network, age, functional connectivity
Citation: Salvador R, Anguera M, Gomar JJ, Bullmore ET and Pomarol-Clotet E (2010) Conditional mutual information maps as descriptors of net connectivity levels in the brain. Front. Neuroinform. 4:115. doi: 10.3389/fninf.2010.00115
Received: 08 September 2010;
Paper pending published: 06 October 2010;
Accepted: 15 October 2010;
Published online: 16 November 2010.
Edited by:
Daniel Gardner, Weill Cornell Medical College, USAReviewed by:
Dante R. Chialvo, Northwestern University, USA;Marcus Kaiser, Seoul National University, South Korea
Copyright: © 2010 Salvador, Anguera, Gomar, Bullmore and Pomarol-Clotet. This is an open-access article subject to an exclusive license agreement between the authors and the Frontiers Research Foundation, which permits unrestricted use, distribution, and reproduction in any medium, provided the original authors and source are credited.
*Correspondence: *Correspondence Raymond Salvador, Benito Menni - C.A.S.M. Germanes Hospitalàries del Sagrat Cor de Jesús, C/ Dr Antoni Pujadas 38-C, 08830 Sant Boi de Llobregat, Barcelona, Spain. e-mail: rai.salvador@gmail.com