Reproducibility of graph metrics in fMRI networks
- 1 School of Biomedical Engineering and Sciences, Virginia Tech-Wake Forest University, Winston-Salem, NC, USA
- 2 Department of Radiology, Wake Forest University School of Medicine, Winston-Salem, NC, USA
- 3 Department of Biostatistical Sciences, Wake Forest University School of Medicine, Winston-Salem, NC, USA
The reliability of graph metrics calculated in network analysis is essential to the interpretation of complex network organization. These graph metrics are used to deduce the small-world properties in networks. In this study, we investigated the test-retest reliability of graph metrics from functional magnetic resonance imaging data collected for two runs in 45 healthy older adults. Graph metrics were calculated on data for both runs and compared using intraclass correlation coefficient (ICC) statistics and Bland–Altman (BA) plots. ICC scores describe the level of absolute agreement between two measurements and provide a measure of reproducibility. For mean graph metrics, ICC scores were high for clustering coefficient (ICC = 0.86), global efficiency (ICC = 0.83), path length (ICC = 0.79), and local efficiency (ICC = 0.75); the ICC score for degree was found to be low (ICC = 0.29). ICC scores were also used to generate reproducibility maps in brain space to test voxel-wise reproducibility for unsmoothed and smoothed data. Reproducibility was uniform across the brain for global efficiency and path length, but was only high in network hubs for clustering coefficient, local efficiency, and degree. BA plots were used to test the measurement repeatability of all graph metrics. All graph metrics fell within the limits for repeatability. Together, these results suggest that with exception of degree, mean graph metrics are reproducible and suitable for clinical studies. Further exploration is warranted to better understand reproducibility across the brain on a voxel-wise basis.
Introduction
Application of graph theory analysis to the human brain has provided further insight into the complex interactions of different regions in the brain. Functional relationships within the brain network has been studied in functional magnetic resonance imaging (fMRI), electroencephalography (EEG), magnetoencephalography (MEG), and multielectrode array (MEA) (Bullmore and Sporns, 2009). Graph network theory has also proven useful in the study of human disease, including various brain diseases (Bassett and Bullmore, 2009). Network analysis of the functional connectivity in Alzheimer’s disease patients revealed a significant difference in the mean small-world coefficient between patients and a control group (Supekar et al., 2008). Small-world properties were also shown to be disrupted in the network for schizophrenia patients (Micheloyannis et al., 2006; Bassett et al., 2008). These observed differences in network topology suggest that monitoring changes in the network can be a useful tool in understanding different pathologies of the brain. More importantly, the ability to use graph metrics to compare different populations is appealing in both research and clinical settings.
Study of functional connectivity in the brain reveals how different regions of the brain interact and is of particular interest in network science. The at-rest fMRI network has been used to study the modular structure and small-world properties of the brain (Ferrarini et al., 2009; Wang et al., 2009). In addition, several studies have used task-based fMRI and MEG data to assess connectivity during various cognitive and motor processes (Eguíluz et al., 2005; Bassett et al., 2006). As the study of brain networks continues to expand, validation of network reproducibility is needed to substantiate findings.
Excellent reproducibility of graph metrics has been reported for MEG (Deuker et al., 2009) and diffusion tensor imaging (DTI) networks (Vaessen et al., 2010). Although these results are promising, the use of fMRI is more ubiquitous, which makes it important to verify the reproducibility of fMRI-based brain networks. Graph metric reproducibility is essential for test–retest purposes. If network metrics are significantly different from scan to scan, the statistical power of the measurement is greatly decreased, which can make network analysis unreliable. The focus of this paper is to evaluate the reproducibility of measured graph metrics between two fMRI runs.
Network reproducibility was assessed using intraclass correlation coefficient (ICC) statistics to test the absolute agreement for mean and voxel-wise graph metrics. For voxel-wise reproducibility, various network statistics were compared at each node between two time points in the same set of subjects. Bland–Altman plots were also produced to test measurement reliability of mean graph metrics.
Materials and Methods
Study Participants
Data for this study consists of 45 healthy older adults that participated in a separate experiment evaluating a cognitive training program (Mozolic et al., 2009, 2010). The age range of subjects was 65–75 with an average age of 69 (±3 SD) years. Demographics for the study included 25 females and 20 males, who comprised of 43 White (including one Hispanic or Latino), and two Black or African American participants.
All participants gave written informed consent approved by the Institutional Review Board at Wake Forest University School of Medicine, Winston-Salem, NC. Participants were compensated approximately $20/h for their participation in the study.
Scanning Protocol
All data reported here are from scans collected at a baseline session prior to any intervention. For each subject, two independent scans were collected, one after the other, during the same scan session. Thus, each person completed the task described below two sequential times to produce two datasets. The subjects were not removed from the MRI scanner between the two scans. During each scan, gradient-echo EPI images (TR/TE = 2100/40 ms) were acquired over a period of 5 min 23 s (154 images) on a 1.5 T GE twin-speed LX scanner with a birdcage head coil (GE Medical Systems, Milwaukee, WI, USA).
The field-of-view was 24 cm (frequency) × 15 cm (phase) with an image acquisition matrix of 64 × 40 yielding an in-plane resolution of 3.75 mm × 3.75 mm. Each volume had full brain coverage and was composed of 28 slices 5-mm thick with no gap. T1-weighted anatomical images were collected for tissue segmentation purposes. The high-resolution, structural scans were obtained using an inversion recovery 3D spoiled gradient-echo sequence (matrix size = 256 × 256; field of view = 24 cm; 1.5 mm sections, no gap; 128 slices; in-plane resolution = 0.94 mm).
Participants performed an executive function task (Eriksen and Eriksen, 1974) that required them to focus attention on a central visual stimulus and ignore other visual stimuli to either side of the central stimulus. The task was presented using a rapid event-related design (Burock et al., 1998). Stimuli were controlled with E-Prime software1 and presented with MR-compatible visual display goggles (Resonance Technology Inc.2). Images were motion corrected, normalized to Montreal Neurological Institute (MNI) space, and resliced to a 4 × 4 × 5 mm voxel size using SPM99 (Wellcome Trust Centre for Neuroimaging, London, UK). The anatomical image was normalized to MNI space and segmented into gray matter, white matter, and cerebrospinal fluid (CSF) using the unified segmentation algorithm in SPM5 (Ashburner and Friston, 2005). Tissue maps were generated by averaging all signals from the segmented images and applying a threshold. White matter and CSF maps were thresholded at 0.8 and used to calculate the mean signal from each tissue type. The gray matter maps were thresholded at 0.2 and used to mask the functional images. The threshold for gray matter is more lenient than those used for white matter and CSF. This is done to increase sensitivity and to capture most of the gray matter containing voxels. The mask serves to limit the analysis to gray matter voxels and to reduce the computation time in network analysis.
Network Analysis
As diagrammed in Figure 1, fMRI time courses were extracted for each voxel in gray matter (approximately 16,000) and band-pass filtered to remove signal outside the range of 0.009–0.08 Hz (Fox et al., 2005; van den Heuvel et al., 2008). Network analysis was based on subject specific gray matter tissue maps with mean white matter and CSF signal regressed from the filtered time series to account for physiological noise. The six rigid-body motion parameters from the motion correction process were also regressed from the time series.
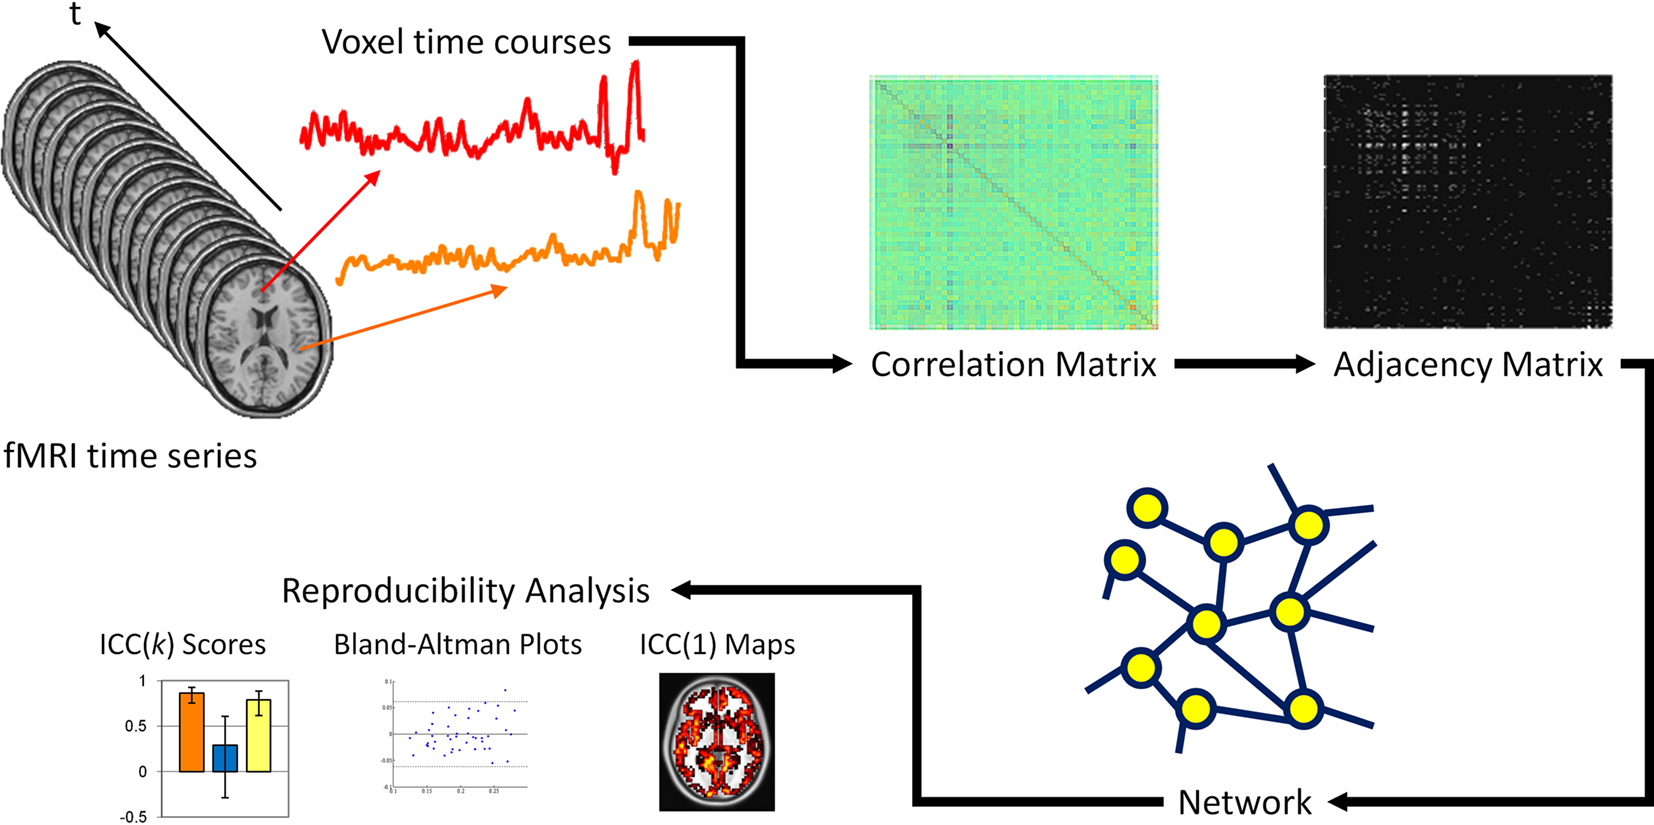
Figure 1. Schematic of network and reproducibility analysis. Voxel time courses are extracted from the fMRI time series and computing the Pearson correlation between all voxel pairs, a correlation matrix is produced. A threshold is applied to the correlation matrix to generate a binary adjacency matrix. From the adjacency matrix, graph metrics are calculated at every node in the network and averaged to produce mean network metrics. From these graph metrics, ICC(k) scores, Bland–Altman plots and ICC(1) maps are produced.
A correlation matrix was then produced by computing the Pearson correlation between all possible pairs of voxels within the fMRI time series. A threshold was applied to the correlation matrix, whereby voxel pairs above the threshold were considered connected and assigned a value of 1, and voxel pairs below the threshold were considered not connected and assigned a value of 0. The discretization of the correlation matrix produces an undirected, unweighted adjacency matrix that serves as a topological diagram of functional connectivity. The threshold was defined such that the relationship between the number of nodes and average number of connections at each node was consistent across subjects. Specifically, the relationship S = log(N)/log(K) was the same across subjects, where N is the number of nodes in the entire network, K is the average node degree of the network, and S represents the average path length of an Erdo?s–Rényi network (Watts and Strogatz, 1998). For this paper, the threshold S = 2.5 was used for the majority of analyses, but the effect of threshold on network reproducibility was also evaluated for S = 2.0, 3.0, 3.5, and 4.0. The adjacency matrix represented the largest fully connected component in the brain network.
Calculated Graph Metrics
From the adjacency matrix, the following graph metrics were calculated at each node as well as averaged to yield means for the entire network: degree (K), clustering coefficient (C), minimum path length (L), local efficiency (Eloc), and global efficiency (Eglob). Network metrics used in this study are shown in Table 1 (for more details on specific metrics, see Rubinov and Sporns, 2010).
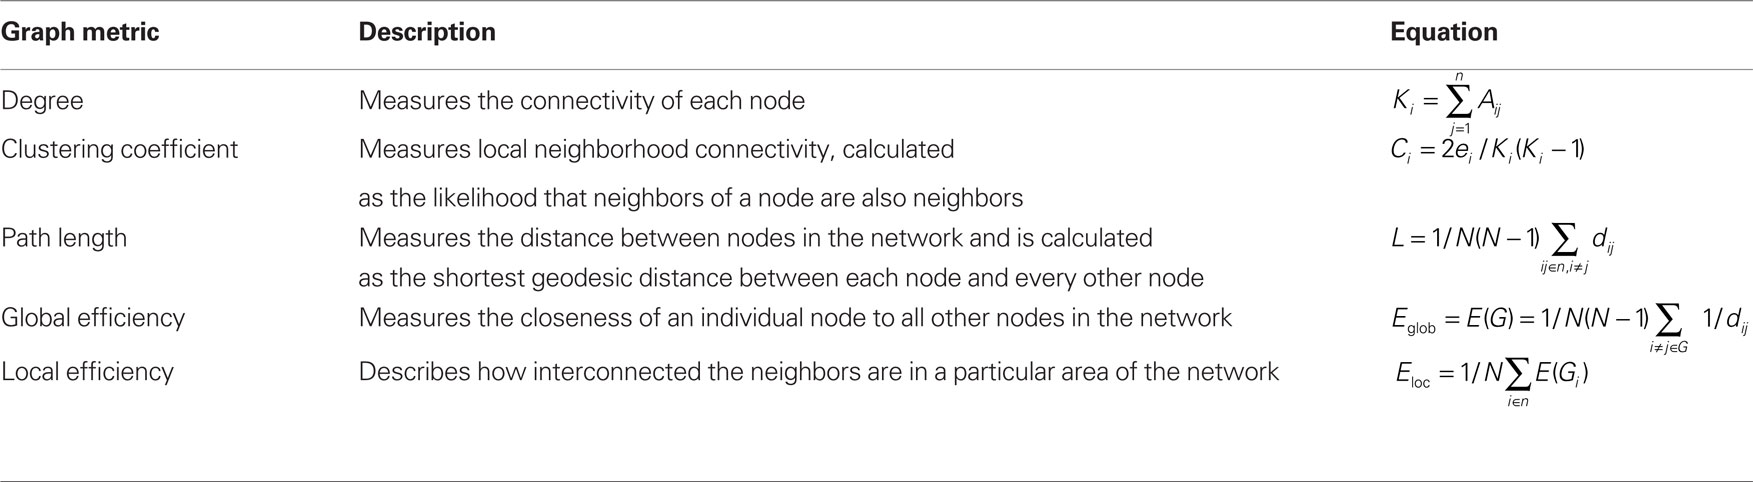
Table 1. Description and mathematical definition of graph metrics used in this study.
Statistical Analysis
Intraclass correlation coefficient statistics were used to measure the absolute agreement of each graph metric between fMRI runs. ICCs are an appropriate statistic for comparing variables that share the same metric or category, and are often used for measurements that are considered exchangeable (i.e., the order of the measurements does not matter; McGraw and Wong, 1996; Gonzalez and Griffin, 1999). An ICC score of 1 denotes complete agreement, while an ICC score of 0 denotes no agreement.
Graph metrics were calculated for the two runs at every node in the network and averaged to determine mean graph metrics. To test the reproducibility of the mean statistics, a one-way model for average measurements, designated ICC(k), was used. The “k” in this statistic is not related to network degree (K) and to avoid confusion will be abbreviated as ICC. It was calculated as

where  is the between subject variance and
  is the within subject variance.
Bland–Altman (BA) plots were generated for the paired runs to assess the repeatability of mean graph metrics. BA plots measure the difference of means between runs. For repeated measurements, a mean difference of 0 indicates perfect repeatability. Using a one-way analysis of variance with subject as the factor, the within-subject standard deviation (σw) was calculated to determine the repeatability coefficient ( ). The mean difference is expected to be less than the RC values, which serve as the 95% limit of agreement (Bland and Altman, 1999).
To quantify the spatial pattern of reproducibility across the brain, a one-way model for single measurements, designated ICC(1), was used to calculate the reproducibility of individual voxels in networks across subjects. It was calculated as
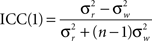
where n is number of subjects,  is the between subject variance and
  is the within subject variance.
ICC(1) analysis requires that a given voxel must be present in both realizations of the network for every subject. If a voxel is missing in any one network, then that voxel cannot be included in the analysis. This occurs because individual subject gray matter masks result in different sets of voxels being identified as gray matter across subjects. To address this issue, a threshold was set whereby a given voxel must appear in 80% of the subjects to be included in ICC analysis and only those subjects with that voxel were included in the calculation. Thus, the specific subjects used to calculate ICC in each voxel included a subpopulation of at least 80% of the total subject pool. ICC(1) scores were used to produce voxel-wise reproducibility maps that were mapped to brain space in unsmoothed and smoothed data. These ICC(1) maps were compared to a “hub” map that represents the consistency of the highest degree nodes (representing the top 25%) and lowest degree nodes (representing the bottom 75% of nodes) across subjects. A secondary analysis was performed after smoothing the individual network metric maps using a Gaussian kernel of 8 × 8 × 10. This smoothing step helps to reduce noise in the data and account for small errors in the spatial normalization. The data were smoothed after the networks were generated to avoid the introduction of spurious local correlations.
All statistical analyses of mean graph metrics were performed using SPSS (version 17.0.0, SPSS Inc., Chicago, IL, USA). Statistical calculations for the voxel-wise metrics were performed using MATLAB (version 7.7.0 2008b, The MathWorks, Inc., Natick, MA, USA).
Results
Mean Network Metric Reproducibility
Intraclass correlation coefficient scores for mean graph metrics ranged from 0.29 to 0.86 (Figure 2). Clustering coefficient had the highest score (ICC = 0.86) and degree had the lowest score (ICC = 0.29). Global efficiency (ICC = 0.83), path length (ICC = 0.79), and local efficiency (ICC = 0.75) also had high ICC scores. For reference, the following ranges can be used for ICC interpretation: ICC <0.20 indicates poor agreement; 0.21–0.40 indicates fair agreement; 0.41–0.60 indicates moderate agreement; 0.61–0.80 indicates strong agreement; and >0.80 indicates almost perfect agreement (Montgomery et al., 2002).
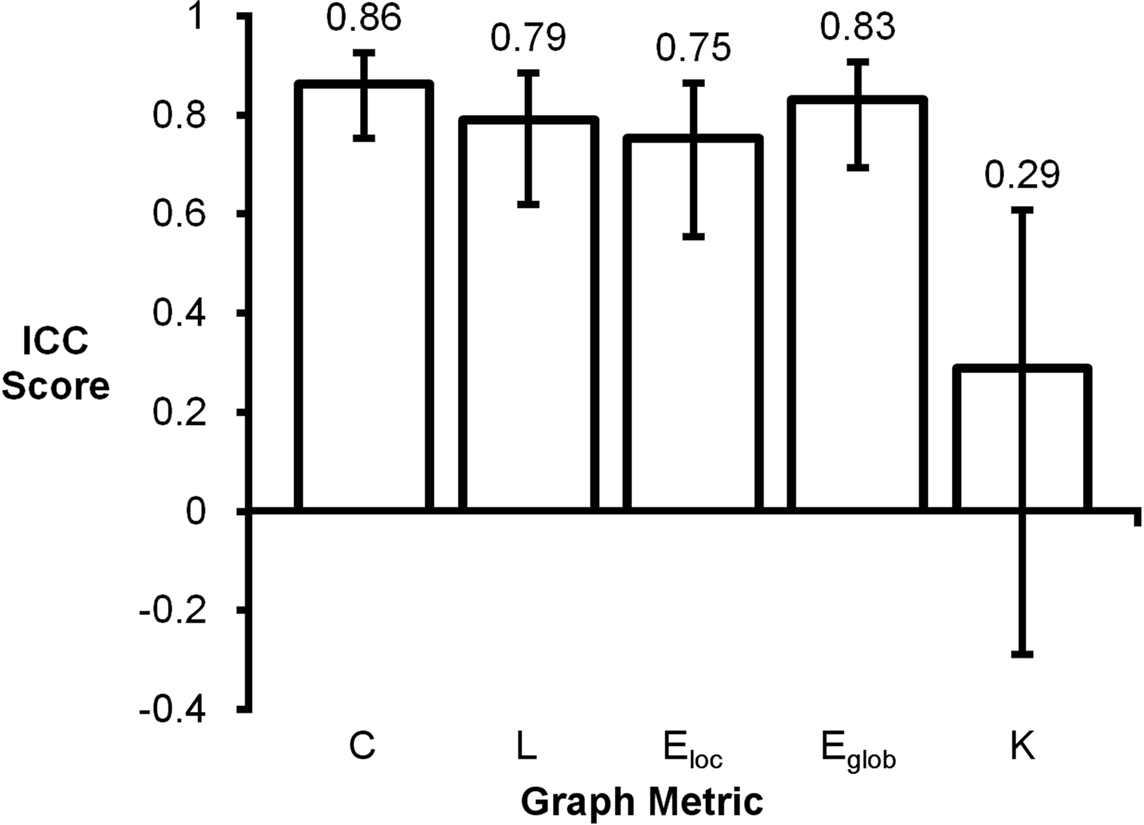
Figure 2. Intraclass correlation coefficient plot of mean graph metrics. Clustering coefficient (C), global efficiency (Eglob), local efficiency (Eloc), and path length (L) were found to be highly reproducible while degree (K) had a noticeably lower ICC score.
Bland–Altman plots for mean graph metrics (Figure 3) showed that each metric was generally repeatable with the mean difference falling within the RC limits for the majority of subjects. In fact, for all metrics only three or fewer subjects fell outside the RC limit. This indicates a high level of repeatability for all measures (Bland and Altman, 1999). While the mean difference was approximately normally distributed for most metrics, the absolute value of the mean difference for degree increased as the mean increased. The increasing mean differences may be related to the degree distribution within subjects, which follows an exponentially truncated power law (Achard et al., 2006; Hayasaka and Laurienti, 2010). However, distributions across large populations have not been investigated to date. Nevertheless, the data indicated that degree was within the RC limits for all subjects except those three subjects with the highest mean degree difference.
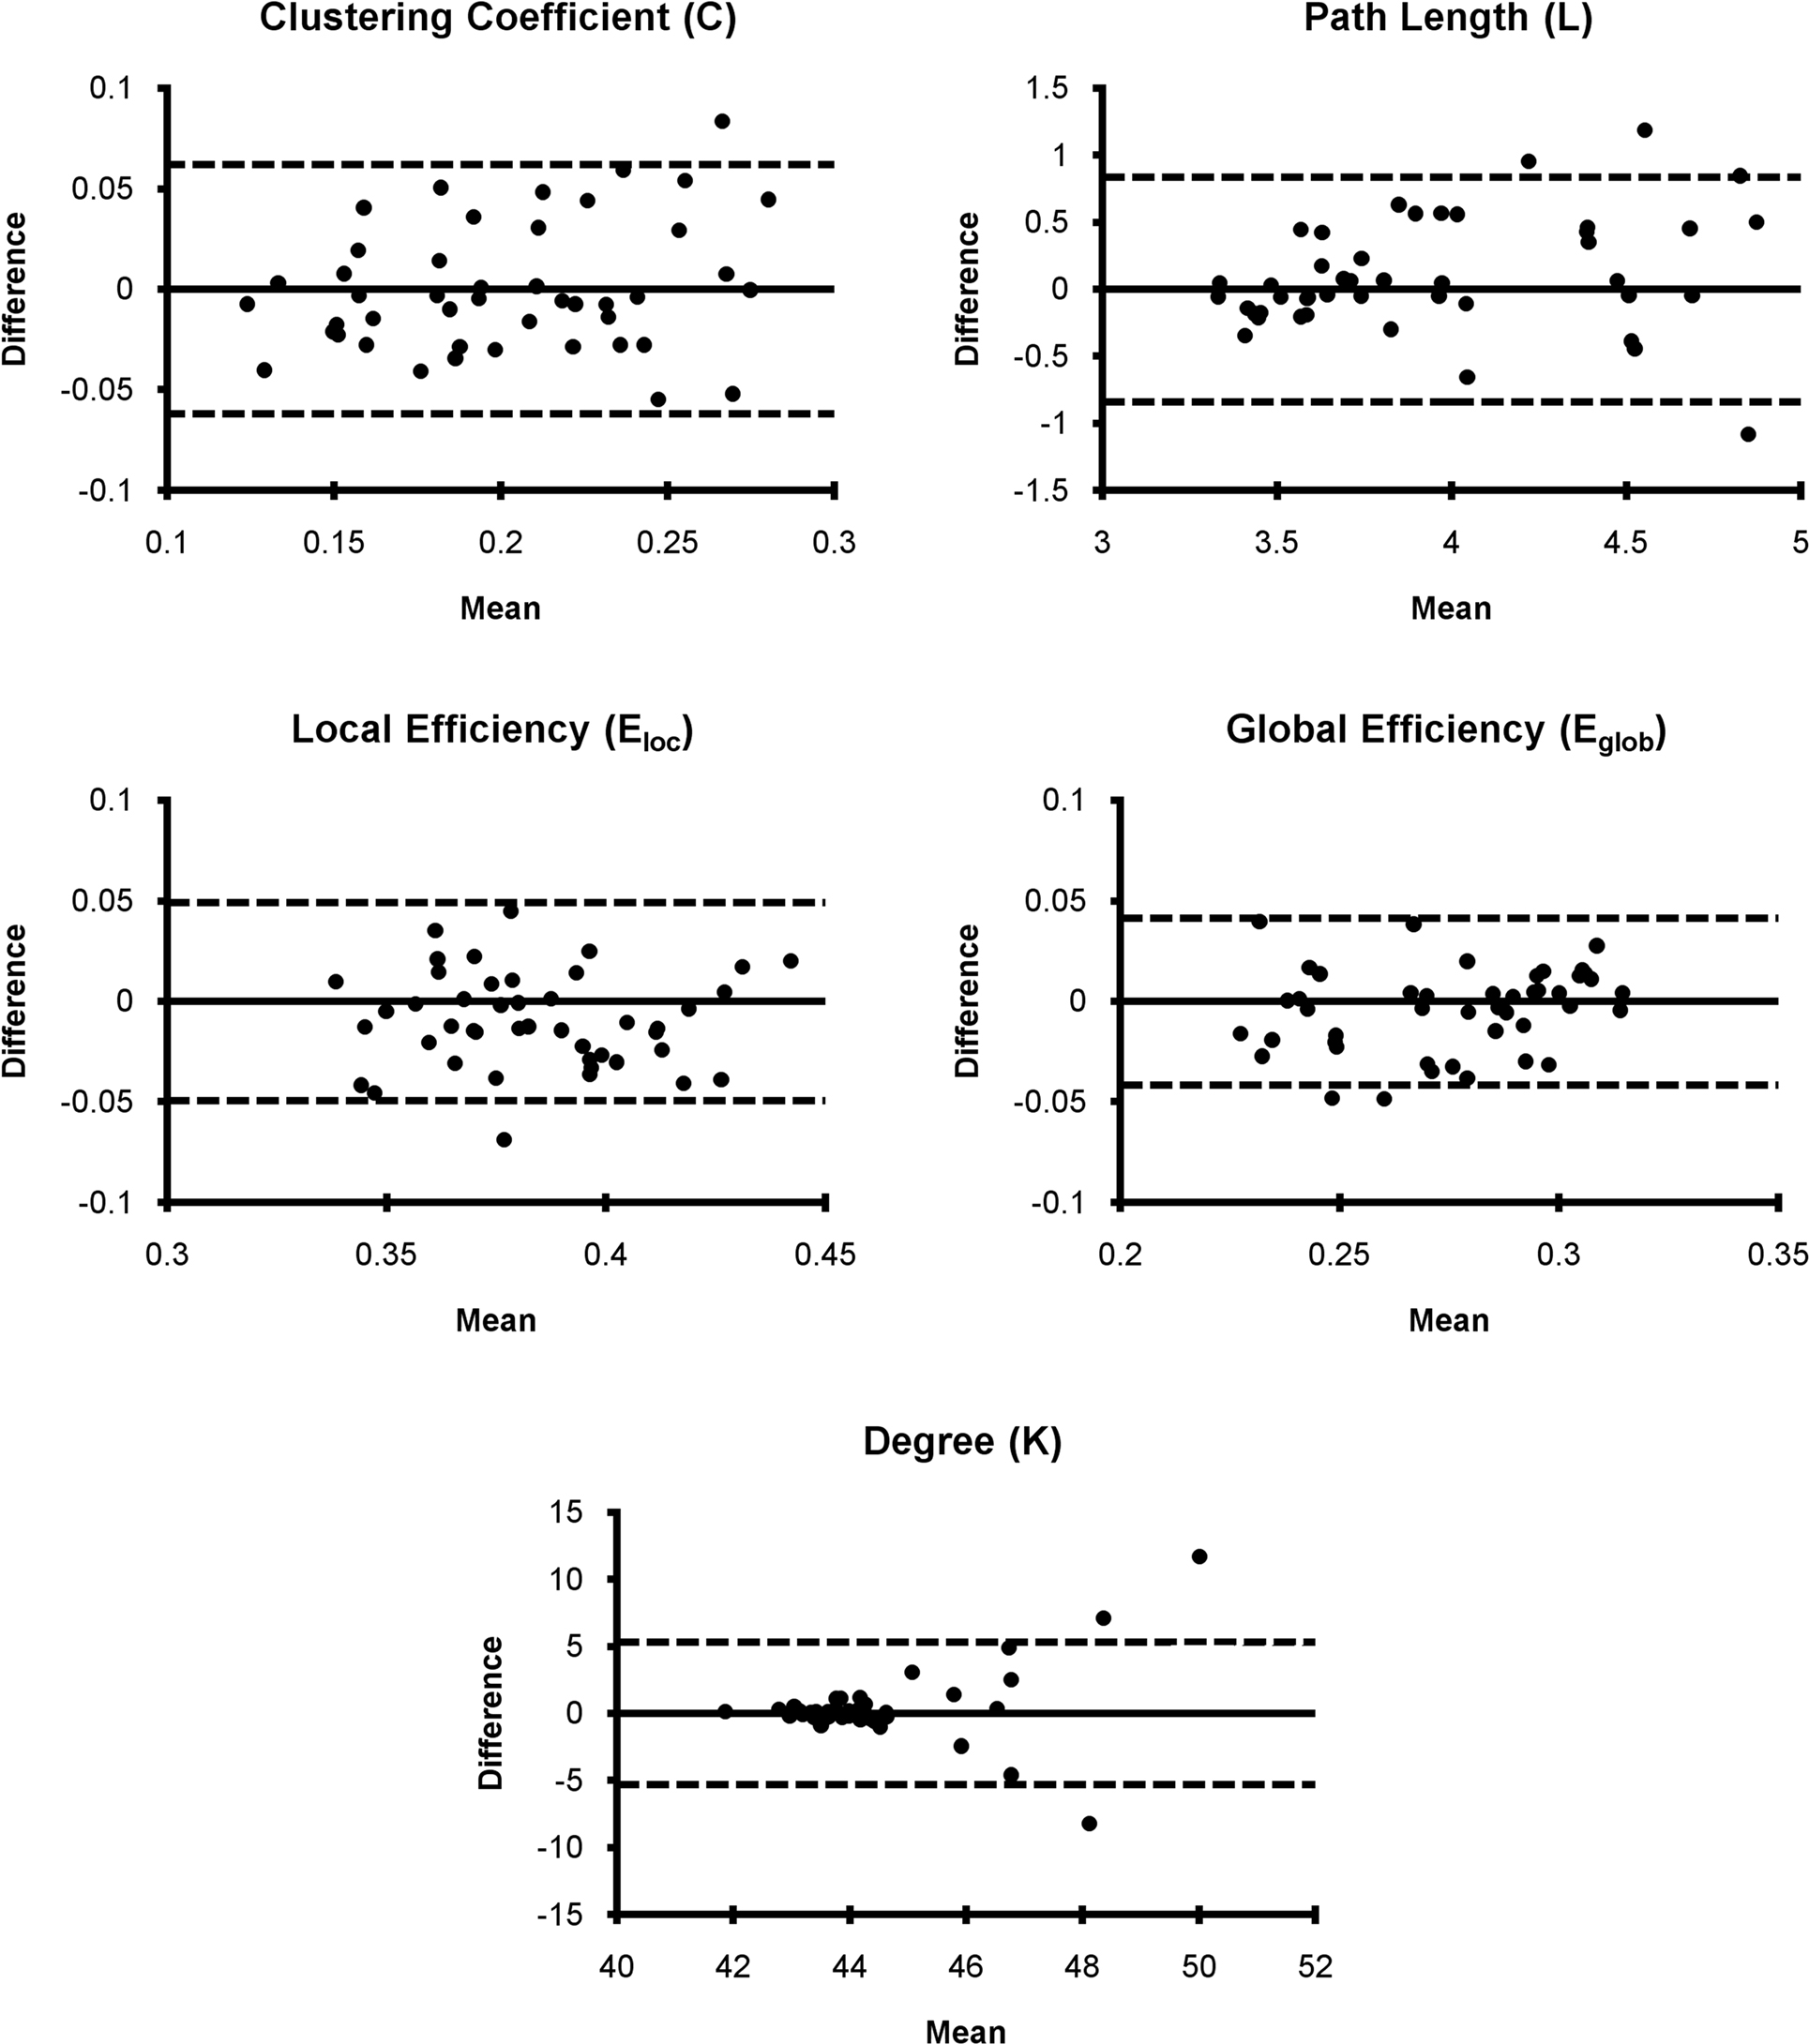
Figure 3. Bland–Altman plots for network metrics. Network metric differences for each subject generally fell within the repeatability coefficient limit (dashed line) suggesting that mean network metrics are generally repeatable.
Effect of Threshold on Reproducibility
The in-depth evaluation of reproducibility was limited to a single network threshold. However, the results presented above generally hold regardless of the chosen threshold. Figure 4 shows reproducibility across thresholds (S). These data demonstrate that the reproduciblity of C, L, and both measures of efficiency was generally stable across different thresholds, particularly 2.0–3.5. However, there are some trends that appear at the extremes with L and global efficiency exhibiting poor reproducibility at the most stringent threshold and local efficiency having poor reproducibility at the most lenient threshold. The only metric that exhibited considerable threshold effects was degree. Reproducibility was high at S = 2.0. At S = 2.5 reproducibility dropped precipitously but increased at successively higher thresholds. The changes in reproducibility for K may be related to the change in network size. As seen in Figure 5, the consistency of high degree nodes (top 25%) decreases at higher thresholds. At lower thresholds there is greater consistency of high degree nodes across the brain, but as the threshold becomes more stringent, only the cores of the network remain connected. The effects of network topology is further evaluated in the voxel-wise analyses below.
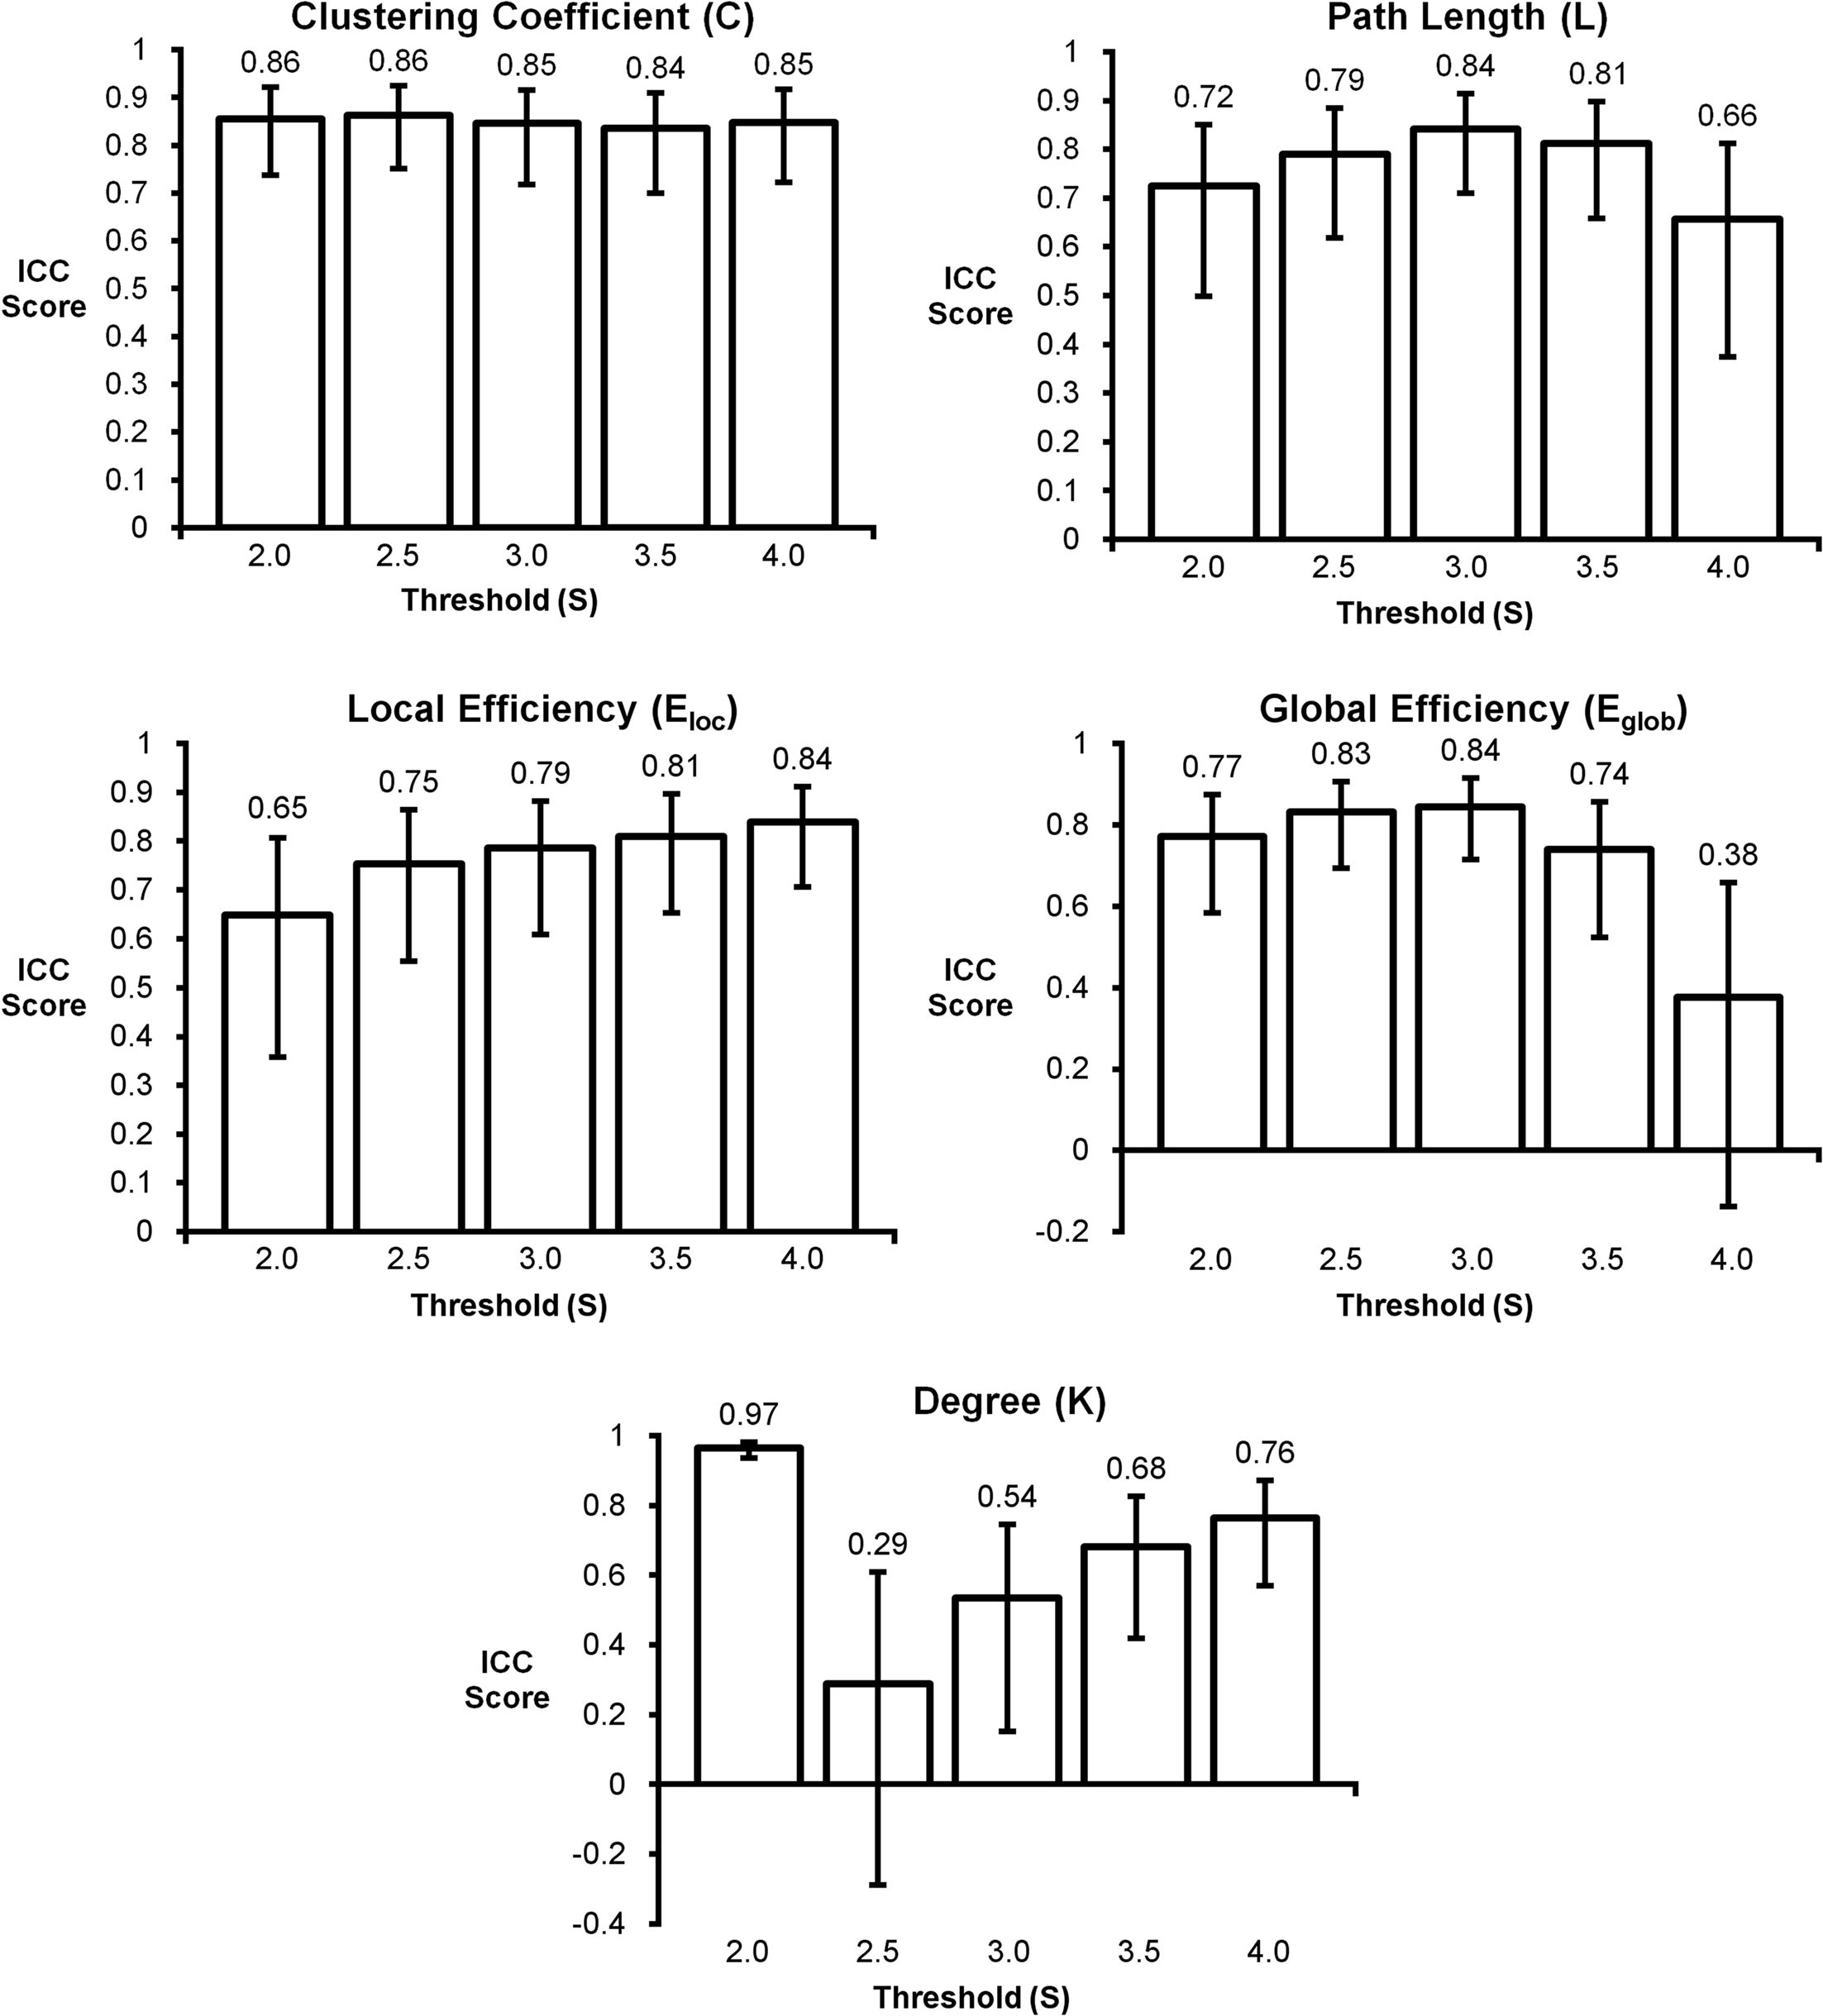
Figure 4. Intraclass correlation coefficient plots for graph metrics across different thresholds. Clustering coefficient had the most consistent reproducibility across thresholds, while degree appears to change the most as the threshold changes. Reproducibility across thresholds S = 2.5–3.5 appears to be consistent for most graph metrics.
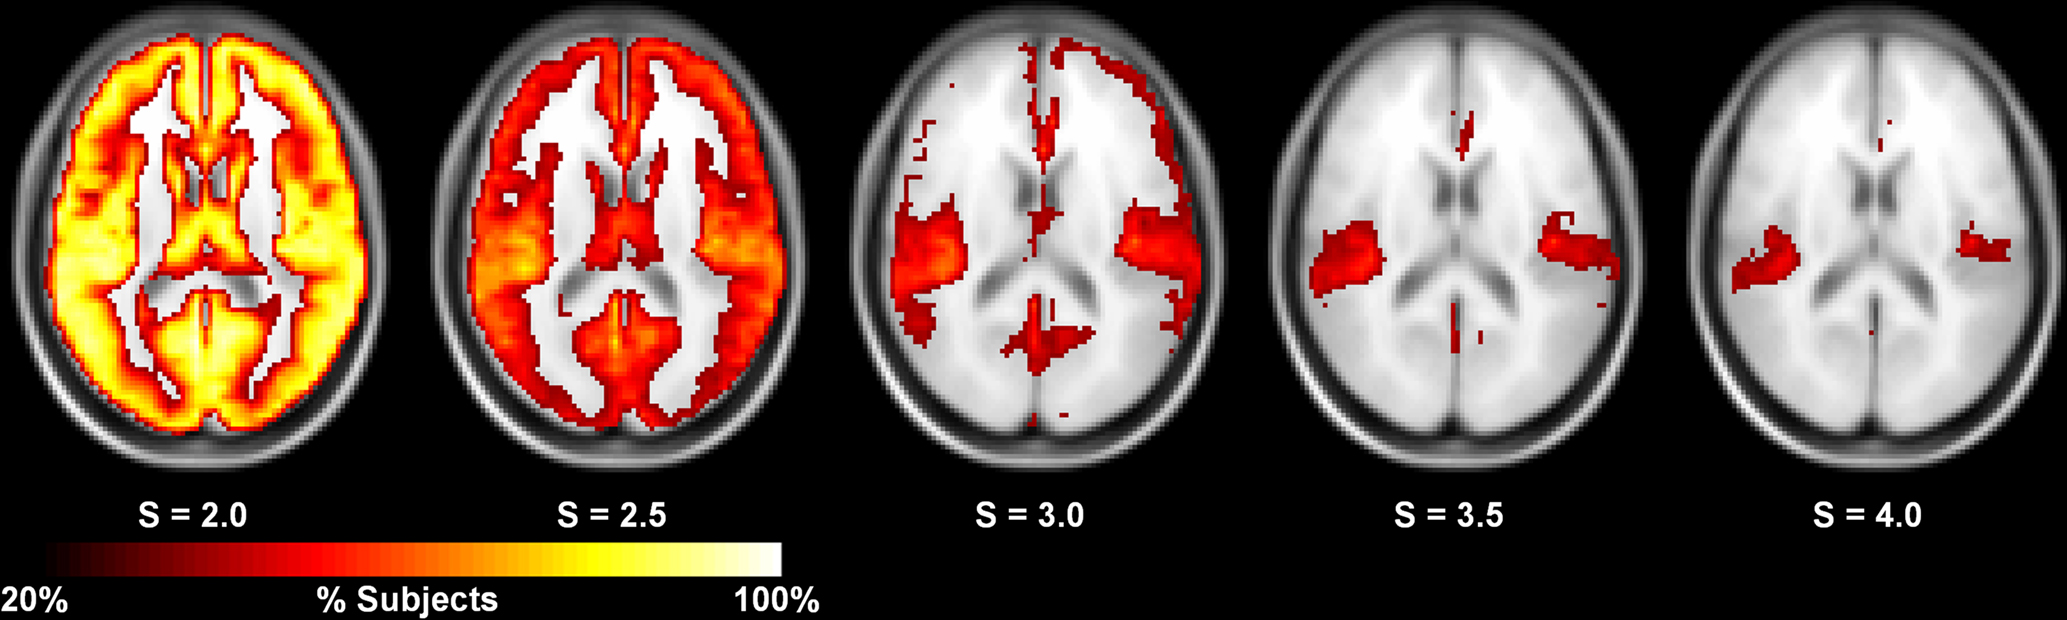
Figure 5. Consistency of high degree nodes (top 25%) across subjects at different thresholds. At S = 2.0, the consistency of high degree nodes is very high across the entire brain. At higher thresholds, this consistency decreases with the high degree cores remaining at the most stringent thresholds (S = 3.5–4.0).
Voxel-Wise Network Metric Reproducibility
Intraclass correlation coefficient scores represent reproducibility for mean measurements, but do not convey information about reproducibility of network metrics in various brain regions. Thus, ICC(1) statistics were evaluated on a voxel-wise basis to gain a better perspective of reproducibility in brain space. For reference, the spatial distribution of reproducibility was compared to the spatial locations of the most connected brain regions (hubs). Population-based hub maps were generated using a degree threshold chosen to classify the top 25% of nodes as high degree and the bottom 75% as low degree. Across all subjects, this threshold corresponds to K > 48 for the proportion of high degree nodes (25.1% ± 0.03 SD). As seen in Figure 6, the degree maps across runs for a representative subject show that high degree nodes appear to have high spatial reproducibility while low degree nodes show greater spatial variability.
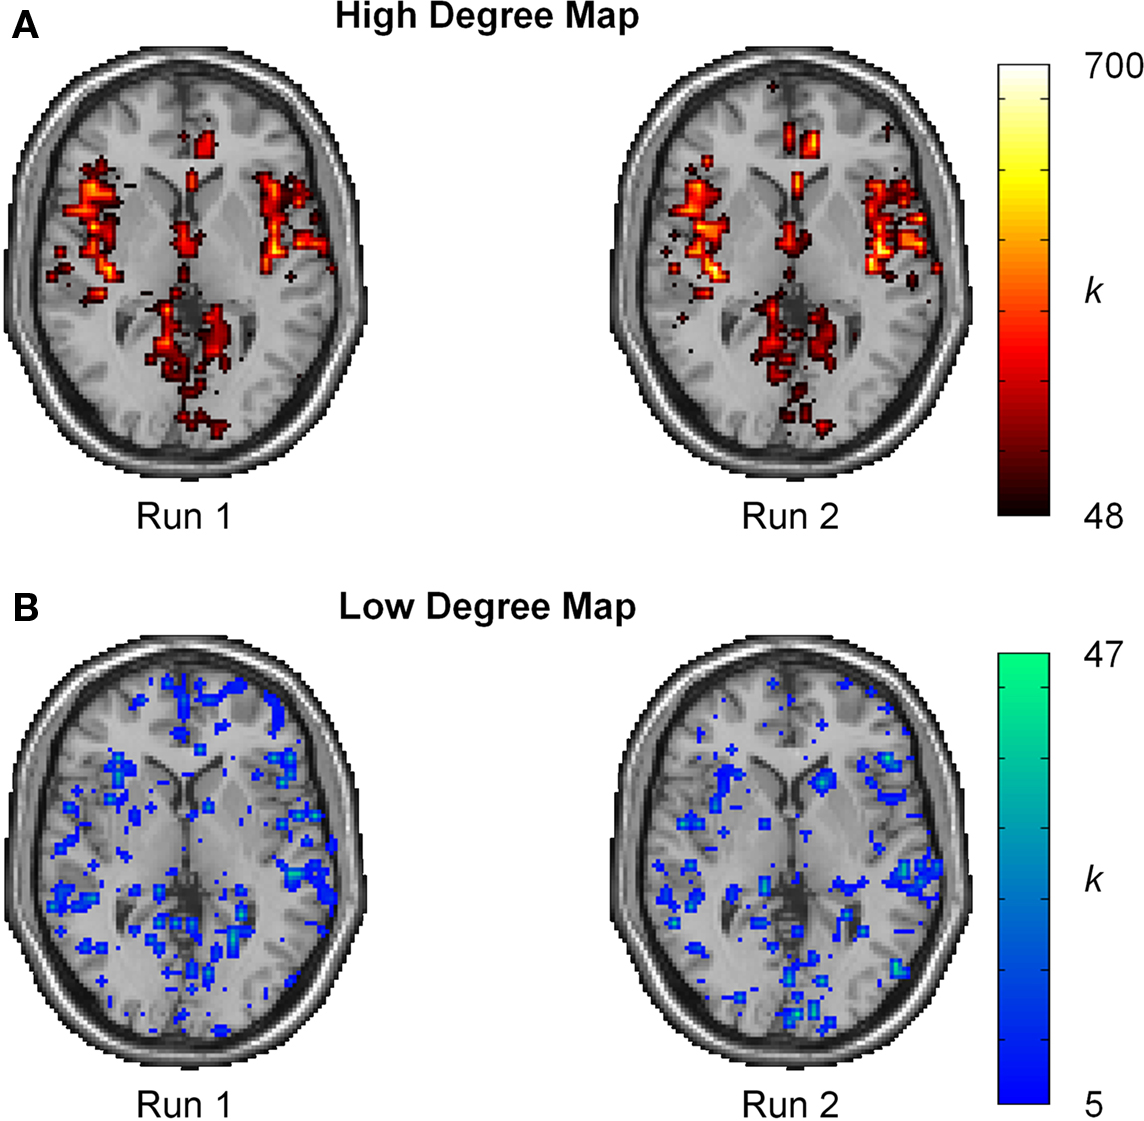
Figure 6.Degree maps for single subject. (A) Spatial localization of high degree nodes (K ≥ 48) appears to be highly reproducible. (B) Spatial localization for low degree nodes (K < 48) shows high spatial variation. The high variability and large proportion of low degree nodes results in a low ICC score.
The population-based hub map (Figure 7A) was derived from overlap maps of highest degree nodes (top 25% in orange and yellow) and lowest degree nodes (bottom 75% in blue and green). In the generated hub map, brighter areas denote higher consistency of high degree or low degree nodes across subjects. When ICC(1) reproducibility was calculated, path length and global efficiency were found to be uniform across the brain (Figures 7C,E). In contrast, higher ICC scores co-localized to the same regions containing high degree nodes in the hub map for clustering coefficient, local efficiency, and degree (Figures 7B,D,F). When the data was smoothed, the ICC scores increased for all graph metrics. Path length and global efficiency were still uniform across the brain, while the remaining graph metrics became more uniform such that reproducibility was no longer restricted to high degree nodes.
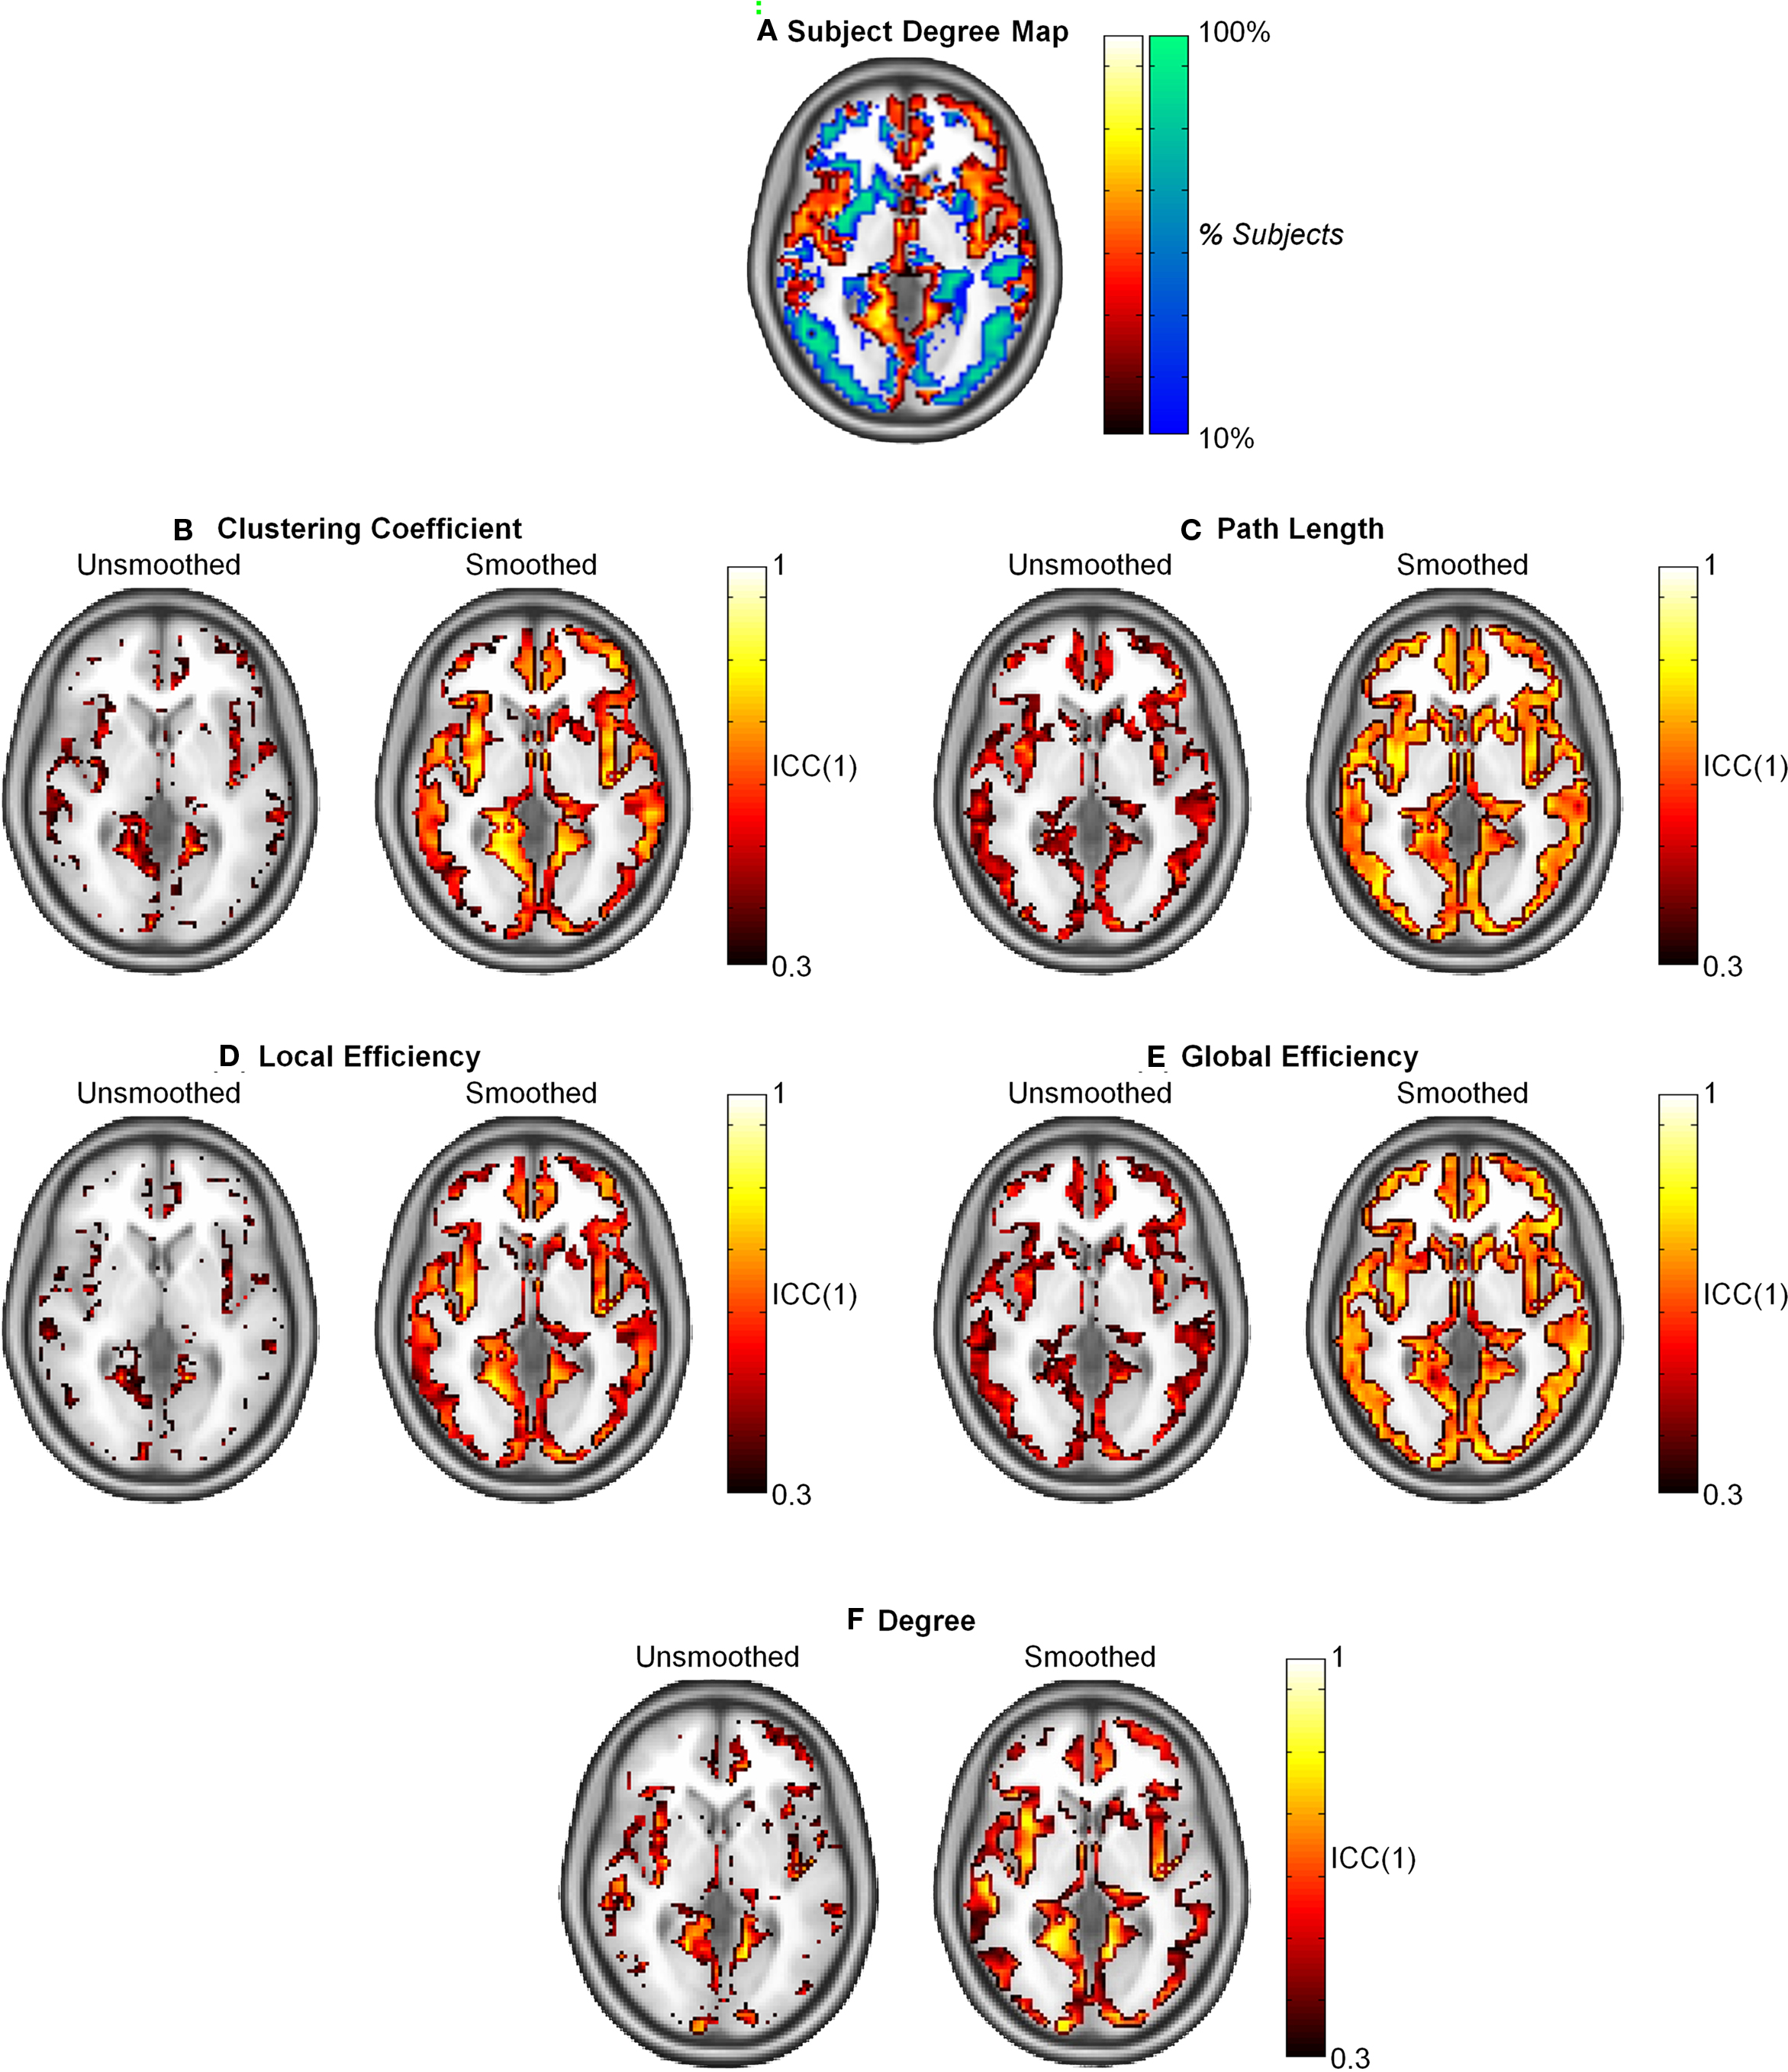
Figure 7. Intraclass correlation coefficient (1) maps of reproducibility across the brain for smoothed and unsmoothed data. (A) The subject degree map reflects the consistency across subjects of the highest degree nodes (top 25% in orange and yellow) and lowest degree nodes (bottom 75% in blue and green) across subjects. Reproducibility was relatively uniform across the brain for L and Eglob (C,E). Comparing the subject map to the ICC(1) maps shows that reproducibility was only high in for C, Eloc, and K in regions that consistently exhibited hubs across the study population (B,D,F). In all cases, smoothing resulted in higher and more uniform reproducibility.
Discussion
Mean Network Metric Reproducibility
Although network reproducibility has been demonstrated for MEG (Deuker et al., 2009) and DTI tractography (Vaessen et al., 2010), there are no known papers to date on reproducibility in fMRI brain networks. This is a critical issue given the rapid growth in network science studies using fMRI data. The current study demonstrated high reproducibility, as determined using ICCs, for mean clustering coefficient, path length, global efficiency, and local efficiency. In fact, the data presented in Figure 2 shows that almost perfect agreement was achieved for clustering coefficient and global efficiency, and strong agreement was achieved for path length and local efficiency. These values are indicative of high reproducibility. The above metrics were also found to fall within the RC limits of their respective BA plots as shown in Figure 3. Clustering coefficient and local efficiency had only 1 of 45 subjects outside of the repeatability coefficient. Path length and global efficiency has 2 and 3 subjects outside the repeatability coefficient, respectively. Again, these analyses indicate that these network metrics are highly repeatable and individual subjects should be expected to have similar metrics across repeated measurements of the same network (at least within the same MRI session). In contrast, average degree only had fair agreement based on the ICC score but did fall within the RC limits based on Bland–Altman analysis.
While the exact cause of the poor reproducibility seen in degree remains unknown at this time, it is of particular importance because degree is one of the most commonly used centrality metrics to identify hub structure, assortativity (Newman, 2003; Small et al., 2008), and hierarchy (Ravasz and Barabási, 2003; Trusina et al., 2004) within in a network. The degree distribution seen in the brain is said to follow a power law or an exponentially truncated power law, where a large proportion of nodes are low degree and a small proportion are high degree (Eguíluz et al., 2005; Achard et al., 2006; van den Heuvel et al., 2008; Hayasaka and Laurienti, 2010). The mean of such a distribution is skewed by the high degree nodes, thus mean degree does not adequately represent the central tendency of the distribution. Another characteristic of these types of distributions is a large variance due to an extreme range of values, which can vary over several orders of magnitude. Both of these issues create problems for the BA plot and ICC analyses, which assume a normal distribution for evaluated metrics. Although degree appears to be repeatable as assessed by the BA analyses, the data is heteroscedastic as the variance increases with larger means. This may also explain the low reproducibility in the ICC score as a result of high within subject variance. Because degree does not follow a normal distribution, the use of mean degree to assess reproducibility is likely inadequate. Future studies may consider assessing reproducibility using median degree as it would be less susceptible to the influence of high degree hubs that exist in the tails of the distribution. Unfortunately, the commonly used analyses (ICC and Bland–Altman) are highly dependent on the standard deviation, and the use of median values would not alleviate broad range of variance in the degree of these networks.
Voxel-Wise Network Reproducibility
Deuker et al. (2009) found that reproducibility of MEG-derived networks can vary spatially across the brain even when global metrics are highly reproducible. They found a subset of nodes with higher reproducibility and the spatial distribution of these nodes changed based on experimental condition or greater practice on the same experimental task (Deuker et al., 2009). In the current work, spatial variability of nodal metric reproducibility was also observed across the brain. When compared to the population hub map, clustering coefficient, local efficiency, and degree were more highly reproducible in the hubs of the network. In contrast, reproducibility of path length and global efficiency was more uniform across the brain.
The difference in reproducibility across metrics seems to be related to how each metric is calculated. Clustering coefficient, local efficiency and degree are derived from connections of a node to its immediate neighbors while path length and global efficiency take into account the relationship of a node to the entire network. As a result, clustering coefficient, local efficiency, and degree are sensitive to changes in node degree. For instance, adding or removing a connection to a node of degree 2 represents a 50% change in degree, which can have a dramatic effect on the clustering and local efficiency of that node. The same change applied to a node of degree 100 will not have as large an effect. In contrast, since path length and global efficiency take the entire network into account, small changes to a node of high or low degree will not affect the measurement significantly. Small alterations in node degree may represent real changes in the network from run to run or it could represent noise in the fMRI time series. Either way, low degree nodes appear to exhibit greater susceptibility to these minor alterations in connectivity than the high degree hubs.
Another possibility for variable reproducibility is spatial uncertainty in voxels, which leads to voxels not matching exactly across runs. Regions with clusters of high degree nodes will not be as susceptible to spatial variation because they are close to other high degree nodes. As a result, spatial co-localization of high degree nodes allows for a certain tolerance of spatial variation, which lends to elevated ICC scores in hubs of the network even without perfect spatial registration between runs.
Graph Metric Reproducibility at Different Thresholds
As mentioned earlier, high degree nodes were found to be more reproducible than low degree nodes. At S = 2.0, most node connections survive the threshold, resulting in very dense networks. As seen in Figure 5, at S = 2.0, there is a high consistency of the top 25% of nodes for degree across subjects, which likely explains the high ICC score for degree at S = 2.0. At S = 2.5, although the networks are about the same size, the consistency of high degree nodes decreases (i.e., fewer connections survive the threshold). At higher thresholds, and most pronounced at S = 3.5–4.0, there is a noticeable decrease in the size of the large component of the network. At higher threshold levels, the large component reflects the high degree cores of the network, which are highly reproducible at lower thresholds. The higher thresholds represent the cores of these networks, thus ICC scores increase for graph metrics that are degree dependent (i.e., Eloc and K). In contrast, path length and global efficiency are dependent on the global topology of the network. As the size of the large component changes, reproducibility appears to be affected by these changes with reproducibility decreasing as the network becomes more fragmented. However, it appears that only the most stringent thresholds (S = 3.5–4.0) significantly affect reproducibility. For this study, S = 2.5 was used for the primary analyses, but strong reproducibility was also seen at other thresholds except the most liberal (S = 2.0) and most stringent (S = 4.0). At S = 2.0, although reproducibility is high for metrics like degree, the threshold is far too liberal and results in dense graphs that may not reflect the true network topology. At S = 4.0, the thresholds appears to be too stringent as the network becomes more fragmented.
Smoothed vs. Unsmoothed Data
When Gaussian smoothing is applied to the data it increases the ICC scores for all metrics. In addition, node degree has less of an effect on reproducibility. This occurs because a Gaussian smoothing kernel reflects a weighted average of the voxels in the kernel. In effect, the ICC calculation no longer represents reproducibility at a particular voxel, but that of multiple voxels. As a result, this measure is more akin to ICC than ICC(1), and may not characterize the true reproducibility of a particular voxel.
Limitations and Future Directions
One caveat of this study is that it was done in healthy older adults, thus there is a there is a possibility that there are network changes with age. A study on modular organization in the brain found differences in the number of modules and topological organization between older and younger adults (Meunier et al., 2009). For that reason, further study in younger populations is warranted.
Another area that requires further exploration is the localization of reproducibility in the brain. In this study, reproducibility was found to be higher in the hubs of the network. However, in order to confirm this finding, reproducibility needs to be conducted under different experimental task conditions to see if reproducibility co-localizes to the hubs in the network, wherever they may lie in the brain. The study here was conducted during an executive task, which may account for the higher reproducibility. Deuker et al. reported similarly high findings in their MEG study and suggest that resting state data is less reliable due to changes in resting state patterns.
Conclusion
This study evaluated the reproducibility of graph metrics in fMRI brain networks. Comparisons of mean graph metrics were made using ICC scores and BA plots. Mean network metrics were found to be highly reproducible in all graph metrics except for degree while all metrics were highly repeatable according to BA plots. In our opinion, with the exception of degree, the mean value of the remaining metrics is suitable for use in future studies because their distributions are closer to a normal distribution and global changes in the mean value reasonably reflect the state or changes in the network.
When looking at voxel-wise reproducibility, ICC(1) scores were higher in hubs of the brain for clustering coefficient, local efficiency and degree. Reproducibility was more uniform across the brain for path length and global efficiency. It is unclear why reproducibility is lower in low degree nodes, but it is suspected that slight degree differences between runs may have a large impact on low degree nodes compared to high degree nodes. In all cases Gaussian smoothing will increase reproducibility, but reproducibility in smoothed images may not reflect the true reproducibility at a particular voxel.
Conflict of Interest Statement
The authors declare that the research was conducted in the absence of any commercial or financial relationships that could be construed as a potential conflict of interest.
Acknowledgments
This study was sponsored by the Translational Scholar Award from the Wake Forest University Translational Science Institute, RR07122 from the Wake Forest University General Clinical Research Center, the Roena Kulynych Memory and Cognitive Research Center, AG026353 to Paul J. Laurienti and AG030838 to Jennifer L. Mozolic from the National Institute of Aging, NS042568 to Paul J. Laurienti, and NS070917 to Satoru Hayasaka from the National Institute of Neurological Disorders and Stroke, and AA017710 to James Daunais from the National Institute on Alcohol Abuse and Alcoholism.
References
Achard, S., Salvador, R., Whitcher, B., Suckling, J., and Bullmore, E. (2006). A resilient, low-frequency, small-world human brain functional network with highly connected association cortical hubs. J. Neurosci. 26, 63–72.
Bassett, D. S., Bullmore, E., Verchinski, B. A., Mattay, V. S., Weinberger, D. R., and Meyer-Lindenberg, A. (2008). Hierarchical organization of human cortical networks in health and schizophrenia. J. Neurosci. 28, 9239–9248.
Bassett, D. S., and Bullmore, E. T. (2009). Human brain networks in health and disease. Curr. Opin. Neurol. 22, 340–347.
Bassett, D. S., Meyer-Lindenberg, A., Achard, S., Duke, T., and Bullmore, E. (2006). Adaptive reconfiguration of fractal small-world human brain functional networks. Proc. Natl. Acad. Sci. U.S.A. 103, 19518–19523.
Bland, J. M., and Altman, D. G. (1999). Measuring agreement in method comparison studies. Stat. Methods Med. Res. 8, 135–160.
Bullmore, E., and Sporns, O. (2009). Complex brain networks: graph theoretical analysis of structural and functional systems. Nat. Rev. Neurosci. 10, 186–198.
Burock, M. A., Buckner, R. L., Woldorff, M. G., Rosen, B. R., and Dale, A. M. (1998). Randomized event-related experimental designs allow for extremely rapid presentation rates using functional MRI. Neuroreport 9, 3735–3739.
Deuker, L., Bullmore, E. T., Smith, M., Christensen, S., Nathan, P. J., Rockstroh, B., and Bassett, D. S. (2009). Reproducibility of graph metrics of human brain functional networks. NeuroImage 47, 1460–1468.
Eguíluz, V. M., Chialvo, D. R., Cecchi, G. A., Baliki, M., and Apkarian, A. V. (2005). Scale-free brain functional networks. Phys. Rev. Lett. 94, 018102.
Eriksen, B. A., and Eriksen, C. W. (1974). Effects of noise letters upon the identification of a target letter in a nonsearch task. Percept. Psychophys. 16, 143–149.
Ferrarini, L., Veer, I. M., Baerends, E., Tol, M-J. V., Renken, R. J., Wee, N. J. A., Veltman, D. J., Aleman, A., Zitman, F. G., Penninx, B. W. J. H., Buchem, M. A., Reiber, J. H. C., Rombouts, S. A. R. B., and Milles, J. (2009). Hierarchical functional modularity in the resting-state human brain. Hum. Brain Mapp. 30, 2220–2231.
Fox, M. D., Snyder, A. Z., Vincent, J. L., Corbetta, M., Van Essen, D. C., and Raichle, M. E. (2005). The human brain is intrinsically organized into dynamic, anticorrelated functional networks. Proc. Natl. Acad. Sci. U.S.A. 102, 9673–9678.
Gonzalez, R., and Griffin, D. (1999). The correlational analysis of dyad-level data in the distinguishable case. Pers. Relatsh. 6, 449–469.
Hayasaka, S., and Laurienti, P. J. (2010). Comparison of characteristics between region-and voxel-based network analyses in resting-state fMRI data. Neuroimage 50, 499–508.
McGraw, K. O., and Wong, S. P. (1996). Forming inferences about some intraclass correlation coefficients. Psychol. Methods 1, 30–46.
Meunier, D., Achard, S., Morcom, A., and Bullmore, E. (2009). Age-related changes in modular organization of human brain functional networks. Neuroimage 44, 715–723.
Micheloyannis, S., Pachou, E., Stam, C. J., Breakspear, M., Bitsios, P., Vourkas, M., Erimaki, S., and Zervakis, M. (2006). Small-world networks and disturbed functional connectivity in schizophrenia. Schizophr. Res. 87, 60–66.
Montgomery, A., Graham, A., Evans, P., and Fahey, T. (2002). Inter-rater agreement in the scoring of abstracts submitted to a primary care research conference. BMC Health Serv. Res. 2, 8.
Mozolic, J. L., Hayasaka, S., and Laurienti, P. J. (2010). A cognitive training intervention increases resting cerebral blood flow in healthy older adults. Front. Hum. Neurosci. 4:16. doi: 10.3389/neuro.09.016.2010
Mozolic, J. L., Long, A. B., Morgan, A. R., Rawley-Payne, M., and Laurienti, P. J. (2009). A cognitive training intervention improves modality-specific attention in a randomized controlled trial of healthy older adults. Neurobiol. Aging. doi: 10.1016/j.neurobiolaging.2009.04.013. [Epub ahead of print].
Ravasz, E., and Barabási, A.-L. (2003). Hierarchical organization in complex networks. Phys. Rev. E 67, 026112.
Rubinov, M., and Sporns, O. (2010). Complex network measures of brain connectivity: uses and interpretations. Neuroimage 52, 1059–1069.
Small, M., Xu, X., Zhou, J., Zhang, J., Sun, J., and Lu, J-A. (2008). Scale-free networks which are highly assortative but not small world. Phys. Rev. E. 77, 066112.
Supekar, K., Menon, V., Rubin, D., Musen, M., and Greicius, M. D. (2008). Network analysis of intrinsic functional brain connectivity in Alzheimer’s disease. PLoS Comput. Biol. 4, e1000100. doi: 10.1371/journal.pcbi.1000100
Trusina, A., Maslov, S., Minnhagen, P., and Sneppen, K. (2004). Hierarchy measures in complex networks. Phys. Rev. Lett. 92, 178702.
Vaessen, M. J., Hofman, P. A. M., Tijssen, H. N., Aldenkamp, A. P., Jansen, J. F. A., and Backes, W. H. (2010). The effect and reproducibility of different clinical DTI gradient sets on small world brain connectivity measures. Neuroimage 51, 1106–1116.
van den Heuvel, M. P., Stam, C. J., Boersma, M., and Hulshoff Pol, H. E. (2008). Small-world and scale-free organization of voxel-based resting-state functional connectivity in the human brain. Neuroimage 43, 528–539.
Wang, J., Wang, L., Zang, Y., Yang, H., Tang, H., Gong, Q., Chen, Z., Zhu, C., and He, Y. (2009). Parcellation-dependent small-world brain functional networks: a resting-state fMRI study. Hum. Brain Mapp. 30, 1511–1523.
Keywords: network, graph theory, functional MRI, resting-state, reproducibility, intraclass correlation coefficient, Bland–Altman plot
Citation: Telesford QK, Morgan AR, Hayasaka S, Simpson SL, Barret W, Kraft RA, Mozolic JL and Laurienti PJ (2010) Reproducibility of graph metrics in fMRI networks. Front. Neuroinform. 4:117. doi: 10.3389/fninf.2010.00117
Received: 02 June 2010;
Accepted: 24 November 2010;
Published online: 08 December 2010.
Edited by:
Jan G. Bjaalie, University of Oslo, NorwayReviewed by:
Arvid Lundervold, University of Bergen, NorwayEdward T. Bullmore, University of Cambridge, UK
Copyright: © 2010 Telesford, Morgan, Hayasaka, Simpson, Barret, Kraft, Mozolic and Laurienti. This is an open-access article subject to an exclusive license agreement between the authors and the Frontiers Research Foundation, which permits unrestricted use, distribution, and reproduction in any medium, provided the original authors and source are credited.
*Correspondence: Qawi K. Telesford, Department of Biomedical Engineering, Wake Forest University Health Sciences, Medical Center Boulevard, Winston-Salem, NC 27157, USA. e-mail: qtelesfo@wfubmc.edu