Hierarchical information-based clustering for connectivity-based cortex parcellation
- 1 Cortical Networks Group, Max Planck Institute for Neurological Research, Cologne, Germany
- 2 MRC/UCT Medical Imaging Research Unit, Division of Biomedical Engineering, University of Cape Town, Cape Town, South Africa
- 3 Institute for Theoretical Physics, University of Cologne, Cologne, Germany
- 4 Institute for Computer Science, University of Leipzig, Leipzig, Germany
One of the most promising avenues for compiling connectivity data originates from the notion that individual brain regions maintain individual connectivity profiles; the functional repertoire of a cortical area (“the functional fingerprint”) is closely related to its anatomical connections (“the connectional fingerprint”) and, hence, a segregated cortical area may be characterized by a highly coherent connectivity pattern. Diffusion tractography can be used to identify borders between such cortical areas. Each cortical area is defined based upon a unique probabilistic tractogram and such a tractogram is representative of a group of tractograms, thereby forming the cortical area. The underlying methodology is called connectivity-based cortex parcellation and requires clustering or grouping of similar diffusion tractograms. Despite the relative success of this technique in producing anatomically sensible results, existing clustering techniques in the context of connectivity-based parcellation typically depend on several non-trivial assumptions. In this paper, we embody an unsupervised hierarchical information-based framework to clustering probabilistic tractograms that avoids many drawbacks offered by previous methods. Cortex parcellation of the inferior frontal gyrus together with the precentral gyrus demonstrates a proof of concept of the proposed method: The automatic parcellation reveals cortical subunits consistent with cytoarchitectonic maps and previous studies including connectivity-based parcellation. Further insight into the hierarchically modular architecture of cortical subunits is given by revealing coarser cortical structures that differentiate between primary as well as premotoric areas and those associated with pre-frontal areas.
Introduction
Subdividing the cerebral cortex into structurally and functionally distinct areas, known as cortex parcellation, arises from the notion that cortical structure reflects function. While many factors such as cytoarchitecture, myeloarchitecture, and receptor architectonics reflect the functionality of a cortical area, evidence suggests a close relationship between anatomical connectivity and functional localization within the cortex (Passingham et al., 2002). Moreover, anatomical connectivity is thought to constrain functionality and thus offers a suitable measure for differentiating between functionality of different cortical subunits. Conclusively, it has been shown at the example of the mammalian brain that structural elements of a distinct cortical region share homogeneous connectivity patterns (Hilgetag and Grant, 2000; Markov et al., 2010), which are dissimilar to those of other cortical regions and therefore determine, to some extent, the functional repertoire of that region (Stephan et al., 2000). These findings provide the basic rationale behind a methodology called connectivity-based parcellation: Structural elements with similar anatomical connectivity are grouped or clustered with the aim to segregate a cortical region of interest into functionally distinct subunits – a recent review on this topic is provided by Knösche and Tittgemeyer (2011).
In the past, information pertaining to anatomical connectivity has been mostly revealed from post-mortem and animal studies. With the advent of diffusion MRI (dMRI) and diffusion tractography, in vivo and non-invasive characterization of long-range connectivity patterns became feasible. This ultimately opened the possibility to probe the white matter structure in the human brain (Johansen-Berg and Rushworth, 2009): A convenient way to characterize anatomical connectivity of small brain areas (usually single MRI voxels) to the entire brain is the computation of probabilistic tractograms, which can be seen as an approximation (with some reservation, see Jones, 2010) to the connectivity pattern representing this brain area.
Note that, for the purpose of cortical area parcellation, probabilistic tractography does not necessarily have to accurately reflect the connectivity pattern of an individual area. The sensitivity of probabilistic tractography to differences in connectivity of cortical areas plays a much more important role. This motivates the application of tractography for connectivity-based parcellation: When each cortical area is characterized by unique cortico-cortical connections (“connectional fingerprint”), then, any tractogram within an area should be similar.
Recently, tractography-based parcellation has been applied to a great variety of sub-cortical and cortical areas, in the macaque as well as in the human brain. These areas include the thalamus (Behrens et al., 2003; Johansen-Berg et al., 2005; Devlin et al., 2006; O’Muircheartaigh et al., 2011), basal ganglia (Lehericy et al., 2004; Sillery et al., 2005; Draganski et al., 2008), amygdala (Bach et al., 2011), midbrain (Menke et al., 2010) and cortical regions, including inferior frontal cortex (Anwander et al., 2007; Klein et al., 2007; Ford et al., 2010), premotor cortex (Tomassini et al., 2007; Schubotz et al., 2010), cingulate cortex (Beckmann et al., 2009), medial frontal (Johansen-Berg et al., 2005; Crippa et al., 2011) and insular cortex (Nanetti et al., 2009) as well as the postcentral gyrus (Roca et al., 2010).
The aforementioned attempts at clustering probabilistic tractograms, however, impose several non-trivial assumptions about the underlying structure of the data. Particularly, it is often difficult to justify the choice of a particular number of clusters a priori. At best, the choice of the number of cortical subunits has been subject to forming representative, meaningful cortical regions while still maintaining relative consistency across subjects. To date, two different types of clustering algorithms have been used to perform tractography-based parcellation:
(1) Similarity-based clustering methods, such as K-means clustering (Anwander et al., 2007; Klein et al., 2007; Nanetti et al., 2009) or spectral reordering (Johansen-Berg et al., 2004), employ correlation as a predefined similarity measure and thus explicitly rely on the strength of linear dependency between tractograms in order to form clusters. It is debatable, however, whether similarity between tractograms should be defined by their linear dependency to one another.
(2) Dirichlet process mixture models (Jbabdi et al., 2009) embody a Bayesian non-parametric model for clustering of probabilistic tractograms. Such stochastic processes typically assume data to be generated from a mixture of Gaussian distributions. In an application to multiple-subject parcellation of the thalamus, Jbabdi et al. (2009) represented tractograms as vectorial data and grouped them based upon a Gaussian likelihood function. Whether or not individual tractograms can be interpreted as vectors and subsequently clustered using Gaussian likelihood functions is undetermined.
A further issue concerning previous clustering attempts is that the partitioning of data into clusters that form hard borders between cortical subunits remains unjustified. The existence of a transition in cortical architecture, no matter how robust or consistent, does not necessarily signify a boundary between distinct cortical areas. An architectonic transition may instead reflect gradients or trends across the full extent of a given area. In fact it is well-known that such directional changes of cytoarchitectonic, receptor architectonic, or myeloarchitectonic properties of adjacent cortical fields can occur (Sanides, 1962; Lewis and Van Essen, 2000). A broad transition region may reflect biologically genuine gradations, such that neurons within the transition region have anatomical and/or physiological characteristics intermediate between the neighboring subdivisions. Hence, an important issue concerning parcellation is to assess the spatial extend over which such architectonic transitions occur.
Furthermore, previous clustering attempts tend to neglect the possibility of a hierarchical architecture underlying cortical subunits. Actually, brain networks are more appropriately conceived of as forming nested modules (Bassett et al., 2010; Bassett and Gazzaniga, 2011), each with a characteristic connectivity pattern – i.e., modular hierarchies (Kaiser and Hilgetag, 2007, 2010; Kaiser, in press). The notion of a hierarchically modular organization of cortical subunits (Meunier et al., 2010) stems from the idea that the subunits themselves are nested into further modular structures at higher topological scales due to their similarity to one another with respect to anatomical connectivity.
The problem that an a priori determination of the number of clusters may not be possible clearly motivates an unsupervised clustering approach. The purpose of this study is therefore to formally adopt such an approach. Additionally, we employ an information-theoretic framework to minimize the assumptions imposed on data.
We assume for subsequent discussion that the connectivity pattern of each distinct cortical subunit retains a prototype property, referred to as exemplars in subsequent sections, such that a particular tractogram is approximately representative of the connectivity pattern of the entire cortical subunit. Further grouping of cortical subunits forms hierarchically modular structures that each contains multiple representative tractograms. Additionally, we make the prior assumption that probabilistic tractography is capable of revealing information pertaining to nested structures.
Our approach makes use of soft-constraint affinity propagation (SCAP; Leone et al., 2008) to seek exemplar tractograms that are each representative of cortical subunits. Global clusters of tractograms are formed by extracting disjoint sets of connected components each consisting of multiple exemplars. Consequently, individual global clusters are allowed to share multiple centers (i.e., exemplars) thereby allowing for the formation of irregularly shaped clusters.
The number of clusters of the global partition is determined based upon the robustness of the clustering solution against uncertainty in the data measured by clustering several bootstrap dataset samples (Fischer and Buhmann, 2003). The rationale behind this approach is to allow the uncertainty in the data to vote for the choice of exemplars and therefore the finest granularity level that gives rise to the most stable partitioning at a higher hierarchical level.
Rate distortion theory (Tishby et al., 1999) is used to stochastically map tractograms to exemplars thereby inducing a soft partition between cortical areas. A more informative nested architecture is obtained using information-theoretic agglomerative grouping (Slonim and Tishby, 1999) of cortical areas by preserving as much information as possible about the representative tractograms through the partitioning at each step of the merging sequence.
A face validation of this approach is presented using data studied in previous work, namely parcellation of the left posterior inferior pre-frontal cortex (IPC) of the human brain: Parcellation of the inferior frontal gyrus (IFG) together with the precentral gyrus (PCG) demonstrates a proof of concept of our approach. These gyri contain brain regions for which the anatomical segregation has been relatively well established (Geyer et al., 1996, 2000; Amunts et al., 2010). Both regions have been intensively studied in previous approaches to connectivity-based parcellation from our group (Anwander et al., 2007; Schubotz et al., 2010) as well as from others (Klein et al., 2007; Tomassini et al., 2007) and established reproducible results. Moreover, a modular hierarchy within the posterior IPC, conveyed through areas pointing toward primary motor, premotor, and pre-frontal brain function, is well established (Passingham, 1983; Fuster, 1997; Averbeck et al., 2009).
Materials and Methods
dMRI Data Acquisition and Preprocessing
Diffusion-weighted data and high-resolution 3-dimensional (3D) T1- and T2-weighted images were acquired on a Siemens 3T Trio scanner with an eight-channel array head coil and maximum gradient strength of 40 mT/m. The diffusion-weighted data were acquired using spin-echo echo planar imaging (EPI; TR = 12 s, TE = 100 ms, 72 axial slices, resolution 1.72 mm × 1.72 mm × 1.7 mm, no cardiac gating). A GRAPPA technique (reduction factor 2.0) was chosen as parallel imaging scheme. Diffusion weighting was isotropically distributed along 60 directions (b-value = 1000 s/mm2). Additionally, seven data sets with no diffusion weighting were acquired initially and interleaved after each block of 10 diffusion-weighted images as anatomical reference for motion correction. The high angular resolution of the diffusion weighting directions improves the robustness of the tensor estimation by increasing the signal-to-noise ratio (SNR) and reducing directional bias. To further increase SNR, scanning was repeated three times for averaging, requiring a total scan time for the dMRI protocol of approximately 45 min. dMRI data were acquired after the T2-weighted images in the same scanner reference system.
As first step in preprocessing the data, the 3D T1-weighted (MPRAGE; TR = 1300 ms, TI = 650 ms, TE = 3.97 ms, resolution 1.0 mm × 1.0 mm × 1.0 mm, flip angle 10°, 2 acquisitions) images were reoriented to the sagittal plane through the anterior and posterior commissures. Upon reorientation, the 3D T2-weighted images (RARE; TR = 2 s, TE = 355 ms, resolution 1.0 mm × 1.0 mm × 1.0 mm, flip angle 180°) were co-registered to the reoriented 3D T1-weighted images using rigid-body transformations (Jenkinson et al., 2002), implemented in FSL (http://www.fmrib.ox.ac.uk/fsl). The images without diffusion weightings were used to estimate motion correction parameters with the same registration method. The motion correction for the dMRI data was combined with the global registration to the T1 anatomy. The gradient direction for each volume was corrected using the rotation parameters. The registered images were interpolated to an isotropic voxel resolution of 1 mm and the three corresponding acquisitions were averaged. Finally, for each voxel, a diffusion tensor was fitted to the dMRI data. For presentation purposes, cortical surfaces were rendered on basis of the T1-weighted images by using Freesurfer (Dale et al., 1999).
Definition of the Region of Interest
The region of interest was taken from the same dataset (same individual) as presented by Anwander et al., 2007, see here subject I) for the IFG and by Schubotz et al., 2010, see here subject 188) for the PCG; both regions are combined in one large region of interest for the study that is reported here. Note that the data we present reflect the left hemisphere: the left inferior frontal cortex, that is, the deep frontal operculum as well as the surface portion of the opercular and triangular part of the IFG. Since the left lateral premotor cortex cannot be determined on the basis of macroanatomical landmarks only and individual cytoarchitectonic data is not available, Schubotz et al. (2010) preselected the PCG, i.e., the anatomical region that is considered to consist of (part of) BA 4 and BA 6 (Brodmann, 1909).
Probabilistic Tractography
The purpose of probabilistic tractography is to characterize the connectivity pattern of cortical structural elements, denoted by seed voxels utilizing the orientation dependence of water within fiber bundles (i.e., water is more likely to diffuse along fiber bundles than across them). The 3D “random walk” method developed by (Anwander et al., 2007) attempts to quantize the connectivity pattern from a probabilistic point of view using diffusion tensor images. The random walk method describes the path taken by a particle starting from a given seed voxel and transitioning through target voxels within the white matter volume based upon local diffusivity measurements (i.e., local diffusivity measurements determine the transition probability from voxels to neighboring voxels). The probability of a particle moving to a neighboring voxel is thus greater along fiber directions. The random walk of a particle starting from the same seed voxel is repeated many times such that relative frequencies at which particles transitioned to target voxels (i.e., connectivity scores) give an appropriate measure of the probability of connectivity from particular seed voxels to target voxels. Figure 1 illustrates the location of seed voxels at the cortical boundary and their associated probabilistic tractograms. Let each tractogram xi be a list of connectivity scores y(i) for all random paths originating from a particular seed voxel to every other white matter target voxel (i.e., target voxel) such that the i-th tractogram is given by  a ∈ Ω, where Ω denotes the set of all target voxels and η denotes the number of target voxels. Note that, for the purpose of unsupervised cortex parcellation, the set of imaging voxels compromises the whole white matter volume.
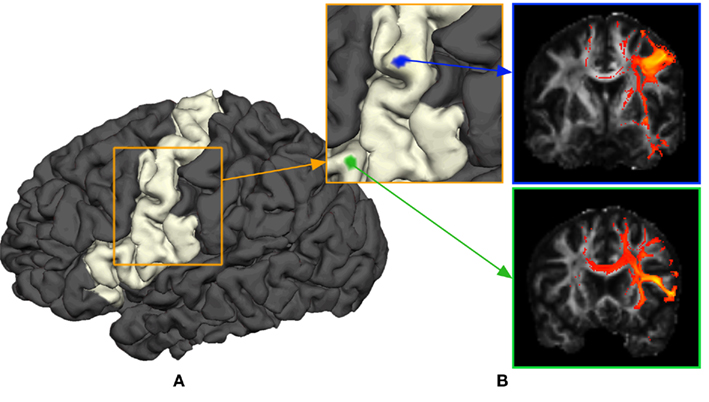
Figure 1. General methodology to obtain connectivity information of a cortical area using probabilistic tractograms. (A) Seed voxels in the white matter near the white–gray matter interface form the region of interest. (B) A probabilistic tractogram is computed for each seed voxel.
Information-Based Similarity Measure
Given that a pair of tractograms, xi and xj, are similar with respect to their connectivity, our intuition about similar tractograms arises from the notion that one tractogram xi reveals information about connectivity associated with another tractogram xj and vice versa. From an information-theoretic point of view, an overlap in uncertainty between tractograms xi and xj translates into a gain in mutual information.
Mutual information is one such quantity that provides a unique measure of the interdependence between tractograms:

where H(xi) is the entropy and a measure of uncertainty in connectivity associated with tractogram xi. Correspondingly, the conditional entropy H(xi|xj) measures the remaining uncertainty in connectivity of tractogram xi after xj is observed. Mutual information is thus intuitively defined as the amount of uncertainty removed in xi after observing xj or equivalently the amount of information tractogram xi provides about tractogram xj. Mutual information is computed as follows:
In order to compute the mutual information between two tractograms xi and xj we have to assume that the distribution of random variables (i.e., connectivity scores) in both tractograms are dependent upon each other. More precisely, we have to consider pairs of random variables in order to calculate the joint probability. We define a pair of random variables as  Note that the pair of connectivity scores is defined for the same target voxel a, thereby preserving spatial information of tractograms. The joint occurrence of connectivity scores, p(y(i),y(j)), is then simply defined as the probability of obtaining a combination of connectivity scores in tractograms xi and xj for any common target voxel. Computing p(y(i),y(j)) is equivalent to constructing the frequency table as shown in Figure 2.
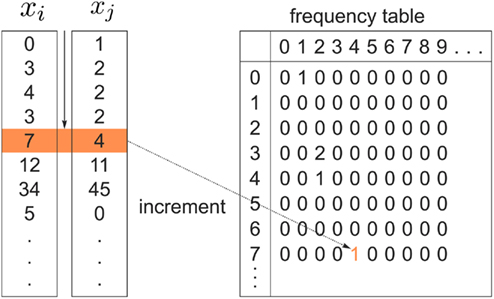
Figure 2. Pairs of connectivity scores,  and
and  in common target voxels between two tractograms on the left hand side serve as coordinates of the frequency table given on the right hand side. Elements of the frequency table are incremented for each occurrence of a combination of connectivity scores
Identifying Representative Tractograms
A desirable outcome of clustering probabilistic tractograms is characterizing each cortical subunit with a representative or exemplar connectivity pattern, signified as the tractographic prototype of that region. Recall that mutual information measures the dependence of tractogram xi to tractogram xj. Put differently, it infers the degree to which tractogram xj is representative of tractogram xi. The principle behind affinity propagation (Frey and Dueck, 2007) is to accumulate evidence among all pairs of tractograms to identify which tractograms are most representative of the entire cortical region of interest. The exemplar search method used in this paper is a slight variation of the original affinity propagation that softens the hard constraints inherent in the algorithm while still allowing exemplar choices that fulfill a global optimization principle. More precisely, SCAP (Leone et al., 2008) operates by iteratively updating two different messages exchanged between tractograms, denoted by “responsibility” and “availability,” which together reflect the accumulated affinity tractogram xi has for choosing tractogram xq as its exemplar:
where the penalty term ρ serves as a free parameter. Tractogram xq infers its suitability for serving as an exemplar for tractogram xi by comparing its similarity with tractogram xi and the maximum of similarities between tractogram xi, corrected by availability a(xi,xq) and all other tractograms. A positive responsibility reveals that tractogram xi prefers tractogram xq as its exemplar. The sum of accumulated positive incoming responsibility messages computed by availability gathers further evidence as to whether candidate exemplar xq is a favorable exemplar for a group of tractograms. The goal of the message-passing procedure is to converge upon a set of exemplars such that the maximum net similarity of the data is attained. After convergence, the exemplar choice of xi is extracted by selecting the candidate exemplar  with which tractogram xi has maximum affinity (i.e., similarity corrected by the availability):

The original formulation of affinity propagation (Frey and Dueck, 2007) imposed the hard constraint that each chosen exemplar should also choose to be an exemplar for itself. SCAP relaxes the hard constraints such that a weighted availability is conveyed whenever the sum of positive responsibilities is below a penalty term ρ as shown in Eq. 3. Consequently, chosen exemplars are allowed to choose other tractograms as their exemplars (i.e., exemplars do not have to be self-exemplars) thereby forming a set of connected components. Such connected components form loops and are therefore extracted as global clusters that contain several sub-clusters of tractograms. As mentioned previously, each global cluster of tractograms contains several exemplars, which implicitly implies a nested hierarchical structure due to the association of each cortical subunit with a particular exemplar. Figure 3 illustrates the usefulness of SCAP in revealing two levels of clustering shown for synthetic data.
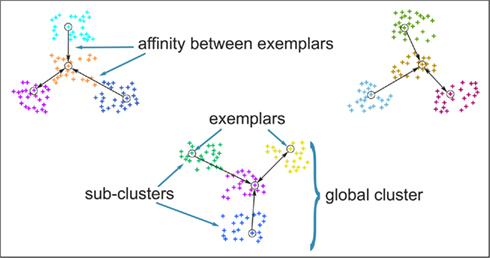
Figure 3. Clustering of synthetic data to illustrate the capability of soft-constraint affinity propagation (SCAP) in capturing two levels of clustering. SCAP identifies 12 exemplars shown as circles and therefore 12 sub-clusters as well as their preferred grouping in three global clusters. Arrows indicate the affinity between exemplars at the top-level of the nested hierarchy, sub-clusters are color-coded.
Note that the penalty term ρ influences the number of global clusters K and therefore the number of exemplars. The following section discusses a means to infer the number of global clusters and therefore the optimal ρ independent of the clustering algorithm.
Estimating the Number of Clusters
The method applied in this paper to assess an optimal clustering solution (i.e., to yield an automatic estimation of the number of clusters) was originally developed by Fischer and Buhmann (2003) and concerns the reliability of clustering tractograms: Uncertainty in the partitioning is quantified by clustering B bootstrap samples drawn from the original dataset. The empirical distribution of cluster assignments  learned from clustering B multiset replications quantifies the uncertainty in mapping tractogram xi to cluster k for the same number of clusters across the bootstrap samples. A problem related to estimating the empirical assignment probability is to identify equivalent clusters across partitionings of different datasets. A greedy approach is to search the particular permutation πb + 1 of cluster labels cb + 1 of dataset Xb + 1 that maximizes the sum over all cluster assignment probabilities learned from the previous b mappings:

The Hungarian method (Kuhn, 1955) finds the permutation πb + 1 efficiently without having to search through K! possible permutations. More precisely, the problem is formulated in terms of a weighted bipartite matching that contains two sets of nodes with each set containing a permutation of cluster labels (Fischer and Buhmann, 2003). Edges between nodes give the original assignment of label k to the assignment of a label π(k) from a permuted set. The weight of each edge is given by:

Maximizing the sum over all possible weights using the Hungarian method with a running time of X(K3) is equivalent to solving Eq. 5:

Finding the optimal cluster relabeling in each of the bootstrap sample allows one to quantify the reliability of clustering tractograms across different data replicates based upon their maximum likelihood given by:
where  defines the maximum likelihood mapping. Fischer and Buhmann (2003) propose a stability criterion that compares the reliability of the maximum likelihood mapping with the reliability of making random cluster assignments relative to the risk of misclassification:

where  and
and  are the mean of maximum and random probability assignments, respectively. By validating the global partitioning obtained by SCAP one yields a set of exemplars that give rise to the most stable global partitioning. Such a set of exemplars proves useful in identifying the finest level of detail of the hierarchy within a bottom-up approach as introduced in a latter section.
Allowing for Transitional Borders between Cortical Areas
As mentioned above, previous attempts at tractography-based parcellation have formed hard borders between cortical subunits. However, from an anatomical point of view, it is unclear whether borders between cortical structures should be distinct or have a transitional property. A soft partitioning of the data should therefore be made, in order to account for transitional regions. Such a soft partitioning is induced by means of a stochastic mapping,  and
and  in order to map tractograms to exemplars as opposed to making hard assignments. The most straightforward approach is to convert dissimilarity measures (i.e., distortion measures) into stochastic mappings using the following equations:
where t denotes the iteration sequence and A serves as the normalization constant. Bayes’ rule is used in Eq. 10(top set) with a likelihood function given by  Note that the likelihood function contains the distortion measure
  between tractograms and exemplars together with the computational temperature T that sets the scale for converting dissimilarity measures into probabilities. The marginal probability
  in Eq. 10(bottom) is computed by summing over all conditional probabilities.
However we require that the conditional  as well as marginal probabilities
  remain consistent (i.e., they do not change with respect to one another). Within an information-based framework the problem can be formulated in terms of rate distortion theory where the conditional entropy and the expected distortion determine the quality of the stochastic mapping (Tishby et al., 1999):
Variation of information serves as the distortion measure,  between tractogram xi and the exemplar
  Note that conditional entropy characterizes the average information required, in bits per tractogram, to invoke a mapping of a tractogram to an exemplar without confusion (Tishby et al., 1999). Rate distortion theory characterizes the tradeoff between information rate
  and expected distortion, where the objective is to allot membership probabilities to tractograms in order to maximize compression (i.e., equivalent to minimizing information rate) under the expected distortion constraint. Finding the rate distortion function is solved by introducing the Lagrange multiplier or inverse temperature, β = 1/T, and minimizing the corresponding functional:

Minimization of the functional yields the set of self-consistent equations (Eq. 10) that are each iterated over convex sets of normalized distributions given by Blahut (1978). More precisely, Blahut (1978) proves that, for a given temperature, iterating over the conditional and marginal probabilities in Eq. 10yields the global minimum of the functional F in Eq. 12. Note that both conditional and marginal probabilities remain consistent at the global minimum of F.
Testing Hierarchical Organization of Clusters
As we introduced above, evidence suggests that clusters of anatomical connectivity patterns are organized into a hierarchical structure; whereby bottom-level clusters reveal finer structures and top-level clusters (i.e., coarser clusters reveal a collection of finer structures) within the region of interest. The SCAP approach identified cortical subunits as well as inferred their preferred grouping into a global partitioning. However, from an anatomical point of view the nested structure (i.e., preferred grouping of cortical subunits) might exist at multiple levels thereby constituting a more informative hierarchical structure.
The information that exemplars provide about all other ractograms is given by  Forming a more informative nested structure of clusters requires merging clusters, zk and
  , in the partitioning Zm to form a coarser partitioning Zm − 1. However, forming Zm − 1 from Zm results in information loss about exemplars [i.e.,
  ]. Intuitively, given the assumption that cortical subunits retain a prototype characteristic, we wish group clusters in such a way that maximal information about exemplars
  , i.e. prototypes, is preserved. In order for
  to approximate
  as much as possible, the difference between the loss of information between merging operations should be minimal [i.e.,
  so that
  ]. Slonim and Tishby (1999) demonstrate that clusters,
  and
and  , achieve an optimal grouping, which preserves as much information about exemplars as possible [i.e.,
  ], if the Jenson–Shannon distance between their conditional distributions
  corrected for marginal probabilities, is minimal. More precisely, the clusters that we have to merge is found by minimizing

where  . Essentially, the merge cost
  is a product of the weight sum of clusters,
  and the distance between them with respect to the exemplars measured by the Jenson–Shannon divergence.
This optimization strategy was formerly introduced as agglomerative information bottleneck method (Slonim and Tishby, 1999) – Figure 4 illustrates our application.
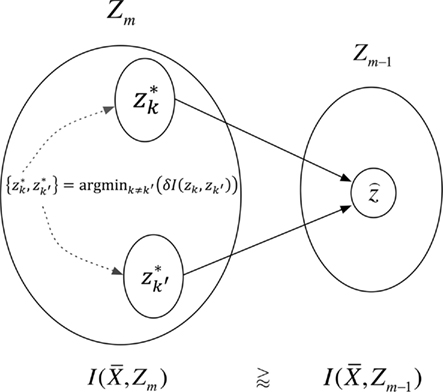
Figure 4. The agglomerative information bottleneck method merges clusters  and
and  in partitioning Zm to form a coarser partitioning
  . The resulting partitioning Zm − 1 is such that there is minimal loss of information – i.e.,
After merging clusters,  the marginal and conditional probabilities for

 and
and  are updated as follows (Slonim and Tishby, 1999):
Where m denotes the merging sequence. Note that the sub-clusters obtained by SCAP are used as the initial hard partition between cortical subunits ZM.
Results
Assessment of clustering solutions in Figure 5 based upon the stability criterion (Eq. 9) suggests four global clusters consisting of 15 exemplars and thus 15 cortical subunits as the most stable solution within the region of interest.
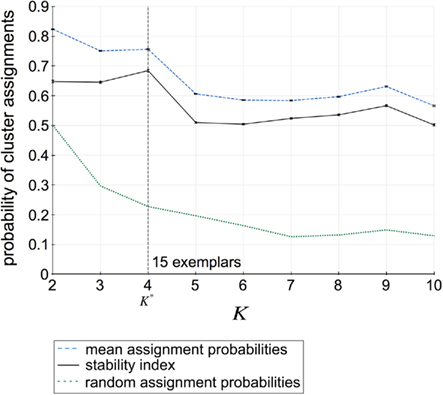
Figure 5. Assignment probabilities plotted against the number of global clusters K. Dashed plot shows the mean assignment probability based upon the maximum likelihood mapping. Dotted plot shows the random cluster assignment probabilities. The stability index (Fischer and Buhmann, 2003) used to select the number of clusters K* is the relative difference between mean and random cluster assignment probabilities (solid plot). The most stable partitioning K* is given by the preferred grouping of 15 cortical subunits, characterized by 15 exemplars, into four global cortical structures.
Figure 6A illustrates the preferred grouping of cortical subunits in the region of interest in four global cortical structures: The PCG is divided into two areas, a dorsal area (dPCG) and a ventral area (vPCG), then a ventral transition into the posterior IFG resides at the ventral tip of the PCG and pars opercularis of the IFG, pars triangularis of the IFG and the deep frontal operculum together form the forth group.
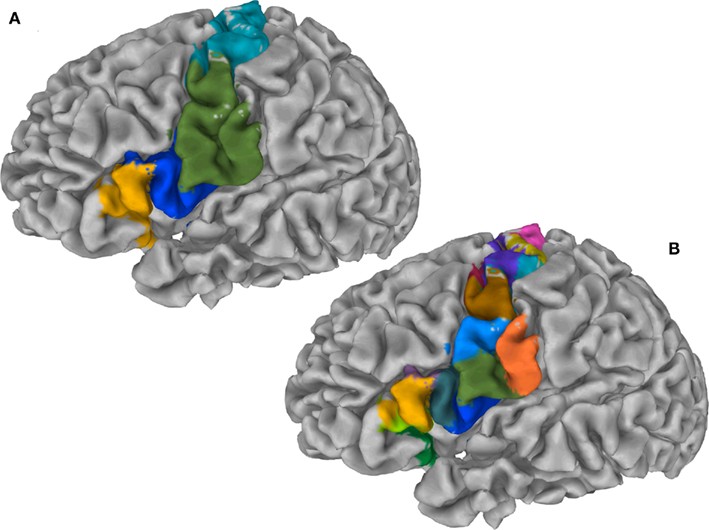
Figure 6. (A) Cortex parcellation of the IFG together with the PCG showing four global cortical structures on the gray matter surface. (B) Cortex parcellation of the same ROI at finest level of detail expressed by a hierarchy indicates 15 cortical subunits.
Exemplars identify 15 areas in the posterior inferior frontal and precentral cortex (cf. Figure 6B). The dorsal PCG is subdivided into five areas: two superior–caudal and two inferior–rostral areas, and one directly bordering ventral PCG at the bank of precentral sulcus. The ventral PCG is subdivided into a superior–rostral and an inferior–caudal area. For validation purposes a part of the (inferior) postcentral gyrus was included in the region of interest; this region is appropriately clustered as a separate area (orange field in Figure 6B). Parcellation results suggest a transition region into the posterior IFG at the ventral tip of the PCG: The pars opercularis of the IFG, pars triangularis of the IFG, the depths of the inferior frontal sulcus and frontal operculum. The hierarchical organization of these clusters (Figure 7) constitutes a distinction of areas in the dorsal PCG and those belonging to the posterior ventral precentral cortex.
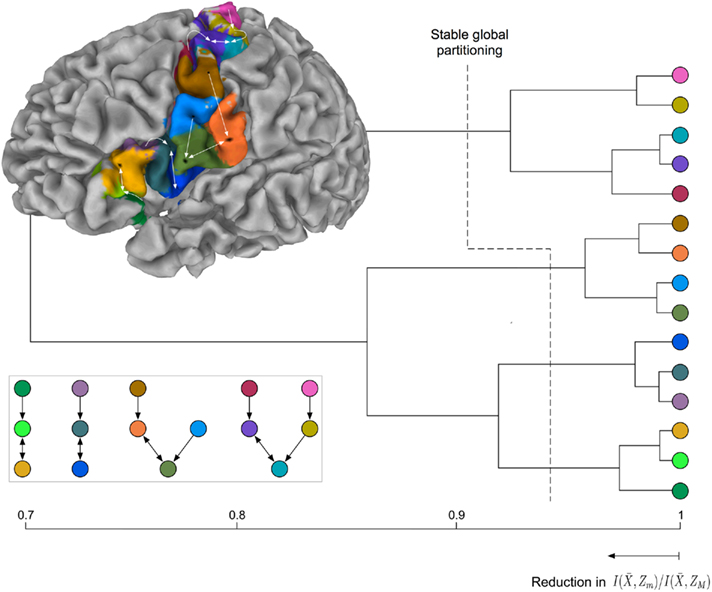
Figure 7. Hierarchical tree of the nested hierarchical structure constructed by the agglomerative information bottleneck method (Slonim and Tishby, 1999). The cardinality of the initial partition equals the number of exemplars, M = 15. The length of each branch gives the normalized information loss  due to merging operations. Bottom left: Internal organization of representative tractograms within four global cortical structures obtained by SCAP. Top left: Cortex parcellation showing the finest level of detail. Black dots indicate the location of exemplars while arrows show the preferred grouping of cortical subunits obtained by SCAP.
For the latter there is further modular organization showing distinction between areas of ventral PCG and those of posterior IFG. The parcellation results given alongside the hierarchical tree in Figure 7 show the finest detail expressed by cortical structures. Arrows in Figure 7 illustrate the preferred grouping of cortical subunits into four global cortical structures shown in Figure 6A. Notice that the same four global cortical structures emerge from the agglomerative information bottleneck method.
Discussion
We propose an unsupervised information-based clustering technique for connectivity-based cortex parcellation suitable for automatic parcellation. The methodological framework used here to reveal complex properties of cortical subunits such as transitional borders as well as a modular hierarchical architecture is summarized in Figure 8.
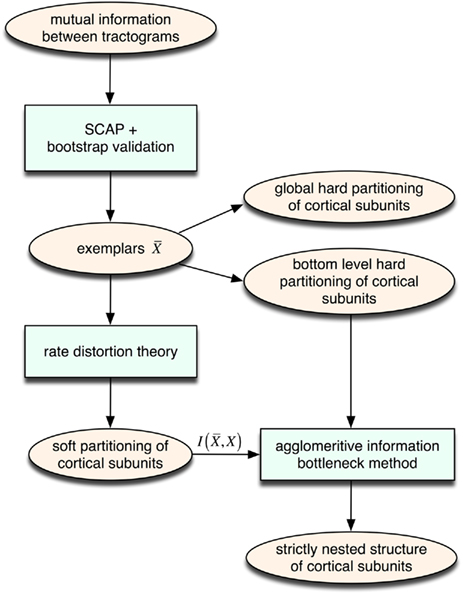
Figure 8. Overview of the unsupervised framework used in this study. SCAP together with clustering assessment using bootstrap sampling is used to obtain exemplars that each characterizes individual cortical subunits within a global and bottom-level partitioning. Thereafter, rate distortion theory is used to map tractograms to exemplars. The agglomerative information bottleneck method used information gained from rate distortion theory [i.e.,  ] to construct a more informative nested structure of cortical subunits. The sub-clusters obtained by SCAP define the bottom-level partitioning of the hierarchy.
A proof of principle of the approach yields anatomically sensible results.
Anatomical Interpretation
The parcellation results advocate that dorsal PCG fields can be separated in agreement with the suggestion that this area consists of two premotor areas (Schubotz et al., 2010), as well as primary motor cortex (Geyer et al., 1996) and the frontal eye field at the rostral bank of precentral sulcus and the ventral branch of posterior superior frontal sulcus (Amiez and Petrides, 2009).
Concerning the convexity of PCG, the average Talairach z coordinate of the border between ventral and dorsal areas was 49, consistent with other reports from functional imaging studies (Rizzolatti et al., 2002) and connectivity-based parcellation (Tomassini et al., 2007; Schubotz et al., 2010). The delineation of the sub-fields in the posterior ventral precentral cortex accurately resembles results from cytoarchitectonic and multireceptor studies as those were recently reported by Amunts et al. (2010). This includes previously unknown areas, such as the ventral precentral transitional cortex 6r1, anterior and posterior areas 45a and 45p, and areas in the frontal operculum op8 and op9.
Anatomically disjoint areas were distinguished (Figure 9), consistent with Amunts et al. (2010), one being located in the depths of the inferior frontal sulcus, the other immediately rostrally to the ventral premotor area. Both areas were found at the junction of the inferior frontal and the precentral sulcus and therefore may correspond to the previously described inferior frontal junction region (IFJ, Brass et al., 2005; Amunts and Von Cramon, 2006). Strikingly, our results accurately reflect the delineation of areas concerning the IFJ obtained by Derrfuss et al. (2009). Note that the fMRI data used by Derrfuss et al. (2009) were taken from the same subject (subject 2 in Derrfuss et al., 2009). Our results therefore suggest a specific connectivity underlying IFJ, rendering this region as a distinct anatomical area.
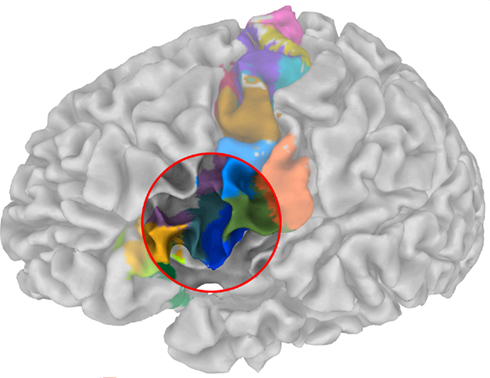
Figure 9. Parcellation of the sub-fields in the posterior ventral precentral cortex indicate a striking resemblance with cytoarchitectonic and multireceptor studies as those were recently reported by Amunts et al. (2010) – cf. their Figure 9.
The merging of the postcentral region (orange field in Figure 6B) with the ventral PCG at a rather high hierarchical level seems to be supported by findings in non-human primates, implying dense bidirectional connections between the rostral portion of the inferior parietal lobule and the adjacent opercular area, i.e., ventral premotor area 6 (cf., e.g., Schmahmann and Pandya, 2007). However, whether this suggestion is indeed evident in tractography-based connectivity scores remains to be studied in detail, and specifically with respect to limitations potentially imposed by the choice of a particular tractography method and the underlying diffusion model.
Methodological Issues
A well-known difficulty of most clustering algorithms is the choice of an appropriate similarity measure, since this ultimately determines the cluster structure that can be inferred from the data – i.e., elements within the same cluster share a common similarity quantified by the respective measure. Intuitively, clustering of tractograms should be based upon capturing the shape of probabilistic tractograms. In other words, probabilistic tractograms should be grouped together if they have similar shape. Such tractograms are represented as volumes containing connectivity scores for each target voxel. Defining their shape is therefore not straightforward. We define two tractograms as having similar shape if their connectivity scores in common (i.e., corresponding) target voxels (not any target voxel) are similar. The similarity measure should therefore involve a pairwise comparison of connectivity scores with pairs of connectivity scores given by  where a denotes the particular target voxel common to both tractograms i and j.
In order to compute how probable it is that two tractograms have similar shape we consider the joint occurrence of connectivity scores p(y(i),y(j)) for any common target voxel; p(y(i),y(j)) is computed by constructing the frequency table using the frequency of occurrence of pairs of connectivity scores  within all common target voxels. Constructing the frequency table as shown in Figure 2 already involves pairwise comparisons of connectivity scores in common target voxels. If p(y(i),y(j)) is high for all connectivity scores among common target voxels in tractograms i and j it follows that tractograms i and j are likely to have similar shape. Mutual information measures the dependency of one tractogram on another tractogram. Since we are interested in capturing the shape of tractograms, mutual information, as computed in Eq. 2, measures how dependent the shape of one tractogram is on the shape of another tractogram. Moreover, mutual information will capture any type of dependency including linear and non-linear dependencies between the shapes of tractograms.
An issue that draws less attention is the dependency of similarity measures on the representation of the data – i.e., different transformations of the data will produce different similarity quantities. Given that, in our application, we have limited knowledge about the structure of clusters or about which type of relation should be considered, the similarity measure should be invariant to data representation. Mutual information has the useful property of being independent of representation of the data – i.e., different invertible transformations on individual tractograms will yield the same mutual information quantity.
Another difficulty of clustering algorithms is their associated degree of freedom that influences the partitioning, mostly with regard to the number of clusters. Typically used cluster validity criteria are determined heuristically and favor compactness and separability of clusters. The method proposed in this study to infer the number of global clusters suggests an intuitive notion of a sensible partitioning. That is, a stable clustering solution should be resistant to noise in the data (Buhmann, 2010). More precisely, uncertainty in the data gives rise to uncertainty in the clustering solution. A sensible global partitioning is one for which the uncertainty in the data has minimum influence on the clustering solution. Note that the stability criterion (cf. Eq. 12) is dependent upon the ordering of the bootstrap samples, particularly if the first sample leads to a poor clustering solution. To circumvent this potential difficulty, we suggest computing the stability criterion for different permutations of bootstrap sample orderings in order to avoid the influence of initial poor solutions on the stability criterion.
Essentially, our method rests upon the assumption that each cortical subunit possesses a “prototype” characteristic: an exemplar tractogram sufficiently describes the connectivity pattern of the entire cortical subunit and is thus representative of that subunit. Among the previously used clustering algorithms for connectivity-based parcellation, k-means clustering and Dirichlet process mixture models (used together with a Gaussian likelihood), have the advantage of searching for central tendencies (i.e., means) in data which are useful for identifying exemplar tractograms. Such techniques, however, rely on random sampling that allow for unlucky pruning decisions that cannot be recovered from and consequently lead to poor solutions. Affinity propagation (Frey and Dueck, 2007) used in this study is a recently developed algorithm that avoids random sampling by simultaneously considering all tractograms as potential exemplars.
Our clustering approach is inherently different to previous techniques since global clusters of tractograms define groups of cortical subunits whereas the sub-clusters form the cortical subunits themselves. Given the prior assumption that a strictly nested structure may exist, our approach associates the partitioning of cortical subunits reflecting the finest level of detail with the partitioning that brings about the most stable grouping of cortical subunits at a higher level of the hierarchy. The agglomerative information bottleneck method (Slonim and Tishby, 1999) provides more levels of clustering on the basis of preserving as much information as possible about the partitioning with respect to representative tractograms. In contrast to other traditional hierarchical clustering methods we insist upon defining the finest level of detail of the partitioning other than simply associating it with the maximum number of clusters (i.e., every tractogram is its own cluster). While, anatomically, very fine detailed hierarchical organization of cortical subunits may exist, the level of detail that probabilistic tractography is capable of revealing is, among other things, limited by resolution offered by diffusion-weighted images.
The prototype-based characteristic of cortical subunits allows for modeling the transition between cortical subunits as the uncertainty in mapping tractograms to cortical subunits using rate distortion theory. A simple parameter, namely the “temperature” T, controls the sensitivity of the uncertainty in the aforementioned mapping to the similarity between tractograms and representative tractograms. Tuning T therefore determines the level of fuzziness in the partitioning (see Figure 10).
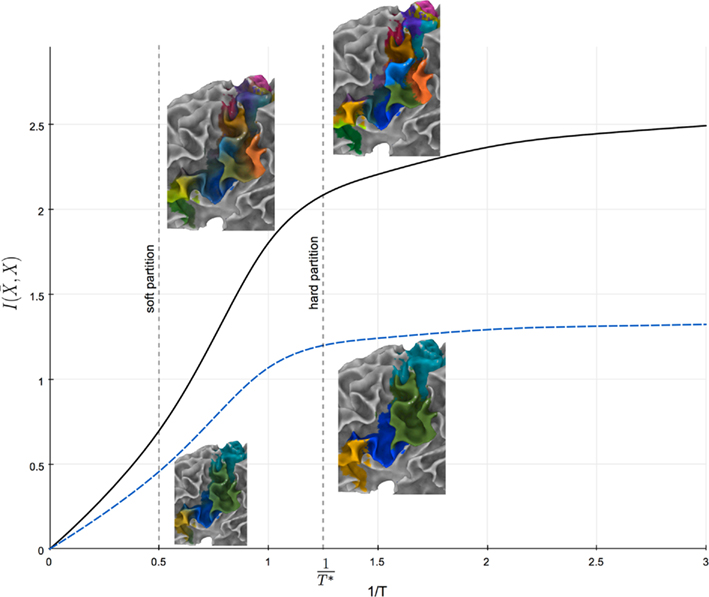
Figure 10. Information rate I( ) plotted against the inverse temperature 1/T. Solid and dashed plots illustrate the relationship between information rate and inverse temperature for 15 cortical subunits and 4 global cortical structures, respectively. 1/T* gives the temperature for which the information rate has only slight changes for lower temperatures.
Note that T influences the hierarchical structure obtained by the agglomerative information bottleneck method since it determines the dependency of the data on the exemplars. Tuning the temperature to infinity maximizes the uncertainty of mapping tractograms to exemplars and causes conditional probabilities to be insensitive to similarity between tractograms. The resulting hierarchy is thus constructed at random. Conversely, decreasing the temperature results in a hierarchy that is more governed by the dependency of tractograms to exemplars. We propose to select the highest possible “temperature” for which the information rate has minimal change for lower temperatures as shown in Figure 10. Maximal amount of information is thus used to construct the hierarchy while taking into account some uncertainty in mapping tractograms to exemplars.
Future work
A further step towards understanding the organization of cortical subunits is to study the consistency or heterogeneity of hierarchically modular cortical subunits across subjects. Individual variability, however, is an important issue in anatomical studies, because any given area (even a primary sensory area) can vary in size by twofold or more (Filiminoff, 1932; Maunsell and Van Essen, 1987; Uylings et al., 2005) and because the consistency with which each area is located with respect to topographic boundaries has important implications for physiological and neuroimaging studies. In this respect, a meaningful parcellation should be assumed to exist in all subjects with similar location, shape, and connectivity pattern.
Note that it is unclear whether or not cortical subunits possess the aforementioned “prototype” (i.e., exemplar) characteristic. A clustering method that avoids defining cluster “prototypes” might therefore prove more suitable for parcelating regions without a priori knowledge (Slonim et al., 2005).
Furthermore, an obvious limitation of any model-based approach to reveal structure in the data is that it already assumes that there is structure in the data. In the context of hierarchically modular cortical subunits, hierarchical clustering models are already forced to find nested structures in the data. The question of whether connectivity patterns, quantified by probabilistic tractograms, prefer to be grouped in a nested structure or not should be addressed and is formulated in terms of model validation.
Buhmann (2010) performs model validation based upon an indispensible requirement that the solution should be generalizable under the influence of noise. More precisely, a nested structure of cortical subunits should be generalizable given noise in the diffusion measurements, such as noise from the MR scan, physiological noise, motion affects, etc. Assessing the generalizability performance is given by a tradeoff between the informativeness as well as the robustness against noise of the nested clustering solution. Intuitively, a nested structure showing more branching is more informative. The question is to be answered is therefore: How informative can the nested structure of cortical subunits be (i.e., how many branches if any should the dendrogram have) without fitting the sampling noise?
Conflict of Interest Statement
The authors declare that the research was conducted in the absence of any commercial or financial relationships that could be construed as a potential conflict of interest.
Acknowledgments
The authors wish to thank D. Y. von Cramon for his continuing support and his endurance to teach us tedious anatomy. Further appreciation for insightful discussions is given to J. M. Buhmann, Swiss Federal Institute of Technology Zurich, and M. Lässig, University of Cologne. The work was supported by the German Ministry of Education and Research (Grants No. 01GW0772 and 01GW0612).
References
Amiez, C., and Petrides, M. (2009). Anatomical organization of the eye fields in the human and non-human primate frontal cortex. Prog. Neurobiol. 89, 220–230.
Amunts, K., Lenzen, M., Friederici, A. D., Schleicher, A., Morosan, P., Palomero-Gallagher, N., and Zilles, K. (2010). Broca’s region: novel organizational principles and multiple receptor mapping. PLoS Biol. 8, e1000489. doi: 10.1371/journal.pbio.1000489
Amunts, K., and Von Cramon, D. Y. (2006). The anatomical segregation of the frontal cortex: what does it mean for function? Cortex 42, 525–528.
Anwander, A., Tittgemeyer, M., Yves Von Cramon, D. Y., Friederici, A. D., and Knösche, T. R. (2007). Connectivity-based parcellation of Broca’s area. Cereb. Cortex 17, 816–825.
Averbeck, B. B., Battaglia-Mayer, A., Guglielmo, C., and Caminiti, R. (2009). Statistical analysis of parieto-frontal cognitive-motor networks. J. Neurophysiol. 102, 1911–1920.
Bach, D., Behren, S. T., Garrido, L., Weiskopf, N., and Dolan, R. (2011). Deep and superficial amygdala nuclei projections revealed in vivo by probabilistic tractography. J. Neurosci. 31, 618–623.
Bassett, D. S., and Gazzaniga, M. S. (2011). Understanding complexity in the human brain. Trends Cogn. Sci. (Regul. Ed.) 15, 200–209.
Bassett, D. S., Greenfield, D. L., Meyer-Lindenberg, A., Weinberger, D. R., Moore, S. W., and Bullmore, E. T. (2010). Efficient physical embedding of topologically complex information processing networks in brains and computer circuits. PLoS Comput. Biol. 6, e1000748. doi: 10.1371/journal.pcbi.1000748
Beckmann, M., Johansen-Berg, H., and Rushworth, M. F. S. (2009). Connectivity-based parcellation of human cingulate cortex and its relation to functional specialization. J. Neurosci. 29, 1175–1190.
Behrens, T. E. J., Johansen-Berg, H. J., Woolrich, M. W., Smith, S. M., Wheeler-Kingshott, C. a. M., Boulby, P. A., Barker, G. J., Sillery, E. L., Sheehan, K., Ciccarelli, O., Thompson, A. J., Brady, M., and Matthews, P. M. (2003). Non-invasive mapping of connections between human thalamus and cortex using diffusion imaging. Nat. Neurosci. 6, 750–757.
Blahut, R. E. (1978). Computation of channel capacity and rate distortion theory. IEEE Trans. Inf. Theory 18, 460–473.
Brass, M., Derrfuss, J., Forstmann, B. U., and Yves Von Cramon, D. Y. (2005). The role of the inferior frontal junction area in cognitive control. Trends Cogn. Sci. (Regul. Ed.) 9, 314–316.
Brodmann, K. (1909). Vergleichende Lokalisationslehre der Groß hirnrinde in ihren Prinzipien dargestellt auf Grund des Zellaufbaues. Leipzig: Barth.
Buhmann, J. M. (2010). “Information theoretic model validation for clustering,” in International Symposium on Information Theory (Austin, TX: IEEE).
Crippa, A., Cerliani, L., Nanetti, L., and Roerdink, J. B. T. M. (2011). Heuristics for connectivity-based brain parcellation of SMA/pre-SMA through force-directed graph layout. Neuroimage 54, 2176–2184.
Dale, A. M., Fischl, B., and Sereno, M. I. (1999). Cortical surface-based analysis. I. Segmentation and surface reconstruction. Neuroimage 9, 179–194.
Derrfuss, J., Brass, M., Yves Von Cramon, D. Y., Lohmann, G., and Amunts, K. (2009). Neural activations at the junction of the inferior frontal sulcus and the inferior precentral sulcus: interindividual variability, reliability, and association with sulcal morphology. Hum. Brain Mapp. 30, 299–311.
Devlin, J. T., Sillery, E. L., Hall, D. A., Hobden, P., Behrens, T. E. J., Nunes, R. G., Clare, S., Matthews, P. M., Moore, D. R., and Johansen-Berg, H. (2006). Reliable identification of the auditory thalamus using multi-modal structural analyses. Neuroimage 30, 1112–1120.
Draganski, B., Kherif, F., Kloppel, S., Cook, P. A., Alexander, D. C., Parker, G. J. M., Deichmann, R., Ashburner, J., and Frackowiak, R. S. J. (2008). Evidence for segregated and integrative connectivity patterns in the human basal ganglia. J. Neurosci. 28, 7143–7152.
Filiminoff, I. (1932). Über die variabilitat der grosshirnrindenstruktur. Mitteilung II. Regio occipitalis beim erwachsenen Menshchen. J. Psychol. Neurol. 44, 1–96.
Fischer, B., and Buhmann, J. M. (2003). Bagging for path-based clustering. IEEE Trans. Pattern Anal. Mach. Intell. 25, 1411–1415.
Ford, A., Mcgregor, K. M., Case, K., Crosson, B., and White, K. D. (2010). Structural connectivity of Broca’s area and medial frontal cortex. Neuroimage 52, 1230–1237.
Frey, B. J., and Dueck, D. (2007). Clustering by passing messages between data points. Science 315, 972–976.
Fuster, J. M. (1997). The Prefrontal Cortex: Anatomy, Physiology and Neuropsychology of the Frontal Lobe. Baltimore: Lippincott/Williams & Wilkins.
Geyer, S., Ledberg, A., Schleicher, A., Kinomura, S., Schormann, T., Bürgel, U., Klingberg, T., Larsson, J., Zilles, K., and Roland, P. E. (1996). Two different areas within the primary motor cortex of man. Nature 382, 805–807.
Geyer, S., Matelli, M., Luppino, G., and Zilles, K. (2000). Functional neuroanatomy of the primate isocortical motor system. Anat. Embryol. 202, 443–474.
Hilgetag, C. C., and Grant, S. (2000). Uniformity, specificity and variability of corticocortical connectivity. Philos. Trans. R. Soc. Lond. B Biol. Sci. 355, 7–20.
Jbabdi, S., Woolrich, M. W., and Behrens, T. E. J. (2009). Multiple-subjects connectivity-based parcellation using hierarchical Dirichlet process mixture models. Neuroimage 44, 373–384.
Jenkinson, M., Bannister, P., Brady, M., and Smith, S. M. (2002). Improved optimization for the robust and accurate linear registration and motion correction of brain images. Neuroimage 17, 825–841.
Johansen-Berg, H., Behrens, T., Sillery, E., Ciccarelli, O., Thompson, A., Smith, S., and Matthews, P. (2005). Functional-anatomical validation and individual variation of diffusion tractography-based segmentation of the human thalamus. Cereb. Cortex 15, 31–39.
Johansen-Berg, H. J., Behrens, T. E. J., Robson, M. D., Drobnjak, I., Rushworth, M. F. S., Brady, M., Smith, S. M., Higham, D. J., and Matthews, P. M. (2004). Changes in connectivity profiles define functionally distinct regions in human medial frontal cortex. Proc. Natl. Acad. Sci. U.S.A. 101, 13335–13340.
Johansen-Berg, H. J., and Rushworth, M. (2009). Using diffusion imaging to study human connectional anatomy. Annu. Rev. Neurosci. 32, 75–94.
Jones, D. (2010). Challenges and limitations of quantifying brain connectivity in vivo with diffusion MRI. Imaging Med. 2, 341–355.
Kaiser, M. (in press). A tutorial in connectome analysis: topological and spatial features of brain networks. Neuroimage 57, 892–907.
Kaiser, M., and Hilgetag, C. C. (2007). Development of multi-cluster cortical networks by time windows for spatial growth. Neurocomputing 70, 1829–1832.
Kaiser, M., and Hilgetag, C. C. (2010). Optimal hierarchical modular topologies for producing limited sustained activation of neural networks. Front. Neuroinform. 4:8. doi: 10.3389/fninf.2010.00008
Klein, J. C., Behrens, T. E. J., Robson, M. D., Mackay, C. E., Higham, D. J., and Johansen-Berg, H. J. (2007). Connectivity-based parcellation of human cortex using diffusion MRI: establishing reproducibility, validity and observer independence in BA 44/45 and SMA/pre-SMA. Neuroimage 34, 204–211.
Knösche, T. R., and Tittgemeyer, M. (2011). The role of long-range connectivity for the characterization of the functional-anatomical organization of the cortex. Front. Syst. Neurosci. 5:58. doi: 10.3389fnsys.2011.00058. [Epub ahead of print]
Lehericy, S., Ducros, M., Van De Moortele, P.-F., Francois, C., Thivard, L., Poupon, C., Swindale, N. V., Ugurbil, K., and Kim, D. (2004). Diffusion tensor fiber tracking shows distinct Corticostriatal circuits in humans. Ann. Neurol. 55, 522–529.
Leone, M., Sumedha, and Weigt, M. (2008). Unsupervised and semi-supervised clustering by message passing: soft-constraint affinity propagation. Eur. Phys. J. B 66, 125–135.
Lewis, J. W., and Van Essen, D. C. (2000). Corticocortical connections of visual, sensorimotor, and multimodal processing areas in the parietal lobe of the macaque monkey. J. Comp. Neurol. 428, 112–137.
Markov, N. T., Misery, P., Falchier, A., Lamy, C., Vezoli, J., Quilodran, R., Gariel, M. A., Giroud, P., Ercsey-Ravasz, M., Pilaz, L. J., Huissoud, C., Barone, P., Dehay, C., Toroczkai, Z., Van Essen, D. C., Kennedy, H., and Knoblauch, K. (2010). Weight consistency specifies regularities of macaque cortical networks. Cereb. Cortex 21, 1254–1272.
Maunsell, J. H., and Van Essen, D. C. (1987). Topographic organization of the middle temporal visual area in the macaque monkey: representational biases and the relationship to callosal connections and myeloarchitectonic boundaries. J. Comp. Neurol. 266, 535–555.
Menke, R. A., Jbabdi, S., Miller, K. L., Matthews, P. M., and Zarei, M. (2010). Connectivity-based segmentation of the substantia nigra in human and its implications in Parkinson’s disease. Neuroimage 52, 1175–1180.
Meunier, D., Lambiotte, R., and Bullmore, E. T. (2010). Modular and hierarchically modular organization of brain networks. Front. Neurosci. 4:200. doi: 10.3389/fnins.2010.00200
Nanetti, L., Cerliani, L., Gazzola, V., Renken, R., and Keysers, C. (2009). Group analyses of connectivity-based cortical parcellation using repeated k-means clustering. Neuroimage 47, 1666–1677.
O’Muircheartaigh, J., Vollmar, C., Traynor, C., Barker, G., Kumari, V., Symms, M., Thompson, P., Duncan, J., Koepp, M., and Richardson, M. (2011). Clustering probabilistic tractograms using independent component analysis applied to the thalamus. Neuroimage 54, 2020–2032.
Passingham, R. E., Stephan, K. E., and Kötter, R. (2002). The anatomical basis of functional localization in the cortex. Nat. Rev. Neurosci. 3, 606–616.
Rizzolatti, G., Fogassi, L., and Gallese, V. (2002). Motor and cognitive functions of the ventral premotor cortex. Curr. Opin. Neurobiol. 12, 149–154.
Roca, P., Tucholka, A., Rivière, D., Guevara, P., Poupon, C., and Mangin, J.-F. (2010). “Inter-subject connectivity-based parcellation of a patch of cerebral cortex,” in International Conference on Medical Image Computing and Computer-Assisted Intervention (MICCAI) (New York: Springer-Verlag).
Sanides, F. (1962). Architectonics of the human frontal lobe of the brain. With a demonstration of the principles of its formation as a reflection of phylogenetic differentiation of the cerebral cortex. Monogr. Gesamtgeb. Neurol. Psychiatr. 98, 1–201.
Schmahmann, J. D., and Pandya, D. N. (2007). Fiber Pathways of the Brain. New York: Oxford University Press.
Schubotz, R. I., Anwander, A., Knösche, T. R., Von Cramon, D. Y., and Tittgemeyer, M. (2010). Anatomical and functional parcellation of the human lateral premotor cortex. Neuroimage 50, 396–408.
Sillery, E., Bittar, R. G., Robson, M. D., Behrens, T. E. J., Stein, J., Aziz, T. Z., and Johansen-Berg, H. (2005). Connectivity of the human periventricular-periaqueductal gray region. J. Neurosurg. 103, 1030–1034.
Slonim, N., Atwal, G. S., Tkacik, G., and Bialek, W. (2005). Information-based clustering. Proc. Natl. Acad. Sci. U.S.A. 102, 18297–18302.
Slonim, N., and Tishby, N. (1999). “Agglomerative information bottleneck,” in Neural Information Processing Systems (MIT Press) 12, 617–623.
Stephan, K. E., Hilgetag, C. C., Burns, G. A., O’Neill, M. A., Young, M. P., and Kötter, R. (2000). Computational analysis of functional connectivity between areas of primate cerebral cortex. Philos. Trans. R. Soc. Lond. B Biol. Sci. 355, 111–126.
Tishby, N., Pereira, F., and Bialek, W. (1999). “The information bottleneck method,” in Proceedings of the 37th Annual Allerton Conference on Communication, Control, and Computing, eds B. Hajek, and R. C. Sreenivas (Urbana, IL). 368–377.
Tomassini, V., Jbabdi, S., Klein, J. C., Behrens, T. E. J., Pozzilli, C., Matthews, P. M., Rushworth, M. F. S., and Johansen-Berg, H. J. (2007). Diffusion-weighted imaging tractography-based parcellation of the human lateral premotor cortex identifies dorsal and ventral subregions with anatomical and functional specializations. J. Neurosci. 27, 10259–10269.
Keywords: cortex parcellation, hierarchical clustering, information theory, diffusion tractography
Citation: Gorbach NS, Schütte C, Melzer C, Goldau M, Sujazow O, Jitsev J, Douglas T and Tittgemeyer M (2011) Hierarchical information-based clustering for connectivity-based cortex parcellation. Front. Neuroinform. 5:18. doi: 10.3389/fninf.2011.00018
Received: 18 March 2011;
Accepted: 26 August 2011;
Published online: 23 September 2011.
Edited by:
Claus Hilgetag, Jacobs University Bremen, GermanyReviewed by:
Danielle S. Bassett, University of California Santa Barbara, USASaad Jbabdi, University of Oxford, UK
Copyright: © 2011 Gorbach, Schütte, Melzer, Goldau, Sujazow, Jitsev, Douglas and Tittgemeyer. This is an open-access article subject to a non-exclusive license between the authors and Frontiers Media SA, which permits use, distribution and reproduction in other forums, provided the original authors and source are credited and other Frontiers conditions are complied with.
*Correspondence: Marc Tittgemeyer, Max Planck Institute for Neurological Research, Gleueler Str. 50, D-50931 Cologne, Germany. e-mail: marc.tittgemeyer@nf.mpg.de