EEGVIS: a MATLAB toolbox for browsing, exploring, and viewing large datasets
- Department of Computer Science, The University of Texas at San Antonio, San Antonio, TX, USA
Recent advances in data monitoring and sensor technology have accelerated the acquisition of very large data sets. Streaming data sets from instrumentation such as multi-channel EEG recording usually must undergo substantial pre-processing and artifact removal. Even when using automated procedures, most scientists engage in laborious manual examination and processing to assure high quality data and to indentify interesting or problematic data segments. Researchers also do not have a convenient method of method of visually assessing the effects of applying any stage in a processing pipeline. EEGVIS is a MATLAB toolbox that allows users to quickly explore multi-channel EEG and other large array-based data sets using multi-scale drill-down techniques. Customizable summary views reveal potentially interesting sections of data, which users can explore further by clicking to examine using detailed viewing components. The viewer and a companion browser are built on our MoBBED framework, which has a library of modular viewing components that can be mixed and matched to best reveal structure. Users can easily create new viewers for their specific data without any programming during the exploration process. These viewers automatically support pan, zoom, resizing of individual components, and cursor exploration. The toolbox can be used directly in MATLAB at any stage in a processing pipeline, as a plug-in for EEGLAB, or as a standalone precompiled application without MATLAB running. EEGVIS and its supporting packages are freely available under the GNU general public license at http://visual.cs.utsa.edu/eegvis.
Introduction
Recent advances in data monitoring and sensor technology have accelerated the acquisition of large, complex data sets exhibiting widely varying scales. A typical EEG multi-channel experiment might record 256 channels at 512 Hz resulting in about 8 million data points per minute. While normal EEG signals tend to vary on a scale of approximately 100 μV, a loose connector can result in voltages in the tens of thousands of microvolts.
Both size and wide swings in scale present difficulties for plotting functions, which must display information in a limited screen area at a resolution that is comprehensible. Because of the lack of visualization tools that allow signal display on varying scales, researchers must either blindly apply processing pipelines to their data or engage in the laborious task of stepping through small blocks of data at a time. EEGLAB (Delorme and Makeig, 2004) and Field Trip (Oostenveld et al., 2011), widely used open source MATLAB toolboxes for analyzing EEG data, have data viewers that allow users to step or scroll through small windows of data at a time, but they do not provide tools for browsing, overview, and exploration. Furthermore, there is no convenient way to easily assess the effect of a particular processing step by comparing the dataset before and after the application of the algorithm.
The aim of this work is to provide an extensible toolkit that users can incorporate into their normal workflow to examine large-scale array datasets and quickly assess the effects of various stages in their processing pipelines. We selected MATLAB as our implementation platform because of its excellent infrastructure and widespread use in the neuroscience community.
Methods
We have built a MATLAB toolbox, EEGVIS, for exploring large-scale array data sets such as multi-channel EEG using multi-level viewing and drill-down techniques. The EEGVIS toolbox contains a prebuilt collection of visualization components and a supporting infrastructure that allows users to call a viewer (Figure 1 below) or a browser (Figure 6 below) at any point in their own MATLAB scripts to view and explore their array data. For example, the following MATLAB code creates a 32 × 1000 × 20 array of exponentially distributed data and then displays the data in a figure similar to Figure 1.
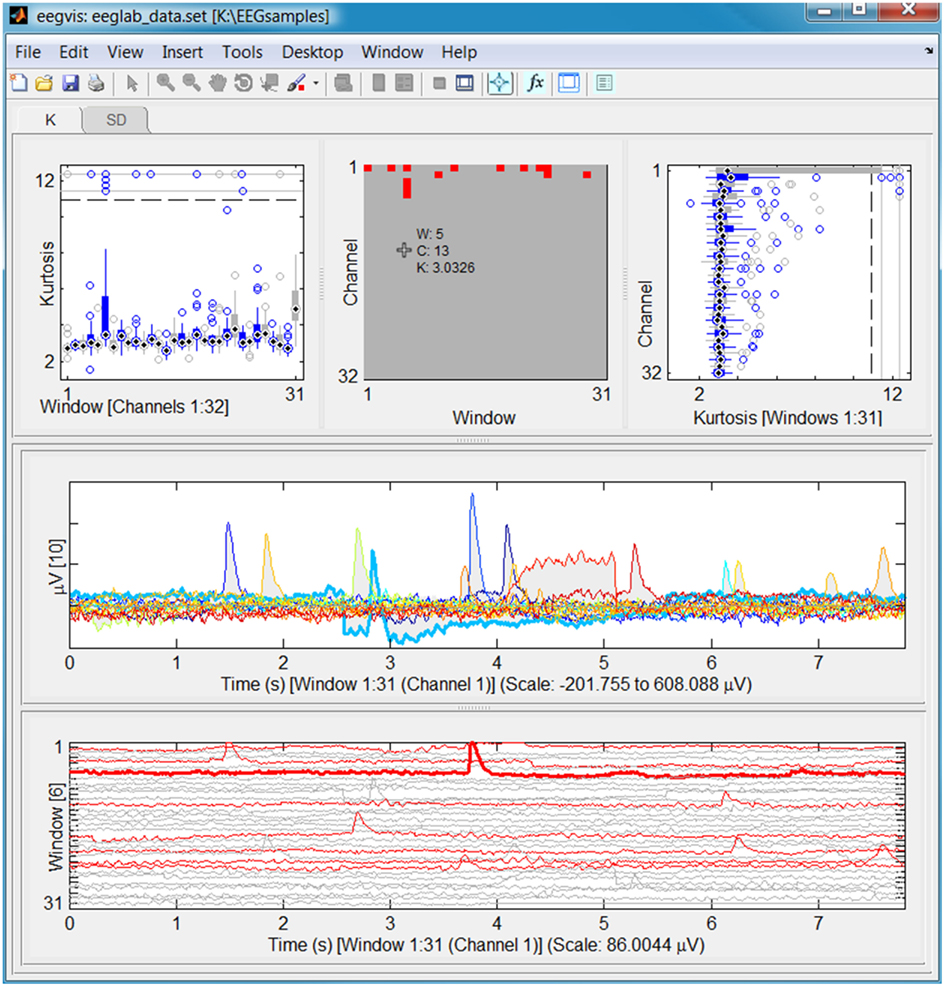
Figure 1. An EEGVIS figure window.
data = random(’exp’, 2, [32, 1000, 20]);

bv = eegvis(data);
The variable bv holds a handle to the resulting figure window. The default configuration assumes that the data should be summarized in dimension 2. In this example, summary functions are computed for 32 × 20 data windows of size 1000. Optional parameters control whether the data is epoched or whether the data represents continuous signals that can be reblocked using windows of a different size.
To use EEGVIS as an EEGLAB plug-in, users simply unzip the toolbox distribution in the EEGLAB plug-in directory. A compiled version of the eegvis application is also available as a standalone program that users can run on machines without MATLAB installed.
An EEGVIS visualization is a functional MATLAB figure built on our MoBBED views toolkit (Robbins, 2011) and the +uiextras package (Tordoff, 2011) from MATHWORKS. Users can customize visualizations and their interconnections without coding (as illustrated in the results). A special focus of this work is to provide GUI infrastructure for resizing, clicking and linking visualizations, and cursor exploration to users in a way that is transparent and easy to use.
Although using EEGVIS requires no programming, researchers who wish to convert their own displays into interconnected visualization components can do so by extending a base class in the toolkit (visviews.axisPanel) and providing the implementations of three functions: plot, getClicked, and updateString. Their visualizations are then available for inclusion in an EEGVIS figure window complete with resizing, linking, and cursor exploration. (The getClicked and updateString functions may be skipped if the user does not want this plot to be linkable to other plots or explorable with the cursor.) Additional details for programmers are available at Robbins (2011).
Results
Figure 1 shows a screen shot of the eegvis application using the default configuration to display the sample eeg_data.set file that comes with the EEGLAB distribution. The data set, which is approximately 30,000 frames in length, has been divided into 31 time windows of size 1,000. The top row displays a tab panel with three summary views of the kurtosis (tab K) and the standard deviation (tab SD) computed on the 31 data windows. The kurtosis tab is visible in Figure 1. The individual panels are separated by draggable dividers, so users can resize different sections to emphasize features.
The left panel displays individual box plots of the 32 channel kurtosis values for the corresponding windows. The middle panel displays a window × channel image of the same kurtosis distribution. The red pixels correspond to (window, channel) pairs whose kurtosis z-score is greater than 3 when compared with the entire data set. The right panel displays individual box plots corresponding to each channel over the entire data set.
The lower panels provide two detail views of a data slice, which the user selects by clicking somewhere in the summary views. The current user has clicked on the top box (corresponding to channel 1) in the right top panel. This click produces a data slice corresponding to all of the windows for channel 1, which the two detailed views display. If the user had clicked on the left or middle panels, the lower panels would show all channels for the selected window.
The middle and bottom panels are detail views selected by user clicks on the upper summaries. The middle panel shows the (max–min) silhouette of the overlaid windows as a gray shadow and draws an individual line for each window whose amplitude has a z-score greater than three at that time. The lower panel shows a traditional array plot of the 31 windows corresponding to channel 1. The red lines correspond to the windows of channel 1 with kurtosis values exceeding the overall z-score threshold. If the user clicks on one of the signal lines, the panel displays a thicker line and identifies the window in the y-axes label. Cursor exploration reads values from this selected line.
Users enter and leave “cursor exploration mode” by clicking the fourth icon from the right on the figure toolbar. When not in cursor exploration mode, the figure supports ordinary MATLAB pan and zoom within the figure panels. When in cursor exploration mode, the figure displays a continuous read out of the values associated with the current cursor position, as shown in the top middle panel of Figure 1. As the user sweeps the mouse over the figure, the individual panels continuously update their values, allowing rapid interrogation of the data values.
The figure shows immediately the eye blinks associated with channel 1 and reveals a slight distortion in window 6. A researcher wanting to assess whether an algorithm for eye blink removal such as ICA actually removed the eye blinks can use two EEGVIS windows side by side to compare how successfully the algorithm removed the blinks. Researchers can also view the result of subtracting processed data from original data to quickly evaluate the effect of an algorithm on the data. Other summary functions reveal other interesting features of the data set.
Configuration
Users can customize an EEGVIS view to fit the size and shape of the data. Figure 2 shows the GUI for configuring the summary functions (accessible by clicking the third icon from the end on the visualization toolbar). EEGVIS displays each enabled function in a separate summary tab using the function short name to identify the tab. The function definition is a string, and the user is free to use any function that produces a single value from a vector. Users can also set the threshold strategy, threshold levels, and display colors. Users may add new functions, edit existing functions, delete functions, and save and load function configurations.
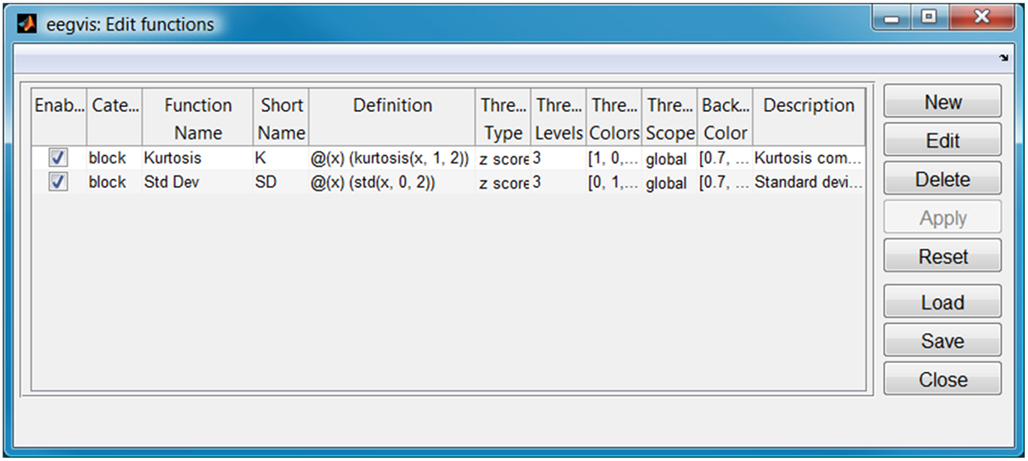
Figure 2. Configuration for summary functions of Figure 1 (displayed one per tab).
Figure 3 shows the GUI for selecting the plot panels to appear in the visualization (accessible by clicking the second icon from the end on the visualization toolbar). EEGVIS displays enabled summary visualizations in the upper tab panel and enabled detail visualizations vertically below the tab panel. The plot name uniquely identifies the panel, while the plot class determines the type of panel to be displayed. Users are free to use the same component multiple times with different property settings. The sources column controls how plots link for mouse clicks as described in the next section.
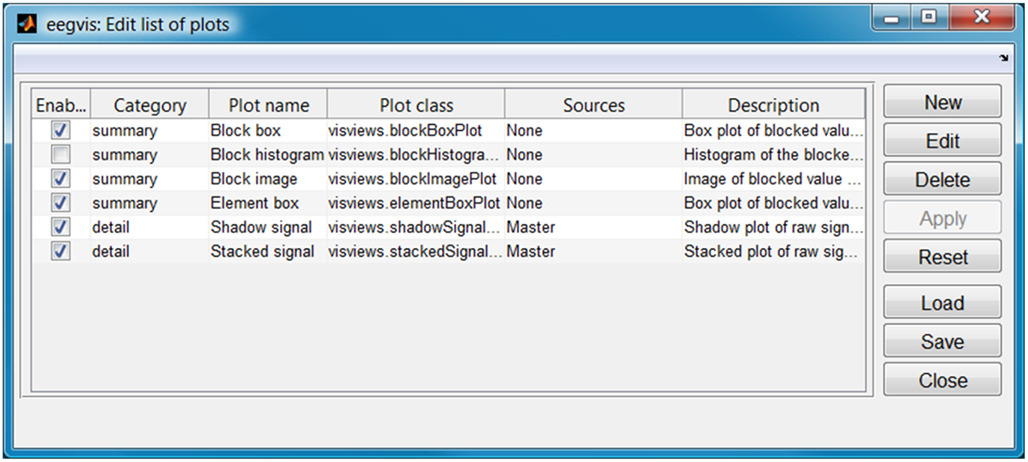
Figure 3. Configuration for display panels of Figure 1. Summary panels appear in the upper tab panels and detail panels appear below.
Figure 4 shows the GUI for configuring the properties of the individual visualization panels. Each visualization panel has a structure of public properties that are configurable. These properties automatically appear in the property manager when the user adds a panel to the visualization. Users may edit property values in a way similar to that supported by the MATLAB property manager and may also save and load the properties. When the user adds a plot in the plot configuration, its properties are automatically loaded in the property configuration GUI.
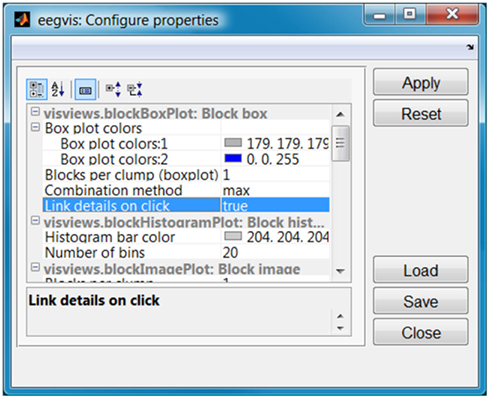
Figure 4. Property manager for the display panels of Figure 1.
Drill-Down for Large Data Sets
The visualization of Figure 1 works well for a dataset containing 30,000 time samples. Detailed views based on 30 blocks of 1,000 frames show a sufficient level of detail, particularly since zoom and cursor exploration can reveal details. However, datasets on the order of 1 M frames quickly exceed the pixel screen capacity for display. In EEGVIS, users can cascade summary views in an arbitrary display hierarchy to drill-down through successively more fine-grained summaries to details. The idea is that summary function values computed on blocks of say 1000 frames can themselves be summarized to provide a hierarchy of summaries.
Figure 5 shows the visualization of a data set with approximately 215 K frames organized in a three-level hierarchy. The left most summary panel shows 11 box plots, each representing a clump of 20 windows. When the user clicks on one of these boxes, the middle image plot shows the 20 windows in that clump. When the user clicks on the middle image plot, the detail panels show the signal in the corresponding window. In this figure the user selected the fourth box plot (a clump containing windows 61 through 80) in the left panel and then clicked on window 64 in the image panel. As a result, EEGVIS displayed the signals for window 64 (frames 64,001–65,000).
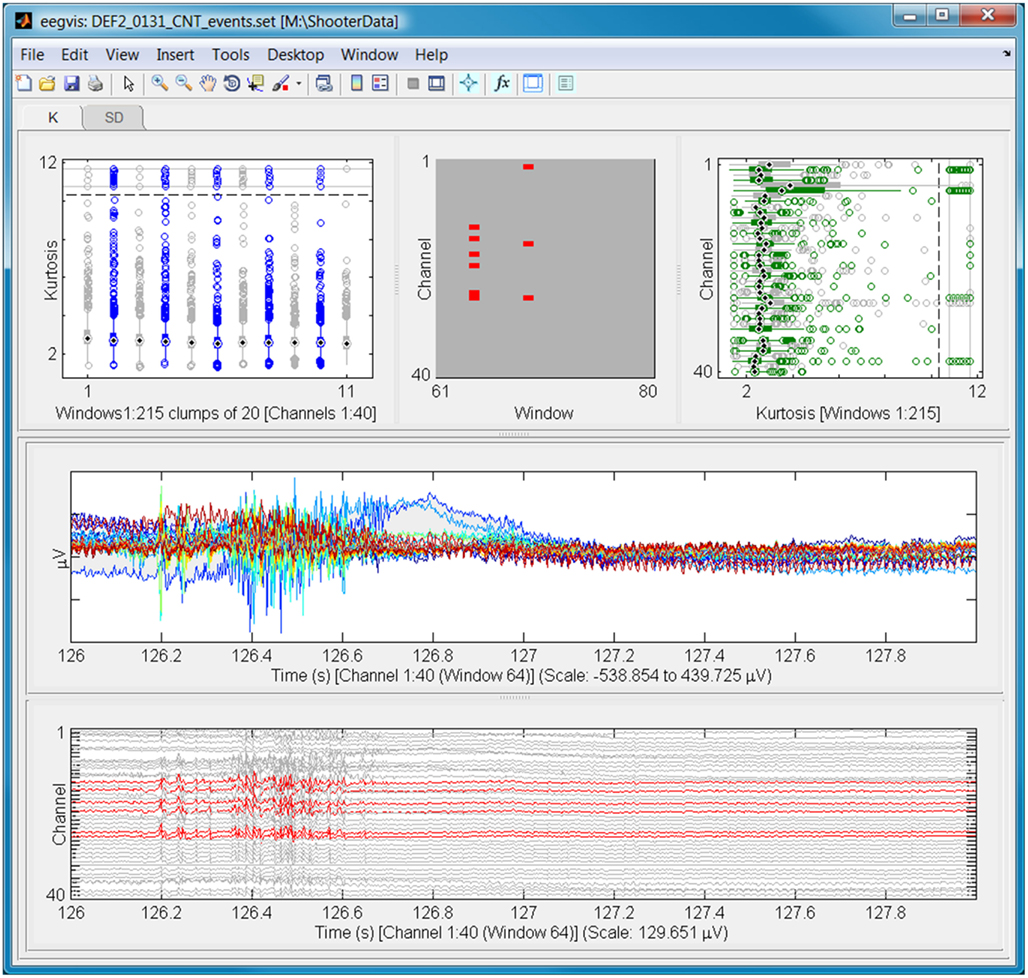
Figure 5. An example of EEGVIS for a data set with 215 K frames. The boxes in top left box plot show the distribution of summary values for all channels in clumps of 20 consecutive windows. The top middle image plot shows the distribution for the 20 windows in the selected clump (clump 3). The lower two panels show different views of the raw signals in window 64.
Users can create arbitrary hierarchies on the fly by specifying sources in the plot configuration as shown in Figure 6. The block image plot in the central panel of Figure 5 has the block box plot as its source. Panels can have an arbitrary number of sources or act as the source for an arbitrary number of panels. Furthermore, panels may be cascaded in an arbitrary number of levels to drill-down in very large datasets.
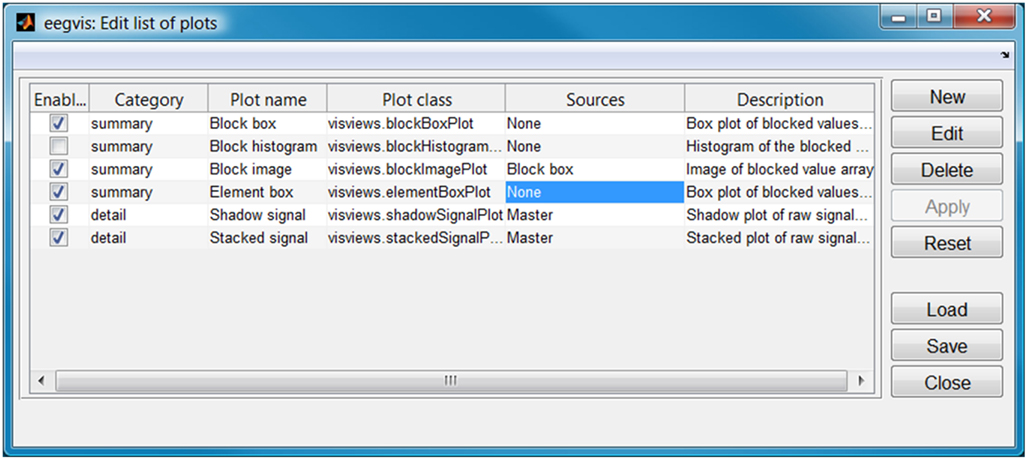
Figure 6. Configuration of plots and linking for Figure 5.
Browsing
When doing a study, researchers typically acquire many data sets and may want to quickly scan them or choose specific ones to load into the MATLAB workspace. Figure 7 shows an example of EEGBROWSE, a file previewer for EEGVIS that allows users to quickly step through a directory of EEG data. When the user clicks on a file name, EEGBROWSE displays the data in an EEGVIS figure window. For the settings shown in Figure 7, EEGBROWSE reuses the same figure window for fast display and does not actually load the data into the main user workspace. EEGBROWSE allows the user to pre-configure the functions, plots, and plot properties. The user may also save and load these configuration settings for future use.
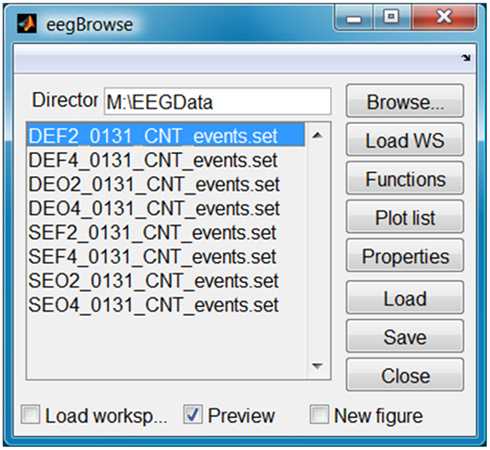
Figure 7. The EEGBROWSE GUI for exploring collections of data sets.
As a plug-in for EEGLAB, EEGBROWSE adds itself to the EEGLAB File menu to allow previewing of data before loading. EEGVIS adds itself to the EEGLAB Plot menu for visualization in the normal EEGLAB workflow. EEGBROWSE and EEGVIS both have pop versions for use in the EEGLAB scripting workflow. EEGBROWSE requires that EEGLAB be in the MATLAB path because it relies on the extensive EEGLAB library of functions for reading different formats of EEG data. EEGVIS is completely independent of EEGLAB and assumes array input data. We also provide a standalone version that can be used without MATLAB or EEGLAB installed.
Creating a New Summary Function
Good summary functions are the key to the effectiveness of the linked hierarchical summary strategy used by EEGVIS. This section illustrates the procedure for developing a new summary function. Summary functions compute a summary value along a specified dimension. For example, the function mean(x, 2) is a simple summary function that computes a summary (in this case the average) along dimension 2 for an array. If x is an m × n × k array, the result of mean(x, 2) is an m × 1 × k array. Although some of the underlying infrastructure does not assume a particular summary dimension, EEGVIS assumes that values will be summarized along dimension 2, which corresponds to the sample or frame dimension in EEGLAB. Thus, for visualization purposes, a user-developed summary function should produce the same size output as mean(x, 2) for different size vectors x. When writing a summary function, the user should test that summary function behaves this way before putting it into EEGVIS.
We now illustrate the steps in creating a user function. Bao et al. (2011) propose several EEG summary functions including power spectral intensity (PSI), which is the sum of the absolute values of the Fourier coefficients in a specified frequency band. The relative intensity ratio (RIR) is the ratio of PSI to the sum of the absolute value of the Fourier coefficients over the entire spectrum. We might want to compute PSI and RIR for a biologically relevant frequency band such as alpha (typically 8–12 Hz). A straightforward implementation of these algorithms presents some problems from a visualization perspective.
In unprocessed EEG, the signals from the eye channels have significantly larger power than other channels, and the global threshold used in EEGVIS shows the eye channels as outliers rather than revealing frequency structure. The RIR is better in this respect, since it computes PSI relative to the overall spectral intensity for the channel. However, in unprocessed EEG data, the DC and 60 Hz components may dominate the measure and therefore not reveal much structure in the alpha band.
To address these issues, we develop a general purpose function, bRatio, to calculate the RIR of two user-specified frequency bands. The bRatio function has four parameters: the data array (x), the sampling rate (sRate), a two-element vector specifying the endpoints of the numerator frequency band in Hz (topBand), and a two-element vector specifying the endpoints of the denominator frequency band in Hz (botBand). The following is a simplified implementation in the sense that it does no error checking and only works for arrays of dimension 3 or lower.

After calling the bRatio function in a MATLAB script to test that it works correctly, we can deploy the new summary in EEGVIS simply by putting the file in the MATLAB path (the helpers directory of EEGVIS is a standard location) and adding a line in the function menu as shown in Figure 8. Notice that we could add other items on the function menu using bRatio to show other ratios (alpha to theta for example) without additional programming.
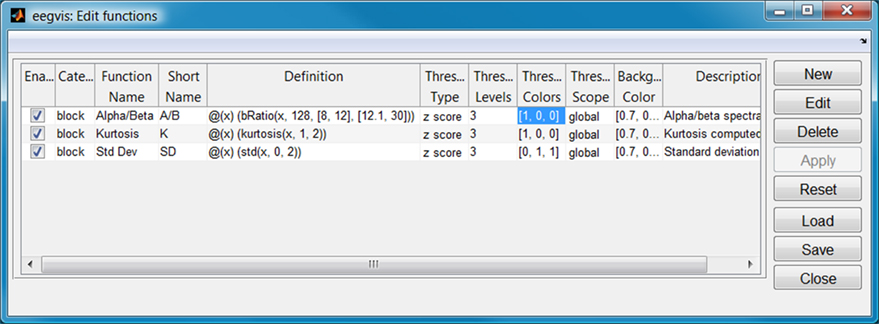
Figure 8. Configuration of the alpha/beta spectral intensity ratio summary function.
Figure 9 shows the resulting visualization for the sample EEG dataset included with EEGLAB. We have also included a scalp contour plot of the average alpha/beta ratio in the summary panels. The visualization shows that average ratio is highest around channel POz and that window 19 (starting frame 19001) has an anomalously high ratio in some channels. To see fine-grain average summaries, we could set the scalp map plot to have one of the other summaries as its source and use clumping of windows in that summary.
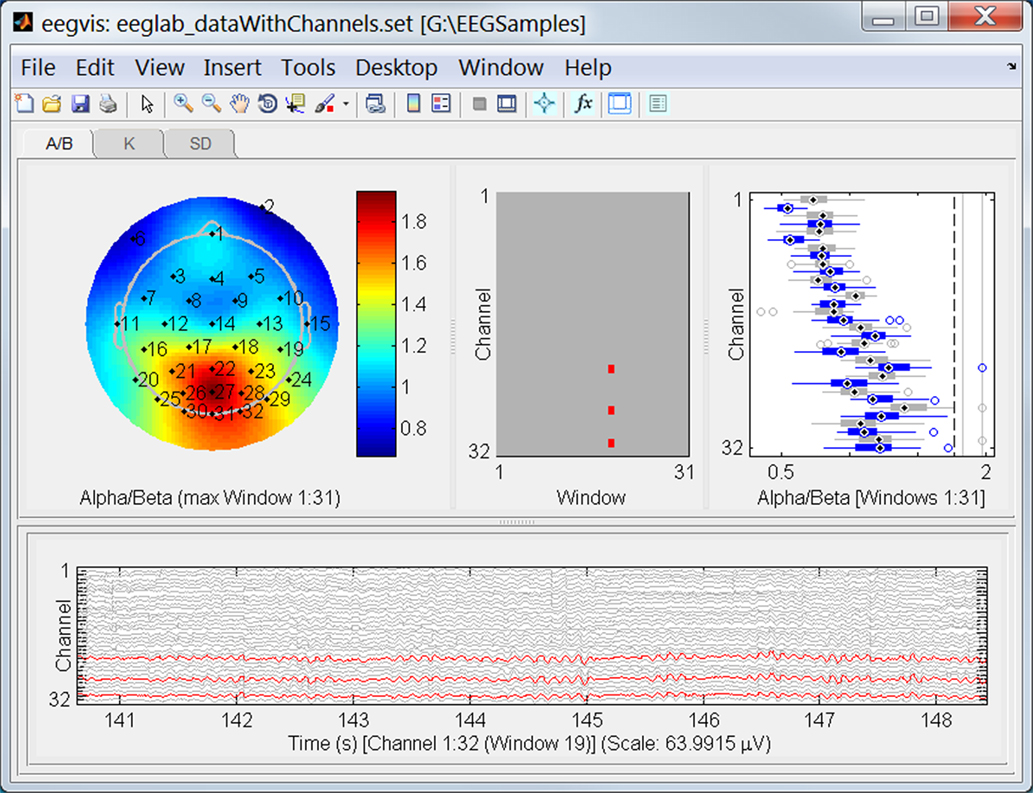
Figure 9. The EEGVIS visualization window for the same dataset as in Figure 1. The display shows the user-defined alpha/beta spectral intensity ratio summary function developed in Section “Creating a new summary function.”
The helpers directory of the EEGVIS distribution has a more completely implemented bRatio function and example unit tests for checking the size behavior.
Discussion
Three widely used open source toolkits for EEG/MEG analysis in MATLAB are EEGLAB (Delorme and Makeig, 2004), FieldTrip (Oostenveld et al., 2011), and BrainStorm (Tadel et al., 2011). EEGLAB offers a variety of visualizations and plug-ins for analysis and generates equivalent scripting commands that allow users to generate a scripting pipeline. EEGVIS integrates into EEGLAB as a plug-in and is meant to augment EEGLAB’s capabilities for providing summary, browsing, and overview. FieldTrip provides a wide range of functional capabilities accessible by scripting. Fieldtrip analysis scripts consist of a succession of calls to FieldTrip library functions interspersed with user analysis. Users can insert calls to EEGVIS anywhere in this pipeline to provide points of exploration and visual analysis. BrainStorm is an integrated self-contained MATLAB application that provides a variety of visualization tools oriented toward exploring short segments of data overlaid on 3D brain models. Users have the option of generating scripts encapsulating their analysis pipelines and their interaction with the BrainStorm interfaces. EEGVIS does not conflict with this pipeline, and the user could insert calls to EEGVIS in these scripts to provide summary visualizations. Users could also incorporate calls to EEGVIS within scripts that call functions from other pipeline-based MATLAB toolboxes such as BCILAB (Delorme et al., 2011) or from scripts to call special-purpose toolboxes such as BSMART (Cui et al., 2008).
EEGVIS is designed to enable users to produce summary visualizations tailored to their data by choosing summary functions and configuring views into a drill-down hierarchy. The examples shown in this paper used kurtosis and standard deviation for summary, but many other summaries are possible (Bao et al., 2011). Users can mix and match the existing visual components and specify how they are linked simply by filling in a text table. More technically oriented users can create their own integrated visualizations (including 3D visualizations) simply by extending the base classes provided with EEGVIS. EEGVIS requires MATLAB version 2010a or later and the MATLAB Statistics Toolbox. EEGVIS and its supporting toolkits and documentation are available at http://visual.cs.utsa.edu/eegvis as a single download, organized into a few top-level functions such as eegvis and eegbrowse that most users will be concerned with. The base classes and other infrastructure are hidden in packages for easier readability. Source code is maintained at github.
Conflict of Interest Statement
The author declares that the research was conducted in the absence of any commercial or financial relationships that could be construed as a potential conflict of interest.
Acknowledgments
The author acknowledges helpful conversations with Scott Kerick of the Army Research Laboratories as well as Marissa Westerfield, Christian Kothe, Nima Bigdely Shamlo, Alejandro Ojeda, Arnaud Delorme, and Scott Makeig, all of University of California San Diego. The data shown in Figure 5 was provided by Scott Kerick. Arif Hossain wrote an initial version the table GUI for configuration and Jeremy Cockfield was involved in testing the project. This research was sponsored by the Army Research Laboratory and was accomplished under Cooperative Agreement Number W911NF-10-2-0022. The views and conclusions contained in this document are those of the authors and should not be interpreted as representing the official policies, either expressed or implied, of the Army Research Laboratory of the U.S. Government. The U.S. Government is authorized to reproduce and distribute reprints for Government purposes notwithstanding any copyright notation herein.
References
Bao, F. S., Liu, X., and Zhang, C. (2011). PyEEG: an open source python module for EEG/MEG feature extraction. Comput. Intell. Neurosci. 2011, 7, doi:10.1155/2011/406391
Cui, J., Xu, L., Bressler, S., Ding, M., and Hulou, L. (2008). BSMART: a Matlab/C toolbox for analysis of multichannel neural time series. Neural Netw. 21, 1094–1104.
Delorme, A., and Makeig, S. (2004). EEGLAB: an open source toolbox for analysis of single-trial EEG dynamics including independent component analysis. J. Neurosci. Methods 134, 9–21.
Delorme, A., Mullen, T., Kothe, C., Akalin Acar, Z., Bigdely-Shamlo, N., Vankov, A., and Makeig, S. (2011). EEGLAB, SIFT, NFT, BCILAB, and ERICA: new tools for advanced EEG processing. Comput. Intell. Neurosci. 2011, 12, doi:10.1155/2011/130714
Oostenveld, R., Fries, P., Maris, E., and Schoffelen, J.-M. (2011). Fieldtrip: open source software for advanced analysis of MEG, EEG, and invasive electrophysiological data. Comput. Intell. Neurosci. 2011, 9, doi:10.1155/2011/156869
Robbins, K. A. (2011). Mobbed Views: A Basic Viewing Infrastructure for Mobile Brain-Body-Environment Decision-Making. Technical Report TR-2011-018, University of Texas at San Antonio, San Antonio.
Tadel, F., Baillet, S., Mosher, J. C., Pantazis, D., and Leahy, R. M. (2011). Brainstorm: a user-friendly application for MEG/EEG Analysis. Comput. Intell. Neurosci. 2011, 13, doi:10.1155/2011/879716
Tordoff, B. (2011). Gui Layout Toolbox. Available at: http://www.mathworks.com/matlabcentral/fileexchange/27758-gui-layout-toolbox
Keywords: MATLAB, visualization, EEG, EEGLAB, multi-scale, big data, cursor exploration, artifacts
Citation: Robbins KA (2012) EEGVIS: a MATLAB toolbox for browsing, exploring, and viewing large datasets. Front. Neuroinform. 6:17. doi: 10.3389/fninf.2012.00017
Received: 10 March 2012; Accepted: 16 April 2012
Published online: 28 May 2012.
Edited by:
Daniel Gardner, Weill Cornell Medical College, USAReviewed by:
Hualou Liang, Drexel University, USAFranc Donkers, University of North Carolina at Chapel Hill, USA
Andrew Michael Goldfine, Burke Medical Research Institute, USA
Copyright: © 2012 Robbins. This is an open-access article distributed under the terms of the Creative Commons Attribution Non Commercial License, which permits non-commercial use, distribution, and reproduction in other forums, provided the original authors and source are credited.
*Correspondence: Kay A. Robbins, Department of Computer Science, University of Texas at San Antonio, One UTSA Circle, San Antonio, TX 78249, USA. e-mail: krobbins@cs.utsa.edu