Whole Brain Magnetic Resonance Image Atlases: A Systematic Review of Existing Atlases and Caveats for Use in Population Imaging
 David Alexander Dickie1,2*†
  Susan D. Shenkin1,3,4†
  Devasuda Anblagan1,2,5
  Juyoung Lee6
  Manuel Blesa Cabez5
  David Rodriguez1,2
  James P. Boardman5
  Adam Waldman1
  Dominic E. Job1,2
  Joanna M. Wardlaw1,2,4*
- 1Brain Research Imaging Centre, Neuroimaging Sciences, Centre for Clinical Brain Sciences, Royal Infirmary of Edinburgh, The University of Edinburgh, Edinburgh, UK
- 2Scottish Imaging Network, A Platform for Scientific Excellence (SINAPSE) Collaboration, Glasgow, UK
- 3Geriatric Medicine Unit, Royal Infirmary of Edinburgh, The University of Edinburgh, Edinburgh, UK
- 4Department of Psychology, Centre for Cognitive Ageing and Cognitive Epidemiology, The University of Edinburgh, Edinburgh, UK
- 5MRC Centre for Reproductive Health, Queen's Medical Research Institute, Edinburgh, UK
- 6Graduate Training Centre of Neuroscience, International Max Planck Research School, University of Tübingen, Tübingen, Germany
Brain MRI atlases may be used to characterize brain structural changes across the life course. Atlases have important applications in research, e.g., as registration and segmentation targets to underpin image analysis in population imaging studies, and potentially in future in clinical practice, e.g., as templates for identifying brain structural changes out with normal limits, and increasingly for use in surgical planning. However, there are several caveats and limitations which must be considered before successfully applying brain MRI atlases to research and clinical problems. For example, the influential Talairach and Tournoux atlas was derived from a single fixed cadaveric brain from an elderly female with limited clinical information, yet is the basis of many modern atlases and is often used to report locations of functional activation. We systematically review currently available whole brain structural MRI atlases with particular reference to the implications for population imaging through to emerging clinical practice. We found 66 whole brain structural MRI atlases world-wide. The vast majority were based on T1, T2, and/or proton density (PD) structural sequences, had been derived using parametric statistics (inappropriate for brain volume distributions), had limited supporting clinical or cognitive data, and included few younger (>5 and <18 years) or older (>60 years) subjects. To successfully characterize brain structural features and their changes across different stages of life, we conclude that whole brain structural MRI atlases should include: more subjects at the upper and lower extremes of age; additional structural sequences, including fluid attenuation inversion recovery (FLAIR) and T2* sequences; a range of appropriate statistics, e.g., rank-based or non-parametric; and detailed cognitive and clinical profiles of the included subjects in order to increase the relevance and utility of these atlases.
Introduction
Structural magnetic resonance imaging (MRI) brain atlases, frequently also referred to in the literature as templates, are important tools for research and, increasingly, clinical practice. Individual brain scans from several individuals can be combined to form a brain image bank, which can in turn be used to form a brain atlas—an anatomical representation of the brain showing group-wise or study population global or regional brain features.
The terms “brain atlas” and “brain template” have both been used commonly in the literature to date; while they may have different meanings in some situations, many papers do not make this clear but rather appear to use the terms interchangeably. Therefore, for the interests of this paper, we focus on using the term “atlas” but use both terms interchangeably. Atlases are derived by statistically summarizing, e.g., averaging, voxel-wise, regional, or global brain MRI measures from several individuals and they may be used in research as registration targets for functional activation, segmentation, and statistical mapping, for example in analysis of population imaging datasets (Good et al., 2001; Buckner et al., 2004; Avants et al., 2008). In the future, atlases may also be used in clinical practice as reference images to support diagnoses of age-related neurodegenerative disorders (Farrell et al., 2009); therefore their reliability and relevance to the clinical population on which they are being used is paramount.
Brain structure in old age and early life is different to brain structure in younger and middle-aged adults (Gur et al., 1991; Courchesne et al., 2000; Good et al., 2001; Sowell et al., 2003). For example, the developing brain presents specific challenges to atlas construction because of marked variations in head size and shape in early life, maturational processes leading to changes in signal intensity profiles (for example, reducing brain water content and increasing cell density over the perinatal period), relatively lower spatial resolution (cortical patterning at term birth is broadly similar to adult patterns but is approximately one third of the volume at adulthood), and lower contrast between tissue classes (Matsuzawa et al., 2001). In children >5 years, the brain is still developing at an accelerated rate. These issues invalidate the application of adult atlases to data acquired during development, because of misclassification of tissues and structures (Muzik et al., 2000; Yoon et al., 2009), and have led to the development of age-specific atlases for early life studies.
In older age the ventricles, particularly the lateral ventricles, and sulci spaces are generally larger, the gray matter and white matter atrophy in varying proportions, and white matter hyperintensities (WMH) are often present (Lemaitre et al., 2005; Dickie et al., 2015b, 2016b). These and the other many features of brain aging, e.g., lacunes, microbleeds and enlarged perivascular spaces, require specific T2-based sequences, such as fluid attenuated inversion recovery (FLAIR) and T2*, to be captured effectively (Wardlaw et al., 2013). Because of these differences in brain structure, the use of an atlas based on only younger subjects and a limited range of sequences can create a bias in life course population studies, e.g., systematic overexpansion (Buckner et al., 2004) or regional distortion of older brains. Even within restricted age bands brain structure is highly variable due to various factors such as ethnicity, medical history, e.g., hypertension, smoking and cognition (Farrell et al., 2009; Wardlaw et al., 2011). Therefore, population brain atlases must include information on age, sex, ethnicity, relevant medical history, and cognitive testing to have broad uses and relevance. Further, brain atlases should be derived using statistical methods that effectively characterize the wide and irregular variance in brain structure across the life course (Dickie et al., 2013). Attempts to understand this variation and create brain atlases have increased exponentially with the advent of MR and other non-invasive imaging techniques but the origins of this pursuit extend back many thousands of years.
The gyral and sulcal pattern of the human brain is thought to have been first described in 3000 B.C. by Imhotep, an Egyptian “god” of medicine (Adelman and Smith, 1987). Although study of the structure of the brain continued for more than 4500 years, it was not until 1664 when Thomas Willis published Cerebri Anatome (“Anatomy of the Brain”) that robust methods for measuring brain structure started to be developed (O'connor, 2003). Willis directed novel autopsies of the brain in which it was first removed from the skull, in contrast to the traditional in situ dissections of the time, and then sliced from the base upwards. The slices were then viewed with a microscope and drawn by Christopher Wren (O'connor, 2003). These 350 year old drawings arguably represent the first attempt to create a brain atlas but more detailed atlases of the brains' cyto- and myelo-architecture did not emerge until the late nineteenth/early twentieth century (Betz, 1874; Brodmann, 1909, 1994; Von Economo and Koskinas, 1925). Such atlases are useful to understand the distribution of tissue types and fibers, but they have little use in modern clinical practice. One of the first clinically relevant atlases was published by Talairach et al. (1967), who developed a 3D coordinate system to assist deep-brain surgery.
The subsequent Talairach and Tournoux atlas (Talairach and Tournoux, 1988) has become one of the most influential atlases in brain imaging (Evans et al., 2012). This atlas provides a standardized set of coordinates to determine specific sites within the brain. It has been used to describe the site of a biopsy, or to compare data from structural MRI, functional MRI (fMRI), SPECT, and PET studies. However, the Talairach and Tournoux atlas has been described as “woefully inadequate” (Toga and Thompson, 2007). The reasons for this, including that it was derived from a single fixed cadaveric brain from an elderly female with limited clinical information, have been listed by many and well-known since the atlases' inception (Evans et al., 1993, 2012; Devlin and Poldrack, 2007). Indeed, they were noted in the original author's foreword, “this method is valid with precision only for the brain under consideration” (Talairach and Tournoux, 1988), but this may not be commonly known amongst users of this and derived atlases, e.g., Montreal Neurological Institute (MNI)152 (Brett et al., 2001). Population brain atlases, many of which were descended from Talairach (Evans et al., 2012), may therefore be lacking in age-appropriate, clinically, and cognitively described subjects that were synthesized via appropriate image analysis and statistical methods. It is for this reason that we undertook the following systematic review to identify, collate, and describe existing structural MRI brain atlases.
In this review, we aim to summarize the currently available structural MRI brain atlases across the life span—published in journals and/or on the internet—for researchers in population based imaging. Following our review we discuss the practical, technical, and statistical considerations that should be borne in mind when using brain image atlases.
Materials and Methods
We followed “Preferred reporting items for systematic reviews and meta-analyses (PRISMA)” reporting guidelines (Moher et al., 2009) in preparation of this manuscript. From October 2010 to April 2015, we systematically searched for “normal” brain structural MRI atlases. From April 2015 to August 2016, we supplemented this search with: hand searching of reference sections in previous review articles and records we included here (e.g., Mazziotta et al., 2001; Toga et al., 2006; Evans et al., 2012); periodical searching of Google with a subset of these terms; review of content alerts distributed by relevant journal articles, e.g., NeuroImage (http://www.journals.elsevier.com/neuroimage/), Human Brain Mapping [http://onlinelibrary.wiley.com/journal/10.1002/(ISSN)1097-0193], and Frontiers in Neuroscience (https://www.frontiersin.org/journal/neuroscience); and, finally, hand searching of neuroimaging data sharing initiatives NeuroVault (http://neurovault.org/) and NITRC (http://www.nitrc.org/). Two authors (DAD and JYL) independently and systematically searched PubMed (including MEDLINE; http://www.ncbi.nlm.nih.gov/pubmed/), and the internet using Google (http://www.google.co.uk/) and Google Scholar (http://scholar.google.co.uk/) with the terms: “Magnetic Resonance Imaging” or “Magnetic Resonance Image” or “Magnetic Resonance Images” or “MRI” or “MR” and “brain” and “template” or “atlas” or “stereotactic” or “stereotaxic” and “human.”
October 2010-August 2016 was the time during which we conducted our search, there were no publication date restrictions on eligibility for inclusion and we included all normal MRI atlases of whole brain structures from across the lifespan. We included atlases with “anatomical” or “structural” sequences and probability maps, e.g., T1-, T2-, T2*-, FLAIR-weighted images, and gray matter (GM), white matter (WM), and cerebrospinal fluid (CSF) probability maps. We did not include atlases solely of segmented regional structures (ROI), such as subcortical GM or individual cortical areas (e.g., Westbury et al., 1999; Ahsan et al., 2007), or histological sections (e.g., Eickhoff et al., 2005), but did include atlases that had whole brain and regional structures. We excluded: (1) non-human brain atlases, e.g., macaque; (2) diffusion or functional MRI connectively atlases without anatomical/structural components, e.g., JHU ICBM-DTI-81 and NTU-90 (Yeh and Tseng, 2011); (3) functional MRI brain atlases only, e.g., http://www.brainmap.org/; (4) records that described atlas methods only (e.g., Maldjian et al., 2003; Wilke et al., 2008; Van Leemput, 2009; Chen et al., 2012); and (5) atlases that included patients with known neurological or central nervous system disease, e.g., Alzheimer's disease (Desikan et al., 2006; Loni, 2011).
We provide information reported in each structural MRI brain atlas on the number, age, and sex of participants; sequences collected; statistical derivation method; and clinical/cognitive data found.
Results
We identified 543 potentially eligible records (Figure 1) of which 66 met inclusion criteria. Descriptions of each atlas are provided in Table 1.
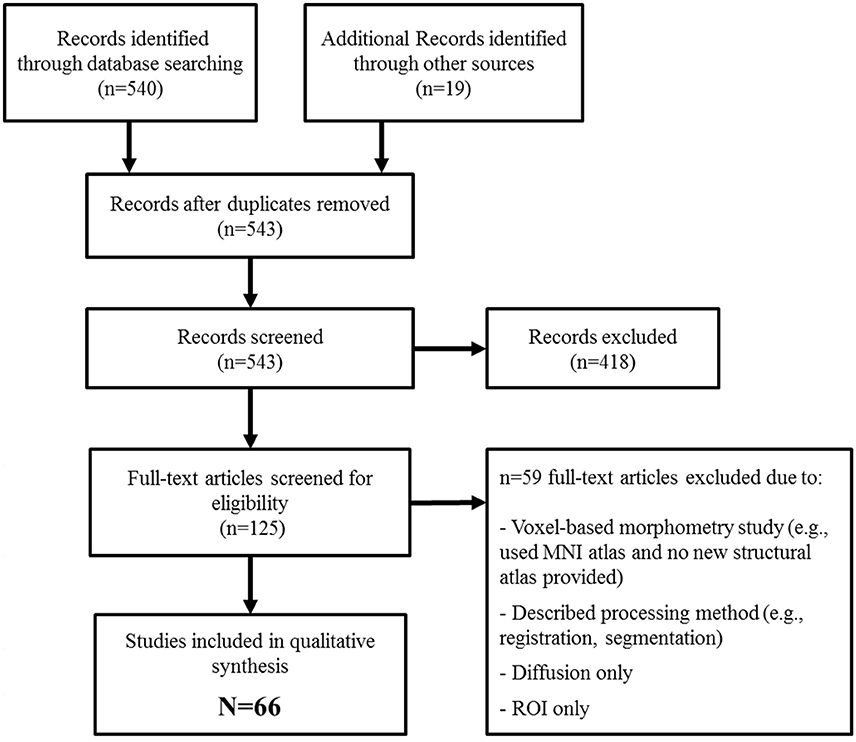
Figure 1. PRISMA flow diagram of systematic identification of whole brain structural MRI atlases.
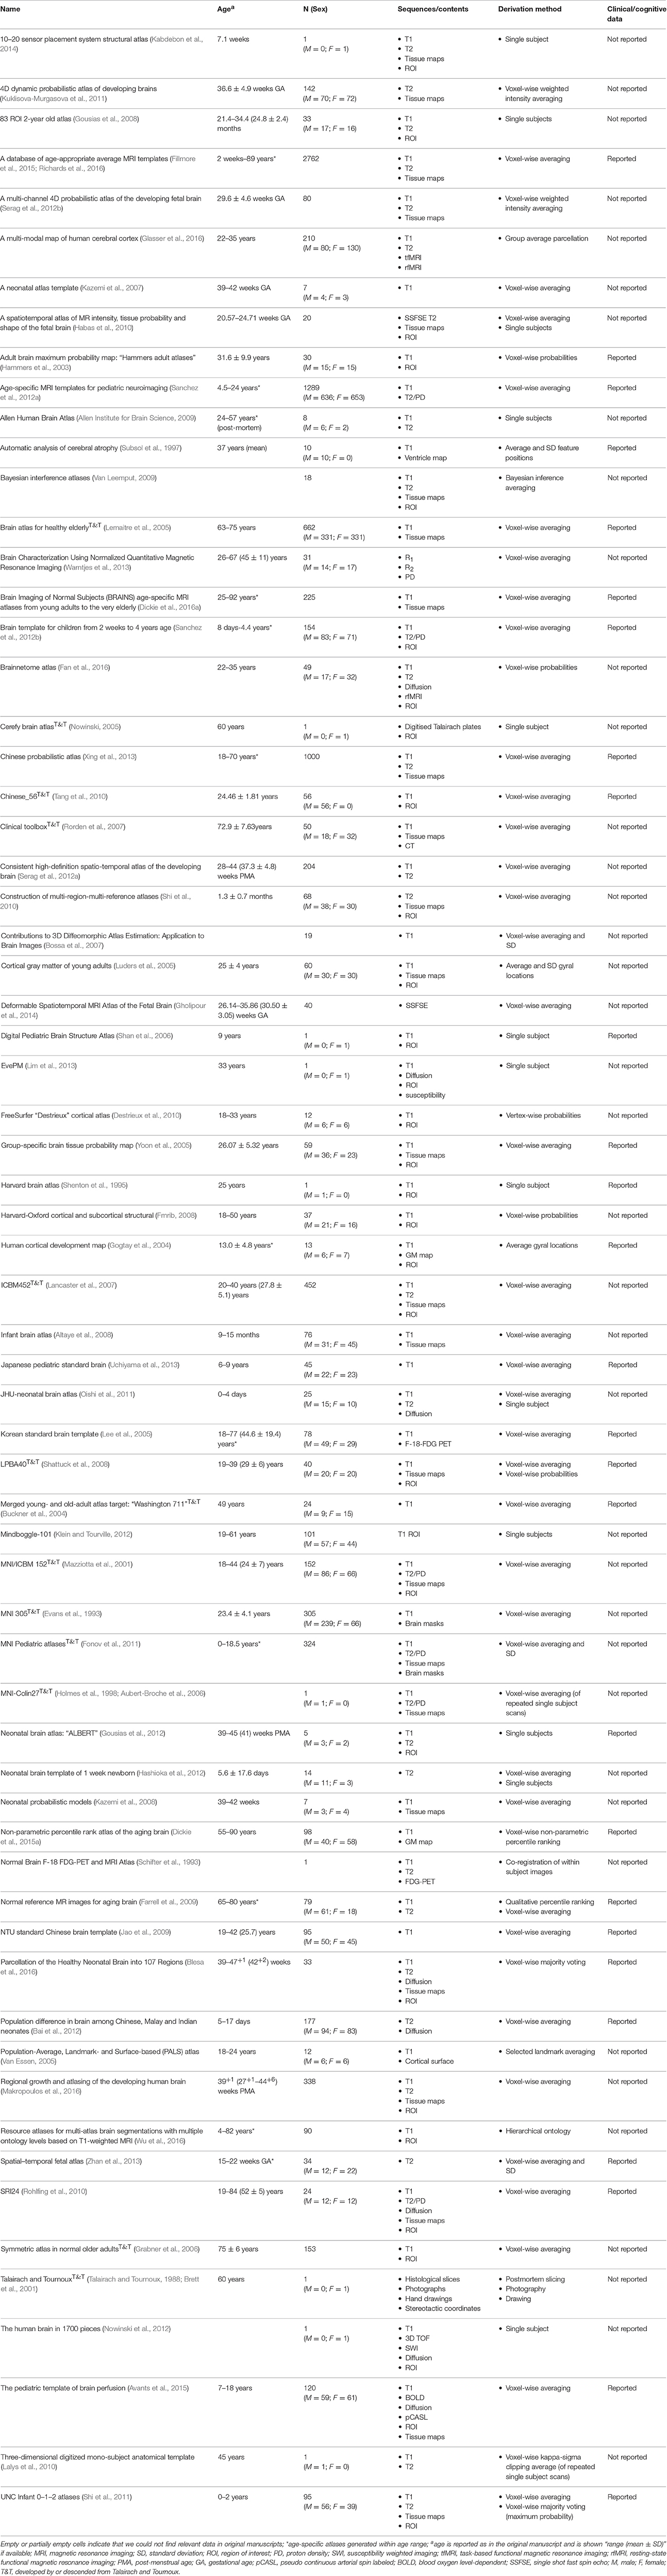
Table 1. Whole brain structural MRI atlases (alphabetical order by name).
We found 66 structural brain MRI atlases with a total of 10,354 subjects (median = 43, mean = 157, range = 1–2762), including European, North American, Chinese, Japanese, Korean, Indian, and Malay participants.
We identified 19 fetal, neonate and infant (0–5 years); six childhood (5–18 years); 23 young or middle aged adult (18–60 years); seven older adult (aged >60 years); and six life-course atlases including several age groups. Five atlases did not report the age of included subjects.
Twenty-seven atlases (41%) reported cognitive/clinical data but this was generally in summary form, e.g., “subjects had no history of neurological, psychiatric or other significant medical illnesses” (Lee et al., 2005) rather than summarized measures from individual subjects. One atlas of the elderly brain reported data on age, handedness, MMSE, education level, and proportion of hypertensive subjects (Lemaitre et al., 2005), but we found no atlas that reported a comprehensive battery of cognitive, medical, and demographic data that are increasingly found in large cohort studies (Wardlaw et al., 2011; Deary et al., 2012).
All atlases were based on T1, T2, and/or PD structural sequences. No atlas included FLAIR or T2* sequences. Almost all multiple subject atlases (except Farrell et al., 2009; Dickie et al., 2015a); were derived using parametric mean-based methods rather than non-parametric percentile ranks or ranges.
Some atlases used the same publicly available databases, e.g., Open Access Series of Imaging Studies (OASIS) data were used in at least two atlases (Dickie et al., 2015a; Richards et al., 2016). We were not able to quantify the subject overlap between atlases as subject identifiers were generally not provided. Ten atlases were based on a single subject. We identified 13 atlases (19.7%) that were developed by or descended from Talairach and Tournoux (labeled “T&T” in Table 1).
Discussion
Brain atlases are an important resource for neuroanatomical definition and are often the basis for automated image analyses, which are likely to become increasingly used for population imaging studies. It is important that users are aware of the origins and assumptions underlying these atlases. We identified 66 whole brain structural MRI atlases with a total of 10,354 “normal” subjects from 15 weeks gestational age to 92 years. The number of subjects in each atlas was generally rather small (median = 43; mean = 157; range = 1–2762; n ≥ 100 = 18; n ≥ 1000 = 3) given that several hundreds or even thousands of subjects are required to represent population brain structure adequately (Mazziotta et al., 2001; Toga, 2002; Toga et al., 2006; Evans et al., 2012). Only 622 subjects (6%) had measures of medical, cognitive, and demographic data to support their classification as normal (Lemaitre et al., 2005). Thirteen atlases (~20%) were descended from the Talairach and Tournoux atlas (Talairach and Tournoux, 1988), e.g., MNI, ICBM, and “Brain atlas for healthy elderly.”
Specific populations should be analyzed using an atlas derived from other subjects in that population, or a closely relevant population, otherwise systematic errors may be introduced, e.g., the overexpansion of atrophied brains registered to younger subject atlases (Buckner et al., 2004). Relevant to this, we suggest that the most appropriate atlas for a given study (should there be multiple atlases available with similar demographic, clinical, and cognitive profiles) is the one which requires the least amount of global or regional warping from native subject space to atlas space (and vice-versa). The consequences of various degrees of processing and warping individual subjects to an atlas space have previously been analyzed and discussed (Dickie et al., 2015a). The presence of cognitive deficits and medical conditions, e.g., vascular risk factors, also affect brain structure (Ritchie et al., 2015; Dickie et al., 2016b) and therefore it is essential for this information to be measured and tabulated in brain atlases. Although we appreciate that such depths of data may be difficult and expensive to acquire their strong influence on brain structure makes them imperative for understanding the appearance and structure of brain atlases. Medical, cognitive, and demographic data that may be useful in understanding the structure of atlases at different stages of life have been described previously (Job et al., 2016). Given the wide variation and features of brain structure across the life course (Good et al., 2001; Sowell et al., 2003; Allen et al., 2005; Raz et al., 2010), reliable studies, particularly at the extremes of life, require atlases with many more subjects including clinical and cognitive data and additional structural MRI sequences, e.g., T2-based sequences for measuring burden of small vessel disease (Wardlaw et al., 2013).
Such “big-data” approaches including a wide number of imaging sequences and supporting textual information have been successfully applied in studies with limited age ranges such as the “Human Connectome Project” which aims to map structural and functional connections in the healthy brain between ages 22 to 35 years (Van Essen et al., 2012) and UK Biobank (Miller et al., 2016). The challenge is to collect similarly rich and relevant data, including sequences such as T2* and FLAIR and vascular risk factor measures for appropriately characterizing cerebrovascular and cognitive development/aging effects on brain structure, at the extremes of life. An international collaborative and aggregative approach may be the best way of achieving this goal as was recently agreed by a panel of experts in structural brain mapping in 2014 (Job et al., 2016) and as is evidenced in similar efforts in functional imaging (Zuo et al., 2014). Although there are challenges to aggregating brain MRI from multiple centers/scanners, particularly in functional connectomics (Zuo and Xing, 2014), these issues have received great attention (e.g., Gountouna et al., 2010; Gradin et al., 2010) and the variability between scanners has often shown to be nominal compared to the great variability in brain structure among even people of the same age, gender, and cognitive status (Dickie et al., 2013; Ritchie et al., 2015; Miller et al., 2016).
High resolution structural MRI is increasingly used in population imaging to study brain development in fetal (pre-birth), neonatal (birth to 4 weeks corrected gestational age) and pediatric (1 month to 18 years) populations because of its utility to: provide quantitative measures of typical brain growth; map atypical growth following complications such as preterm birth, perinatal asphyxia and stroke; evaluate tissue effects of neuroprotective treatment strategies; identify the neural substrates of long-term neurodevelopmental impairments; and because it has potential to uncover early life origins of adult neurological and psychiatric disease. All of these applications benefit from the anatomic context provided by atlases.
There are challenges in analyzing structural images in early and late life. These begin during image acquisition and extend into image analysis. For example, infant participants are asleep during scanning while adults are usually awake; motion artifacts are generally low in mid-life but increase at the extremes of life; and heart and respiratory rates also vary greatly through life (Zuo et al., 2017). Brain structural patterns also very greatly though life: in early life growth is rapid and head shape and size varies, with a changes in tissue composition and relatively low spatial resolution (Matsuzawa et al., 2001). In older people there is accelerated brain tissue loss, reduced cortical contrast, white matter disease, enlarged perivascular spaces, stroke infarcts, and microbleeds, among other features (Raz et al., 2010; Wardlaw et al., 2013; Dickie et al., 2016b). There have been several (N = 19) fetal, neonate, or infant (<age 5) atlases published, but our review found relatively limited age-specific childhood (N = 6: >5 and <18 years) and older adult atlases (N = 7: >60 years) compared to young/middle-aged adult atlases (N = 23). Despite their current under-representation in the literature, age-specific atlases in childhood, and old age may have important uses in research and clinical practice, such as providing targets for aiding classification and diagnoses of developmental and neurodegenerative diseases (Farrell et al., 2009; Dickie et al., 2013, 2014), particularly since better understanding of normal development, aging, and dementia prevention are major focuses of many large population studies.
Most atlases we found were based on mean/parametric statistics and designed to provide a standard space for voxel-wise analyses or support tissue/ROI volume segmentation. In contrast, the “Normal reference MR images for the brain” atlas was based on qualitatively determined percentile ranks of brain volumes during normal aging and designed to support clinical diagnoses of whole brain volume loss in aging (65–70 and 75–80 year old) patients (Farrell et al., 2009). These clinical atlases are designed to “calibrate” differences in perception between neuroradiologists and have been of growing interest and in increased use since their inception in 2009 (Farrell et al., 2009; Hoggard, 2009; Job et al., 2016). Additionally, increased interest in use of computational automated image processing in clinical practice, e.g., to assess brain, hippocampus, or white matter lesion volumes, relies on availability of relevant and reliable age-relevant atlases. Atlases based on parametric statistics, e.g., mean and standard deviation, are not suitable to define the irregular brain volume distributions in old age (Dickie et al., 2013, 2015a). Therefore, non-parametric statistics were recently applied quantitatively to derive voxel-based percentile ranks and limits of normal aging GM, but this atlas was limited by the use of only T1 sequences and a wide age range (Dickie et al., 2015a). Further, work in developing non-parametric distributional representations of the brain, including a broad range of sequences in well-described (cognitively and medically) age-specific groups, may lead to clinically useful atlases for supporting diagnoses of developmental and neurodegenerative disease (Farrell et al., 2009; Wardlaw et al., 2013; Dickie et al., 2014).
The strengths of our review include the use of structured methods, that were reported following the PRISMA Guidelines (Moher et al., 2009), over ~6 years. We also conducted an exhaustive manual search of printed and online materials, and provided a structured evaluation of brain atlases according to pre-specified criteria. This allowed us to produce a holistic review of structural MRI brain atlases from across the life course in detail that we have not found previously. But despite these strengths, our review also has some limitations. The atlases we found were openly published, and identified through a formal search thus we may not have identified all relevant atlases, e.g., those described as part of larger studies (and therefore potentially not visible through traditional search methods) or those not published/openly accessible. We report data as described in the paper or website, and it is possible that additional data, e.g., on subjects' age, sex, clinical information, was collected and may have been published elsewhere. We did not contact authors for additional information. Further, we did not investigate potential uses for atlases beyond those described in the original manuscripts/sources. It could be that any one of these atlases may be modified to serve additional purposes. Related to this, we described the methods and uses of each atlas according to our interpretation of the source manuscripts/reference manuals, which may differ from the meaning intended by the original authors.
Notwithstanding these limitations, we have reviewed and described structural MRI brain atlases from across the life course and found that they were mostly of modest size with limited supporting subject information, developed with restricted image sequences for specific processing purposes, and that childhood and elderly populations were under-represented. We conclude that there is a continuing need for multi-sequence structural MRI, and the associated clinical, medical, and demographic data, collected in population imaging studies to be made widely available (with appropriate legal and ethical approvals) to create non-parametric brain atlases that adequately reflect the variability and features of brain changes throughout the life course. Brain image databanks, such as Brain Imaging in Normal Subjects (BRAINS; https://www.brainsimagebank.ac.uk/; Job et al., 2016), should work together to maximize sample sizes, generalizability and optimize data use to benefit analyses in population imaging studies and in future clinical practice.
Author Contributions
DAD and JL conducted systematic searches of the literature and internet. DAD, SS, JL, DA, MBC, and JB, conducted hand searching and reviewing of the literature and internet. DAD and SS wrote the manuscript. DAD, SS, JL, DA, MBC, JB, AW, DR, DJ, and JW edited the manuscript. DAD, SS, DR, DJ, and JW conceptualized and designed the study.
Conflict of Interest Statement
The authors declare that the research was conducted in the absence of any commercial or financial relationships that could be construed as a potential conflict of interest.
Acknowledgments
The authors would like to gratefully acknowledge and thank the following centres and funders. This work was carried out in The University of Edinburgh Brain Research Imaging Centre (BRIC; http://www.bric.ed.ac.uk/) within the Department of Neuroimaging Sciences. BRIC is part of the Scottish Imaging Network, A Platform for Scientific Excellence (SINAPSE) collaboration (http://www.sinapse.ac.uk/), funded by the Scottish Funding Council, Scottish Executive Chief Scientist Office, and the six collaborator Universities. Professor JW was funded by the Scottish Funding Council and Scottish Executive Chief Scientist Office through the SINAPSE collaboration. DAD was funded by a SINAPSE industrial collaboration (SPIRIT) Ph.D. scholarship, a Medical Research Council (MRC) scholarship, and the Tony Watson Scholarship bequest to The University of Edinburgh; and is currently funded by Innovate UK. Dr. DJ was funded by Wellcome Trust Grant 007393/Z/05/Z. Funding from Edinburgh and Lothians Health Foundation 53/311 and BBSRC Sparking Impact SI 2013-0210 is gratefully acknowledged. The University of Edinburgh Centre for Cognitive Aging and Cognitive Epidemiology (SS) is part of the cross council Lifelong Health and Wellbeing Initiative (G0700704/84698). Funding from the Biotechnology and Biological Sciences Research Council, Engineering and Physical Sciences Research Council, Economic and Social Research Council, Medical Research Council is also gratefully acknowledged.
References
Ahsan, R. L., Allom, R., Gousias, I. S., Habib, H., Turkheimer, F. E., Free, S., et al. (2007). Volumes, spatial extents and a probabilistic atlas of the human basal ganglia and thalamus. Neuroimage 38, 261–270. doi: 10.1016/j.neuroimage.2007.06.004
Allen Institute for Brain Science (2009). Allen Human Brain Atlas. Available online at: http://human.brain-map.org/mri_viewers/data (Accessed August 26, 2013).
Allen, J. S., Bruss, J., Brown, C. K., and Damasio, H. (2005). Normal neuroanatomical variation due to age: the major lobes and a parcellation of the temporal region. Neurobiol. Aging 26, 1245–1260. doi: 10.1016/j.neurobiolaging.2005.05.023
Altaye, M., Holland, S. K., Wilke, M., and Gaser, C. (2008). Infant brain probability templates for MRI segmentation and normalization. Neuroimage 43, 721–730. doi: 10.1016/j.neuroimage.2008.07.060
Aubert-Broche, B., Evans, A. C., and Collins, L. (2006). A new improved version of the realistic digital brain phantom. Neuroimage 32, 138–145. doi: 10.1016/j.neuroimage.2006.03.052
Avants, B. B., Duda, J. T., Kilroy, E., Krasileva, K., Jann, K., Kandel, B. T., et al. (2015). The pediatric template of brain perfusion. Sci. Data 2, 150003. doi: 10.1038/sdata.2015.3
Avants, B. B., Epstein, C. L., Grossman, M., and Gee, J. C. (2008). Symmetric diffeomorphic image registration with cross-correlation: evaluating automated labeling of elderly and neurodegenerative brain. Med. Image Anal. 12, 26–41. doi: 10.1016/j.media.2007.06.004
Bai, J., Abdul-Rahman, M. F., Rifkin-Graboi, A., Chong, Y.-S., Kwek, K., Saw, S.-M., et al. (2012). Population differences in brain morphology and microstructure among Chinese, Malay, and Indian Neonates. PLoS ONE 7:e47816. doi: 10.1371/journal.pone.0047816
Blesa, M., Serag, A., Wilkinson, A. G., Anblagan, D., Telford, E. J., Pataky, R., et al. (2016). Parcellation of the healthy neonatal brain into 107 regions using atlas propagation through intermediate time points in childhood. Front. Neurosci. 10:220. doi: 10.3389/fnins.2016.00220
Bossa, M., Hernandez, M., and Olmos, S. (2007). “Contributions to 3D diffeomorphic atlas estimation: application to brain images,” in Proceedings of the 10th International Conference on Medical Image Computing and Computer-Assisted Intervention - Volume Part I (Brisbane, QLD: Springer-Verlag).
Brett, M., Christoff, K., Cusack, R., and Lancaster, J. (2001). Using the Talairach atlas with the MNI template. Neuroimage 13, S85. doi: 10.1016/S1053-8119(01)91428-4
Brodmann, K. (1909). Vergleichende Lokalisationslehre der Großhirnrinde in ihren Prinzipien dargestellt auf Grund des Zellenbaues. Leipzig: Barth.
Brodmann, K. (1994). The Principles of Comparative Localisation in the Cerebral Cortex Based on Cytoarchitectonics. London: Smith-Gordon.
Buckner, R. L., Head, D., Parker, J., Fotenos, A. F., Marcus, D., Morris, J. C., et al. (2004). A unified approach for morphometric and functional data analysis in young, old, and demented adults using automated atlas-based head size normalization: reliability and validation against manual measurement of total intracranial volume. Neuroimage 23, 724–738. doi: 10.1016/j.neuroimage.2004.06.018
Chen, T., Rangarajan, A., Eisenschenk, S. J., and Vemuri, B. C. (2012). Construction of a neuroanatomical shape complex atlas from 3D MRI brain structures. Neuroimage 60, 1778–1787. doi: 10.1016/j.neuroimage.2012.01.095
Courchesne, E., Chisum, H. J., Townsend, J., Cowles, A., Covington, J., Egaas, B., et al. (2000). Normal brain development and aging: quantitative analysis at in vivo MR imaging in healthy volunteers. Radiology 216, 672–682. doi: 10.1148/radiology.216.3.r00au37672
Deary, I. J., Gow, A. J., Pattie, A., and Starr, J. M. (2012). Cohort profile: the Lothian birth cohorts of 1921 and 1936. Int. J. Epidemiol. 41, 1576–1584. doi: 10.1093/ije/dyr197
Desikan, R. S., Ségonne, F., Fischl, B., Quinn, B. T., Dickerson, B. C., Blacker, D., et al. (2006). An automated labeling system for subdividing the human cerebral cortex on MRI scans into gyral based regions of interest. Neuroimage 31, 968–980. doi: 10.1016/j.neuroimage.2006.01.021
Destrieux, C., Fischl, B., Dale, A., and Halgren, E. (2010). Automatic parcellation of human cortical gyri and sulci using standard anatomical nomenclature. Neuroimage 53, 1–15. doi: 10.1016/j.neuroimage.2010.06.010
Devlin, J. T., and Poldrack, R. A. (2007). In praise of tedious anatomy. Neuroimage 37, 1033–1041. doi: 10.1016/j.neuroimage.2006.09.055
Dickie, D. A., Job, D. E., Gonzalez, D. R., Shenkin, S. D., Ahearn, T. S., Murray, A. D., et al. (2013). Variance in brain volume with advancing age: implications for defining the limits of normality. PLoS ONE 8:e84093. doi: 10.1371/journal.pone.0084093
Dickie, D. A., Job, D. E., Gonzalez, D. R., Shenkin, S. D., and Wardlaw, J. M. (2015a). Use of brain MRI atlases to determine boundaries of age-related pathology: the importance of statistical method. PLoS ONE 10:e0127939. doi: 10.1371/journal.pone.0127939
Dickie, D. A., Job, D. E., Rodriguez, D., Robson, A., Danso, S., Pernet, C., et al. (2016a). Brain Imaging of Normal Subjects (BRAINS) Age-Specific MRI Atlases from Young Adults to the Very Elderly (v1.0), [dataset]. University of Edinburgh, Edinburgh Imaging, CCBS, BRAINS Imagebank. doi: 10.7488/ds/1369
Dickie, D. A., Job, D. E., Sparrow, S., Piyasena, C., Wilkinson, G., Wardlaw, J. M., et al. (2014). “Preterm infant brain pathology revealed in individuals by voxel ranking against a normal term atlas,” in Proceedings of the 20th Annual Meeting of the Organization for Human Brain Mapping (Hamburg).
Dickie, D. A., Karama, S., Ritchie, S. J., Cox, S. R., Sakka, E., Royle, N. A., et al. (2015b). Progression of white matter disease and cortical thinning are not related in older community-dwelling subjects. Stroke 47, 410–416. doi: 10.1161/STROKEAHA.115.011229
Dickie, D. A., Ritchie, S. J., Cox, S. R., Sakka, E., Royle, N. A., Aribisala, B. S., et al. (2016b). Vascular risk factors and progression of white matter hyperintensities in the Lothian Birth Cohort 1936. Neurobiol. Aging 42, 116–123. doi: 10.1016/j.neurobiolaging.2016.03.011
Eickhoff, S. B., Stephan, K. E., Mohlberg, H., Grefkes, C., Fink, G. R., Amunts, K., et al. (2005). A new SPM toolbox for combining probabilistic cytoarchitectonic maps and functional imaging data. Neuroimage 25, 1325–1335. doi: 10.1016/j.neuroimage.2004.12.034
Evans, A. C., Collins, D. L., Mills, S. R., Brown, E. D., Kelly, R. L., and Peters, T. M. (1993). “3D statistical neuroanatomical models from 305 MRI volumes,” in IEEE Nuclear Science Symposium and Medical Imaging Conference (San Francisco, CA), 1813–1817.
Evans, A. C., Janke, A. L., Collins, D. L., and Baillet, S. (2012). Brain templates and atlases. Neuroimage 62, 911–922. doi: 10.1016/j.neuroimage.2012.01.024
Fan, L., Li, H., Zhuo, J., Zhang, Y., Wang, J., Chen, L., et al. (2016). The human Brainnetome atlas: a new brain atlas based on connectional architecture. Cereb. Cortex 26, 3508–3526. doi: 10.1093/cercor/bhw157
Farrell, C., Chappell, F., Armitage, P. A., Keston, P., Maclullich, A., Shenkin, S., et al. (2009). Development and initial testing of normal reference MR images for the brain at ages 65–70 and 75–80 years. Eur. Radiol. 19, 177–183. doi: 10.1007/s00330-008-1119-2
Fillmore, P. T., Phillips-Meek, M., and Richards, J. E. (2015). Age-specific MRI brain and head templates for healthy adults from twenty through eighty-nine years of age. Front. Aging Neurosci. 7:44. doi: 10.3389/fnagi.2015.00044
Fmrib (2008). Atlases Included with FSL. Available online at: http://www.fmrib.ox.ac.uk/fsl/data/atlas-descriptions.html (Accessed March 25, 2011).
Fonov, V., Evans, A. C., Botteron, K., Almli, C. R., McKinstry, R. C., and Collins, D. L. (2011). Unbiased average age-appropriate atlases for pediatric studies. Neuroimage 54, 313–327. doi: 10.1016/j.neuroimage.2010.07.033
Gholipour, A., Limperopoulos, C., Clancy, S., Clouchoux, C., Akhondi-Asl, A., Estroff, J. A., et al. (2014). Construction of a deformable spatiotemporal mri atlas of the fetal brain: evaluation of similarity metrics and deformation models. Med. Image Comput. Comput. Assist. Interv. 17, 292–299. doi: 10.1007/978-3-319-10470-6_37
Glasser, M. F., Coalson, T. S., Robinson, E. C., Hacker, C. D., Harwell, J., Yacoub, E., et al. (2016). A multi-modal parcellation of human cerebral cortex. Nature 536, 171–178. doi: 10.1038/nature18933
Gogtay, N., Giedd, J. N., Lusk, L., Hayashi, K. M., Greenstein, D., Vaituzis, A. C., et al. (2004). Dynamic mapping of human cortical development during childhood through early adulthood. Proc. Natl. Acad. Sci. U.S.A. 101, 8174–8179. doi: 10.1073/pnas.0402680101
Good, C. D., Johnsrude, I. S., Ashburner, J., Henson, R. N. A., Friston, K. J., and Frackowiak, R. S. J. (2001). A voxel-based morphometric study of ageing in 465 normal adult human brains. Neuroimage 14, 21–36. doi: 10.1006/nimg.2001.0786
Gountouna, V., Job, D., McIntosh, A., Moorhead, T., Lymer, G., Whalley, H., et al. (2010). Functional magnetic resonance imaging (fMRI) reproducibility and variance components across visits and scanning sites with a finger tapping task. Neuroimage 49, 552–560. doi: 10.1016/j.neuroimage.2009.07.026
Gousias, I. S., Edwards, A. D., Rutherford, M. A., Counsell, S. J., Hajnal, J. V., Rueckert, D., et al. (2012). Magnetic resonance imaging of the newborn brain: manual segmentation of labelled atlases in term-born and preterm infants. Neuroimage 62, 1499–1509. doi: 10.1016/j.neuroimage.2012.05.083
Gousias, I. S., Rueckert, D., Heckemann, R. A., Dyet, L. E., Boardman, J. P., Edwards, A. D., et al. (2008). Automatic segmentation of brain MRIs of 2-year-olds into 83 regions of interest. Neuroimage 40, 672–684. doi: 10.1016/j.neuroimage.2007.11.034
Grabner, G., Janke, A. L., Budge, M. M., Smith, D., Pruessner, J., and Collins, D. L. (2006). Symmetric atlasing and model based segmentation: an application to the hippocampus in older adults. Med. Image Comput. Comput. Assist. Interv. 4191, 58–66. doi: 10.1007/11866763_8
Gradin, V., Gountouna, V. E., Waiter, G., Ahearn, T. S., Brennan, D., Condon, B., et al. (2010). Between-and within-scanner variability in the CaliBrain study n-back cognitive task. Psychiatry Res. Neuroimaging 184, 86–95. doi: 10.1016/j.pscychresns.2010.08.010
Gur, R. C., Mozley, P. D., Resnick, S. M., Gottlieb, G. L., Kohn, M., Zimmerman, R., et al. (1991). Gender differences in age effect on brain atrophy measured by magnetic resonance imaging. Proc. Natl. Acad. Sci. U.S.A. 88, 2845–2849. doi: 10.1073/pnas.88.7.2845
Habas, P. A., Kim, K., Corbett-Detig, J. M., Rousseau, F., Glenn, O. A., Barkovich, A. J., et al. (2010). A spatiotemporal atlas of MR intensity, tissue probability and shape of the fetal brain with application to segmentation. Neuroimage 53, 460–470. doi: 10.1016/j.neuroimage.2010.06.054
Hammers, A., Allom, R., Koepp, M., Free, S., Myers, R., Lemieux, L., et al. (2003). Three-dimensional maximum probability atlas of the human brain, with particular reference to the temporal lobe. Hum. Brain Mapp. 19, 224–247. doi: 10.1002/hbm.10123
Hashioka, A., Kobashi, S., Kuramoto, K., Wakata, Y., Ando, K., Ishikura, R., et al. (2012). A neonatal brain MR image template of 1 week newborn. Int. J. Comput. Assist. Radiol. Surg. 7, 273–280. doi: 10.1007/s11548-011-0646-5
Hoggard, N. (2009). Re: development and initial testing of normal reference MR images for the brain at ages 65–70 and 75–80 years. Eur. Radiol. 19, 1025–1025. doi: 10.1007/s00330-008-1230-4
Holmes, C. J., Hoge, R., Collins, L., Woods, R., Toga, A. W., and Evans, A. C. (1998). Enhancement of MR images using registration for signal averaging. J. Comput. Assist. Tomogr. 22, 324. doi: 10.1097/00004728-199803000-00032
Jao, T., Chang, C. Y., Li, C. W., Chen, D. Y., Wu, E., Wu, C. W., et al. (2009). “Development of NTU standard Chinese brain template: Morphologic and functional comparison with MNI template using magnetic resonance imaging,” in 2009 Annual International Conference of the IEEE Engineering in Medicine and Biology Society (Minneapolis, MN), 4779–4782.
Job, D. E., Dickie, D. A., Rodriguez, D., Robson, A., Danso, S., Pernet, C., et al. (2016). A brain imaging repository of normal structural MRI across the life course: Brain Images of Normal Subjects (BRAINS). NeuroImage 144, 299–304. doi: 10.1016/j.neuroimage.2016.01.027
Kabdebon, C., Leroy, F., Simmonet, H., Perrot, M., Dubois, J., and Dehaene-Lambertz, G. (2014). Anatomical correlations of the international 10–20 sensor placement system in infants. Neuroimage 99, 342–356. doi: 10.1016/j.neuroimage.2014.05.046
Kazemi, K., Ghadimi, S., Abrishami-Moghaddam, H., Grebe, R., Gondry-Jouet, C., and Wallois, F. (2008). “Neonatal probabilistic models for brain, CSF and skull using T1-MRI data: Preliminary results,” in 2008 30th Annual International Conference of the IEEE Engineering in Medicine and Biology Society (Vancouver, BC), 3892–3895.
Kazemi, K., Moghaddam, H. A., Grebe, R., Gondry-Jouet, C., and Wallois, F. (2007). A neonatal atlas template for spatial normalization of whole-brain magnetic resonance images of newborns: preliminary results. Neuroimage 37, 463–473. doi: 10.1016/j.neuroimage.2007.05.004
Klein, A., and Tourville, J. (2012). 101 labeled brain images and a consistent human cortical labeling protocol. Front. Neurosci. 6:171. doi: 10.3389/fnins.2012.00171
Kuklisova-Murgasova, M., Aljabar, P., Srinivasan, L., Counsell, S. J., Doria, V., Serag, A., et al. (2011). A dynamic 4D probabilistic atlas of the developing brain. Neuroimage 54, 2750–2763. doi: 10.1016/j.neuroimage.2010.10.019
Lalys, F., Haegelen, C., Ferre, J.-C., El-Ganaoui, O., and Jannin, P. (2010). Construction and assessment of a 3-T MRI brain template. Neuroimage 49, 345–354. doi: 10.1016/j.neuroimage.2009.08.007
Lancaster, J. L., Tordesillas-Gutiérrez, D., Martinez, M., Salinas, F., Evans, A., Zilles, K., et al. (2007). Bias between MNI and Talairach coordinates analyzed using the ICBM-152 brain template. Hum. Brain Mapp. 28, 1194–1205. doi: 10.1002/hbm.20345
Lee, J. S., Lee, D. S., Kim, J., Kim, Y. K., Kang, E., Kang, H., et al. (2005). Development of Korean standard brain templates. J. Korean Med. Sci. 20, 483–488. doi: 10.3346/jkms.2005.20.3.483
Lemaitre, H., Crivello, F., Grassiot, B., Alperovitch, A., Tzourio, C., and Mazoyer, B. (2005). Age-and sex-related effects on the neuroanatomy of healthy elderly. Neuroimage 26, 900–911. doi: 10.1016/j.neuroimage.2005.02.042
Lim, I. A. L., Faria, A. V., Li, X., Hsu, J. T. C., Airan, R. D., Van Zijl, P. C. M., et al. (2013). Human brain atlas for automated region of interest selection in quantitative susceptibility mapping: application to determine iron content in deep gray matter structures. Neuroimage 82, 449–469. doi: 10.1016/j.neuroimage.2013.05.127
Loni (2011). Alzheimer's Disease Template. Available online at: http://www.loni.usc.edu/atlases/ (Accessed).
Luders, E., Narr, K. L., Thompson, P. M., Woods, R. P., Rex, D. E., Jancke, L., et al. (2005). Mapping cortical gray matter in the young adult brain: effects of gender. Neuroimage 26, 493–501. doi: 10.1016/j.neuroimage.2005.02.010
Makropoulos, A., Aljabar, P., Wright, R., Hüning, B., Merchant, N., Arichi, T., et al. (2016). Regional growth and atlasing of the developing human brain. Neuroimage 125, 456–478. doi: 10.1016/j.neuroimage.2015.10.047
Maldjian, J. A., Laurienti, P. J., Kraft, R. A., and Burdette, J. H. (2003). An automated method for neuroanatomic and cytoarchitectonic atlas-based interrogation of fMRI data sets. Neuroimage 19, 1233–1239. doi: 10.1016/S1053-8119(03)00169-1
Matsuzawa, J., Matsui, M., Konishi, T., Noguchi, K., Gur, R. C., Bilker, W., et al. (2001). Age-related volumetric changes of brain gray and white matter in healthy infants and children. Cereb. Cortex 11, 335–342. doi: 10.1093/cercor/11.4.335
Mazziotta, J., Toga, A., Evans, A., Fox, P., Lancaster, J., Zilles, K., et al. (2001). A probabilistic atlas and reference system for the human brain: International Consortium for Brain Mapping (ICBM). Philos. Trans. R. Soc. Lond. B Biol. Sci. 356, 1293–1322. doi: 10.1098/rstb.2001.0915
Miller, K. L., Alfaro-Almagro, F., Bangerter, N. K., Thomas, D. L., Yacoub, E., Xu, J., et al. (2016). Multimodal population brain imaging in the UK Biobank prospective epidemiological study. Nat. Neurosci. 19, 1523–1536. doi: 10.1038/nn.4393
Moher, D., Liberati, A., Tetzlaff, J., and Altman, D. G. (2009). Preferred reporting items for systematic reviews and meta-analyses: the PRISMA statement. PLoS Med. 6:e1000097. doi: 10.1371/journal.pmed.1000097
Muzik, O., Chugani, D. C., Juhász, C., Shen, C., and Chugani, H. T. (2000). Statistical parametric mapping: assessment of application in children. Neuroimage 12, 538–549. doi: 10.1006/nimg.2000.0651
Nowinski, W. L. (2005). The cerefy brain atlases. Neuroinformatics 3, 293–300. doi: 10.1385/NI:3:4:293
Nowinski, W. L., Chua, B. C., Qian, G. Y., and Nowinska, N. G. (2012). The human brain in 1700 pieces: design and development of a three-dimensional, interactive and reference atlas. J. Neurosci. Methods 204, 44–60. doi: 10.1016/j.jneumeth.2011.10.021
O'connor, J. P. B. (2003). Thomas Willis and the background to Cerebri Anatome. J. R. Soc. Med. 96, 139–143. doi: 10.1258/jrsm.96.3.139
Oishi, K., Mori, S., Donohue, P. K., Ernst, T., Anderson, L., Buchthal, S., et al. (2011). Multi-contrast human neonatal brain atlas: application to normal neonate development analysis. Neuroimage 56, 8–20. doi: 10.1016/j.neuroimage.2011.01.051
Raz, N., Ghisletta, P., Rodrigue, K. M., Kennedy, K. M., and Lindenberger, U. (2010). Trajectories of brain aging in middle-aged and older adults: regional and individual differences. Neuroimage 51, 501–511. doi: 10.1016/j.neuroimage.2010.03.020
Richards, J. E., Sanchez, C., Phillips-Meek, M., and Xie, W. (2016). A database of age-appropriate average MRI templates. NeuroImage 124(Pt B), 1254–1259. doi: 10.1016/j.neuroimage.2015.04.055
Ritchie, S. J., Dickie, D. A., Cox, S. R., Valdes Hernandez, M. D. C., Corley, J., Royle, N. A., et al. (2015). Brain volumetric changes and cognitive ageing during the eighth decade of life. Hum. Brain Mapp. 36, 4910–4925. doi: 10.1002/hbm.22959
Rohlfing, T., Zahr, N., Sullivan, E., and Pfefferbaum, A. (2010). The SRI24 multichannel atlas of normal adult human brain structure. Hum. Brain Mapp. 31, 798–819. doi: 10.1002/hbm.20906
Rorden, C., Bonilha, L., and Nichols, T. E. (2007). Rank-order versus mean based statistics for neuroimaging. Neuroimage 35, 1531–1537. doi: 10.1016/j.neuroimage.2006.12.043
Sanchez, C. E., Richards, J. E., and Almli, C. R. (2012a). Age-specific MRI templates for pediatric neuroimaging. Dev. Neuropsychol. 37, 379–399. doi: 10.1080/87565641.2012.688900
Sanchez C. E., Richards J. E., and Almli C. R. (2012b). Neurodevelopmental MRI brain templates for children from 2 weeks to 4 years of age. Dev. Psychobiol. 54, 77–91. doi: 10.1002/dev.20579
Schifter, T., Turkington, T. G., Berlangieri, S. U., Hoffman, J. M., Macfall, J. R., Pelizzari, C. A., et al. (1993). Normal brain F-18 FDG-PET and MRI anatomy. Clin. Nucl. Med. 18, 578–582. doi: 10.1097/00003072-199307000-00008
Serag, A., Aljabar, P., Ball, G., Counsell, S. J., Boardman, J. P., Rutherford, M. A., et al. (2012a). Construction of a consistent high-definition spatio-temporal atlas of the developing brain using adaptive kernel regression. Neuroimage 59, 2255–2265. doi: 10.1016/j.neuroimage.2011.09.062
Serag, A., Kyriakopoulou, V., Rutherford, M., Edwards, A., Hajnal, J., Aljabar, P., et al. (2012b). A multi-channel 4D probabilistic atlas of the developing brain: application to fetuses and neonates. Ann. BMVA, 2012, 1–14.
Shan, Z. Y., Parra, C., Ji, Q., Ogg, R. J., Zhang, Y., Laningham, F. H., et al. (2006). “A digital pediatric brain structure atlas from T1-weighted MR images,” in Medical Image Computing and Computer-Assisted Intervention – MICCAI 2006: 9th International Conference, Copenhagen, Denmark, October 1–6, 2006, Proceedings, Part II, eds R. Larsen, M. Nielsen, and J. Sporring. (Berlin; Heidelberg: Springer Berlin Heidelberg), 332–339.
Shattuck, D. W., Mirza, M., Adisetiyo, V., Hojatkashani, C., Salamon, G., Narr, K. L., et al. (2008). Construction of a 3D probabilistic atlas of human cortical structures. Neuroimage 39, 1064–1080. doi: 10.1016/j.neuroimage.2007.09.031
Shenton, M. E., Kikinis, R., McCarley, R. W., Saiviroonpom, P., Hokama, H. H., Robatino, A., et al. (1995). “Harvard brain atlas: a teaching and visualization tool,” in Proceedings of the 1995 Biomedical Visualization (Washington, DC), 10–17.
Shi, F., Yap, P.-T., Fan, Y., Gilmore, J. H., Lin, W., and Shen, D. (2010). Construction of multi-region-multi-reference atlases for neonatal brain MRI segmentation. Neuroimage 51, 684–693. doi: 10.1016/j.neuroimage.2010.02.025
Shi, F., Yap, P.-T., Wu, G., Jia, H., Gilmore, J. H., Lin, W., et al. (2011). Infant Brain Atlases from Neonates to 1- and 2-Year-Olds. PLoS ONE 6:e18746. doi: 10.1371/journal.pone.0018746
Sowell, E. R., Peterson, B. S., Thompson, P. M., Welcome, S. E., Henkenius, A. L., and Toga, A. W. (2003). Mapping cortical change across the human life span. Nat. Neurosci. 6, 309–315. doi: 10.1038/nn1008
Subsol, G., Roberts, N., Doran, M., Thirion, J.-P., and Whitehouse, G. H. (1997). Automatic analysis of cerebral atrophy. Magn. Reson. Imaging 15, 917–927. doi: 10.1016/S0730-725X(97)00002-7
Talairach, J., and Tournoux, P. (1988). Co-planar Sterotactic Atlas of the Human Brain: 3-dimensional Proportional System: An Approach to Cerebral Imaging. Stuttgart: Georg Thieme Verlag.
Talairach, J., Szikla, G., Tournoux, P., Prosalentis, A., Bordas-Ferrier, M., Covello, L., et al. (1967). Atlas D'Anatomie Stereotaxique du Telencephale. Paris: Masson.
Tang, Y., Hojatkashani, C., Dinov, I., Sun, B., Fan, L., Lin, X., et al. (2010). The construction of a Chinese MRI brain atlas: a morphometric comparison study between Chinese and Caucasian cohorts. Neuroimage 51, 33–41. doi: 10.1016/j.neuroimage.2010.01.111
Toga, A. W. (2002). Neuroimage databases: the good, the bad and the ugly. Nat. Rev. Neurosci. 3, 302–309. doi: 10.1038/nrn782
Toga, A. W., and Thompson, P. M. (2007). What is where and why it is important. Neuroimage 37, 1045–1068. doi: 10.1016/j.neuroimage.2007.02.018
Toga, A. W., Thompson, P. M., Mori, S., Amunts, K., and Zilles, K. (2006). Towards multimodal atlases of the human brain. Nat. Rev. Neurosci. 7, 952–966. doi: 10.1038/nrn2012
Uchiyama, H. T., Seki, A., Tanaka, D., Koeda, T., and Group, J. C. S. (2013). A study of the standard brain in Japanese children: morphological comparison with the MNI template. Brain Dev. 35, 228–235. doi: 10.1016/j.braindev.2012.04.005
Van Essen, D. C. (2005). A population-average, landmark-and surface-based (PALS) atlas of human cerebral cortex. Neuroimage 28, 635–662. doi: 10.1016/j.neuroimage.2005.06.058
Van Essen, D. C., Ugurbil, K., Auerbach, E., Barch, D., Behrens, T. E. J., Bucholz, R., et al. (2012). The Human Connectome Project: a data acquisition perspective. Neuroimage 62, 2222–2231. doi: 10.1016/j.neuroimage.2012.02.018
Van Leemput, K. (2009). Encoding probabilistic brain atlases using Bayesian inference. IEEE Trans. Med. Imaging 28, 822–837. doi: 10.1109/TMI.2008.2010434
Von Economo, C., and Koskinas, G. N. (1925). Die Cytoarchitektonik der Hirnrinde des Erwachsenen Menschen. Berlin: Julius Springer.
Wardlaw, J. M., Bastin, M. E., Valdés Hernández, M. C., Mu-oz Maniega, S., Royle, N. A., Morris, Z., et al. (2011). Brain aging, cognition in youth and old age and vascular disease in the Lothian Birth Cohort 1936: rationale, design and methodology of the imaging protocol. Int. J. Stroke 6, 547–559. doi: 10.1111/j.1747-4949.2011.00683.x
Wardlaw, J. M., Smith, E. E., Biessels, G. J., Cordonnier, C., Fazekas, F., Frayne, R., et al. (2013). Neuroimaging standards for research into small vessel disease and its contribution to ageing and neurodegeneration. Lancet Neurol. 12, 822–838. doi: 10.1016/S1474-4422(13)70124-8
Warntjes, J. B. M., Engström, M., Tisell, A., and Lundberg, P. (2013). Brain characterization using normalized quantitative magnetic resonance imaging. PLoS ONE 8:e70864. doi: 10.1371/journal.pone.0070864
Westbury, C. F., Zatorre, R. J., and Evans, A. C. (1999). Quantifying variability in the planum temporale: a probability map. Cereb. Cortex 9, 392–405. doi: 10.1093/cercor/9.4.392
Wilke, M., Holland, S., Altaye, M., and Gaser, C. (2008). Template-O-Matic: a toolbox for creating customized pediatric templates. Neuroimage 41, 903–913. doi: 10.1016/j.neuroimage.2008.02.056
Wu, D., Ma, T., Ceritoglu, C., Li, Y., Chotiyanonta, J., Hou, Z., et al. (2016). Resource atlases for multi-atlas brain segmentations with multiple ontology levels based on T1-weighted MRI. Neuroimage 125, 120–130. doi: 10.1016/j.neuroimage.2015.10.042
Xing, W., Nan, C., Zhentao, Z., Rong, X., Luo, J., Zhuo, Y., et al. (2013). Probabilistic MRI brain anatomical atlases based on 1,000 Chinese subjects. PLoS ONE 8:e50939. doi: 10.1371/journal.pone.0050939
Yeh, F.-C., and Tseng, W.-Y. I. (2011). NTU-90: a high angular resolution brain atlas constructed by q-space diffeomorphic reconstruction. Neuroimage 58, 91–99. doi: 10.1016/j.neuroimage.2011.06.021
Yoon, U., Fonov, V. S., Perusse, D., and Evans, A. C. (2009). The effect of template choice on morphometric analysis of pediatric brain data. Neuroimage 45, 769–777. doi: 10.1016/j.neuroimage.2008.12.046
Yoon, U., Lee, J.-M., Koo, B. B., Shin, Y.-W., Lee, K. J., Kim, I. Y., et al. (2005). Quantitative analysis of group-specific brain tissue probability map for schizophrenic patients. Neuroimage 26, 502–512. doi: 10.1016/j.neuroimage.2005.01.056
Zhan, J., Dinov, I. D., Li, J., Zhang, Z., Hobel, S., Shi, Y., et al. (2013). Spatial–temporal atlas of human fetal brain development during the early second trimester. Neuroimage 82, 115–126. doi: 10.1016/j.neuroimage.2013.05.063
Zuo, X.-N., and Xing, X.-X. (2014). Test-retest reliabilities of resting-state FMRI measurements in human brain functional connectomics: a systems neuroscience perspective. Neurosci. Biobehav. Rev. 45, 100–118. doi: 10.1016/j.neubiorev.2014.05.009
Zuo, X.-N., Anderson, J. S., Bellec, P., Birn, R. M., Biswal, B. B., Blautzik, J., et al. (2014). An open science resource for establishing reliability and reproducibility in functional connectomics. Sci. Data 1, 140049. doi: 10.1038/sdata.2014.49
Keywords: brain mapping, MRI imaging, atlases as topic, brain, systematic review, aging, neurodevelopment, neurodegeneration
Citation: Dickie DA, Shenkin SD, Anblagan D, Lee J, Blesa Cabez M, Rodriguez D, Boardman JP, Waldman A, Job DE and Wardlaw JM (2017) Whole Brain Magnetic Resonance Image Atlases: A Systematic Review of Existing Atlases and Caveats for Use in Population Imaging. Front. Neuroinform. 11:1. doi: 10.3389/fninf.2017.00001
Received: 25 August 2016; Accepted: 04 January 2017;
Published: 19 January 2017.
Edited by:
David N. Kennedy, University of Massachusetts Medical School, USAReviewed by:
Xi-Nian Zuo, Chinese Academy of Sciences, ChinaFrithjof Kruggel, University of California, Irvine, USA
Copyright © 2017 Dickie, Shenkin, Anblagan, Lee, Blesa Cabez, Rodriguez, Boardman, Waldman, Job and Wardlaw. This is an open-access article distributed under the terms of the Creative Commons Attribution License (CC BY). The use, distribution or reproduction in other forums is permitted, provided the original author(s) or licensor are credited and that the original publication in this journal is cited, in accordance with accepted academic practice. No use, distribution or reproduction is permitted which does not comply with these terms.
*Correspondence: David Alexander Dickie, david.dickie@ed.ac.uk
Joanna M. Wardlaw, joanna.wardlaw@ed.ac.uk
†These authors have contributed equally to this work.