Reproducibility and Comparability of Computational Models for Astrocyte Calcium Excitability
 Tiina Manninen
 Riikka Havela
 Marja-Leena Linne
- Computational Neuroscience Group, Faculty of Biomedical Sciences and Engineering and BioMediTech Institute, Tampere University of Technology, Tampere, Finland
The scientific community across all disciplines faces the same challenges of ensuring accessibility, reproducibility, and efficient comparability of scientific results. Computational neuroscience is a rapidly developing field, where reproducibility and comparability of research results have gained increasing interest over the past years. As the number of computational models of brain functions is increasing, we chose to address reproducibility using four previously published computational models of astrocyte excitability as an example. Although not conventionally taken into account when modeling neuronal systems, astrocytes have been shown to take part in a variety of in vitro and in vivo phenomena including synaptic transmission. Two of the selected astrocyte models describe spontaneous calcium excitability, and the other two neurotransmitter-evoked calcium excitability. We specifically addressed how well the original simulation results can be reproduced with a reimplementation of the models. Additionally, we studied how well the selected models can be reused and whether they are comparable in other stimulation conditions and research settings. Unexpectedly, we found out that three of the model publications did not give all the necessary information required to reimplement the models. In addition, we were able to reproduce the original results of only one of the models completely based on the information given in the original publications and in the errata. We actually found errors in the equations provided by two of the model publications; after modifying the equations accordingly, the original results were reproduced more accurately. Even though the selected models were developed to describe the same biological event, namely astrocyte calcium excitability, the models behaved quite differently compared to one another. Our findings on a specific set of published astrocyte models stress the importance of proper validation of the models against experimental wet-lab data from astrocytes as well as the careful review process of models. A variety of aspects of model development could be improved, including the presentation of models in publications and databases. Specifically, all necessary mathematical equations, as well as parameter values, initial values of variables, and stimuli used should be given precisely for successful reproduction of scientific results.
1. Introduction
Reproducibility of research results is a founding principle of scientific methodology. In general terms, it is defined as the ability of a study to be duplicated by any researcher. This dictates that all conditions affecting the original experimental setup must be known and reported. Reproducibility, reliability, and reuse of research results are becoming essential topics in the field of neuroscience.
In the field of computational neuroscience, computational models of brain function may not always contain all necessary information to reproduce the study, preventing the reuse of models in further studies (see, e.g., Cannon et al., 2007; De Schutter, 2008; Nordlie et al., 2009; Manninen et al., 2010; Crook et al., 2013; Stevens et al., 2013; Topalidou et al., 2015; Manninen et al., in press). Reproducibility of a modeling study describes how well the published simulation results can be produced by others, by implementing the model based on the information in the original publication, that is, not using any potentially available code (Crook et al., 2013; Cannon et al., 2014). Comparability, on the other hand, describes how well the published models can substitute one another. Reuse of models can also be hindered by the fact that models are often developed to describe specific neurophysiological phenomena and may not work properly in other research settings. As the number of computational models is increasing, it is important to carefully address the reproducibility, reuse, and comparability of models.
Theoretical insights from mathematical and computational models can make a valuable contribution to many different areas of neuroscience research, from modeling of molecular level biological processes to the analysis of large-scale patterns of brain activity. One emerging topic in the field of computational neuroscience is regulation of neuronal structure and function by glial cells. Relatively few data-driven, well-validated astrocyte models exist. This is partly because much of the data from astrocytes dates back to the 1990s, when most commonly used preparations were in vitro cell cultures and many modern experimental techniques had not yet been developed. This dictated the research hypotheses and questions asked. Moreover, the absence of signals comparable to neuronal action potentials is perhaps one of the main reasons why astrocytes have only recently attracted attention in the field of computational neuroscience. The controversial nature of experimental data related to astrocytes has slowed the progression of data-driven modeling in this field (see, e.g., Agulhon et al., 2010; Navarrete et al., 2013). Nevertheless, astrocytes express an overwhelming complexity of molecular and cell-level signaling and have been shown to interact with neurons in a variety of ways (see, e.g., recent review by Volterra et al., 2014). Therefore, as they are evidently shaping the neurophysiology and functioning of mammalian brains, it is necessary to address the principal astrocytic functions in future models of neural systems.
Several focused reviews of computational astrocyte models have appeared during the last few years (Jolivet et al., 2010; De Pittà et al., 2012; Fellin et al., 2012; Min et al., 2012; Volman et al., 2012; Wade et al., 2013; Linne and Jalonen, 2014; Tewari and Parpura, 2014; De Pittà et al., 2016). Some of these reviews discuss the involvement of astrocytes in normal physiological events in the brain, while some others concentrate on astrocytes' roles in the development of brain disorders and diseases. Some of the reviews also address astrocytes' potential roles in computation in the brain. Manninen et al. (in press) presented the first detailed categorization and evaluation of astrocyte-neuron models in a variety of neurophysiological functions. In this evaluation, more than 60 models were cataloged for astrocytes and astrocyte-neuron networks. To mention some examples, Höfer et al. (2002) and López-Caamal et al. (2014) have developed models for single astrocytes, Roth et al. (1995) and Bennett et al. (2008) for small astrocyte networks, Höfer et al. (2002) and Lallouette et al. (2014) for large astrocyte networks, Nadkarni and Jung (2003) and Tewari and Parpura (2013) for small astrocyte-neuron networks, and Allegrini et al. (2009) and Postnov et al. (2009) for large astrocyte-neuron networks. A detailed categorization of all existing models can be found in Manninen et al. (in press).
In our previous studies, we have assessed reproducibility and comparability issues in computational neuroscience and in computational cell biology (see, e.g., Pettinen et al., 2005; Manninen et al., 2010, 2011; Hituri and Linne, 2013; Manninen et al., in press). Especially in Manninen et al. (in press), we briefly discussed the reproducibility issues related to five astrocyte and astrocyte-neuron models (Nadkarni and Jung, 2003; Di Garbo et al., 2007; Lavrentovich and Hemkin, 2008; Dupont et al., 2011; Wade et al., 2012). We did not, however, address comparability in our previous work (Manninen et al., in press) as the emphasis was on categorization and general evaluation of all existing models. Here we aim to provide a systematic analysis of selected computational models for astrocyte functions, as part of our work to develop novel computational models for astrocyte research. We selected four relatively simple single astrocyte models to be implemented based on the information in the original publication (Lavrentovich and Hemkin, 2008; De Pittà et al., 2009; Dupont et al., 2011; Riera et al., 2011a,b). We tested if we were able to reproduce the original model behavior, especially the dynamical calcium (Ca2+) signals in astrocytes' somata, based on the information in the original publication. We also tested the comparability of the models by observing their dynamical behavior when the same stimulus or parameter values were used. We were especially interested in determining if these models could substitute one another when used as a module in a larger model. Our present study sheds light on functional differences between the models of astrocyte Ca2+ excitability. It also promotes reproducible science and development of good practices for publication of modeling results in the field of computational neuroscience.
2. Materials and Methods
We compared models describing the two main types of astrocyte activity: spontaneous and neurotransmitter-evoked Ca2+ excitability. We performed selection of models for this study based on a large evaluation and characterization of more than 60 astrocyte Ca2+ activity models published by the end of 2014 (Manninen et al., in press), and exclusion criteria. We wanted to compare single astrocyte point models, and thus excluded models with diffusion and several cell components, such as astrocyte network, astrocyte-neuron interaction, or vascular interaction models. Most of the models are based on either the model by Li and Rinzel (1994) or the model by Höfer et al. (2002). Since it is not reasonable to compare models with the same core astrocyte Ca2+ activity model, only one of them was selected. The models selected based on these criteria were two models with spontaneous Ca2+ excitability (Lavrentovich and Hemkin, 2008; Riera et al., 2011a,b) and two models with neurotransmitter-evoked Ca2+ excitability (De Pittà et al., 2009; Dupont et al., 2011). The model by Lavrentovich and Hemkin (2008) is mainly based on the model by Höfer et al. (2002), and thus it was interesting to compare it to the model by Riera et al. (2011a,b) which is based on the models by Li and Rinzel (1994) and Höfer et al. (2002). The model by De Pittà et al. (2009) is mainly based on the model by Li and Rinzel (1994) with one reaction rate taken from the model by Höfer et al. (2002). It was compared to the model by Dupont et al. (2011) which is not based on the models by Li and Rinzel (1994) and Höfer et al. (2002) but represents its own line of astrocyte Ca2+ modeling.
Next, we present the models by Li and Rinzel (1994) and Höfer et al. (2002). These two models are used as basic building blocks in most existing models for astrocyte functions. It is therefore important to assess the nature of these models in order to perform reproducibility and comparability studies related to astrocyte models.
2.1. Model by Li and Rinzel (1994)
Li and Rinzel (1994) simplified the model by De Young and Keizer (1992). In the model by Li and Rinzel (1994), cytosolic Ca2+ concentration depends on Ca2+-induced Ca2+ release (CICR) from the endoplasmic reticulum (ER) to the cytosol, Ca2+ pump flux from the cytosol to the ER via sarco/ER Ca2+-ATPase (SERCA) pump, and leakage flux from the ER to the cytosol (leak ER). In the model by Li and Rinzel (1994), the differential equation for the Ca2+ concentration can be written as:
and the differential equation for the fraction of active inositol 1,4,5-trisphosphate (IP3) receptors (IP3Rs) can be written as:
where
and
Li and Rinzel (1994) maintained IP3 concentration constant. The parameter values can be obtained from the literature (see, e.g., Li and Rinzel, 1994; De Pittà et al., 2009). Li and Rinzel (1994) also presented equations for Ca2+ efflux and influx across the plasma membrane when the total free Ca2+ concentration () was varying according to a differential equation.
2.2. Model by Höfer et al. (2002)
The model by Höfer et al. (2002) is based on several other publications (Atri et al., 1993; Dupont and Goldbeter, 1993; Höfer and Politi, 2001). They model up to 361 astrocytes and their model has four variables per astrocyte: cytosolic Ca2+ and IP3 concentrations, Ca2+ concentration in the ER, and fraction of active IP3Rs. The cytosolic Ca2+ concentration depends on CICR, leak ER, and SERCA pump across the ER membrane (vRel includes both CICR and leak ER) and Ca2+ efflux, influx, and leak across the plasma membrane (vin includes both influx and leak), as well as diffusion of Ca2+ inside the cytosol and transfer of Ca2+ via gap junctions. The Ca2+ concentration in the ER depends on CICR, leak ER, and SERCA pump. The IP3 concentration depends on two distinct production terms via phospholipase C (PLC), one corresponding to PLCβ, which is activated through G-protein-coupled receptors exclusively in the stimulated cell, and the other to PLCδ, which is activated by Ca2+ elevation in the stimulated cell and in downstream cells, in addition to IP3 degradation, diffusion inside the cytosol, and transfer of IP3 via gap junctions. The fraction of active IP3Rs depends on rates for IP3R inactivation by Ca2+ binding and recovery. Thus, the model by Höfer et al. (2002) includes the following differential equations for the cytosolic Ca2+ concentration:
for the Ca2+ concentration in the ER:
for the IP3 concentration:
and for the fraction of active IP3Rs:
where
and
Equation (17) is given here as in the original publication since we were not able to verify it from any other source. Evidently, it could also be given in the form which is much simpler and this raises a question if the equation was given incorrectly in the original publication. Most of the parameter values can be obtained from the literature (Höfer et al., 2002).
2.3. Single Astrocyte Models with Spontaneous Ca2+ Excitability
We implemented two single astrocyte models with spontaneous Ca2+ excitability. The first Ca2+ oscillation model was the model by Lavrentovich and Hemkin (2008), which is based on the models by Houart et al. (1999) and Höfer et al. (2002). The model by Lavrentovich and Hemkin (2008) is a generic model, that is not built to represent any specific brain area. However, they used some experimentally supported hypotheses to build their model (see, e.g., Parri et al., 2001; Aguado et al., 2002; Parri and Crunelli, 2003). The model includes three variables: Ca2+ concentration in the cytosol, Ca2+ concentration in the ER, and IP3 concentration (see Tables 1, 2). The second model was by Riera et al. (2011a,b), which is based on the models by Li and Rinzel (1994), Shuai and Jung (2002), Höfer et al. (2002), and Di Garbo et al. (2007). Riera et al. (2011a,b) included both modeling and wet-lab experimental work in mouse hippocampus. They used the experimental data to find the values for a few parameters. The model includes four variables: Ca2+ concentration, total free Ca2+ concentration, fraction of active IP3Rs, and IP3 concentration (see Tables 1, 3). In some of the simulations, Riera et al. (2011a) kept the total free Ca2+ concentration constant.
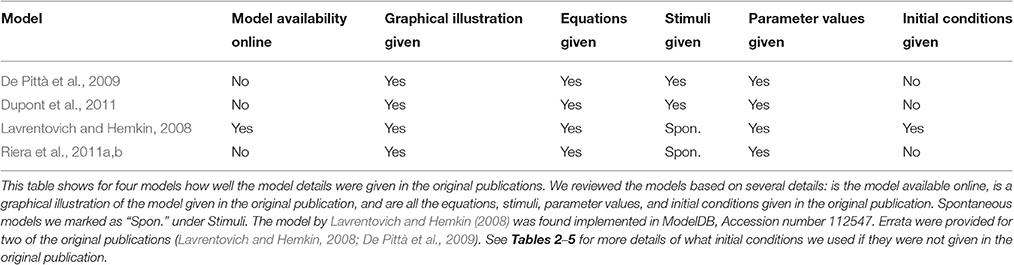
Table 1. Model details.
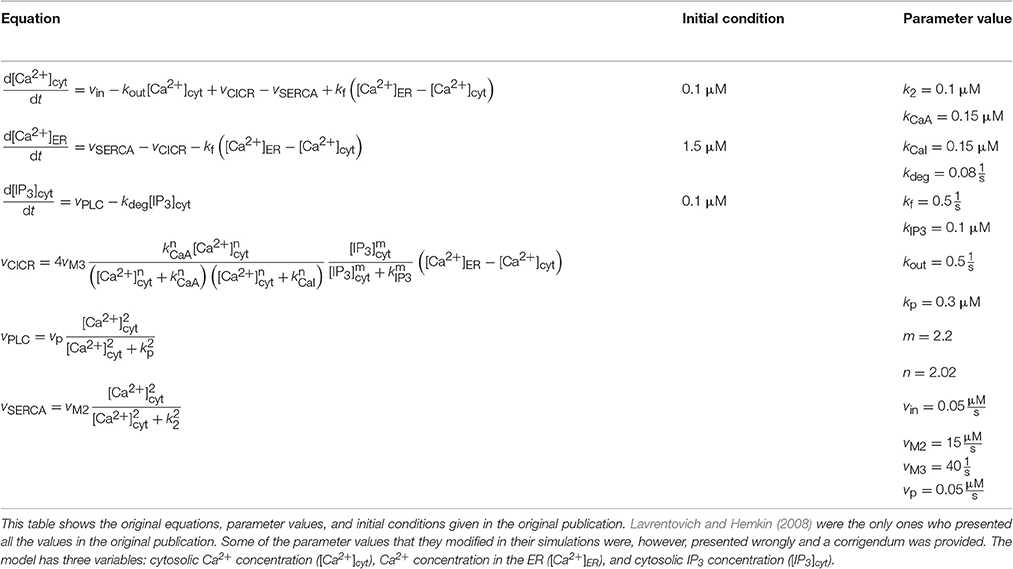
Table 2. Details of the model by Lavrentovich and Hemkin (2008).
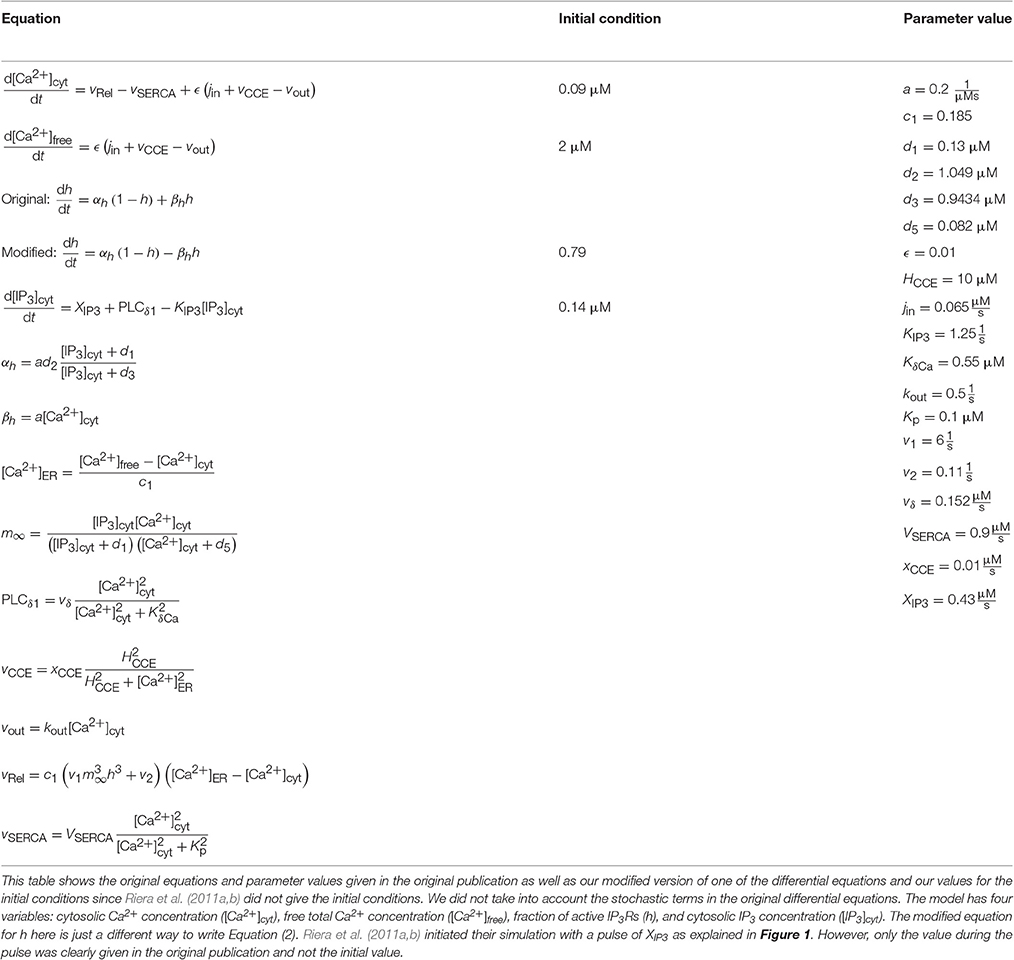
Table 3. Details of the model by Riera et al. (2011a,b).
2.4. Single Astrocyte Models with Neurotransmitter-Evoked Ca2+ Excitability
We implemented two single astrocyte models with neurotransmitter-evoked Ca2+ excitability. The first one was the generic model by De Pittà et al. (2009) for glutamate (Glu)-induced astrocytic Ca2+ dynamics, which is based on the models by De Young and Keizer (1992), Li and Rinzel (1994), and Höfer et al. (2002). Several key observations on a variety of cell types were used to construct the model, e.g., IP3 kinetics data from Xenopus oocytes. De Pittà et al. (2009) also used experimental data by Tsodyks and Markram (1997) as input to their model. The model by De Pittà et al. (2009) includes three model variables: Ca2+ concentration, IP3 concentration, and fraction of active IP3Rs (see Tables 1, 4). De Pittà et al. (2009) pointed out in their publication that h denotes fraction of inactive IP3Rs. However, they took the variable h from the model by Li and Rinzel (1994) where h is used to describe fraction of active IP3Rs. The second model was the generic model by Dupont et al. (2011) for metabotropic Glu receptor 5 (mGlu5R)-induced Ca2+ oscillations. The model is based on their previous models (Dupont and Goldbeter, 1993; Dupont and Croisier, 2010), and they compared their simulation results with some experimental data from, e.g., Chinese hamster ovary cells (Nash et al., 2002). Their model includes six variables: Ca2+ concentration, diacylglycerol (DAG) concentration, ligand-bound mGlu5R dimer (DIM) concentration, IP3 concentration, fraction of active protein kinase C (PKC), and fraction of Ca2+-inhibited IP3Rs meaning fraction of inactive IP3Rs (see Tables 1, 5).
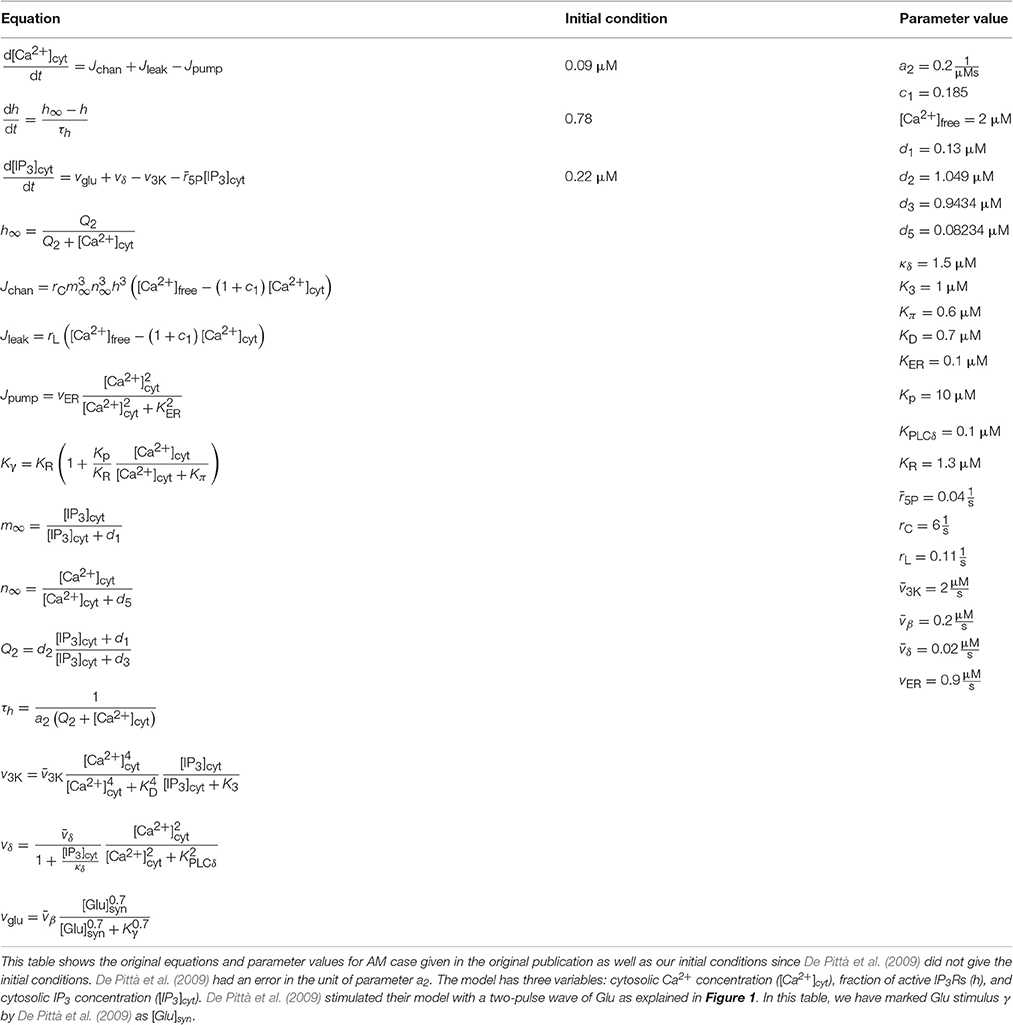
Table 4. Details of the model by De Pittà et al. (2009).
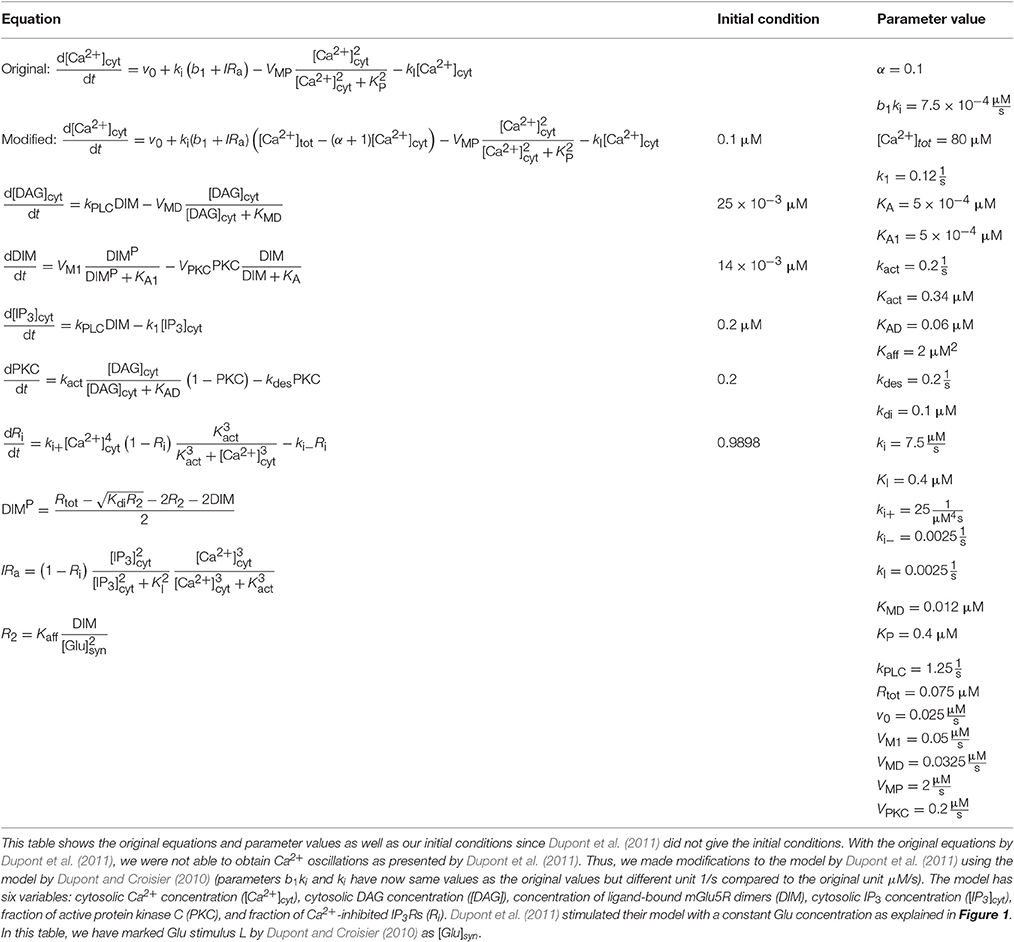
Table 5. Details of the model by Dupont et al. (2011).
2.5. Simulations
We implemented the models in MATLAB® and in Python based on the information in the original publications, such as equations, parameter values, initial conditions, and stimuli (see Tables 1–5), and simulated the models. In MATLAB®, we used both the forward Euler method and built-in differential equation solvers, such as ode15s. In Python, we built and ran the models using Jupyter Notebook (jupyter.org) and used Scipy's differential equation solver odeint. Simulations run using different platforms and solvers produced consistent results. The models implemented in Python can be found in ModelDB, Accession numbers 223144, 223269, 223273, and 223274 (senselab.med.yale.edu/modeldb; Migliore et al., 2003; Hines et al., 2004). We checked if we were able to reproduce the original results given in the original publications (see Figure 1 and Table 6). The percentage changes in Table 6 were calculated using:
where x is the original value and y is the reproduced value. We also tested the comparability of the models to each other (see Figures 2–5).
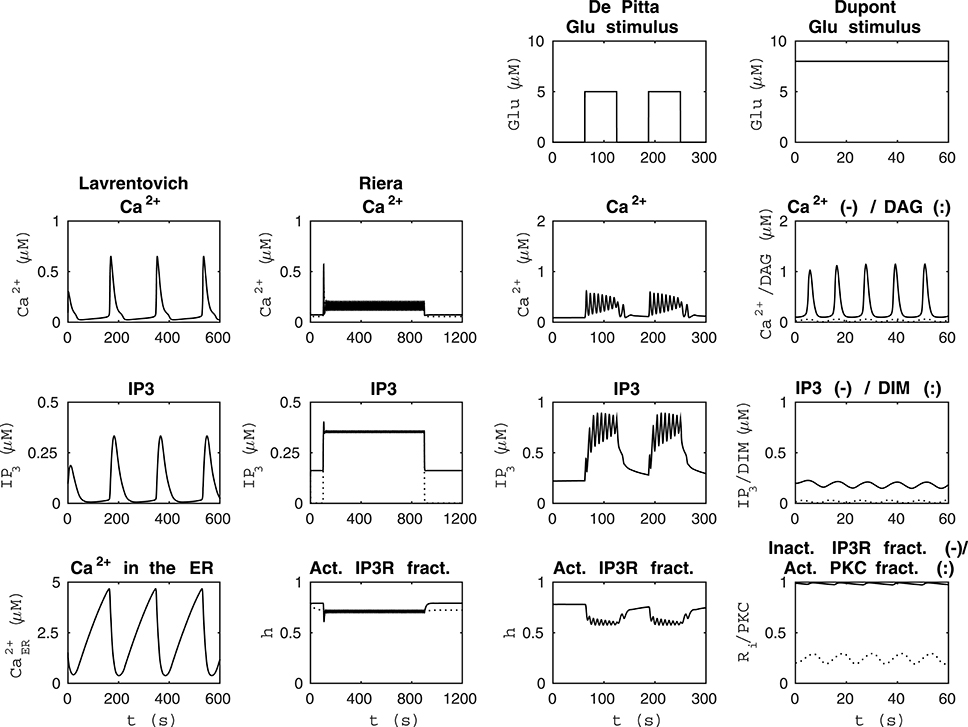
Figure 1. Reproducibility of the basic model behavior with the original parameter values and stimulus. The first column from the left presents the simulation of the model by Lavrentovich and Hemkin (2008) in the same condition as Figure 3 of the original publication except that the concentrations of IP3 and Ca2+ in the ER were not plotted in the original publication (see Table 2). The second column from the left shows simulation results of our modified version of the model by Riera et al. (2011a) (see Table 3) when the total free Ca2+ concentration was set to a constant value of 2 μM (jin+vCCE−vOUT = 0) based on Figure 4b of the original publication and XIP3 was a pulse function. Thus, XIP3 was 0.43 μM/s between 100 and 900 s and either 0 (curves with dotted lines) or 0.2 μM/s (curves with solid lines) otherwise. The second column from the right shows simulation results in the same condition as Figure 12 AM of the original publication by De Pittà et al. (2009) (stimulus was a two-pulse wave with alternating Glu concentrations of 2 nM and 5 μM, pulse duration of 62.5 s, and period 125 s), except that the fraction of active IP3Rs (h) was not plotted in the original publication (see Table 4). The first column from the right shows simulation results of our modified version of the model by Dupont et al. (2011) in the same condition as Figure 2 of the original publication by Dupont et al. (2011) (stimulus was a constant Glu concentration of 8 μM), except that the IP3 concentration and fraction of inactive IP3Rs (Ri) were not plotted in the original publication (see Table 5). See Table 6 for more details.
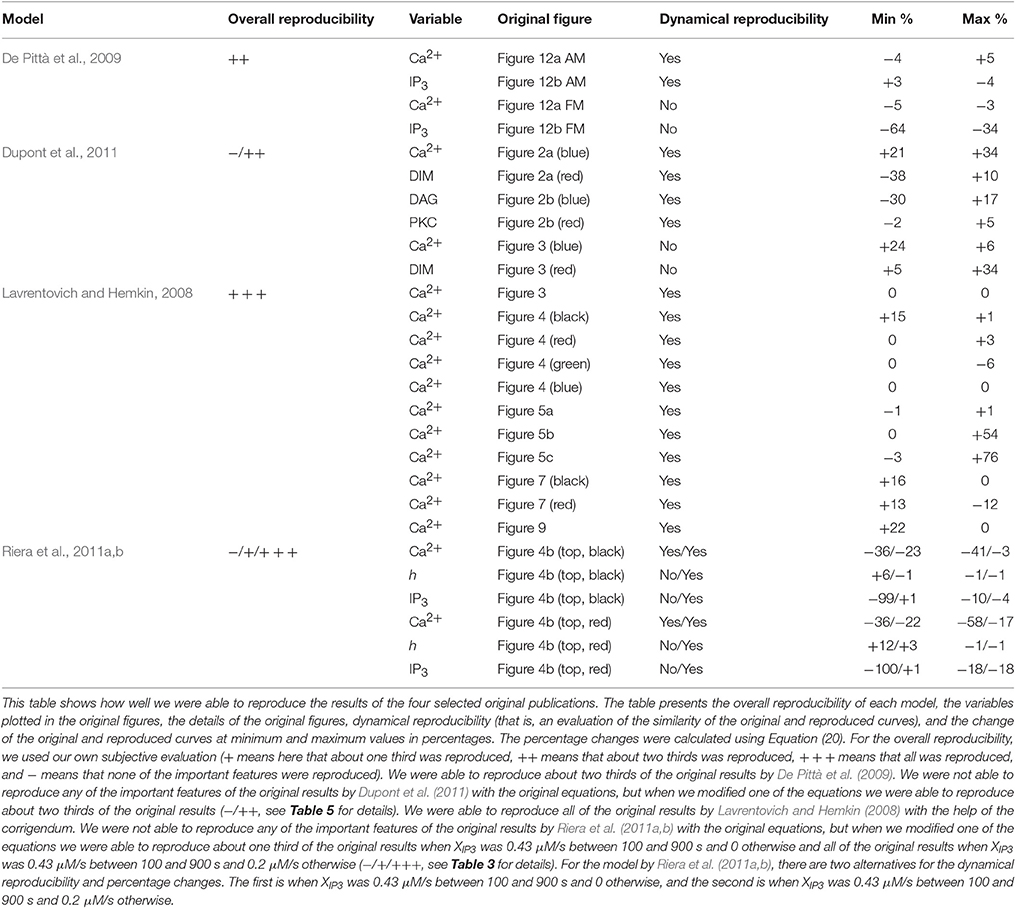
Table 6. Model reproducibility.
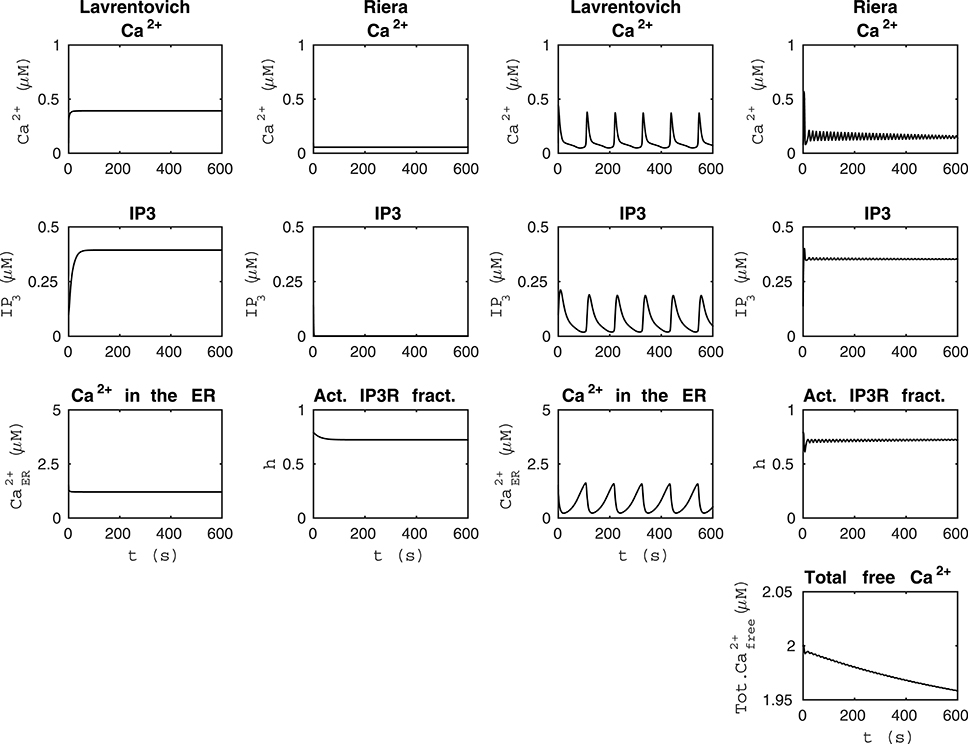
Figure 2. Comparability of the models by Lavrentovich and Hemkin (2008) and Riera et al. (2011a,b). The first column from the left shows that the model by Lavrentovich and Hemkin (2008) did not oscillate when the sum of fluxes over the cell membrane was zero () and otherwise similar simulation setup as in Figure 1. The second column from the left shows that our modified version of the model by Riera et al. (2011a,b) did not oscillate when we changed the parameter producing IP3 (XIP3) to zero in addition to having the total free Ca2+ concentration as constant value of 2 μM and otherwise similar simulation setup as in Figure 1. In this case, IP3 concentration is almost zero. The second column from the right shows the simulation results of the model by Lavrentovich and Hemkin (2008) when we changed the value of VM2 to 5.8 μM/s and otherwise similar simulation setup as in Figure 1. The first column from the right shows the simulation results of the model by Riera et al. (2011a,b) when we had total free Ca2+ concentration as a variable, XIP3 as 0.43 μM/s, and otherwise similar simulation setup as in Figure 1. The dynamical behaviors of these models were still different.
3. Results
In this study, we chose four single astrocyte models (Lavrentovich and Hemkin, 2008; De Pittà et al., 2009; Dupont et al., 2011; Riera et al., 2011a,b) to test their reproducibility in detail. Additionally, we tested the comparability of pairs of these models in different stimulation conditions or research settings. Table 1 presents a general overview of these studied models and lists our findings on the following six items: Is the model available online, is a graphical illustration of the model given in the original publication, and are all the equations, stimuli, parameter values, and initial conditions given in the original publication. On a closer look, it was also possible to find errors in equations or parameter values. In Tables 2–5, we show the original and modified versions of the equations, initial conditions, and parameter values for the selected four models used in this study. In Table 6, we show how well we were able to reproduce the original results with the information given in the original publication (see also Manninen et al., in press). The table presents the overall reproducibility of each model, the variables plotted in the original figures, the details of the original figures, dynamical reproducibility (that is, an evaluation of the similarity of the original and reproduced curves), and the change of the original and reproduced curves at minimum and maximum values in percentages.
3.1. Reproducibility
Lavrentovich and Hemkin (2008) and Riera et al. (2011a,b) studied spontaneous Ca2+ oscillations in a single astrocyte model. Lavrentovich and Hemkin (2008) explicitly presented all the equations, parameter values, and initial conditions in their publication and they have additionally provided a corrigendum (see Tables 1, Table 2 for details). They showed five simulation result figures where the variables were plotted against time. We were able to reproduce well all of them (Figures 3–5, 7, 9 of the original publication) with our implementation of the model (see also Manninen et al., in press). The first column from the left of Figure 1 (under “Lavrentovich”) shows the same behavior as Figure 3 of the original publication by Lavrentovich and Hemkin (2008) when using the information in the corrigendum (see Table 6 for more details). It was difficult to extract the exact maximum value from the original figures (Figures 5b,c of the original publication by Lavrentovich and Hemkin, 2008) if the maximum value occurred in an early stage of the simulation. Thus, Table 6 shows large percentage changes when the original and reproduced values are compared.
Riera et al. (2011a,b) presented all model equations and parameter values in their publication (see Tables 1, 3 for details). However, they did not give the initial conditions for the variables, but we were able to obtain them from the results of the original publication (Riera et al., 2011a, see Tables 1, 3 for details). For the Ca2+ and IP3 concentrations, we set the initial values to 0.09 μM and 0.14 μM, respectively. For the fraction of active IP3Rs, we set the initial value to 0.79. The total free Ca2+ concentration we set to a constant value of 2 μM (the sum of fluxes over the cell membrane was zero; jin+vCCE−vOUT = 0) based on Figure 4b of the original publication by Riera et al. (2011a). While trying to reproduce the simulation results as in Figure 4b of the original publication, we realized that there was a typographical error in the original differential equation for the fraction of active IP3Rs (see Tables 3, 6 for details). After modifying the equation accordingly, we were able to reproduce, with our implementation of the model, more similar results as in Figure 4b of the original publication. The second column from the left of Figure 1 (under “Riera”) shows that our values for h and IP3 did not stay high in the beginning of the simulation as the black curves did in Figure 4b of the original publication when XIP3 was 0.43 μM/s between 100 s and 900 s and 0 otherwise (curves with dotted lines in Figure 1). Especially, the concentration of IP3 dropped nearly to zero which can be seen in Table 6 as very high percentage changes in the minimum values. One possible reason for the differing original and reproduced results is that Riera et al. (2011a) must have used a nonzero value for XIP3 in the beginning of the simulation. Thus, a pulse function of 0.43 μM/s between 100 and 900 s, and otherwise 0.2 μM/s produced about the same curves as the original figure (see curves with solid lines in Figure 1 and Table 6).
De Pittà et al. (2009) and Dupont et al. (2011) modeled neurotransmitter-evoked Ca2+ excitability. De Pittà et al. (2009) presented all the equations and parameter values in their publication (see Tables 1, 4 for details). However, they did not give the initial conditions for the variables. For Ca2+ concentration, IP3 concentration, and the fraction of active IP3Rs, we set the initial values to 0.09 μM, 0.22 μM, and 0.78, respectively. De Pittà et al. (2009) showed one simulation result figure (Figure 12 of the original publication with both the amplitude modulation (AM) and frequency modulation (FM)), where the variables were plotted against time. We were able to reproduce well Figure 12 AM of the original publication with our implementation of the model (see the second column from the right of Figure 1 under “De Pittà”). The stimulus used in Figure 1 was a two-pulse wave with alternating Glu concentrations of 2 nM and 5 μM, pulse duration of 62.5 s, and period 125 s. Compared to Figure 12 FM of the original publication, we were not able to reproduce the lower amplitude oscillations toward the end of stimulus and our IP3 concentration had smaller values (see Table 6 for details). They have also provided an erratum. However, the erratum did not provide any such information that helped us to reproduce the results.
Dupont et al. (2011) presented a model for mGlu5R-induced Ca2+ oscillations. Dupont et al. (2011) presented all the equations and parameter values in the original publication, but did not give the initial conditions for the variables (see Tables 1, 5 for details). For four of the variables, we were able to obtain the initial values from the results of the original publication. The initial values we used were 0.1 μM for the Ca2+ concentration, 14 nM for the concentration of DIM, 25 nM for the DAG concentration, and 0.2 for the fraction of active PKC. For the IP3 concentration and fraction of Ca2+-inhibited IP3Rs we decided to use 0.2 μM and 0.9898, respectively (see also Manninen et al., in press). Dupont et al. (2011) presented two figures where the variables were plotted against time. With the original parameter values, we were able to reproduce the oscillating behavior as seen in Figure 2 of the original publication for the concentrations of DAG and DIM, and fraction of active PKC. However, in our implementation, the Ca2+ concentration oscillated with very small amplitude (nM). In addition, with the original parameter values we were not able to obtain oscillating Ca2+ behavior as in Figure 3 of the original publication. We then checked the references mentioned by Dupont et al. (2011), and decided in this study to change the equation for Ca2+ concentration. We modified the equation to be more similar to the one in the publication by Dupont and Croisier (2010) (see Table 5 for details). With this modified model we were able to reproduce the oscillating behavior as in Figure 2 of the original publication by Dupont et al. (2011) (see the first column from the right of Figure 1 under “Dupont” and Table 6 for details). In this case, the stimulus was a constant Glu concentration of 8 μM. When comparing our simulation results to Figure 3 of the original publication, the modified model implemented by us produced more frequent oscillations for Ca2+ concentration compared to the original model and the concentration of DIM oscillated once before reaching a steady-state value (see Table 6 for details). We therefore conclude that our modified Ca2+ equation was not exactly the same that Dupont et al. (2011) must have used in their original simulations.
3.2. Comparability
It was difficult to compare the models by Lavrentovich and Hemkin (2008) and Riera et al. (2011a,b) because these models originally had quite differing dynamical behavior (see Figure 1). However, these models actually have some components that are identical or just have different parameter values (Tables 2, 3); Ca2+ efflux from the cytosol to the extracellular space (), flow of Ca2+ from the extracellular space to the cytosol (parameters vin by Lavrentovich and Hemkin, 2008 and jin by Riera et al., 2011a,b), and transport of Ca2+ from the cytosol to the ER via SERCA pump (vSERCA). The production and degradation terms of IP3 are also almost identical with just different parameter values except that the model by Riera et al. (2011a,b) has two production terms, the parameter XIP3 in addition to the production term depending on Ca2+ concentration. Different equations are used for CICR via IP3Rs (named vCICR by Lavrentovich and Hemkin, 2008 and vRel by Riera et al., 2011a,b), in which Ca2+ is released from the ER to the cytosol. Lavrentovich and Hemkin (2008) and Riera et al. (2011a,b) modeled the leak flux from the ER to the cytosol due to concentration gradient with similar equations but different parameter values. Riera et al. (2011a,b) modeled it as part of the equation for vRel. In addition, Riera et al. (2011a,b) modeled the capacitative Ca2+ entry (vCCE) from extracellular space to the cytosol and also had the fraction of active IP3Rs as a model variable. Lavrentovich and Hemkin (2008) did not take into account the ratio of effective volumes for cytoplasmic and ER Ca2+ in their model.
We tested the model by Lavrentovich and Hemkin (2008) when the sum of ionic fluxes across the cell membrane was zero () and otherwise the same setup as in Figure 1 (see the first column from the left of Figure 2 under “Lavrentovich”). Mimicking this setup in the model by Riera et al. (2011a,b) (compare to the second column from the left of Figure 1 under “Riera”), we changed the parameter producing IP3 (XIP3) to zero in the model by Riera et al. (2011a,b) in addition to having the total free Ca2+ concentration as a constant value of 2 μM as in Figure 1 (see the second column from the left of Figure 2 under “Riera”). Comparing these two columns of Figure 2, it is evident that the model by Lavrentovich and Hemkin (2008) has higher Ca2+ and IP3 concentrations compared to the model by Riera et al. (2011a,b). However, when taking into account the ratio of effective volumes for cytoplasmic and ER Ca2+ (β = 35) from the model by Di Garbo et al. (2007) to the model by Lavrentovich and Hemkin (2008), the Ca2+ and IP3 concentrations became lower than compared to the condition when not taking the ratio into account (not shown). Including this ratio did not work directly with the original setup of the model since model variables ceased to oscillate.
Next, we attempted to maximize the frequency of oscillations in the model by Lavrentovich and Hemkin (2008) to match better the results of the model by Riera et al. (2011a,b). The second column from the right of Figure 2 (under “Lavrentovich”) shows the results when the parameter VM2 related to the SERCA pump was changed to 5.8 μM/s in the model by Lavrentovich and Hemkin (2008) and a simulation setup otherwise similar as in Figure 1 was used. With this value we were able to obtain more frequent Ca2+ oscillations compared to the original attempt presented in Figure 1. The first column from the right of Figure 2 (under “Riera”) shows the results of a setup where the total free Ca2+ concentration was a variable and XIP3 was a constant value of 0.43 μM/s in the model by Riera et al. (2011a,b) and otherwise the simulation setup was similar to Figure 1. It can thus be concluded that these two models have very differing dynamical behavior.
We also tested how the models by Lavrentovich and Hemkin (2008) and Riera et al. (2011a,b) behaved with each others' parameter values when we had net ionic fluxes over the cell membrane (not shown). We studied the equations of both models and decided to change only those parameter values that were in equations of exactly identical form in both models (parameters vin vs. jin, vM2 vs. VSERCA, kf vs. v2, vp vs. vδ, kp vs. KδCa, and kdeg vs. KIP3 by Lavrentovich and Hemkin (2008) and Riera et al. (2011a,b), respectively). We tested both modifying all values simultaneously, and modifying them one by one. We discovered that the model by Lavrentovich and Hemkin (2008) was not able to oscillate at all or only once in 600 s with any of the values by Riera et al. (2011a,b), neither when parameters were tested one by one nor when they were tested simultaneously. When testing the model by Riera et al. (2011a,b) with the parameter values of the model by Lavrentovich and Hemkin (2008), we found out that if the two values for the same parameter were almost similar, the model by Riera et al. (2011a,b) still oscillated with the parameter value from the model by Lavrentovich and Hemkin (2008). XIP3 would appear to be the most important parameter causing the model by Riera et al. (2011a,b) to oscillate. If XIP3 was zero, the model did not oscillate with the original parameter value or with any parameter value from the model by Lavrentovich and Hemkin (2008).
We compared the model by De Pittà et al. (2009) and our modified version of the model by Dupont et al. (2011) using four different stimuli. Figure 3 shows the model behaviors when the stimuli were two different constant Glu concentrations. The two columns from the left of Figure 3 show how the models behaved when the stimulus was a constant Glu concentration of 0.1 μM. We chose this stimulus because both models oscillated with a value this small. The two columns from the right of Figure 3 show how the models behaved when the stimulus was a constant Glu concentration of 2.5 μM. This stimulus was chosen because it clearly brought out the difference between these two models. The simulation results of the model by De Pittà et al. (2009) with a constant Glu stimulus of 2.5 μM showed how all the model variables, Ca2+, IP3, and fraction of active IP3Rs, oscillated, whereas the simulation results of our modified version of the model by Dupont et al. (2011) showed oscillations with only two model variables, Ca2+ concentration and the fraction of Ca2+-inhibited IP3Rs. In addition, it should be noted that the models had opposite behaviors with these two stimulus values; the higher stimulus value produced higher Ca2+ concentrations with the model by De Pittà et al. (2009), but it produced lower Ca2+ concentrations with our modified version of the model by Dupont et al. (2011). Based on experimental data (Honsek et al., 2012; Haustein et al., 2014), the Ca2+ concentration is higher when the Glu concentration is higher, and the model by De Pittà et al. (2009) seems to behave more realistically than our modified version of the model by Dupont et al. (2011) in this sense (see Figure 3).
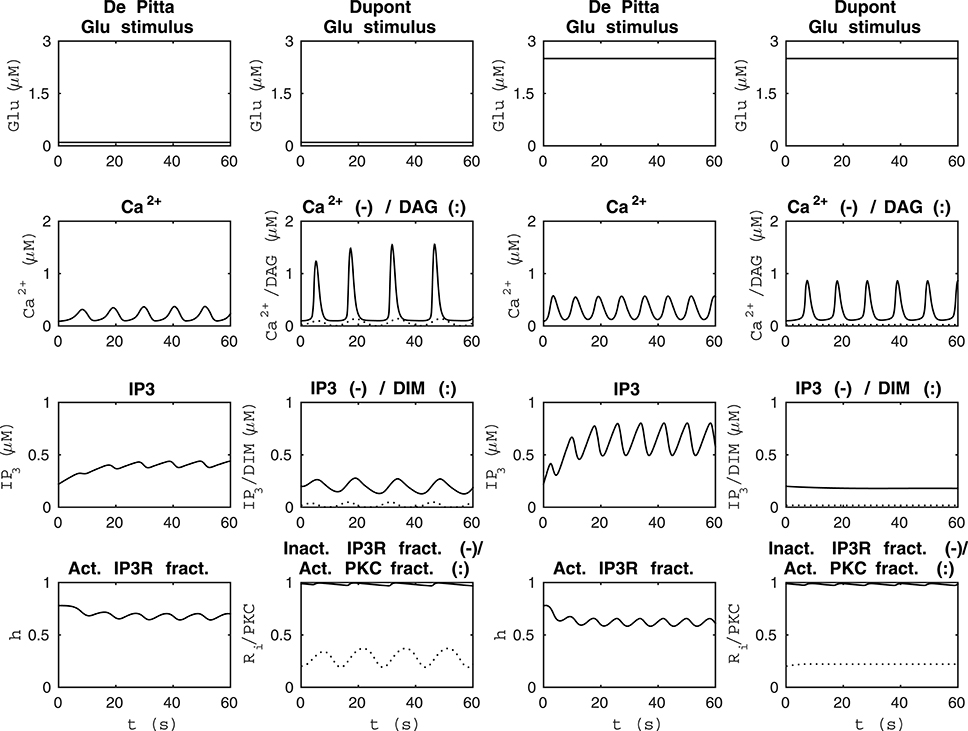
Figure 3. Comparability of the model by De Pittà et al. (2009) and our modified version of the model by Dupont et al. (2011) with two different constant Glu stimuli. The two columns from the left show how the models behaved when the stimulus was a constant Glu concentration of 0.1 μM. The two columns from the right show how the models behaved when the stimulus was a constant Glu concentration of 2.5 μM. The models had opposite behaviors with these two specific stimuli; the higher constant stimulus value produced higher Ca2+ concentrations with the model by De Pittà et al. (2009), whereas it produced lower Ca2+ concentrations with our modified version of the model by Dupont et al. (2011).
Figure 4 shows model dynamics when the Glu stimuli were two different seven-pulse waves. The two columns from the left of Figure 4 show how the models behaved when the Glu stimulus was a seven-pulse wave with alternating concentrations of 2 nM and 5 μM, pulse duration of 5 s, and period 15 s. The two columns from the right of Figure 4 show how the models behaved when the Glu stimulus was a seven-pulse wave with alternating concentrations of 2 nM and 5 μM, pulse duration of 1 s, and period 6 s. In our modified version of the model by Dupont et al. (2011), the Ca2+ concentration oscillated even with the Glu concentration of 2 nM, which was not the case with the model by De Pittà et al. (2009) (see Figure 4). The model by Dupont et al. (2011) was developed and tested for a constant stimulus, whereas the model by De Pittà et al. (2009) was developed for a varying stimulus (see Figures 3–5).
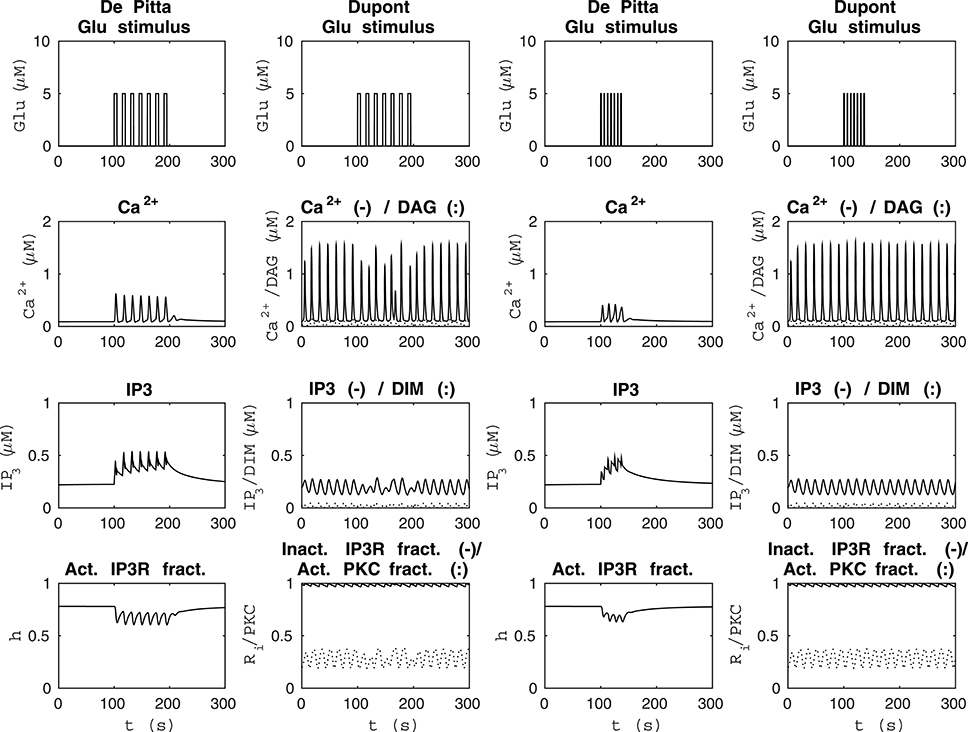
Figure 4. Comparability of the model by De Pittà et al. (2009) and our modified version of the model by Dupont et al. (2011) with two different seven-pulse waves of Glu stimulus. The two columns from the left show how the models behaved when the stimulus was a seven-pulse wave with alternating Glu concentrations of 2 nM and 5 μM, pulse duration of 5 s, and period 15 s. The two columns from the right show how the models behaved when the stimulus was a seven-pulse wave with alternating Glu concentrations of 2 nM and 5 μM, pulse duration of 1 s, and period 6 s. With our modified version of the model by Dupont et al. (2011), the Ca2+ concentration oscillated even at Glu stimulus of 2 nM, which was not the case with the model by De Pittà et al. (2009).
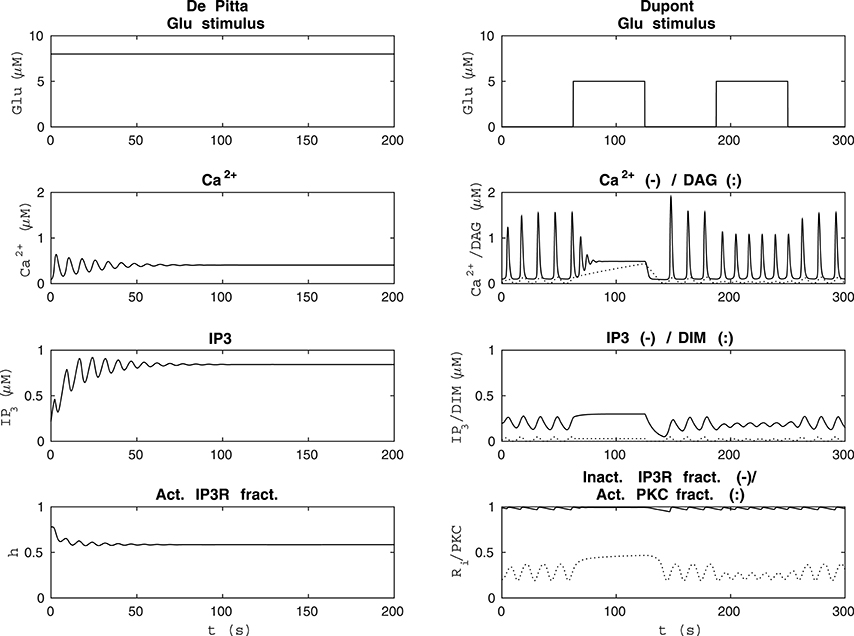
Figure 5. Comparability of the model by De Pittà et al. (2009) and our modified version of the model by Dupont et al. (2011) with each other's original stimulus. The left column shows the results of the model by De Pittà et al. (2009) when the stimulus was a constant Glu concentration of 8 μM (the original stimulus of the model by Dupont et al., 2011). The model by De Pittà et al. (2009) ceased to oscillate around 100 s. The right column shows how the original stimulus from the model by De Pittà et al. (2009) (a two-pulse wave with alternating Glu concentrations of 2 nM and 5 μM, pulse duration of 62.5 s, and period 125 s) affected our modified version of the model by Dupont et al. (2011).
Since the model by De Pittà et al. (2009) and our modified version of the model by Dupont et al. (2011) produced opposite results, we decided to investigate their dynamical behavior in more detail. Our modified version of the model by Dupont et al. (2011) did not oscillate with all the model variables when the stimulus was a constant Glu concentration between 1.8 μM and 3.4 μM or zero. We also discovered that when the stimulus was a constant Glu concentration higher than 3.8 μM, the model by De Pittà et al. (2009) ceased to oscillate during the simulation, and it reached a steady-state. The higher the constant stimulus concentration, the faster the model by De Pittà et al. (2009) ceased to oscillate. At a constant Glu concentration of 3.8 μM, the model ceased to oscillate around 500 s. At a constant Glu concentration of 4 μM, the model ceased to oscillate around 300 s. At a constant Glu concentration of 8 μM (the original stimulus of the model by Dupont et al., 2011), the model ceased to oscillate around 100 s (see Figure 5). Such a long-lasting constant stimulus may be considered to mimic cell culture conditions where a neurotransmitter is applied with a pipette and not immediately rinsed. We also tested our modified version of the model by Dupont et al. (2011) with the original stimulus of the model by De Pittà et al. (2009) (compare Figures 1 and 5).
4. Discussion
In this study, we evaluated four relatively simple computational models of astrocytes (Lavrentovich and Hemkin, 2008; De Pittà et al., 2009; Dupont et al., 2011; Riera et al., 2011a,b) by implementing the equations based on what was presented in the original publications. Our aim was to reproduce the simulation results of the original publications and compare them to see if the models can substitute one another. Unexpectedly, we found out that three of the model publications did not give all the necessary information needed to implement these models (see also Manninen et al., in press). Moreover, we were able to reproduce the original results of only one of the four models completely based on the information in the original publications and errata (Lavrentovich and Hemkin, 2008). We actually found obvious errors in two of the model publications (Dupont et al., 2011; Riera et al., 2011a,b). When we modified the equations, the reimplemented models produced the original results more accurately.
In addition to reproducibility, we also addressed the comparability of the models. Even though these models are assumed to describe relatively similar biological processes, their behaviors are quite different, making it difficult to compare them. The model by Riera et al. (2011a,b) oscillated more frequently than the model by Lavrentovich and Hemkin (2008). We found out that the models by Lavrentovich and Hemkin (2008) and Riera et al. (2011a,b) were sensitive to parameter values, especially the model by Lavrentovich and Hemkin (2008) changed its behavior completely when using the parameter values from the model by Riera et al. (2011a,b). Overall, the simulation results of the model by De Pittà et al. (2009) and our modified version of the model by Dupont et al. (2011) showed similar kind of behavior when a constant stimulus was used. However, a higher stimulus value produced higher Ca2+ concentrations with the model by De Pittà et al. (2009), whereas it produced lower Ca2+ concentrations with our modified version of the model by Dupont et al. (2011). Furthermore, the higher the constant stimulus concentration, the quicker the model by De Pittà et al. (2009) ceased to oscillate. The two models produced differing results when using the same pulse wave stimuli. The Ca2+ concentration oscillated even with a low stimulus concentration in our modified version of the model by Dupont et al. (2011), which was not the case with the model by De Pittà et al. (2009).
We conclude that the four studied models consider only a subset of mechanisms responsible for astrocyte Ca2+ excitability and leave out several essential mechanisms, such as the cell membrane ionic currents and various intracellular signaling cascades. Based on these results we are unable to conclude if any of these models is a suitable generic model for astrocyte excitability. However, we conclude that since the dynamical behavior of the models is quite different with the same parameter values or stimulus, they cannot be considered to represent exactly the same astrocyte subtype or phenomena. Future work should include sophisticated validation of computational models with in vitro and in vivo experimental data.
In neuroscience, reproducibility and comparability of research results have gained a lot of interest over the past years (Teeters et al., 2008; Mochizuki et al., 2016; Zehl et al., 2016). Simultaneously, computational models of brain function are being introduced in a rapidly increasing quantity. Modeling in neuroscience offers a useful tool for integrating current knowledge and producing intelligent hypotheses about mechanisms of brain function on all levels of organization. However, it is a frequent problem that publications lack crucial details in how the models are presented, making it hard to reproduce the original simulation results (see, e.g., Manninen et al., 2010, in press). We have discovered that too often graphical illustrations of the models are misleading or completely missing, and sometimes all equations are not explicitly given in the publications, but are just referred to with a citation to a previous model publication (see, e.g., Manninen et al., 2010, in press). Thus, it is often difficult to know exactly what the actual model components are. The field of computational neuroscience benefits from published, well-documented, and well-validated models with detailed information about the exact biological subsystem the model is developed for. Careful consideration of all the aforementioned points enhances model re-usability in future research and should accelerate the development of more accurate and comprehensive models to decipher various aspects of the functioning of the brain. Due to problems similar to those described in this publication, reproducibility and comparability of research results have recently gained much interest in computational neuroscience, as well as in neuroscience in general.
To promote re-usability of models, several model databases are available to store models and metadata for future use, such as ModelDB (Hines et al., 2004), BioModels database (Le Novère et al., 2006), and the CellML Model Repository (Lloyd et al., 2008). Database systems for both published data and models are being developed by international large-scale projects such as Allen Institute for Brain Science (www.alleninstitute.org) and Human Brain Project (www.humanbrainproject.eu). The Open Source Brain initiative (www.opensourcebrain.org) is an online platform which aims to facilitate sharing and collaborative development of neuronal models. Very few systems, however, address in full detail the reproducibility of the stored models. Part of the challenge is evidently related to funding and resources of reproduction of models. Efficient testing of reproducibility in the publication process requires personnel capable of testing the models, and informatics systems supporting easy, user-friendly testing. As indicated by our study with computational astrocyte models, there is a clear need for publishing platforms that stress reproducibility.
Since the scientific community across all disciplines in bioscience faces the same challenge of ensuring accessibility, reproducibility, and efficient comparability of scientific results, a set of guidelines and good practices should be employed. To promote reproducible science, good model description practices for realistic neuronal network models (Nordlie et al., 2009) have been suggested in addition to minimum information requirements for reproduction (Le Novère et al., 2005; Waltemath et al., 2011a). In addition, many Extensible Markup Language (XML)-based model and simulation representation formats have been developed, such as SBML (Hucka et al., 2003), CellML (Lloyd et al., 2004), NeuroML (Gleeson et al., 2010), SED-ML (Waltemath et al., 2011b), and LEMS (Cannon et al., 2014). Jupyter Notebook (earlier known as IPython Notebook) is a potential technology to enhance reproducibility and accessibility. However, many authors still do not make their models publicly available or they publish their models in a format that is not easily exchangeable between different simulation platforms. These issues should be reflected in the training of young scientists in neuroscience, including computational neuroscientists (see also Akil et al., 2016).
Good practices could be developed and enforced by international neuroscience organizations and publishers to steer the development of the field and to improve the quality of published work as follows. First, more emphasis should be put on presenting a set of figures describing the function of all model variables. The actual model code files and information needed for interpreting them should be made available when publishing a model. In addition, information necessary to reimplement the model and reproduce the original simulation results should be presented. These include, for example, all numerical values of parameters, initial conditions, and stimuli used in each simulation. This will further facilitate model development and reuse, as well as the use of models as educational tools for younger scientists. Finally, reviewers should have the responsibility to request all the above-mentioned information in the publications to ensure the reproducibility of published models.
In summary, we have pointed out several challenges in the field of computational neuroscience, specifically in relation to reproducibility and comparability of computational models, using models of astrocyte Ca2+ excitability as examples. The key findings of the present work can be summarized as follows. First, our results stress the importance of proper comparison of models developed for similar phenomena and validation of models against experimental data. Second, our results emphasize a careful, critical review process of the developed models. Third, our work points out that a variety of aspects of model development and presentation could be improved. The style and comprehensiveness of how to present the model details are examples of such crucial aspects. Specifically, all necessary mathematical equations, as well as the parameter values of equations, the initial values of variables, and the stimuli used, should be given precisely. Fourth, model codes should be made publicly available. We expect that ultimately the large-scale, global neuroscience and neuroinformatics projects and initiatives (see, e.g., Markram et al., 2015; Bouchard et al., 2016; Grillner et al., 2016) will help in solving the current challenges in model validation, reproducibility, and comparability.
Author Contributions
Conceived and designed the experiments: TM, RH, and ML. Implemented the models and performed the simulations: TM. Analyzed, evaluated, and compared the results: TM, RH, and ML. Wrote the article: TM, RH, and ML.
Funding
This project received funding from the European Union Seventh Framework Programme (FP7) under grant agreement No. 604102 (HBP), European Unions Horizon 2020 research and innovation programme under grant agreement No. 720270, and Academy of Finland (decision No. 297893).
Conflict of Interest Statement
The authors declare that the research was conducted in the absence of any commercial or financial relationships that could be construed as a potential conflict of interest.
Acknowledgments
The authors wish to thank Tampere University of Technology Graduate School, Emil Aaltonen Foundation, The Finnish Concordia Fund, and Ulla Tuominen Foundation for support for RH.
References
Aguado, F., Espinosa-Parrilla, J. F., Carmona, M. A., and Soriano, E. (2002). Neuronal activity regulates correlated network properties of spontaneous calcium transients in astrocytes in situ. J. Neurosci. 22, 9430–9444.
Agulhon, C., Fiacco, T. A., and McCarthy, K. D. (2010). Hippocampal short-and long-term plasticity are not modulated by astrocyte Ca2+ signaling. Science 327, 1250–1254. doi: 10.1126/science.1184821
Akil, H., Balice-Gordon, R., Cardozo, D. L., Koroshetz, W., Norris, S. M. P., Sherer, T., et al. (2016). Neuroscience training for the 21st century. Neuron 90, 917–926. doi: 10.1016/j.neuron.2016.05.030
Allegrini, P., Fronzoni, L., and Pirino, D. (2009). The influence of the astrocyte field on neuronal dynamics and synchronization. J. Biol. Phys. 35, 413–423. doi: 10.1007/s10867-009-9166-8
Atri, A., Amundson, J., Clapham, D., and Sneyd, J. (1993). A single-pool model for intracellular calcium oscillations and waves in the Xenopus laevis oocyte. Biophys. J. 65, 1727–1739. doi: 10.1016/S0006-3495(93)81191-3
Bennett, M. R., Farnell, L., and Gibson, W. G. (2008). Origins of blood volume change due to glutamatergic synaptic activity at astrocytes abutting on arteriolar smooth muscle cells. J. Theor. Biol. 250, 172–185. doi: 10.1016/j.jtbi.2007.08.024
Bouchard, K. E., Aimone, J. B., Chun, M., Dean, T., Denker, M., Diesmann, M., et al. (2016). High-performance computing in neuroscience for data-driven discovery, integration, and dissemination. Neuron 92, 628–631. doi: 10.1016/j.neuron.2016.10.035
Cannon, R. C., Gewaltig, M.-O., Gleeson, P., Bhalla, U. S., Cornelis, H., Hines, M. L., et al. (2007). Interoperability of neuroscience modeling software: current status and future directions. Neuroinformatics 5, 127–138. doi: 10.1007/s12021-007-0004-5
Cannon, R. C., Gleeson, P., Crook, S., Ganapathy, G., Marin, B., Piasini, E., et al. (2014). LEMS: a language for expressing complex biological models in concise and hierarchical form and its use in underpinning NeuroML 2. Front. Neuroinform. 8:79. doi: 10.3389/fninf.2014.00079
Crook, S. M., Davison, A. P., and Plesser, H. E. (2013). “Learning from the past: approaches for reproducibility in computational neuroscience,” in 20 Years of Computational Neuroscience, ed J. M. Bower (New York, NY: Springer), 73–102.
De Pittà, M., Brunel, N., and Volterra, A. (2016). Astrocytes: orchestrating synaptic plasticity? Neuroscience 323, 43–61. doi: 10.1016/j.neuroscience.2015.04.001
De Pittà, M., Goldberg, M., Volman, V., Berry, H., and Ben-Jacob, E. (2009). Glutamate regulation of calcium and IP3 oscillating and pulsating dynamics in astrocytes. J. Biol. Phys. 35, 383–411. Erratum (2010) 36, 221–222. doi: 10.1007/s10867-009-9155-y
De Pittà, M., Volman, V., Berry, H., Parpura, V., Volterra, A., and Ben-Jacob, E. (2012). Computational quest for understanding the role of astrocyte signaling in synaptic transmission and plasticity. Front. Comput. Neurosci. 6:98. doi: 10.3389/fncom.2012.00098
De Schutter, E. (2008). Why are computational neuroscience and systems biology so separate. PLoS Comput. Biol. 4:e1000078. doi: 10.1371/journal.pcbi.1000078
De Young, G. W., and Keizer, J. (1992). A single-pool inositol 1,4,5-trisphosphate-receptor-based model for agonist-stimulated oscillations in Ca2+ concentration. Proc. Natl. Acad. Sci. U.S.A. 89, 9895–9899. doi: 10.1073/pnas.89.20.9895
Di Garbo, A., Barbi, M., Chillemi, S., Alloisio, S., and Nobile, M. (2007). Calcium signalling in astrocytes and modulation of neural activity. Biosystems 89, 74–83. doi: 10.1016/j.biosystems.2006.05.013
Dupont, G., and Croisier, H. (2010). Spatiotemporal organization of Ca2+ dynamics: a modeling-based approach. HFSP J. 4, 43–51. doi: 10.2976/1.3385660
Dupont, G., and Goldbeter, A. (1993). One-pool model for Ca2+ oscillations involving Ca2+ and inositol 1, 4, 5-trisphosphate as co-agonists for Ca2+ release. Cell Calcium 14, 311–322. doi: 10.1016/0143-4160(93)90052-8
Dupont, G., Lokenye, E. F. L., and Challiss, R. A. J. (2011). A model for Ca2+ oscillations stimulated by the type 5 metabotropic glutamate receptor: an unusual mechanism based on repetitive, reversible phosphorylation of the receptor. Biochimie 93, 2132–2138. doi: 10.1016/j.biochi.2011.09.010
Fellin, T., Ellenbogen, J. M., De Pittà, M., Ben-Jacob, E., and Halassa, M. M. (2012). Astrocyte regulation of sleep circuits: experimental and modeling perspectives. Front. Comput. Neurosci. 6:65. doi: 10.3389/fncom.2012.00065
Gleeson, P., Crook, S., Cannon, R. C., Hines, M. L., Billings, G. O., Farinella, M., et al. (2010). NeuroML: a language for describing data driven models of neurons and networks with a high degree of biological detail. PLoS Comput. Biol. 6:e1000815. doi: 10.1371/journal.pcbi.1000815
Grillner, S., Ip, N., Koch, C., Koroshetz, W., Okano, H., Polachek, M., et al. (2016). Worldwide initiatives to advance brain research. Nat. Neurosci. 19, 1118–1122. doi: 10.1038/nn.4371
Haustein, M. D., Kracun, S., Lu, X.-H., Shih, T., Jackson-Weaver, O., Tong, X., et al. (2014). Conditions and constraints for astrocyte calcium signaling in the hippocampal mossy fiber pathway. Neuron 82, 413–429. doi: 10.1016/j.neuron.2014.02.041
Hines, M. L., Morse, T., Migliore, M., Carnevale, N. T., and Shepherd, G. M. (2004). ModelDB: a database to support computational neuroscience. J. Comput. Neurosci. 17, 7–11. doi: 10.1023/B:JCNS.0000023869.22017.2e
Hituri, K., and Linne, M.-L. (2013). Comparison of models for IP3 receptor kinetics using stochastic simulations. PLoS ONE 8:e59618. doi: 10.1371/journal.pone.0059618
Höfer, T. and Politi, A., and Heinrich, R. (2001). Intercellular Ca2+ wave propagation through gap-junctional Ca2+ diffusion: a theoretical study. Biophys. J. 80, 75–87. doi: 10.1016/S0006-3495(01)75996-6
Höfer, T., Venance, L., and Giaume, C. (2002). Control and plasticity of intercellular calcium waves in astrocytes: a modeling approach. J. Neurosci. 22, 4850–4859.
Honsek, S. D., Walz, C., Kafitz, K. W., and Rose, C. R. (2012). Astrocyte calcium signals at Schaffer collateral to CA1 pyramidal cell synapses correlate with the number of activated synapses but not with synaptic strength. Hippocampus 22, 29–42. doi: 10.1002/hipo.20843
Houart, G., Dupont, G., and Goldbeter, A. (1999). Bursting, chaos and birhythmicity originating from self-modulation of the inositol 1, 4, 5-trisphosphate signal in a model for intracellular Ca2+ oscillations. Bull. Math. Biol. 61, 507–530. doi: 10.1006/bulm.1999.0095
Hucka, M., Finney, A., Sauro, H. M., Bolouri, H., Doyle, J. C., Kitano, H., et al. (2003). The systems biology markup language (SBML): a medium for representation and exchange of biochemical network models. Bioinformatics 19, 524–531. doi: 10.1093/bioinformatics/btg015
Jolivet, R., Allaman, I., Pellerin, L., Magistretti, P. J., and Weber, B. (2010). Comment on recent modeling studies of astrocyte–neuron metabolic interactions. J. Cereb. Blood Flow Metab. 30, 1982–1986. doi: 10.1038/jcbfm.2010.132
Lallouette, J., De Pittà, M., Ben-Jacob, E., and Berry, H. (2014). Sparse short-distance connections enhance calcium wave propagation in a 3D model of astrocyte networks. Front. Comput. Neurosci. 8:45. doi: 10.3389/fncom.2014.00045
Lavrentovich, M., and Hemkin, S. (2008). A mathematical model of spontaneous calcium (II) oscillations in astrocytes. J. Theor. Biol. 251, 553–560. Corrigendum (2009) 260, 332. doi: 10.1016/j.jtbi.2007.12.011
Le Novère, N., Bornstein, B., Broicher, A., Courtot, M., Donizelli, M., Dharuri, H., et al. (2006). BioModels Database: a free, centralized database of curated, published, quantitative kinetic models of biochemical and cellular systems. Nucleic Acids Res. 34, D689–D691. doi: 10.1093/nar/gkj092
Le Novère, N., Finney, A., Hucka, M., Bhalla, U. S., Campagne, F., Collado-Vides, J., et al. (2005). Minimum information requested in the annotation of biochemical models (MIRIAM). Nat. Biotechnol. 23, 1509–1515. doi: 10.1038/nbt1156
Li, Y.-X., and Rinzel, J. (1994). Equations for InsP3 receptor-mediated [Ca2+]i oscillations derived from a detailed kinetic model: a Hodgkin-Huxley like formalism. J. Theor. Biol. 166, 461–473. doi: 10.1006/jtbi.1994.1041
Linne, M.-L., and Jalonen, T. O. (2014). Astrocyte–neuron interactions: from experimental research-based models to translational medicine. Prog. Mol. Biol. Transl. Sci. 123, 191–217. doi: 10.1016/B978-0-12-397897-4.00005-X
Lloyd, C. M., Halstead, M. D. B., and Nielsen, P. F. (2004). CellML: its future, present and past. Prog. Biophys. Mol. Biol. 85, 433–450. doi: 10.1016/j.pbiomolbio.2004.01.004
Lloyd, C. M., Lawson, J. R., Hunter, P. J., and Nielsen, P. F. (2008). The CellML model repository. Bioinformatics 24, 2122–2123. doi: 10.1093/bioinformatics/btn390
López-Caamal, F., Oyarzún, D. A., Middleton, R. H., and García, M. R. (2014). Spatial quantification of cytosolic Ca2+ accumulation in nonexcitable cells: an analytical study. IEEE ACM Trans. Comput. Biol. Bioinform. 11, 592–603. doi: 10.1109/TCBB.2014.2316010
Manninen, T., Havela, R., and Linne, M.-L. (in press). “Computational models of astrocytes and astrocyte-neuron interactions: characterization, reproducibility, and future perspectives,” in Computational Glioscience, ed M. De Pittà H. Berry (Springer).
Manninen, T., Hituri, K., Hellgren Kotaleski, J., Blackwell, K. T., and Linne, M.-L. (2010). Postsynaptic signal transduction models for long-term potentiation and depression. Front. Comput. Neurosci. 4:152. doi: 10.3389/fncom.2010.00152
Manninen, T., Hituri, K., Toivari, E., and Linne, M.-L. (2011). Modeling signal transduction leading to synaptic plasticity: evaluation and comparison of five models. EURASIP J. Bioinf. Syst. Biol. 2011:797250. doi: 10.1155/2011/797250
Markram, H., Muller, E., Ramaswamy, S., Reimann, M. W., Abdellah, M., Sanchez, C. A., et al. (2015). Reconstruction and simulation of neocortical microcircuitry. Cell 163, 456–492. doi: 10.1016/j.cell.2015.09.029
Migliore, M., Morse, T. M., Davison, A. P., Marenco, L., Shepherd, G. M., and Hines, M. L. (2003). ModelDB: making models publicly accessible to support computational neuroscience. Neuroinformatics 1, 135–139. doi: 10.1385/NI:1:1:135
Min, R., Santello, M., and Nevian, T. (2012). The computational power of astrocyte mediated synaptic plasticity. Front. Comput. Neurosci. 6:93. doi: 10.3389/fncom.2012.00093
Mochizuki, Y., Onaga, T., Shimazaki, H., Shimokawa, T., Tsubo, Y., Kimura, R., et al. (2016). Similarity in neuronal firing regimes across mammalian species. J. Neurosci. 36, 5736–5747. doi: 10.1523/JNEUROSCI.0230-16.2016
Nadkarni, S., and Jung, P. (2003). Spontaneous oscillations of dressed neurons: a new mechanism for epilepsy? Phys. Rev. Lett. 91:268101. doi: 10.1103/physrevlett.91.268101
Nash, M. S., Schell, M. J., Atkinson, P. J., Johnston, N. R., Nahorski, S. R., and Challiss, R. A. J. (2002). Determinants of metabotropic glutamate receptor-5-mediated Ca2+ and inositol 1,4,5-trisphosphate oscillation frequency. J. Biol. Chem. 277, 35947–35960. doi: 10.1074/jbc.M205622200
Navarrete, M., Perea, G., Maglio, L., Pastor, J., de Sola, R. G., and Araque, A. (2013). Astrocyte calcium signal and gliotransmission in human brain tissue. Cereb. Cortex 23, 1240–1246. doi: 10.1093/cercor/bhs122
Nordlie, E., Gewaltig, M.-O., and Plesser, H. E. (2009). Towards reproducible descriptions of neuronal network models. PLoS Comput. Biol. 5:e1000456. doi: 10.1371/journal.pcbi.1000456
Parri, H. R., and Crunelli, V. (2003). The role of Ca2+ in the generation of spontaneous astrocytic Ca2+ oscillations. Neuroscience 120, 979–992. doi: 10.1016/S0306-4522(03)00379-8
Parri, H. R., Gould, T. M., and Crunelli, V. (2001). Spontaneous astrocytic Ca2+ oscillations in situ drive NMDAR-mediated neuronal excitation. Nat. Neurosci. 4, 803–812. doi: 10.1038/90507
Pettinen, A., Aho, T., Smolander, O.-P., Manninen, T., Saarinen, A., Taattola, K.-L., et al. (2005). Simulation tools for biochemical networks: evaluation of performance and usability. Bioinformatics 21, 357–363. doi: 10.1093/bioinformatics/bti018
Postnov, D. E., Koreshkov, R. N., Brazhe, N. A., Brazhe, A. R., and Sosnovtseva, O. V., (2009). Dynamical patterns of calcium signaling in a functional model of neuron-astrocyte networks. J. Biol. Phys. 35, 425–445. doi: 10.1007/s10867-009-9156-x
Riera, J., Hatanaka, R., Ozaki, T., and Kawashima, R. (2011a). Modeling the spontaneous Ca2+ oscillations in astrocytes: inconsistencies and usefulness. J. Integr. Neurosci. 10, 439–473. doi: 10.1142/S0219635211002877
Riera, J., Hatanaka, R., Uchida, T., Ozaki, T., and Kawashima, R. (2011b). Quantifying the uncertainty of spontaneous Ca2+ oscillations in astrocytes: particulars of Alzheimer's disease. Biophys. J. 101, 554–564. doi: 10.1016/j.bpj.2011.06.041
Roth, B. J., Yagodin, S. V, Holtzclaw, L., and Russell, J. T. (1995). A mathematical model of agonist-induced propagation of calcium waves in astrocytes. Cell Calcium 17, 53–64. doi: 10.1016/0143-4160(95)90102-7
Shuai, J.-W., and Jung, P. (2002). Stochastic properties of Ca2+ release of inositol 1, 4, 5-trisphosphate receptor clusters. Biophys. J. 83, 87–97. doi: 10.1016/S0006-3495(02)75151-5
Stevens, J.-L. R., Elver, M., and Bednar, J. A. (2013). An automated and reproducible workflow for running and analyzing neural simulations using Lancet and IPython Notebook. Front. Neuroinform. 7:44. doi: 10.3389/fninf.2013.00044
Teeters, J. L., Harris, K. D., Millman, K. J., Olshausen, B. A., and Sommer, F. T. (2008). Data sharing for computational neuroscience. Neuroinformatics 6, 47–55. doi: 10.1007/s12021-008-9009-y
Tewari, S., and Parpura, V. (2013). A possible role of astrocytes in contextual memory retrieval: an analysis obtained using a quantitative framework. Front. Comput. Neurosci. 7:145. doi: 10.3389/fncom.2013.00145
Tewari, S., and Parpura, V. (2014). Data and model tango to aid the understanding of astrocyte-neuron signaling. Front. Comput. Neurosci. 8:3. doi: 10.3389/fncom.2014.00003
Topalidou, M., Leblois, A., Boraud, T., and Rougier, N. P. (2015). A long journey into reproducible computational neuroscience. Front. Comput. Neurosci. 9:30. doi: 10.3389/fncom.2015.00030
Tsodyks, M. V., and Markram, H. (1997). The neural code between neocortical pyramidal neurons depends on neurotransmitter release probability. Proc. Natl. Acad. Sci. U.S.A. 94, 719–723. doi: 10.1073/pnas.94.2.719
Volman, V., Bazhenov, M., and Sejnowski, T. J. (2012). Computational models of neuron-astrocyte interaction in epilepsy. Front. Comput. Neurosci. 6:58. doi: 10.3389/fncom.2012.00058
Volterra, A., Liaudet, N., and Savtchouk, I. (2014). Astrocyte Ca2+ signalling: an unexpected complexity. Nat. Rev. Neurosci. 15, 327–335. doi: 10.1038/nrn3725
Wade, J., McDaid, L., Harkin, J., Crunelli, V., and Kelso, S. (2012). Self-repair in a bidirectionally coupled astrocyte-neuron (AN) system based on retrograde signaling. Front. Comput. Neurosci. 6:76. doi: 10.3389/fncom.2012.00076
Wade, J., McDaid, L., Harkin, J., Crunelli, V., and Kelso, S. (2013). Biophysically based computational models of astrocyte ~ neuron coupling and their functional significance. Front. Comput. Neurosci. 7:44. doi: 10.3389/fncom.2013.00044
Waltemath, D., Adams, R., Beard, D. A., Bergmann, F. T., Bhalla, U. S., Britten, R., et al. (2011a). Minimum information about a simulation experiment (MIASE). PLoS Comput. Biol. 7:e1001122. doi: 10.1371/journal.pcbi.1001122
Waltemath, D., Adams, R., Bergmann, F. T., Hucka, M., Kolpakov, F., Miller, A. K., et al. (2011b). Reproducible computational biology experiments with SED-ML-the simulation experiment description markup language. BMC Syst. Biol. 5:198. doi: 10.1186/1752-0509-5-198
Keywords: reproducibility, comparability, astrocyte, calcium, computational model
Citation: Manninen T, Havela R and Linne M-L (2017) Reproducibility and Comparability of Computational Models for Astrocyte Calcium Excitability. Front. Neuroinform. 11:11. doi: 10.3389/fninf.2017.00011
Received: 02 October 2016; Accepted: 25 January 2017;
Published: 21 February 2017.
Edited by:
Sharon Crook, Arizona State University, USAReviewed by:
Padraig Gleeson, University College London (UCL), UKHans Ekkehard Plesser, Norwegian University of Life Sciences, Norway
Copyright © 2017 Manninen, Havela and Linne. This is an open-access article distributed under the terms of the Creative Commons Attribution License (CC BY). The use, distribution or reproduction in other forums is permitted, provided the original author(s) or licensor are credited and that the original publication in this journal is cited, in accordance with accepted academic practice. No use, distribution or reproduction is permitted which does not comply with these terms.
*Correspondence: Marja-Leena Linne, marja-leena.linne@tut.fi