Comparison of In Vivo and Ex Vivo MRI for the Detection of Structural Abnormalities in a Mouse Model of Tauopathy
 Holly E. Holmes1*†
  Nick M. Powell1,2†
  Da Ma1,2
  Ozama Ismail1
  Ian F. Harrison1 Jack A. Wells1 Niall Colgan1 James M. O'Callaghan1 Ross A. Johnson3 Tracey K. Murray4 Zeshan Ahmed4 Morten Heggenes4 Alice Fisher4 M. Jorge Cardoso2 Marc Modat2
  Michael J. O'Neill4 Emily C. Collins3
  Elizabeth M. C. Fisher5 Sébastien Ourselin2
  Mark F. Lythgoe1
- 1Division of Medicine, UCL Centre for Advanced Biomedical Imaging, University College London, London, UK
- 2Centre for Medical Image Computing, University College London, London, UK
- 3Tailored Therapeutics, Eli Lilly and Company, Lilly Corporate Center, Indianapolis, IN, USA
- 4Molecular Pathology, Eli Lilly & Co. Ltd, Windlesham, UK
- 5Department of Neurodegenerative Disease, Institute of Neurology, University College London, London, UK
With increasingly large numbers of mouse models of human disease dedicated to MRI studies, compromises between in vivo and ex vivo MRI must be fully understood in order to inform the choice of imaging methodology. We investigate the application of high resolution in vivo and ex vivo MRI, in combination with tensor-based morphometry (TBM), to uncover morphological differences in the rTg4510 mouse model of tauopathy. The rTg4510 mouse also offers a novel paradigm by which the overexpression of mutant tau can be regulated by the administration of doxycycline, providing us with a platform on which to investigate more subtle alterations in morphology with morphometry. Both in vivo and ex vivo MRI allowed the detection of widespread bilateral patterns of atrophy in the rTg4510 mouse brain relative to wild-type controls. Regions of volume loss aligned with neuronal loss and pathological tau accumulation demonstrated by immunohistochemistry. When we sought to investigate more subtle structural alterations in the rTg4510 mice relative to a subset of doxycycline-treated rTg4510 mice, ex vivo imaging enabled the detection of more regions of morphological brain changes. The disadvantages of ex vivo MRI may however mitigate this increase in sensitivity: we observed a 10% global shrinkage in brain volume of the post-mortem tissues due to formalin fixation, which was most notable in the cerebellum and olfactory bulbs. However, many central brain regions were not adversely affected by the fixation protocol, perhaps due to our “in-skull” preparation. The disparity between our TBM findings from in vivo and ex vivo MRI underlines the importance of appropriate study design, given the trade-off between these two imaging approaches. We support the utility of in vivo MRI for morphological phenotyping of mouse models of disease; however, for subtler phenotypes, ex vivo offers enhanced sensitivity to discrete morphological changes.
Introduction
Since Nature published the initial sequence of the (Mouse Genome Sequencing Consortium et al., 2002), there has been a marked increase in the number of transgenic and gene-targeted mice that have been engineered to deepen our understanding of the function of genes in human biology. It has been estimated that to create a knock-out mouse for each of the 20,000 genes in the mouse genome, over 7 million animals will be required in order to fully characterize the subsequent loss of gene activity (Qiu, 2006). This figure does not include knock-in and transgenic mice, all of which will also require characterization in order to fully comprehend gene function.
In order to analyse complex phenotypes, robust and reproducible methods for phenotyping are required (Gates et al., 2011). Biochemical, behavioral, anatomical, physiological and pathological assays all contribute to understanding the true function of a gene (Crawley, 2008). Phenotyping, at the macroscopic and microscopic level, is traditionally carried out using histological methods, which are useful for validating hypotheses and uncovering unexpected biochemical changes that accompany altered gene function. However, preparation of the tissues for histological analysis is terminal, invasive and limited by low throughput. Recently, techniques for structural phenotyping have moved beyond the use of histology to embrace whole-organ or organism, high resolution imaging methods (Turnbull and Mori, 2007; Lau et al., 2008; Carroll et al., 2011; Cleary et al., 2011a,b; Lerch et al., 2011a; Yu et al., 2011; Badhwar et al., 2013; Ellegood et al., 2013; Norris et al.).
Magnetic resonance imaging (MRI) is a powerful, non-invasive imaging technology which is increasingly employed for phenotyping transgenic mice; this is largely due to advances in MRI hardware and computer power, which facilitate the application of sophisticated image processing techniques (Benveniste and Blackband, 2002; Ma et al., 2005, 2008, 2014; McConville et al., 2005; Lau et al., 2008; Lerch et al., 2008a,b, 2011b; Spring et al., 2010; Zhang et al., 2010; Badhwar et al., 2013; Hébert et al., 2013). Through a combination of high resolution MRI and automated computational analysis, the throughput and efficiency of structural phenotyping of transgenic mice will significantly improve.
One of the key experimental decisions when scanning a mouse brain for phenotypic changes is whether to image the animal alive or dead in order to maximize sensitivity to morphological alterations with respect to wild-type (WT) controls (Lerch et al., 2012). Post-mortem imaging enables longer scan times, the use of contrast agents in high concentrations and limits motion. These factors can boost resolution, signal-to-noise ratio (SNR) and contrast-to-noise ratio (CNR) to support advanced, unbiased computational approaches such as tensor-based morphometry (TBM) (Lerch et al., 2008b; Ma et al., 2014). In addition, multiple brains can be imaged simultaneously using standard MRI hardware, thereby improving the throughput of data acquisition (Bock et al., 2005). Conversely, live animals' tissues do not suffer distortions and dehydration from fixation, which may disrupt their integrity (Cahill et al., 2012). Crucially, in vivo imaging permits longitudinal studies, where the same animal can be serially assessed to observe morphological and functional changes over time (Lau et al., 2008; Zhang et al., 2010). This has been shown to improve the statistical power of results (Lerch et al., 2012) as well as reduce the number of animals required for imaging studies, compared to cross-sectional studies.
In this study, we sought to expand upon our previous findings (Lerch et al., 2012), by investigating the sensitivity of in vivo and ex vivo MRI to morphological differences occurring in the rTg4510 mouse model of tauopathy (SantaCruz et al., 2005). The rTg4510 mouse exhibits gross atrophy of the forebrain regions, and has been extensively characterized in previous in vivo MRI studies (Yang et al., 2011; Wells et al., 2015; Holmes et al., 2016). Furthermore, the rTg4510 mouse offers a novel paradigm to support our investigation, as the overexpression of tau can be inactivated by the administration of doxycycline (SantaCruz et al., 2005). Therefore, in addition to characterizing the gross morphological differences between the transgenic and WT animals, we also sought to identify the sensitivity of in vivo and ex vivo MRI to the more subtle structural changes occurring in a subset of doxycycline-treated rTg4510 mice, relative to untreated rTg4510 mice. For morphological characterization, we employed an automated TBM pipeline for high throughput analysis of neuroanatomy in the mouse brain (Powell et al., 2016). TBM has previously been applied to a number of clinical disorders, including epilepsy (Keller and Roberts, 2008) and Alzheimer's disease (Fox et al., 1996, 2001; Hua et al., 2008). Its advantages include the ability to sensitively highlight structural differences between groups without specifying a region of interest (ROI). The technique is increasingly employed in high throughput mouse structural phenotyping studies (Lau et al., 2008; Lerch et al., 2008b; Zhang et al., 2010).
In this work, we sought to directly compare parameters which must be considered when phenotyping transgenic mice using either in vivo or ex vivo MRI. We investigated differences in image quality; the effect of formalin-fixation on post-mortem tissue structure; distortions due to the ex vivo tissue preparation protocol; the sensitivity of TBM to morphological changes occurring in the rTg4510 mice, scanned both in vivo and ex vivo; and the relative effect sizes detected by each paradigm.
Materials and Methods
Transgenic Animals
Generation of homozygous rTg4510 transgenic mice has been reported previously (SantaCruz et al., 2005). rTg4510 mice were licensed from the Mayo Clinic (Jacksonville Florida, USA) and bred for Eli Lilly by Taconic (Germantown, USA). Mice were imported to the UK for imaging at the Centre for Advanced Biomedical Imaging, UCL, London. All studies were carried out in accordance with the United Kingdom's Animals (Scientific Procedures) Act of 1986 and approved by the UCL internal ethics committee.
In this study, 8 female WT and 17 female rTg4510 litter-matched control mice were imaged both in vivo and ex vivo at 7.5 months of age. Of the 17 rTg4510 animals, 7 were fed with doxycycline mixed chow from 4.5 months to suppress the overexpression of tau.
Magnetic Resonance Imaging
All imaging was performed using a 9.4T VNMRS horizontal bore scanner (Agilent Inc.). The key differences between the in vivo and ex vivo protocols are outlined in Table 1. For in vivo imaging, mice were anesthetized under 2% isoflurane and positioned in an MRI compatible head holder to minimize motion artifacts. Anesthesia was then maintained at 1.5% isoflurane in 100% O2 throughout imaging. Core temperature and respiration were monitored using a rectal probe and pressure pad respectively (SA instruments). Mice were maintained at ~37°C using heated water tubing and a warm air blower with a feedback system (SA Instruments).

Table 1. Summary of the key differences between in vivo and ex vivo scanning protocols.
In vivo Structural Imaging
A 120 mm diameter imaging gradient set (SGRAD 205/120/HD/S, Agilent Technologies UK Ltd., Berkshire, UK) was used. A 72 mm birdcage radiofrequency (RF) coil was employed for RF transmission and a quadrature mouse brain surface coil (RAPID, Germany) was used for signal detection. Tuning and matching of the coil was performed manually.
A T2-weighted, three dimensional (3D) fast spin echo (FSE) sequence was implemented for structural imaging with the following parameters: Field-of-view (FOV) = 19.2 × 16.8 × 12.0 mm; resolution = 150 × 150 × 150 μm; repetition time (TR) = 2,500 ms, effective echo time (TEeff) = 43 ms, ETL = 4; NSA = 1. Total imaging time was ~1 h and 30 min.
Perfusion Fixation
Following in vivo imaging, animals were terminally anesthetized with an overdose of Euthanal administered via intraperitoneal injection. The thoracic cavities were opened and the animals were intracardially perfused through the left ventricle of the heart: first with 15–20 mL of saline (0.9%) and heparin; second with 50 mL of Formalin and 8 mM Magnevist, at a flow rate of 3 mL per minute. Following perfusion, the animal was decapitated, defleshed, and the lower jaw removed. All brains were stored in-skull at 4°C and soaked in Formalin doped with 8 mM Magnevist® for 9 weeks prior to ex vivo scanning (Cleary et al., 2011b).
Ex vivo Structural Imaging
An imaging gradient set with a 60 mm inner diameter (SGRAD 115/60/HD/S, Agilent Technologies UK Ltd., Berkshire, UK) was used. A 35 mm birdcage RF coil was employed for RF transmission and signal detection. Tuning and matching of the coil was performed manually.
A custom-build three brain holder was used to acquire high resolution ex vivo images of multiple brains simultaneously. A 3D gradient echo (GE) sequence was implemented for structural imaging with the following parameters: FOV = 32 × 25 × 25 mm; resolution = 40 × 40 × 40 μm; TR = 17 ms; TE = 4.54 ms; flip angle = 51°; NSA = 6. Total imaging time was 11 h 36 min (Cleary et al., 2011b).
Following ex vivo scanning, all brains were dispatched for histology.
Image Processing
In vivo and ex vivo MR images were reconstructed using custom software written in MATLAB. A previously published calibration protocol (O'Callaghan et al., 2014) was used to adjust volume estimates to correct for scaling errors caused by the imaging gradients. Briefly, a 3D grid phantom was imaged in both gradient sets and CT data was used as a ground truth to generate absolute scaling factors that were then applied to the data.
Tensor-Based Morphometry
TBM was performed on in vivo and ex vivo structural images using a fully-automated pipeline (Powell et al., 2016). Images were automatically oriented to a standard space (Right Antero-Superior) matching that of an atlas, corrected for intensity non-uniformity using the N4 algorithm (Tustison et al., 2010), and skull stripped using STEPS (Cardoso et al., 2013) to combine masks from several prior atlas images non-rigidly registered to the data. To mask our in vivo and ex vivo data, we used in vivo and ex vivo atlases published by Ma et al. (2005, 2008).
The total brain volume (TBV) was calculated from the resulting brain mask for each individual image. For in vivo and ex vivo groups, using the voxels within each mask, brain intensities were standardized using a piece-wise linear method described by Nyul et al. (2000). A multi-iteration group-wise registration (implemented in the open-source NiftyReg software package available from https://sourceforge.net/projects/niftyreg, Modat et al., 2010) was performed as follows to align equivalent local regions between subjects. First, all subjects were rigidly aligned to a randomly-chosen target member of the group. This was followed by four iterations of global affine registration (12 degrees of freedom) between subjects and the target image, using a block-matching algorithm (Modat et al., 2014) with normalized cross-correlation used as the similarity metric. After each iteration of registration, the group intensity average of all the transformed, resampled images was found in the space of the target, and was used as the target for the subsequent iteration of registration. Next, we performed 20 iterations of non-rigid registration (NRR), based upon symmetric free-form deformation (Modat et al., 2012). Control points were spaced at 4 voxel intervals and the similarity measure used was normalized mutual information. As the iterations progressed, the average image sharpened as alignment improved and approached the true average morphology of the group.
We transformed the deformation fields from this registration by taking the log of the determinant of the Jacobian matrix calculated at each voxel in the final average image space, to give that voxel's relative expansion or contraction from the final average image to each original image. These values were smoothed with a 0.2 mm FWHM Gaussian kernel to account for registration error and to render the values closer to a normal distribution. This was chosen to enhance physical differences between groups at approximately the same scale (the matched filter effect; Ashburner and Friston, 2001). We used the same FWHM for both in vivo and ex vivo data, so as to minimize this step as a source of variation between the methods: we did not expect the physical variation between groups to differ between in vivo and ex vivo. We performed mass-univariate statistics (two-tailed t-tests) at each voxel, fitting a General Linear model to reveal the most significant voxels contributing to global differences. The resulting statistical parametric maps were corrected for multiple tests using the False Discovery Rate (FDR, Genovese et al., 2002, q = 0.05).
Deformation Maps
To measure the degree of local variability between ex vivo and in vivo images, we registered each ex vivo brain to its corresponding in vivo counterpart, and calculated the mean positional distance at each voxel after resampling the resulting deformation fields into the in vivo brains' average space (Kovačević et al., 2005). The magnitude of the 3D vectors was calculated and the mean found over all N deformation fields, i:
where x, y, z are the vector components from the non-rigid registration only (excluding global rigid and affine transformations).
Signal-to-Noise and Contrast-to-Noise Ratio Calculations
SNR and CNR were calculated from WT mice (n = 3) using the following formulae:
Signal was taken from the following ROIs: caudate putamen, cerebellum, corpus callosum, cortex, hippocampus, hypothalamus, olfactory bulb, midbrain and thalamus. The noise ROI was placed in a ghost-free region of background signal. Noise was defined as the standard deviation of the background signal. A 2-way ANOVA with post-hoc Sidak multiple comparisons was used to identify significant differences between SNR in the in vivo and ex vivo ROIs.
Effect Size and Sample Size Calculation
Each dataset may be treated as a preliminary study from which to estimate the number of mice, N, (per group) required in a future ex vivo or in vivo study to show meaningful differences between the WT and untreated rTg4510 groups, with specified statistical power. We chose a conventional significance level of α = 0.05, a false negative rate β = 0.2, and initially assumed the WT group provided a reasonable estimation of local structural variability within the rTg4510 mouse population. To detect a 25% local volume difference between WT and untreated rTg4510 groups measured in Jdet values, at each voxel, the required number of animals in each arm of the study is (Florey, 1993):
where Zα/2 = 1.96 is the approximate number of standard deviations from the mean of a standard normal distribution of 1−(α/2) = 0.975; likewise, Z1−β = 0.84 for 1−β = 0.8. WTstdev is the standard deviation of the WT Jdet values, from GWR, at a particular voxel. These vary across the brain depending upon local WT variability. Narm is rounded up to the nearest integer.
As the actual difference between mean UT and WT Jdet values is known post-hoc, the effect sizes (Cohen's d), both in vivo and ex vivo, may be visualized and compared at each voxel. This helps to quantify which regions are most different, between groups, regardless of statistical significance:
We calculated d using a pooled standard deviation, replacing WTstdev with σpooled:
Figure 5 shows equivalent slices from the in vivo and ex vivo group-wise average images, overlaid with the d and Narm required at each voxel to detect a 25% variation in Jdet from the WT mean, giving a realistic lower bound for future studies of the rTg4510 mouse.
Histology and Immunohistochemistry
Brain samples were processed using a Tissue TEK® VIP processor (GMI Inc, MN USA). After processing, sections were embedded in paraffin wax to allow coronal brain sections to be cut. Serial sections (6 μm) were taken using HM 200 and HM 355 (Thermo Scientific Microm, Germany) rotary microtomes.
Immunohistochemistry (IHC) was performed using a primary antibody for tau phosphorylated at serine 409 (PG-5; 1:800 from Peter Davies, Albert Einstein College of Medicine, NY, USA) and the neuronal marker NeuN (1:500 from Millipore; MAB377). Following de-paraffinisation and rehydration of the tissue sections, antigen retrieval was performed using the Lab Vision PT module system (Thermo Scientific), where sections were heated to 100°C for 20 min in citrate buffer (TA-250-PM1X; Thermo Scientific). Slides were transferred to a Lab Vision Autostainer (Thermo Scientific) where the following incubations were performed: 10 min in H2O2 (0.3%); 30 min in normal goat serum (1:20; Vector Laboratories); 60 min in primary antibody; 30 min in biotinylated goat anti-mouse IgG (1:200, BA9200; Vector Laboratories); 30 min avidin-biotin complex solution (PK-7100; Vector Laboratories); 5 min in 3,3′-diaminobenzidine (SK-4105; Vector Laboratories). Apart from the last two steps, PBS with 0.05% Tween-20 (PBS-T) was used for diluting reagents and washes between steps. Sections were then counterstained with haematoxylin before dehydration and cover-slipping.
To quantify the density of PG-5 and NeuN positive neurons, stained sections were digitized using the Scanscope AT slide scanner (Aperio) at 20 × magnification. Imagescope software (version 11.1.2.780; Aperio) was used to view the digitized tissue sections and delineate the boundaries of the cortex. PG-5 positive cells were manually counted within the delineated region and NeuN positive cells were quantified using a nuclear detection algorithm (Imagescope, version 11.1.2.780; Aperio); both were expressed as a percentage of the total area. These analyses were performed in a blinded fashion. A one-way ANOVA with post-hoc Tukey multiple comparison was performed to identify significant differences between the groups.
Results
Effect of In vivo and Ex vivo Scanning on SNR and CNR
In order to explore image quality, we investigated quantitative differences in SNR and CNR measurements from WT animals (Table 2). The SNR and CNR measurements are representative results from practical scan times achievable for the in vivo and ex vivo imaging protocols (Table 2). This was 1.5 h in vivo, which permitted the acquisition of other complementary functional scans within a feasible in vivo imaging time (Holmes et al., 2016), and 12 h to image 3 ex vivo brains simultaneously (4 h per ex vivo specimen), which maximized the utility of the MRI scanner by imaging overnight.
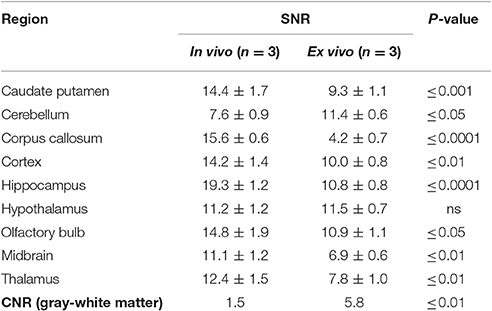
Table 2. Mean (±SD) signal-to-noise ratio and contrast-to-noise ratio for in vivo and ex vivo wild-type mouse brains.
We observed an increase in SNR of the in vivo images compared to the ex vivo images in 7 of the 9 regions investigated: the caudate putamen (55%), corpus callosum (271%), cortex (42%), hippocampus (79%), olfactory bulb (36%), midbrain (61%), and thalamus (59%). Meanwhile, the SNR ex vivo was significantly greater in the cerebellum (50%). Conversely, we observed a three-fold increase in CNR between gray matter (cortex) and white matter (corpus callosum) structures in the ex vivo images compared to in vivo (p ≤ 0.01).
It is important to note the differences in the in vivo and ex vivo imaging protocols (detailed in Table 1) which will impact the SNR and CNR values. For instance, SNR is highly dependent on spatial resolution, and increases proportionally to the volume increase of the voxel. The larger voxel size (150 μm3 in vivo vs. 40 μm3 ex vivo) of the in vivo acquisition will have been key contributors to the increased SNR in vivo. Theoretically, if all other imaging parameters were the same, this increase in voxel size in vivo would result in an increase in SNR by a factor of ~ 53 when compared to ex vivo (Parker and Gullberg, 1990). However, this estimation does not take into account other differences between the imaging protocols: the use of a surface coil in vivo will have contributed to increased SNR relative to the ex vivo volume coil, whilst the high concentrations of contrast agent employed ex vivo will have shortened the T1 relaxation properties of the tissues and enabled the acquisition of high resolution 3D scans with improved SNR.
Effect of Perfuse-Fixation on Brain Structure: Comparison of In vivo and Ex vivo
It has previously been reported that formalin fixation causes tissue shrinkage (Siegel et al., 1985; Zhang et al., 2010; Lerch et al., 2012) which may be a confounder in our ex vivo MRI protocol, particularly if this shrinkage is inhomogeneous across structures. In order to investigate the changes in brain morphometry occurring due to formalin fixation, we extracted total brain volumes (TBVs) for the in vivo and ex vivo mouse brain specimens using a previously published multi-atlas segmentation protocol (Ma et al., 2014). We observed a 10% reduction in ex vivo TBV compared to in vivo (p ≤ 0.0001) (Figure 1 and Supplementary Table 1). The degree of shrinkage was similar for WT controls (10.3%), rTg4510 mice (10.4%) and doxycycline-treated rTg4510 mice (10.1%), which suggest that the overall extent of fixation-induced shrinkage is unrelated to tau pathology in this model.
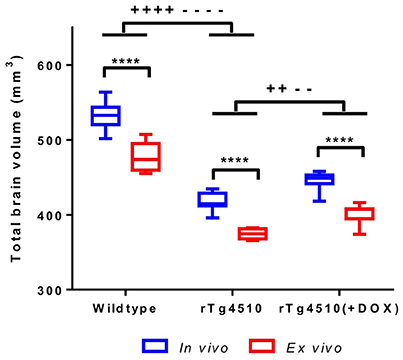
Figure 1. In vivo and ex vivo total brain volumes for wild-type, rTg4510 and rTg4510 (+DOX) animals. In vivo vs. ex vivo comparisons: ****p ≤ 0.0001. In vivo TBV comparisons: ++p ≤ 0.01; ++++p ≤ 0.0001. Ex vivo TBV comparisons: −−p ≤ 0.01; −−−−p ≤ 0.0001. Whiskers represent the maximum and minimum values.
We also investigated the regional effects of perfuse-fixation on brain structures by registering the ex vivo images to their corresponding in vivo mouse brain template, using methodology previously described by Ma et al. (2008). The mean positional distance map, showing mean intra-subject registration distances between in vivo and ex vivo images pairs is shown in Figure 2. The greatest changes were found within structures located frontally (the olfactory bulbs) and caudally (the brainstem). In these regions, displacements were greater than 0.25 mm can be readily visualized. The brainstem was particularly vulnerable to disturbance and exhibited displacements of up to 0.5 mm; these can be attributed to the fixation protocol which requires decapitation of the mouse. We also observed displacements within the rostral aspect of the olfactory bulbs, however the distances are markedly less than previous findings within this structure (Kovačević et al., 2005; Ma et al., 2008). The remaining brain structures, including the midbrain, hippocampus, thalamus and cortex, were relatively unaffected by perfuse-fixation. It is noticeable that the cortical surface also showed very few signs of systematic perturbation associated with the ex vivo protocol.
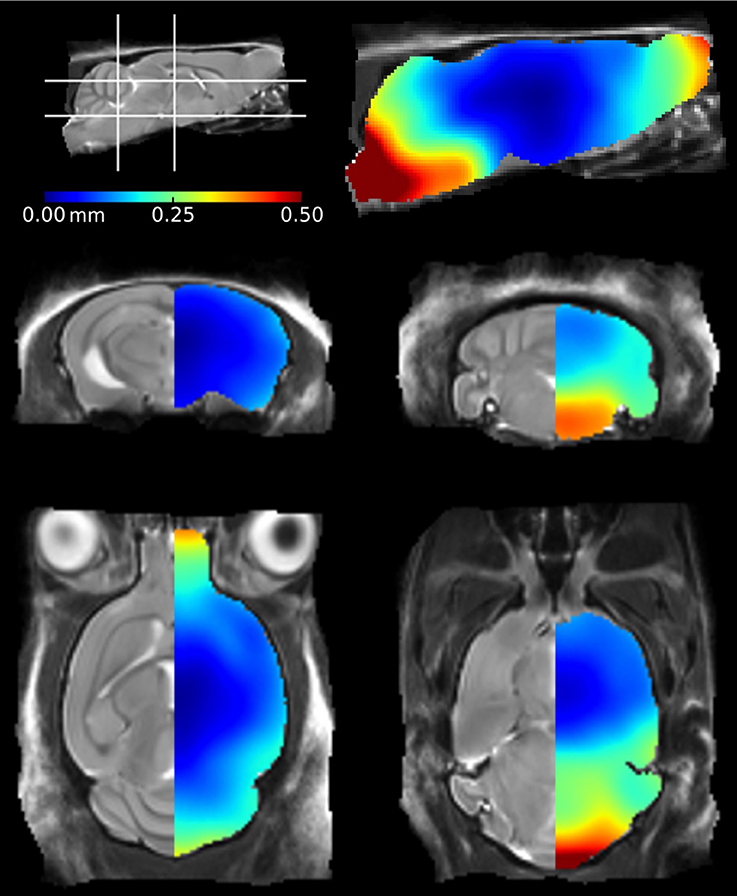
Figure 2. Mean positional distance maps showing local distortions of the ex vivo mouse brains in comparison to their in vivo mouse brain template. Deformations were calculated at a voxel-wise level. The color bar illustrates the mean distance traveled by a voxel during registration of the ex vivo mouse brains to the in vivo atlas.
Effect of Tau Pathology on Brain Structure: Comparison of In vivo and Ex vivo
We observed that the rTg4510 mice had markedly smaller brains when compared to WT (p ≤ 0.0001) and the doxycycline-treated rTg4510 mice (p ≤ 0.01) (Figure 1 and Supplementary Table 1) from both in vivo and ex vivo measurements. Importantly, the total volume differences were consistent between the in vivo and ex vivo TBV measurements: rTg4510 mice were 21% smaller that WT controls, and 16% smaller than the doxycycline-treated rTg4510 mice for both the in vivo and ex vivo cohorts.
Tensor-Based Morphometry
Comparison between rTg4510 Mice and Wild-Type Controls
The in vivo TBM results identified extensive bilateral atrophy within the forebrain regions, including the cortex, caudate putamen, hippocampus and hypothalamus, as well as expansion of the lateral, third and fourth ventricles (Figure 3A). Regions of expansion were also observed within the cerebellum (Figure 3Avii). A similar pattern of atrophy was also observed ex vivo, although these alterations appear to be more widespread in comparison to the in vivo findings (Figure 3B).
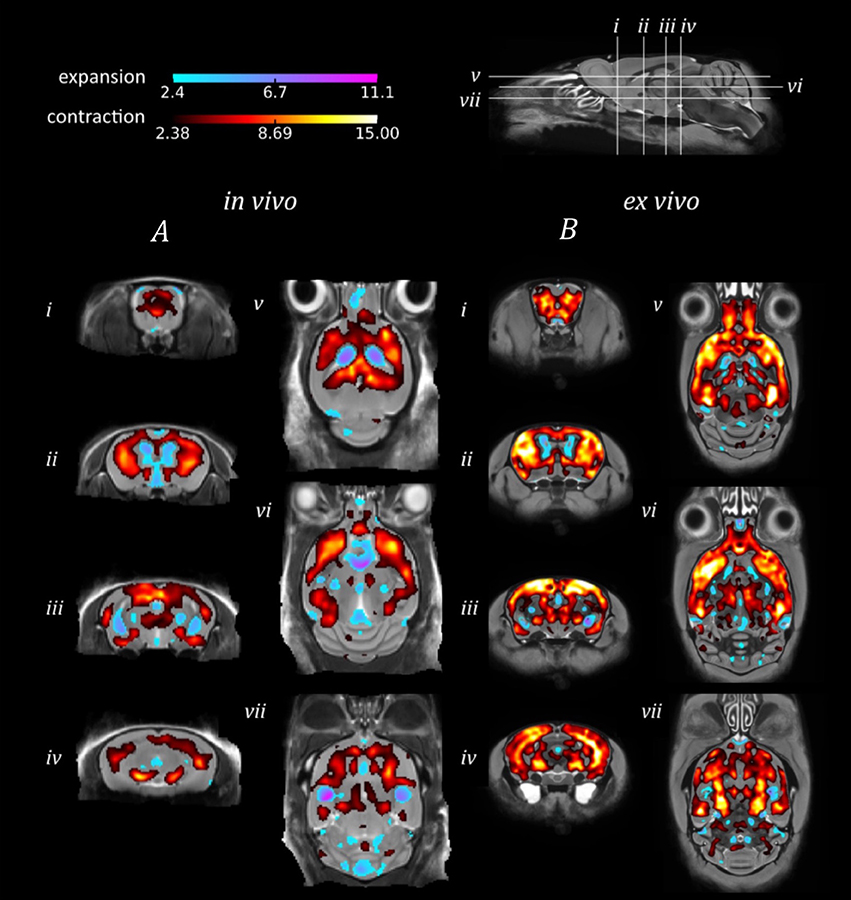
Figure 3. TBM results for the morphological comparison between rTg4510 mice and wild-type controls. Results from (A) in vivo and (B) ex vivo structural analysis, showing TBM statistical results overlaid on representative axial and coronal slices of the final group average image after 20 iterations of NRR. Red: regions where the rTg4510 brains are relatively locally smaller than the wild-type controls; blue: rTg4510 brains are locally larger. Based upon FDR-corrected t-statistics (q = 0.05).
Comparison between rTg4510 Mice and Doxycycline-Treated rTg4510 Mice
In order to investigate the sensitivity of in vivo and ex vivo imaging to subtler structural changes, we sought to identify morphological differences between the genetically identical doxycycline-treated and untreated rTg4510 mice (Figure 4).
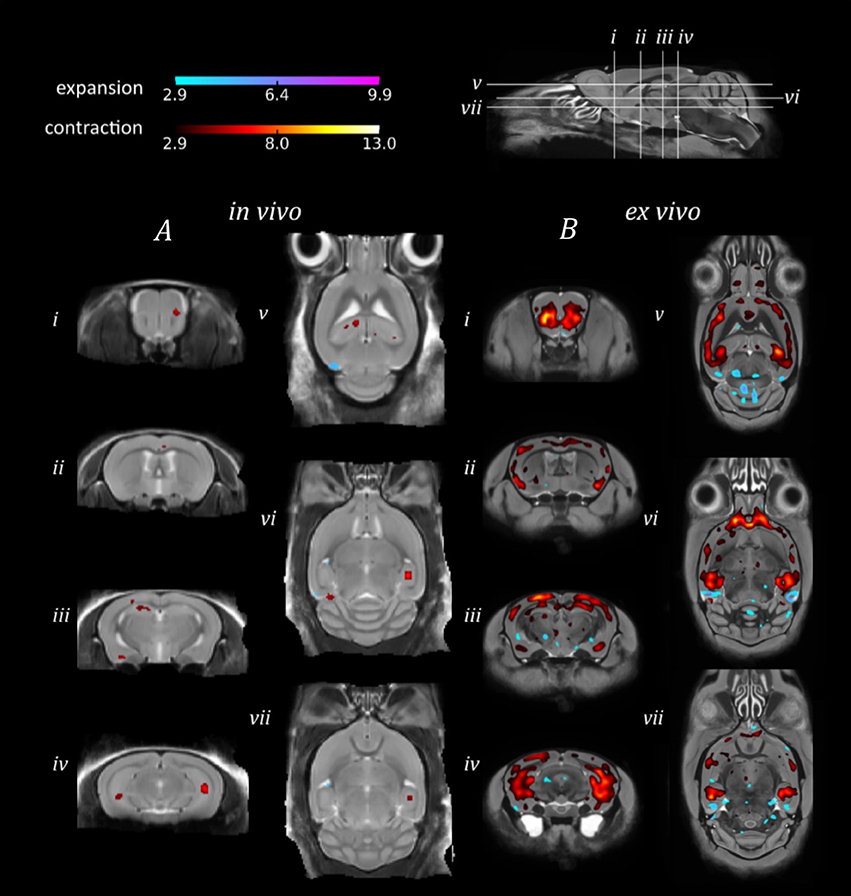
Figure 4. TBM results for the morphological comparison between rTg4510 mice and doxycyline-treated rTg4510 mice. Results from (A) in vivo and (B) ex vivo structural analysis, showing TBM statistical results overlaid on representative axial and coronal slices of the final group average image after 20 iterations of NRR. Red: regions where the rTg4510 brains are relatively locally smaller than the treated rTg4510 brains; blue: rTg4510 brains are locally larger. Based upon FDR-corrected t-statistics (q = 0.05).
Due to the smaller morphological differences between the doxycycline-treated and untreated rTg4510 mice (Holmes et al., 2016), we observed correspondingly reduced regions of expansion and contraction in the in vivo and ex vivo brains (Figure 4), in contrast to the comparison of rTg4510 mice to WT controls detailed in Figure 3. The ex vivo results appear more sensitive in this case, and identified a relatively widespread pattern of morphometric changes, with volume loss detected in the cortex, caudate putamen and caudal hippocampal regions (Figure 4B). The in vivo results identified small discrete clusters of significant voxels within the piriform area of the cortex (Figure 4Aii) and caudal slices of the hippocampus (Figure 4Aiv). Although the in vivo findings were not as spatially extensive, we observed good regional correspondence between the TBM results observed in vivo and those identified ex vivo, with significant voxels identified in many of the same regions.
Effect Size and Sample Size
To inform future studies in the rTg4510 mouse, we calculated Cohen's d and Narm for the comparison of rTg4510 mice and WT controls (Figure 5). The map of Cohen's d, in measuring group mean separation, is similar to the thresholded statistical maps in Figure 3. The separation of groups in the hippocampus and cortex is greater ex vivo.
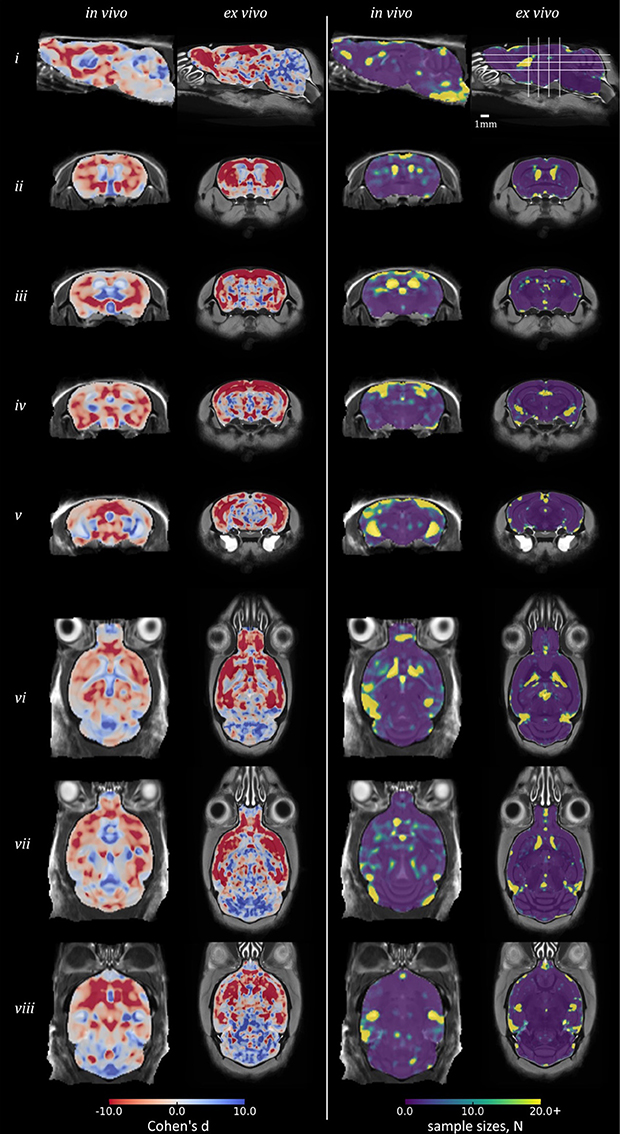
Figure 5. Power analysis results in rTg4510 data compared with wild-type: Cohen's d and sample sizes. Equivalent sagittal, coronal and transverse slices on in vivo and ex vivo GWR average images, overlaid with the Cohen's d (left) and sample sizes N (right) required to show a significant effect, with α = 0.05, β = 0.2, and an effect size 25% of the local wild-type mean volume. For Cohen's d: red, rTg4510 group locally smaller than wild-type; blue: larger.
The Narm analysis broadly identified that a small sample size of under 10 subjects would be sufficient to detect statistically significant differences between the WT and rTg4510 groups by performing TBM in the ex vivo data, across the majority of brain structures, including the midbrain and cerebellum. In order to recover structural changes occurring in vivo, a sample size of around 15 is required in order to ensure statistical significance of changes occurring in the cortex and forebrain regions. Narm was elevated around the ventricles both in vivo and ex vivo (Narm >18) although this observation was most marked in vivo. The Narm was also elevated in the entorhinal cortex of the in vivo data (Narm >15), suggesting that a greater sample size is required to recover changes within this structure; this is likely both due to reduced WT ventricle volumes and increased WT variance around these structures. Despite these observations, we were able to recover structural changes occurring in both of these regions in vivo with a reduced sample size (10 rTg4510 mice and 8 WT controls), suggesting the volume changes were greater than 25% of the WT volume.
Immunohistochemistry: Cortical PG-5 and NeuN Density
In order to corroborate the MRI findings with alterations occurring at the cellular level, quantitative immunohistochemistry was performed on each of the individual WT (n = 8), untreated rTg4510 (n = 10) and treated rTg4510 (n = 7) mice following ex vivo imaging.
The distribution of NeuN positive cells can be observed in Figure 6A. The untreated rTg4510 mice showed a significant decrease in the density of NeuN positive cells in the cortex (mean NeuN density = 1,099 ± 107 cell/mm2) compared to WT mice (mean NeuN density = 1,253 ± 131 cell/mm2) (p ≤ 0.05) (Figure 6B). These results are consistent with previous findings, and indicate marked neurodegeneration in this model (SantaCruz et al., 2005; Wells et al., 2015). Following treatment with doxycycline, we observed a significant increase in NeuN density in the treated rTg4510 mice (mean NeuN density = 1,301 ± 44 cell/mm2) compared to the untreated rTg4510 mice (p ≤ 0.01) (Figure 6B). No significant differences were observed between NeuN cell densities in the treated rTg4510 mice compared to WT mice.
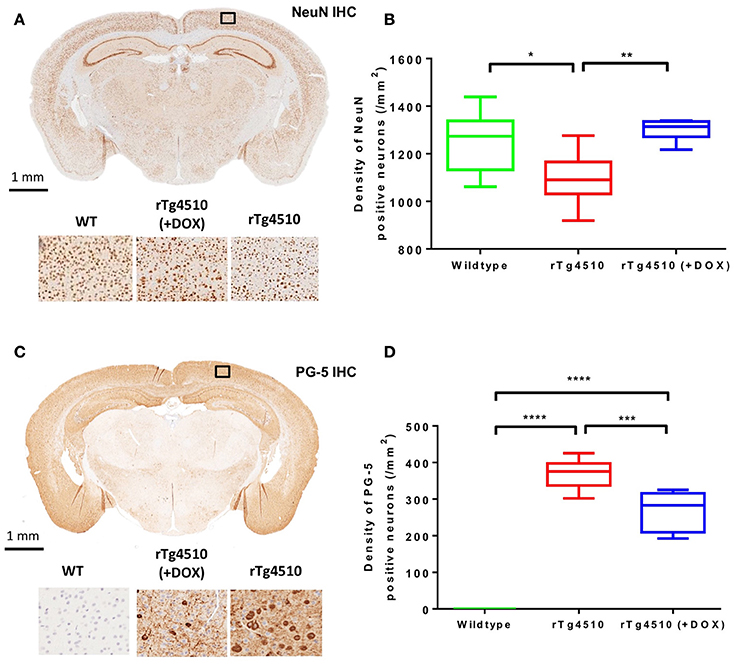
Figure 6. Immunohistochemistry to estimate cortical NeuN and PG-5 positive cell density. Representative coronal slice illustrating the distribution of (A) NeuN and (C) PG-5 positive neurons in the cortex of an untreated rTg4510 mouse. Quantitative estimates of (B) NeuN and (D) PG-5 positive cell density in the cortex for each of the 7 wild-type, 10 untreated rTg4510 and 6 treated rTg4510 mice at 7.5 months of age. Whiskers represent the maximum and minimum values. *p ≤ 0.05; **p ≤ 0.01; ***p ≤ 0.001; ****p ≤ 0.0001.
Figure 6C shows the regional distribution of PG-5 positive cells in a representative untreated rTg4510 mouse. In agreement with previous findings in this model, we observed high levels of PG-5 positive cells in the cortex of the untreated rTg4510 mice (mean PG-5 density = 369 ± 39 cell/mm2) (Figures 6C,D) (Wells et al., 2015; Holmes et al., 2016). No PG-5 positive cells were observed in the WT mice (Figure 6D). Following treatment with doxycycline, we observed a significant decrease in PG-5 positive cell density in the treated rTg4510 mice (mean PG-5 density = 268 ± 39 cell/mm2) compared to untreated rTg4510 mice (p ≤ 0.001) (Figure 6D).
Discussion
With increasing numbers of rodent neuroimaging studies employing TBM to identify regions of structural change (Lerch et al., 2011a), it is important that the compromises between in vivo and ex vivo MRI are fully understood in order to maximize sensitivity to morphological differences. A number of publications have previously addressed the trade-offs associated with imaging in vivo and ex vivo mouse brains (Ma et al., 2008; Scheenstra et al., 2009; Lerch et al., 2012); in this work, we present the first application of TBM to both in vivo and ex vivo structural MRI for investigating morphological changes in a mouse model of disease: the rTg4510 model of tauopathy. In addition to characterizing the gross morphological differences in the rTg4510 mice compared to WT controls, the ability to modulate the expression of the tau transgene with doxycycline introduced subtler group differences in brain morphology to explore using in vivo and ex vivo MRI. Both were able to capture the gross atrophy occurring in the rTg4510 mice relative to WT controls, with regions highlighted by TBM aligning with post-mortem evaluation of tau pathology in this model. However, when we sought to explore the more discrete alterations in a subset of doxycycline-treated rTg4510 mice, the ex vivo findings were more sensitive to regions of change. A number of different factors will affect the ability of in vivo and ex vivo MRI to detect morphological changes. This discussion explores some of these in more detail, and highlights the major differences that must be considered for future neurological studies of mouse models.
Our T2-weighted in vivo MRI images enabled visual identification of many structures of interest in the mouse brain, including the hippocampus, caudate putamen and cortex. This was achieved in the absence of exogenous contrast agents, such as manganese, which are frequently employed in in vivo studies of mouse neuroanatomy (Koretsky and Silva, 2004; Yu et al., 2005). High doses of manganese are believed to produce neurotoxic effects (Thuen et al., 2008; Pan et al., 2011), which could confound longitudinal analysis by interfering with both normal healthy aging and disease progression. In this work, we instead exploited the inherent differences in T1 and T2 relaxation time to achieve adequate in vivo image contrast. Conversely, high resolution ex vivo MR images were acquired using a previously optimized protocol which employed the gadolinium-containing contrast agent Magnevist (Cleary et al., 2011b); the T1-shortening effects of gadolinium enabled the acquisition of high resolution 3D data sets within a feasible scan time (typically overnight, to maximize the efficiency of scanner usage). The protocol was adapted to permit the acquisition of three ex vivo mouse brains simultaneously, which improved throughput and minimized the required operator time per brain.
SNR and CNR measurements of the in vivo and ex vivo data sets allowed a quantitative assessment of image quality to support our investigation. Despite limits on scan time, the increasing availability of specialist hardware to support in vivo imaging studies permits the acquisition of in vivo data with sufficient SNR and CNR to perform informative voxel wise analyses of mouse brain morphometry. Natt et al. previously reported that SNR of 15 – 20 was sufficient to reveal anatomical details in the in vivo mouse brain (Natt et al., 2002); in our measurements, the majority of in vivo brain structures under investigation fell within these proposed boundaries.
Another important consideration when imaging ex vivo tissue specimens is the effect of formalin-fixation on tissue integrity. It has previously been reported that fixation of ex vivo brain specimens results in dehydration and subsequent reduction of the relative proton density of tissues (Shepherd et al., 2009). This can cause a reduction in SNR in ex vivo images, although increasing the number of signal averages helped to mitigate this effect (Liu et al., 2013). Despite the lower SNR, ex vivo MRI had greater gray-white matter contrast compared to the in vivo images; this enhancement in CNR can largely be explained by the use of the contrast agent (Kim et al., 2009). We propose that CNR may be a more important measure of image quality for TBM investigations, particularly when the similarity measure which drives the image registration algorithm depends upon contrast (we used normalized mutual information, with NiftyReg).
It is important to note that the differences in the in vivo and ex vivo imaging protocols will all have contributed to the differences in SNR and CNR, making it difficult to untangle and isolate an overriding factor that is influencing these values. An alternative approach for this study would have been to implement identical imaging protocols, thus eliminating the effects of hardware, sample preparation and sequence optimization on these quantitative measurements of image quality. However, given the trade-offs associated with both approaches, we believed this study was better executed by applying protocols which had been individually optimized to meet the unique demands of in vivo and ex vivo scanning.
Tissue shrinkage associated with formalin fixation is a widely accepted occurrence, yet the extent to which brain tissues suffer differential distortion is not fully known. A previous study identified 4.37% shrinkage in post-mortem WT mouse brains prepared for ex vivo MRI (Zhang et al., 2010), markedly less than our observation of 10.3%. This discrepancy may be due to differences in the fixation procedure, such as time spent in fixative and the use of contrast agents. The authors also did not specify whether a gradient calibration protocol was in place to estimate gradient scaling errors of the different imaging systems used for the acquisition of the in vivo and ex vivo data. An additional study reported no significant difference between in vivo and ex vivo total brain volumes in a cohort of Wistar rats (Oguz et al., 2013); however, this work was also published without specifying whether a calibration protocol was employed, and no details of the fixation procedure were provided. In both cases, if discrepancies between the respective gradient sets were not accounted for, this may cause inaccuracies in the estimation of ex vivo tissue shrinkage (O'Callaghan et al., 2014).
The mean positional displacement maps illustrating distortions in the ex vivo specimens (Figure 2) provided additional insight into the effects of the ex vivo preparation protocol. We identified minimum disruption to the cortical and central structures of the ex vivo mouse brain; these regions were of particular interest in this mouse model, as atrophy is most noticeable in the cortex and hippocampus due to the regional distribution of tau pathology (SantaCruz et al., 2005). The brain stem, meanwhile, suffered the greatest deformations as it is not protected from disturbance by the skull. A previous study identified similar disruption to the brain stem using a voxel-wise analysis (Ma et al., 2008); however, the authors reported additional disturbances in the dorsal cortical regions. These brains were removed from the skull prior to ex vivo imaging (Ma et al., 2005) which is likely to have caused damage to the surface structures and subsequent local deformations. The olfactory bulb, cortex and cerebellum are particularly vulnerable to damage when extracting brains from the skull (Scheenstra et al., 2009; Sawiak et al., 2012). We scanned brains in-skull, in order to preserve cortical structures and alleviate any further risks associated with the removal of brains from the skull. Despite this methodical advantage, there were still some deformations in the posterior structures, which may be due to the presence of highly variable material outside the skull, which influences the registration and which must be taken into consideration when studying rodent models with an anticipated defect within these regions.
When investigating morphological differences between the rTg4510 and WT mice, we observed a similar bilateral pattern of atrophy in the in vivo and ex vivo images using TBM. Many of the same regions were identified as suffering volume loss, including the frontal cortical regions and caudal slices of the hippocampus. These regions are selectively vulnerable to neurofibrillary tangles of tau and neuronal loss in this model (SantaCruz et al., 2005), as depicted by the immunohistochemistry results. Conversely, expansion was detected within the lateral, third and fourth ventricles. Ventricular expansion, or “ventriculomegaly” has previously been observed within AD patients in response to brain shrinkage (Apostolova et al., 2012). Interestingly, expansion of the ventricles was underestimated in the ex vivo images, owing to collapse of the ventricular space during formalin fixation. We also detected expansion within the cerebellum, a structure where we did not anticipate any morphological alterations. The unexpected hypertrophy may be due to compensatory neuroplastic mechanisms in response to the hippocampal volume loss, as the cerebellum has recently been identified as a key structure in spatial memory processing. Although both in vivo and ex vivo data sets revealed comparable morphological changes, our findings were more spatially extensive ex vivo. The power analysis results suggest that increasing the sample size may have enabled a more widespread pattern of atrophy to be detected in vivo.
When TBM was used to investigate subtler structural changes occurring in a cohort of doxycycline-treated rTg4510 mice, relative to untreated rTg4510 mice, the benefits of ex vivo MRI became more apparent. A more extensive bilateral pattern of atrophy in the untreated vs. treated rTg4510 mice was detected in the ex vivo data sets, which could be localized to sub-regional structures such as the CA1 hippocampal subfield. Previous work in this model has found that CA1 neuron numbers stabilize following doxycycline treatment (SantaCruz et al., 2005), a finding which may have manifested as a volume loss in the untreated rTg4510 mice compared to those treated with doxycycline. The increased CNR of the ex vivo data sets appeared to benefit voxel-wise tests, enabling TBM to highlight more extensive regions of difference between the groups. In addition, the higher resolution afforded by ex vivo MRI permits improved localization of volume changes to specific sub-regional structures. These findings suggest the increased sensitivity of ex vivo imaging for detecting subtle structural alterations, which may be an important consideration for future neuroimaging studies in mouse models which exhibit subtle morphological alterations.
Meanwhile, the in vivo TBM results for the untreated vs. treated rTg4510 mice implicated the same sub-regional structures as the ex vivo results, although these findings were not as spatially extensive. Nevertheless, for mouse studies with no prior knowledge regarding neurological alterations, these in vivo results would be sufficient to guide further histological evaluation into the underlying cellular changes underpinning the MRI findings.
The ability of TBM to detect a local volumetric expansion or contraction is dependent upon the standard deviation of Jdet values in the groups at each voxel, WTstdev (or σpooled). This variability is dependent upon the ability of the registration algorithm to successfully align equivalent voxels, which itself depends upon constraint parameters (in NiftyReg, bending energy and control point spacing) as well as on the inherent image contrast of the brain structures. Low contrast regions may register poorly: structures with relatively homogeneous intensities have less information to inform registration. Here, misalignments may arise, resulting in greater local WTstdev, and hence a greater local effect size (or Narm) requirement in order to achieve the desired power. This appears to be the case in the midbrain and striatum of the in vivo group, where there is lower structural contrast than ex vivo, and consequently, greater Narm. Additionally, the variability in the cortex may be due to misregistrations with external material on the surface of the skull; a greater problem at lower resolutions, where the separation of this material from the brain is less distinct.
Post-hoc tests can inform future studies. As the WTstdev and WTmean vary between brain regions, the power of each test varies and different sample size estimates are prescribed, throughout the brain. Notably, around the ventricles, where structural variability between animals was higher, sample size estimates were elevated. In most brain regions, especially ex vivo, small group sizes appear sufficient to differentiate groups. This is also dependent upon the effect size chosen (here, 0.25 of a voxel). Smaller changes would require greater Narm in each group. To obtain a useful sample size for a future study focussing on a specific brain region (e.g., the hippocampus or cortex, in the rTg4510 mouse), it would be advisable to use that region to set the N per study arm. The group sizes in this study were sufficient to reveal significant group differences throughout most of the brain.
Conclusion
In this work, we explored the compromises and trade-offs between in vivo and ex vivo MRI in conjunction with TBM for detecting regions of morphometric change in the rTg4510 mouse model. Our findings support the utility of in vivo MRI for assessment of morphological changes in transgenic mice, where atrophy was detected in equivocal regions to ex vivo imaging. In addition, the in vivo data does not suffer from dehydration or distortion artifacts, which may confound ex vivo studies. Our TBV findings suggest that tissue shrinkage is similar in rTg4510 mice and WT controls, with relative preservation of key central brain structures such as the cortex and hippocampus. The TBM results also indicated that ex vivo MRI may offer increased sensitivity to subtle morphological changes with the same sample size, such as the response to a therapeutic intervention.
We hope that this work will help support and inform research groups working in the field of preclinical MRI, and shape their decision about the best way to image their transgenic mice.
Author Contributions
Conceived and designed the experiments: HH, NP, DM, IH, JW, NC, JO, RJ, MO, EC, SO, and ML. Performed the MRI experiments: HH, OI, IH, NC, JO, and JW. Perfuse-fixed and prepared the ex vivo tissues: HH and OI. Performed the histology: TM, ZA, AF, and MH. Analyzed the MRI data: NP and DM. Contributed image processing analysis tools: MC, MM, and SO. Provided the transgenic mice and contributed toward our understanding of the MRI changes: RJ, MO, and EC. Wrote, edited and critically evaluated the manuscript: HH, NP, IH, JW, EF, and ML.
Conflict of Interest Statement
RJ, TM, ZA, MH, AF, MO, and EC are employees of Eli Lilly and Company. The work was carried out as part of a basic research collaboration with Eli Lilly and Company, who helped fund the imaging costs. Lilly also provided the rTg4510 mice used in this study, helped with study design and carried out histopathology in the manuscript.
The other authors declare that the research was conducted in the absence of any commercial or financial relationships that could be construed as a potential conflict of interest.
Acknowledgments
HH is supported by an NC3Rs studentship (NC/K500276/1). NP is supported by the UK Medical Research Council Doctoral Training Grant Studentship (MR/G0900207-3/1). JO is supported by the UK Medical Research Council Doctoral Training Grant Studentship (MR/J500422/1). MC receives funding from EPSRC (EP/H046410/1). MM is supported by the UCL Leonard Wolfson Experimental Neurology Centre (PR/ylr/18575). SO receives funding from the EPSRC (EP/H046410/1, EP/J020990/1, EP/K005278), the MRC (MR/J01107X/1), the EU-FP7 project VPH-DARE@IT (FP7-ICT-2011-9-601055), the NIHR Biomedical Research Unit (Dementia) at UCL and the National Institute for Health Research University College London Hospitals Biomedical Research Centre (NIHR BRC UCLH/UCL High Impact Initiative—BW.mn.BRC10269). EF is funded by a Wellcome Trust Joint Senior Investigator Award (098327). JW is supported by the MRC (MR/J013110/1). ML receives funding from the Medical Research Council (MR/J013110/1), the UK Regenerative Medicine Platform Safety Hub (MRC: MR/K026739/1) (IRIS 104393) and the King's College London and UCL Comprehensive Cancer Imaging Centre CR-UK & EPSRC (000012287) in association with the MRC and DoH (England). This work was carried out in collaboration with, and part funded by, Eli Lilly and Company.
Supplementary Material
The Supplementary Material for this article can be found online at: https://www.frontiersin.org/article/10.3389/fninf.2017.00020/full#supplementary-material
Supplementary Table 1. Total brain volumes (±SD), extracted from in vivo and ex vivo imaging data. These values are displayed box plot format in Figure 1.
References
Apostolova, L. G., Green, A. E., Babakchanian, S., Hwang, K. S., Chou, Y., and Thompson, P. M. (2012). Hippocampal atrophy and ventricular enlargement in normal aging, mild cognitive impairment and Alzheimer's disease. Alzheimer Dis. Assoc. Disord. 26, 17–27. doi: 10.1097/WAD.0b013e3182163b62
Ashburner, J., and Friston, K. J. (2001). Why voxel-based morphometry should be used. Neuroimage 14, 1238–1243. doi: 10.1006/nimg.2001.0961
Badhwar, A., Lerch, J. P., Hamel, E., and Sled, J. G. (2013). Impaired structural correlates of memory in Alzheimer's disease mice. Neuroimage 3, 290–300. doi: 10.1016/j.nicl.2013.08.017
Benveniste, H., and Blackband, S. (2002). MR microscopy and high resolution small animal MRI: applications in neuroscience research. Prog. Neurobiol. 67, 393–420. doi: 10.1016/S0301-0082(02)00020-5
Bock, N. A., Nieman, B. J., Bishop, J. B., and Mark Henkelman, R. (2005). In vivo multiple-mouse MRI at 7 Tesla. Magn. Reson. Med. 54, 1311–1316. doi: 10.1002/mrm.20683
Cahill, L. S., Laliberté, C. L., Ellegood, J., Spring, S., Gleave, J. A., van Eede, M. C., et al. (2012). Preparation of fixed mouse brains for MRI. Neuroimage 60, 933–939. doi: 10.1016/j.neuroimage.2012.01.100
Cardoso, M. J., Leung, K., Modat, M., Keihaninejad, S., Cash, D., Barnes, J., et al. (2013). STEPS: similarity and truth estimation for propagated segmentations and its application to hippocampal segmentation and brain parcelation. Med. Image Anal. 17, 671–684. doi: 10.1016/j.media.2013.02.006
Carroll, J. B., Lerch, J. P., Franciosi, S., Spreeuw, A., Bissada, N., Henkelman, R. M., et al. (2011). Natural history of disease in the YAC128 mouse reveals a discrete signature of pathology in Huntington disease. Neurobiol. Dis. 43, 257–265. doi: 10.1016/j.nbd.2011.03.018
Cleary, J. O., Modat, M., Norris, F. C., Price, A. N., Jayakody, S. A., Martinez-Barbera, J. P., et al. (2011a). Magnetic resonance virtual histology for embryos: 3D atlases for automated high-throughput phenotyping. Neuroimage 54, 769–778. doi: 10.1016/j.neuroimage.2010.07.039
Cleary, J. O., Wiseman, F. K., Norris, F. C., Price, A. N., Choy, M., Tybulewicz, V. L. J., et al. (2011b). Structural correlates of active-staining following magnetic resonance microscopy in the mouse brain. Neuroimage 56, 974–983. doi: 10.1016/j.neuroimage.2011.01.082
Crawley, J. N. (2008). Behavioral phenotyping strategies for mutant mice. Neuron 57, 809–818. doi: 10.1016/j.neuron.2008.03.001
Ellegood, J., Babineau, B. A., Henkelman, R. M., Lerch, J. P., and Crawley, J. N. (2013). Neuroanatomical analysis of the BTBR mouse model of autism using magnetic resonance imaging and diffusion tensor imaging. Neuroimage 70, 288–300. doi: 10.1016/j.neuroimage.2012.12.029
Fox, N. C., Crum, W. R., Scahill, R. I., Stevens, J. M., Janssen, J. C., and Rossor, M. N. (2001). Imaging of onset and progression of Alzheimer's disease with voxel-compression mapping of serial magnetic resonance images. Lancet 358, 201–205. doi: 10.1016/S0140-6736(01)05408-3
Fox, N. C., Warrington, E. K., Freeborough, P. A., Hartikainen, P., Kennedy, A. M., Stevens, J. M., et al. (1996). Presymptomatic hippocampal atrophy in Alzheimer's disease. Brain 119, 2001–2007. doi: 10.1093/brain/119.6.2001
Gates, H., Mallon, A. M., and Brown, S. D. (2011). High-throughput mouse phenotyping. Methods 53, 394–404. doi: 10.1016/j.ymeth.2010.12.017
Genovese, C. R., Lazar, N. A., and Nichols, T. (2002). Thresholding of statistical maps in functional neuroimaging using the false discovery rate. Neuroimage 15, 870–878. doi: 10.1006/nimg.2001.1037
Hébert, F., Grand'Maison, M., Ho, M. K., Lerch, J. P., Hamel, E., and Bedell, B. J. (2013). Cortical atrophy and hypoperfusion in a transgenic mouse model of Alzheimer's disease. Neurobiol. Aging 34, 1644–1652. doi: 10.1016/j.neurobiolaging.2012.11.022
Holmes, H. E., Colgan, N., Ismail, O., Ma, D., Powell, N. M., O'Callaghan, J. M., et al. (2016). Imaging the accumulation and suppression of tau pathology using multiparametric MRI. Neurobiol. Aging 39, 184–194. doi: 10.1016/j.neurobiolaging.2015.12.001
Hua, X., Leow, A. D., Parikshak, N., Lee, S., Chiang, M. C., Toga, A. W., et al. (2008). Tensor-based morphometry as a neuroimaging biomarker for Alzheimer's disease: an MRI study of 676 AD, MCI, and normal subjects. Neuroimage 43, 458–469. doi: 10.1016/j.neuroimage.2008.07.013
Keller, S. S., and Roberts, N. (2008). Voxel-based morphometry of temporal lobe epilepsy: an introduction and review of the literature. Epilepsia 49, 741–757. doi: 10.1111/j.1528-1167.2007.01485.x
Kim, S., Pickup, S., Hsu, O., and Poptani, H. (2009). Enhanced delineation of white matter structures of the fixed mouse brain using Gd-DTPA in microscopic MRI. NMR Biomed. 22, 303–309. doi: 10.1002/nbm.1324
Koretsky, A. P., and Silva, A. C. (2004). Manganese-enhanced magnetic resonance imaging (MEMRI). NMR Biomed. 17, 527–531. doi: 10.1002/nbm.940
Kovačević, N., Henderson, J. T., Chan, E., Lifshitz, N., Bishop, J., Evans, A. C., et al. (2005). A three-dimensional MRI atlas of the mouse brain with estimates of the average and variability. Cereb. Cortex 15, 639–645. doi: 10.1093/cercor/bhh165
Lau, J. C., Lerch, J. P., Sled, J. G., Henkelman, R. M., Evans, A. C., and Bedell, B. J. (2008). Longitudinal neuroanatomical changes determined by deformation-based morphometry in a mouse model of Alzheimer's disease. Neuroimage 42, 19–27. doi: 10.1016/j.neuroimage.2008.04.252
Lerch, J. P., Carroll, J. B., Dorr, A., Spring, S., Evans, A. C., Hayden, M. R., et al. (2008a). Cortical thickness measured from MRI in the YAC128 mouse model of Huntington's disease. Neuroimage 41, 243–251. doi: 10.1016/j.neuroimage.2008.02.019
Lerch, J. P., Carroll, J. B., Spring, S., Bertram, L. N., Schwab, C., Hayden, M. R., et al. (2008b). Automated deformation analysis in the YAC128 Huntington disease mouse model. Neuroimage 39, 32–39. doi: 10.1016/j.neuroimage.2007.08.033
Lerch, J. P., Gazdzinski, L., Germann, J., Sled, J. G., Henkelman, R. M., and Nieman, B. J. (2012). Wanted dead or alive? The tradeoff between in-vivo versus ex-vivo MR brain imaging in the mouse. Front. Neuroinform. 6:6. doi: 10.3389/fninf.2012.00006
Lerch, J. P., Sled, J. G., and Henkelman, R. M. (2011a). MRI phenotyping of genetically altered mice. Methods Mol. Biol. 711, 349–361. doi: 10.1007/978-1-61737-992-5_17
Lerch, J. P., Yiu, A. P., Martinez-Canabal, A., Pekar, T., Bohbot, V. D., Frankland, P. W., et al. (2011b). Maze training in mice induces MRI-detectable brain shape changes specific to the type of learning. Neuroimage 54, 2086–2095. doi: 10.1016/j.neuroimage.2010.09.086
Liu, Y., Sajja, B. R., Gendelman, H. E., and Boska, M. D. (2013). Mouse brain fixation to preserve in vivo manganese enhancement for ex vivo MEMRI. J. Magn. Reson. Imaging 38, 482–487. doi: 10.1002/jmri.24005
Ma, D., Cardoso, M. J., Modat, M., Powell, N., Wells, J., Holmes, H., et al. (2014). Automatic structural parcellation of mouse brain MRI using multi-atlas label fusion. PLoS ONE 9:e86576. doi: 10.1371/journal.pone.0086576
Ma, Y., Hof, P. R., Grant, S. C., Blackband, S. J., Bennett, R., Slatest, L., et al. (2005). A three-dimensional digital atlas database of the adult C57BL/6J mouse brain by magnetic resonance microscopy. Neuroscience 135, 1203–1215. doi: 10.1016/j.neuroscience.2005.07.014
Ma, Y., Smith, D., Hof, P. R., Foerster, B., Hamilton, S., Blackband, S. J., et al. (2008). In vivo 3D digital atlas database of the adult C57BL/6J mouse brain by magnetic resonance microscopy. Front. Neuroanat. 2:1. doi: 10.3389/neuro.05.001.2008
McConville, P., Moody, J. B., and Moffat, B. A. (2005). High-throughput magnetic resonance imaging in mice for phenotyping and therapeutic evaluation. Curr. Opin. Chem. Biol. 9, 413–420. doi: 10.1016/j.cbpa.2005.06.004
Modat, M., Cardoso, M. J., Daga, P., Cash, D., Fox, N. C., and Ourselin, S. (2012). “Inverse-consistent symmetric free form deformation,” in Proceedings of Biomedical Image Registration: 5th International Workshop, WBIR, Nashville, TN, July 7-8, eds B. M. Dawant, G. E. Christensen, J. M. Fitzpatrick, and D. Rueckert (Berlin; Heidelberg: Springer), 79–88. doi: 10.1007/978-3-642-31340-0_9
Modat, M., Cash, D. M., Daga, P., Winston, G. P., Duncan, J. S., and Ourselin, S. (2014). Global image registration using a symmetric block-matching approach. J. Med. Imaging 1:24003. doi: 10.1117/1.JMI.1.2.024003
Modat, M., Ridgway, G. R., Taylor, Z. A., Lehmann, M., Barnes, J., Hawkes, D. J., et al. (2010). Fast free-form deformation using graphics processing units. Comput. Methods Prog. Biomed. 98, 278–284. doi: 10.1016/j.cmpb.2009.09.002
Mouse Genome Sequencing Consortium, Waterston, R. H., Lindblad-Toh, K., Birney, E., Rogers, J., Abril, J. F., et al. (2002). Initial sequencing and comparative analysis of the mouse genome. Nature 420, 520–562. doi: 10.1038/nature01262
Natt, O., Watanabe, T., Boretius, S., Radulovic, J., Frahm, J., and Michaelis, T. (2002). High-resolution 3D MRI of mouse brain reveals small cerebral structures in vivo. J. Neurosci. Methods 120, 203–209. doi: 10.1016/S0165-0270(02)00211-X
Norris, F. C., Wong, M. D., Greene, N. D. E., Scambler, P. J., Weaver, T., Weninger, W. J., et al. (2013). A coming of age: advanced imaging technologies for characterising the developing mouse. Trends Genet. 29, 700–711. doi: 10.1016/j.tig.2013.08.004
Nyul, L. G., Udupa, J. K., and Zhang, X. (2000). New variants of a method of MRI scale standardization. IEEE Trans. Med. Imaging 19, 143–150. doi: 10.1109/42.836373
O'Callaghan, J., Wells, J., Richardson, S., Holmes, H., Yu, Y., Walker-Samuel, S., et al. (2014). Is your system calibrated? MRI gradient system calibration for pre-clinical, high-resolution imaging. PLoS ONE 9:e96568. doi: 10.1371/journal.pone.0096568
Oguz, I., Yaxley, R., Budin, F., Hoogstoel, M., Lee, J., Maltbie, E., et al. (2013). Comparison of magnetic resonance imaging in live vs. post mortem rat brains. PLoS ONE 8:e71027. doi: 10.1371/journal.pone.0071027
Pan, D., Caruthers, S. D., Senpan, A., Schmieder, A. H., Wickline, S. A., and Lanza, G. M. (2011). Revisiting an old friend: manganese-based MRI contrast agents. Wiley Interdiscip. Rev. 3, 162–173. doi: 10.1002/wnan.116
Parker, D. L., and Gullberg, G. T. (1990). Signal-to-noise efficiency in magnetic resonance imaging. Med. Phys. 17, 250–257. doi: 10.1118/1.596503
Powell, N. M., Modat, M., Cardoso, M. J., Ma, D., Holmes, H. E., Yu, Y., et al. (2016). Fully-automated μMRI morphometric phenotyping of the Tc1 mouse model of down syndrome. PLoS ONE 11:e0162974. doi: 10.1371/journal.pone.0162974
SantaCruz, K., Lewis, J., Spires, T., Paulson, J., Kotilinek, L., Ingelsson, M., et al. (2005). Tau suppression in a neurodegenerative mouse model improves memory function. Science 309, 476–481. doi: 10.1126/science.1113694
Sawiak, S. J., Wood, N. I., Carpenter, T. A., and Morton, A. J. (2012). Huntington's disease mouse models online: high-resolution MRI images with stereotaxic templates for computational neuroanatomy. PLoS ONE 7:e53361. doi: 10.1371/journal.pone.0053361
Scheenstra, A. E., van de Ven, R. C., van der Weerd, L., van den Maagdenberg, A. M., Dijkstra, J., and Reiber, J. H. (2009). Automated segmentation of in vivo and ex vivo mouse brain magnetic resonance images. Mol. Imaging 8, 35–44. doi: 10.2310/7290.2009.00004
Shepherd, T. M., Thelwall, P. E., Stanisz, G. J., and Blackband, S. J. (2009). Aldehyde fixative solutions alter the water relaxation and diffusion properties of nervous tissue. Magn. Reson. Med. 62, 26–34. doi: 10.1002/mrm.21977
Siegel, R. J., Swan, K., Edwalds, G., and Fishbein, M. C. (1985). Limitations of postmortem assessment of human coronary artery size and luminal narrowing: differential effects of tissue fixation and processing on vessels with different degrees of atherosclerosis. J. Am. Coll. Cardiol. 5, 342–346. doi: 10.1016/S0735-1097(85)80056-5
Spring, S., Lerch, J. P., Wetzel, M. K., Evans, A. C., and Henkelman, R. M. (2010). Cerebral asymmetries in 12-week-old C57Bl/6J mice measured by magnetic resonance imaging. Neuroimage 50, 409–415. doi: 10.1016/j.neuroimage.2009.12.043
Thuen, M., Berry, M., Pedersen, T. B., Goa, P. E., Summerfield, M., Haraldseth, O., et al. (2008). Manganese-enhanced MRI of the rat visual pathway: acute neural toxicity, contrast enhancement, axon resolution, axonal transport, and clearance of Mn2+. J. Magn. Reson. Imaging 28, 855–865. doi: 10.1002/jmri.21504
Turnbull, D. H., and Mori, S. (2007). MRI in mouse developmental biology. NMR Biomed. 20, 265–274. doi: 10.1002/nbm.1146
Tustison, N. J., Avants, B. B., Cook, P. A., Zheng, Y., Egan, A., Yushkevich, P. A., et al. (2010). N4ITK: improved N3 bias correction. IEEE Trans. Med. Imaging 29, 1310–1320. doi: 10.1109/TMI.2010.2046908
Wells, J. A., O'Callaghan, J. M., Holmes, H. E., Powell, N. M., Johnson, R. A., Siow, B., et al. (2015). In vivo imaging of tau pathology using multi-parametric quantitative MRI. Neuroimage 111, 369–378. doi: 10.1016/j.neuroimage.2015.02.023
Yang, D., Xie, Z., Stephenson, D., Morton, D., Hicks, C. D., Brown, T. M., et al. (2011). Volumetric MRI and MRS provide sensitive measures of Alzheimer's disease neuropathology in inducible Tau transgenic mice (rTg4510). Neuroimage 54, 2652–2658. doi: 10.1016/j.neuroimage.2010.10.067
Yu, X., Nieman, B. J., Sudarov, A., Szulc, K. U., Abdollahian, D. J., Bhatia, N., et al. (2011). Morphological and functional midbrain phenotypes in Fibroblast Growth Factor 17 mutant mice detected by Mn-enhanced MRI. Neuroimage 56, 1251–1258. doi: 10.1016/j.neuroimage.2011.02.068
Yu, X., Wadghiri, Y. Z., Sanes, D. H., and Turnbull, D. H. (2005). In vivo auditory brain mapping in mice with Mn-enhanced MRI. Nat. Neurosci. 8, 961–968. doi: 10.1038/nn1477
Keywords: MRI imaging, preclinical imaging, in vivo imaging, phenotyping, tensor-based morphometry, tauopathy, mouse models, neurodegeneration
Citation: Holmes HE, Powell NM, Ma D, Ismail O, Harrison IF, Wells JA, Colgan N, O'Callaghan JM, Johnson RA, Murray TK, Ahmed Z, Heggenes M, Fisher A, Cardoso MJ, Modat M, O'Neill MJ, Collins EC, Fisher EMC, Ourselin S and Lythgoe MF (2017) Comparison of In Vivo and Ex Vivo MRI for the Detection of Structural Abnormalities in a Mouse Model of Tauopathy. Front. Neuroinform. 11:20. doi: 10.3389/fninf.2017.00020
Received: 01 December 2016; Accepted: 27 February 2017;
Published: 31 March 2017.
Edited by:
Tianzi Jiang, Institute of Automation (CAS), ChinaReviewed by:
Frithjof Kruggel, University of California, Irvine, USAJiaojian Wang, University of Electronic Science and Technology of China, China
Copyright © 2017 Holmes, Powell, Ma, Ismail, Harrison, Wells, Colgan, O'Callaghan, Johnson, Murray, Ahmed, Heggenes, Fisher, Cardoso, Modat, O'Neill, Collins, Fisher, Ourselin and Lythgoe. This is an open-access article distributed under the terms of the Creative Commons Attribution License (CC BY). The use, distribution or reproduction in other forums is permitted, provided the original author(s) or licensor are credited and that the original publication in this journal is cited, in accordance with accepted academic practice. No use, distribution or reproduction is permitted which does not comply with these terms.
*Correspondence: Holly E. Holmes, h.holmes.11@ucl.ac.uk
†Joint first author.