
- Institute of Biological Research and Biotechnology, National Hellenic Research Foundation, Athens, Greece
StRAnGER is a web application for the automated statistical analysis of annotated gene profiling experiments, exploiting controlled biological vocabularies, like the Gene Ontology or the KEGG pathways terms. Starting from annotated lists of differentially expressed genes and gene enrichment scores, regarding the terms of each vocabulary, StRAnGER repartitions and reorders the initial distribution of terms to define a new distribution of elements. Each element pools terms holding the same enrichment score. The new distribution thus derived, is reordered in a decreasing order to the right, according to the observation score of the elements, while elements with the same score, are sorted again in a decreasing order of their enrichment scores. By applying bootstrapping techniques, a corrected measure of the statistical significance of these elements is derived, which enables the selection of terms mapped to these elements, unambiguously associated with respective significant gene sets. The selected terms are immunized against the bias infiltrating statistical enrichment analyses, producing technically very high statistical scores, due to the finite nature of the data population. Besides their high statistical score, another selection criterion for the terms is the number of their members, something that incurs a biological prioritization in line with a Systems Biology context. The output derived, represents a detailed ranked list of significant terms, which constitute a starting point for further functional analysis.
Introduction
DNA microarrays (cDNA or oligonucleotide) constitute a widely used measuring technology regarding the response of whole genomes, yielding estimates of total gene expression in selected species. Measuring the comparative gene expression with microarrays, has a critical importance in the analysis of biological control mechanisms, phenotyping, molecular profiling of diseases, and more accurate disease classification. Applications include the classification of tumors with different prognosis, indistinguishable solely by microscopic examination or optical inspection, derivation of diagnostic or prognostic signatures, monitoring responses to multiple or different treatments or therapies, rational drug design (Maynard et al., 2003; Tarca et al., 2006). In general, DNA microarrays promote the understanding of the plasticity of cellular circuitry and how this is linked to the manifestation of a phenotypic versatility, regarding various cellular functions in different organisms.
Today, several software packages, commercial or open source, perform routinely microarray analysis and interpretation usually deriving lists of differentially expressed (DE) genes with several hundreds of genes. Though indispensable, the derivation of DE gene lists still remains a primary step, failing to provide insight on the underlying molecular mechanisms, governing the biological problem interrogated and leaving the experts bewildered. In order to highlight statistically significant and biologically relevant actors, enabling thus a systemic perspective, a new round of analysis is applied, emphasizing in the involvement of molecular pathways rather than isolated genes, in order to uncover sets of genes that participate or regulate the same cellular pathway. For this scope, biological ontologies, or more general controlled biological vocabularies constitute valuable sources of standardized biological information, appropriate for DNA microarrays functional analysis. The Gene Ontology (GO; Ashburner et al., 2000) provides such functional annotation adopting a hierarchical schema. In addition, the Kyoto encyclopedia of genes and genomes (KEGG) biological pathway database (Kanehisa et al., 2010) comprises a well structured and constantly enriched library of molecular networks, which has been widely used as a reference point for biological interpretation of large-scale datasets.
Nowadays, multiple software tools are targeting the issue of detecting over-represented ontological terms, in processed biological datasets (Dennis et al., 2003; Hosack et al., 2003; Beissbarth and Speed, 2004; Boyle et al., 2004; Martin et al., 2004; Zhong et al., 2004; Conesa et al., 2005; Zhang et al., 2005; Bauer et al., 2008; Zheng and Wang, 2008). The majority are statistical implementations of tests, which estimate the number of successes in a sequence of draws from a finite population without replacement, like the hypergeometric distribution. Generally, the detection of an over-represented ontological term (e.g., a GO term) can be accurately approximated by the well known example of drawing two-colored balls from an urn, where the balls are equal to the number of genes. Testing statistically an ontological term corresponds to drawing the genes linked to it and examining which of them are parts of the DE list and which are not, in other words counting white (members) and black (not-members). This process leads to the derivation of a contingency table with four categories for each ontological term: (i) DE genes annotated at this term, (ii) DE genes not annotated at this term, (iii) non-DE genes annotated at this term, and (iv) non-DE genes not annotated at this term. A proper statistical test is then used to determine the extent of over-representation of a term in the DE gene list, compared to mere chance. As the number of the ontological terms in each dataset may vary from several tens to hundreds or even thousands of terms, the probability for false positives rises, and this requires application of several, possible, multiple correction methodologies (Osier et al., 2004). Apart from gene names, other software can accommodate DNA sequences (Conesa et al., 2005) in order to perform the aforementioned analysis.
There are various software implementations of the aforementioned approach, each one with its own advantages and limitations. A number of them (GO-TermFinder, GoSurfer, Blast2GO, EASE; Hosack et al., 2003; Boyle et al., 2004; Zhong et al., 2004; Conesa et al., 2005) supports only one statistical mode for the detection of over-represented ontological terms, while others present limitations in their capability to support various available microarray platforms, experiment types, or multiple organisms (Dennis et al., 2003; Beissbarth and Speed, 2004; Boyle et al., 2004; Martin et al., 2004). Some, like GO-TermFinder for instance, require from the user to provide a suitable set of genes, which is used as reference set for the statistical enrichment test (Boyle et al., 2004), while at the same time, certain programming skills are required from the user, in order to exploit the software. Others, being user friendly, require only specific gene accessions but with the cost of becoming inflexible in integrating further relevant information (i.e., gene specific p-values, gene expression values or other statistics) to their output. Moreover, certain tools are inflexible regarding data import, requiring often time consuming manipulations by the user like the Ontologizer (Bauer et al., 2008), while DAVID results in complex outputs (Dennis et al., 2003), bewildering the researcher with a deluge of statistical measures, that confound the interpretation procedure.
The intelligible analysis and interpretation of ontological terms is inextricably bound to the implementation of efficient visualization mechanisms, which illustrate the functional relations among over-represented terms, as well as with all of the terms, neatly and hierarchically. Although various tools provide a visual representation of the results (usually in tree-like demonstrations), still many, like GOToolBox for instance, lack either the feature of automated generation or the capability of visual representation (Martin et al., 2004). Finally, a different category of tools, exploiting ontologies but giving emphasis around specific gene sets, utilize the entire gene lists of a given high-throughput experiment, after sorting them in terms of expression, rather than smaller lists of selected, based on statistical or empirical thresholds, entities. Their algorithms estimate the enrichment of their top or bottom ranked genes to the aforementioned, particular gene sets, as they are formed based on their functional annotations, utilizing different statistical scores coupled with resampling techniques for validation. Typical tools of this category are GSEA (Subramanian et al., 2005) and ErmineJ (Lee et al., 2005). These tools seem suitable for pairwise experimental designs, for example control vs treatment or disease configurations (Huang et al., 2009), a feature which proves to be limiting, if more complex experimental designs, such as time-course studies or multiple drug–response experiments, are targeted.
A common inherent problem, typical of the statistical methodologies that test over-representation, stems from the hierarchical structure of ontologies and their finite nature. Thus, many terms describing biochemically very particular sub-functions of a given cellular process, are ranked very high, simply because they are linked to very small gene numbers. This trivial finding from a pathway perspective, results from the fact that such terms possess a very strong statistical score, since their enrichment is very high or even complete. Such terms represent at the same time a large proportion of the total annotations of a dataset obfuscating the interpretation, with descriptions of limited information content from a pathway perspective. Multiple-testing correction methods do not remedy the problem, as their properties have not yet been adequately studied (Osier et al., 2004) and most of them do not take into account the graph structure of biomedical ontologies (Goeman and Mansmann, 2008). As high-throughput technologies are noise sensitive, the presence of false positives, due to technological limitations, may severely contaminate the interpretation. Processes corresponding to these GO terms (or more general similar, controlled vocabularies) may thus have limited functional biological value. Graph theoretic approaches are addressing this issue by considering the tree structure of the description. For example, GOToolBox (Martin et al., 2004) uses a combination of modules that detect over-represented GO terms, clusters them and scores genes based on their shared GO terms using a Czekanowski-Dice like distance, while Ontologizer (Bauer et al., 2008) considers the GO inheritance problem that is, the fact that the probability of a GO term being significant is much higher if one or more of its parental terms are significant. Ontologizer addresses this issue by implementing the parent–child method (Grossmann et al., 2007) or the elim algorithm (Alexa et al., 2006). However, both tools have certain particularities regarding data import, which limit their applicability.
StRAnGER is a web-based application1, which performs functional analysis of high-throughput -omic datasets, on an initial list of significant entities, derived after applying statistical, and/or empirical thresholds. At present, it utilizes GO or the KEGG pathway database. However, the implementation is generic enough to accommodate other available biological ontologies, related to -omic data or more generally controlled vocabularies. StRAnGER uses established statistical methods, in order to relate the identified significant genes with important nodes in the GO tree structure or interchangeably map those genes to over-represented metabolic pathways, like KEGG Pathways. Aim of StRAnGER is to suggest whole molecular pathways or parts of them, incorporating a crucial number of significantly DE genes of the list as interesting targets for further biological research rather than isolated genes, which are more susceptible to the impact of systematic or random errors. The main goal of StRAnGER is to sort out among all terms of a controlled vocabulary associated with the significant gene list, those revealing critical aspects of cell function (i.e., nodes higher in the GO hierarchy, densely enriched KEGG metabolic pathways), which consequently encompass a reliably high number of genes that implies unambiguously the involvement of a specific biochemical pathway. These terms are ranked according to their statistical significance, following their p-value score as derived from a suitable over-representation test. In this sense, the impact of noise on high-throughput genomic experiments is significantly mitigated, thus consolidating the selection of specific biological targets, for further investigation.
Materials and Methods
Data Import and Supported Background Sets
StRAnGER requires a tab-delimited text file, with unique gene identifiers corresponding to the microarray platform used or to the public database that is chosen for genomic annotation extraction (e.g., Ensembl). An additional column, with p-values corresponding to each gene, is optional. StRAnGER offers the possibility to use a variety of sources and organism-related information, for the generation of the background dataset, including Bioconductor (Gentleman et al., 2004) array annotation packages or Ensembl gene annotations for various organisms (Flicek et al., 2008). In addition, the user can upload a custom annotation file, including the minimum information required for StRAnGER analysis, in tab-delimited text format. In all cases, a user-friendly wizard enables the user to specify the number and type of columns, containing information needed for the subsequent analysis.
Statistical Assignment of Enriched Ontological Terms
StRAnGER currently provides three statistical tests for the identification of enriched ontological terms, given a list of selected entities (i.e., genes, but also proteins or other molecules), and together, the appropriate reference set. If t is the total number of significant entities, z the number of significant entities related to a term Ti, n the total number of the members of the reference set, and x the members of the reference set related to a term Ti, then
(1) The hypergeometric test, where the probability for a term Ti to be over-represented is given by the formula:
(2) The Fisher’s exact test where the probability for a term Ti to be over-represented is given by the formula (directly related to the hypergeometric distribution):
(3) The χ2 test, where the χ2 statistic for a term Ti is calculated firstly as follows: let
Then the χ2 statistic is given by
And the probability for Ti to be over-represented is given by (assuming w = χ2 and one degree of freedom for the χ2 cumulative distribution function)
where γ denotes the lower incomplete Gamma function and γ denotes the Gamma function (Soong, 2004).
The StRAnGER Algorithm
The lists of statistically significant entities obtained after the high-throughput data processing are utilized to perform functional analysis, exploiting ontological terms. Each ontological term has a certain score (number of observations) both in the whole array list just as in the significant list. The ratio of the number of observations of a certain term in the significant list to its number of observations in the whole array or more general reference list is called “enrichment” and is considered a feature. Having defined the enrichment objects, the significance of a term is assessed through the use of a proper statistical test. Appropriate statistical tests for this analysis are the aforementioned hypergeometric test, the χ2 test or the Fisher exact test.
At this point, the need to identify the desirable elements from the biological point of view should be stressed, namely, terms with a low p-value score, that comprise a substantial number of genes linked to this term in the whole reference list, which at the same time present high enrichment. In the case of GO terms, the GO schema defines a hierarchical tree for the representation of genes, distinguishing description of gene in three principal categories, viz., biological process, molecular function, cellular component. All complex biological actions within a cell are perceived by adopting a “top-down” logic, as functional entities, which can be analyzed to a combination of cellular, biochemical (metabolic, signaling, transport, etc.) pathways. Every process can be broken down to numerous other elementary processes, linked with subsets of the parent gene set, to the point of trivial cases of GO terms, related to only one or two genes, presenting therefore an extremely high enrichment of (50–100%), which is reflected in a very low p-value.
The processes corresponding to these GO terms have limited biological value from a global, cellular perspective. Nevertheless, they have a very strong statistical score merely because their enrichment is 100%. To overcome this problem, and define a set of ranked terms with both high biological content and statistical significance, the following steps are adopted.
Many terms have identical ratios (enrichments). By grouping terms according to their specific enrichments, a distribution of elements is created, which pools together terms with the same enrichment, and is then sorted from the most to the less frequent cases (left to right order). Elements with the same frequency are sorted again in a decreasing order, according their p-value enrichment scores. Using this list, a figure depicting the relative frequency of each group is created (Figure 1A).
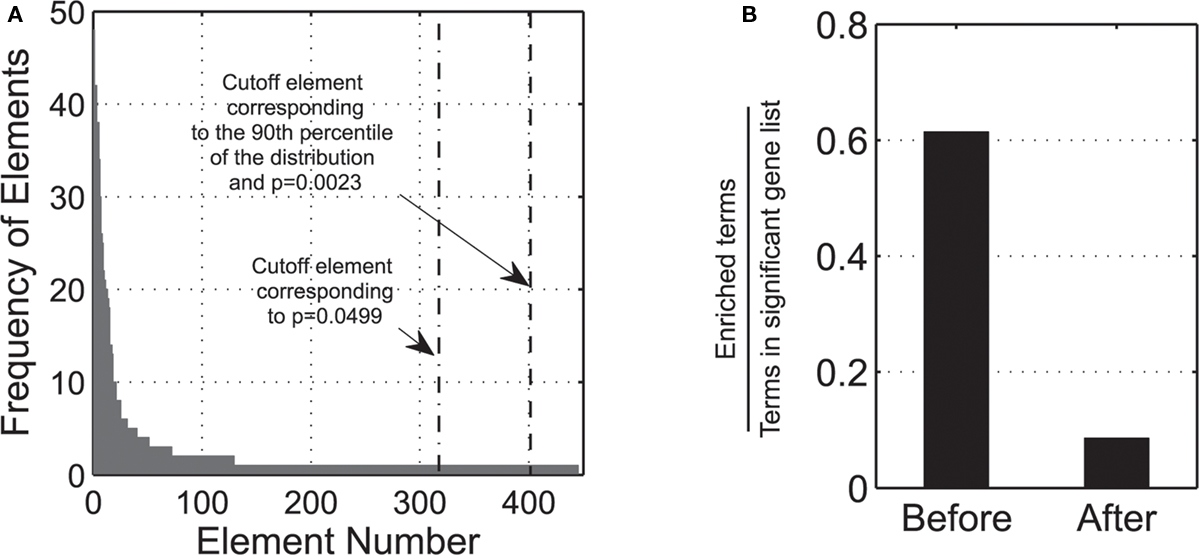
Figure 1. (A) Frequency of sorted elements, according to StRAnGER algorithm: the figure presents the number of observations for each element. The dash-dotted line depicts the cutoff element by just applying a threshold on the statistical p-value, while the dashed line depicts the corrected threshold based on the application of bootstrap. (B) The left bar labeled “Before” depicts the ratio of enriched terms to the number of all terms that the significant genes are annotated to. This ratio is derived after the application of solely an enrichment score p-value cutoff. The finite nature of the enrichment statistical tests renders the analysis extremely sensitive to false positives, and thus tremendously error prone, due to bias infiltration, as many terms can obtain technically a high statistical score. The right bar labeled “After” depicts the same ratio after the application of StRAnGER algorithm. The graphs are based on the data presented in Moulos et al. (2009).
In this way, elements are sorted by taking into account both the statistical and biological significance and defining a final population distribution for the ranked elements. In this distribution, a percentile threshold is set (default 90th percentile) to define the acceptable cutoff for significant terms. By applying bootstrapping in the thus formed distribution (Efron and Tibshirani, 1993), a corrected assessment of the statistical significance of these elements is enabled, which targets the selective gleaning of terms mapped to these elements. These terms are unambiguously associated with respective sets of differentially expressed genes. Using the population of the elements as the starting sample pool, a number of bootstrap iterations (default 10000) is performed. Each bootstrap yields a new element distribution. From the frequencies of each element distribution, a histogram is built and a cutoff threshold is derived. Based on all these cutoff thresholds, a distribution of the ranked thresholds is built, which is compared with the cutoff threshold of the initial element distribution. An illustrative description of the distribution of the cutoff thresholds of the bootstrap technique in the present analysis is given in (Figure 1A). At this point, there are two possible options:
• If the cutoff threshold of the initial element distribution (Figure 1A) belongs to the elements above the cutoff (90th percentile) of the bootstrap distribution, then it is admitted as a cutoff threshold for the selection of the significant terms. Since elements comprising ontological terms are sorted in ascending order of significance, only elements greater than the element that corresponds to the cutoff percentage are accepted from the initial distribution.
• If the cutoff threshold of the initial element distribution is below the cutoff of the bootstrap distribution then it cannot be accepted as a cutoff threshold for the significant ontological terms. In that case, the element just over the cutoff threshold of the bootstrap element distribution is taken as the desired threshold instead.
In this way, the terms selected (Figure 1B) are immunized against the bias infiltrating statistical enrichment analyses, producing technically very high statistical scores due to the finite nature of the data population. Besides their high statistical score, the terms gleaned contain a substantial number of biological entities (biomolecules-genes, proteins, etc.) thus incurring a biological prioritization in the selection of the terms, amenable to a Systems Biology context. The output derived, represents a detailed ranked list of significant terms and sets a starting point for further functional analysis.
A mathematically formalized algorithmic description of the aforementioned process for the case of GO terms follows:
Assessment of Kinship Among Ontological Terms
Another important, unique feature of StRAnGER, has to do with its capability, to assess the level of kinship among the distribution of significant ontological terms, compared to a similar distribution of terms that would be randomly picked by mere chance. This functionality enables a first, overall validation of the results of the analytical procedure at the computational layer, prior to the biological one. In order to examine the significance of the extent of kinship for the resulting population of enriched ontological terms, StRAnGER uses the following, graph-theoretic, pairwise, absolute distance metric (Moulos et al., 2009), of the relevant ontological tree (i.e., for the GO tree, Cellular Component-CP, Molecular Function-MF, or Biological Process-BP):
where nc denotes the number of ontological terms in either category (for the GO tree CP, MF, or BP) and denotes the absolute distance between nodes i and j in the tree undirected acyclic graph (UAG). Dc represents the average of all pairwise absolute distances among significant ontological terms, UAG calculated for all ontological categories. The statistical validity of Dc, is assessed by resampling the same number of ontological terms from each corresponding ontological category (here GO categories) from the respective reference GO sets, resulting in distinct background bootstrap distributions of Dc’s for each ontological category. Statistical significance is assessed using the bootstrap p-value:
where m is the number of resampling iterations.  represents a modification of the estimation of the Achieved Significance Level for bootstrap (Efron and Tibshirani, 1993).
Output
StRAnGER supports different output options. The text output of the application is a structured text file, in tab-delimited format that contains the enriched ontological terms resulting from StRAnGER, accompanied by their biological annotations and statistics, such as the statistical test’s p-value (raw and corrected) and the enrichment ratio. Under each term, the names of the biological entities related to this term are placed, which comprise the significant list (genes, proteins, other molecules), together with further useful information like their unique accessions, names, descriptions and individual p-values (if provided by the user). In addition, additional information on each entity (e.g., expression values, additional identifiers), can be appended to the output file, if included in the input file with the significant entities, should the user wished so. This information is also given as a webpage (html file), where each GO term is linked with the AmiGO browsing tool for GO (Carbon et al., 2009), each resulting KEGG pathway is linked to the corresponding fully annotated entry (and map) in the KEGG pathways database and each gene is hyperlinked with GeneCards database (Safran et al., 2010), in order to provide additional, versatile, available, annotated information about each entity (i.e., gene). The design of the text output is user friendly, facilitating the interpretation from the side of the expert. The text output can be further configured to comply with the following three subtypes: (i) a file containing all information (ontological terms, entities related, statistics), (ii) a file containing only the ontological terms with their statistics (p-value, enrichment score), and (iii) a file that contains only the names of the ontological terms. The latter is provided for compatibility or further processing with other applications (e.g., pathway mapping based only on GO terms).
Visualization
StRAnGER supports advanced visualization capabilities of its results in both cases, namely GO or KEGG pathway terms analysis. Regarding visualization of GO analysis, a tree-like illustration is adopted depicting the ancestor/descendant relationships among the enriched GO terms, so that correlation among the significant ones can be visualized and conceptualized. The depth of the hierarchical relationships is determined by the user at the beginning. Each significantly enriched GO term is colored. By accentuating (lower p-values) or dimming (higher p-values) the node color, statistical significance is demonstrated. In this way, the user can easily capture overall the most significant GO terms, at a glance. In addition, the application supports batch mode, appropriate for performing integrative analysis of various datasets together, where the users may upload multiple StRAnGER outputs. In this way a combined graph output is created, able to visualize possible relationships among several experimental outcomes at the functional level. The GO terms from each experiment are colored differently, whereas also terms that are common among different experimental results may be colored elsewise. In this way, the researcher can easily locate biological functions shared in multiple experiments and set points of further investigation. Regarding the visualization of the results of KEGG Pathways, StRAnGER interfaces with web services originally developed by KEGG administration that implement advanced visualization functionalities of KEGG pathway maps, in order to paint selected pathway maps, resulting as significant from its execution, with the related molecular entities (genes, or possibly proteins) that are considered significantly differentially expressed and are present in these pathway illustrations.
Implementation
The core StRAnGER routine is programmed in Perl. The GO directed acyclic graph (DAG) is retrieved and handled using tools from MATLAB’s 7.4 (R2007a) Bioinformatics Toolbox and converted to an UAG by transforming its adjacency matrix, in order to measure absolute distances between DAG nodes. The visualization of GO terms relationships is achieved by a combination of MATLAB routines and the graphViz library2. The whole application is built upon a Linux server, running Apache, MySQL, and PHP platforms. At present, and in order to promote the concept of pervasive, distributed computing, a Java programmed StRAnGER web service is currently under development (WSDL representation), to provide availability and access to its functionality, by being incorporated in third party analysis workflows, through the use of appropriate workflow managers like the Taverna Workbench (Hull et al., 2006).
Results and Discussion
StRAnGER is a web-based application1, which performs high-throughput genomic experiment functional analysis, for multiple types of data (i.e., microarray or next generation sequencing experimental datasets). For this scope, it exploits two organizational schemas for standardized biological description: that of GO and that of KEGG pathway database. StRAnGER is unique, regarding its capability of performing either GO analysis or molecular pathway analysis, exploiting the top-rated internationally KEGG pathways collection. In both cases, it performs enrichment analysis, through various statistical tests, coupled with resampling techniques to ensure robustness of the results. StRAnGER supports intelligible graphical representation of the results (Figure 2), whether the enrichment analysis concerns GO or KEGG pathway terms. In this way, the researcher can project and correlate results from different experiments, and possibly extract biologically useful conclusions. Its web-based nature renders StRAnGER platform-independent. Its design is absolutely transparent, enabling easy accessibility to all its features, even for computer beginners. Additionally, its simple, user-friendly interface (Figure 3) empowers the user to complete several analysis rounds fast and accurately.
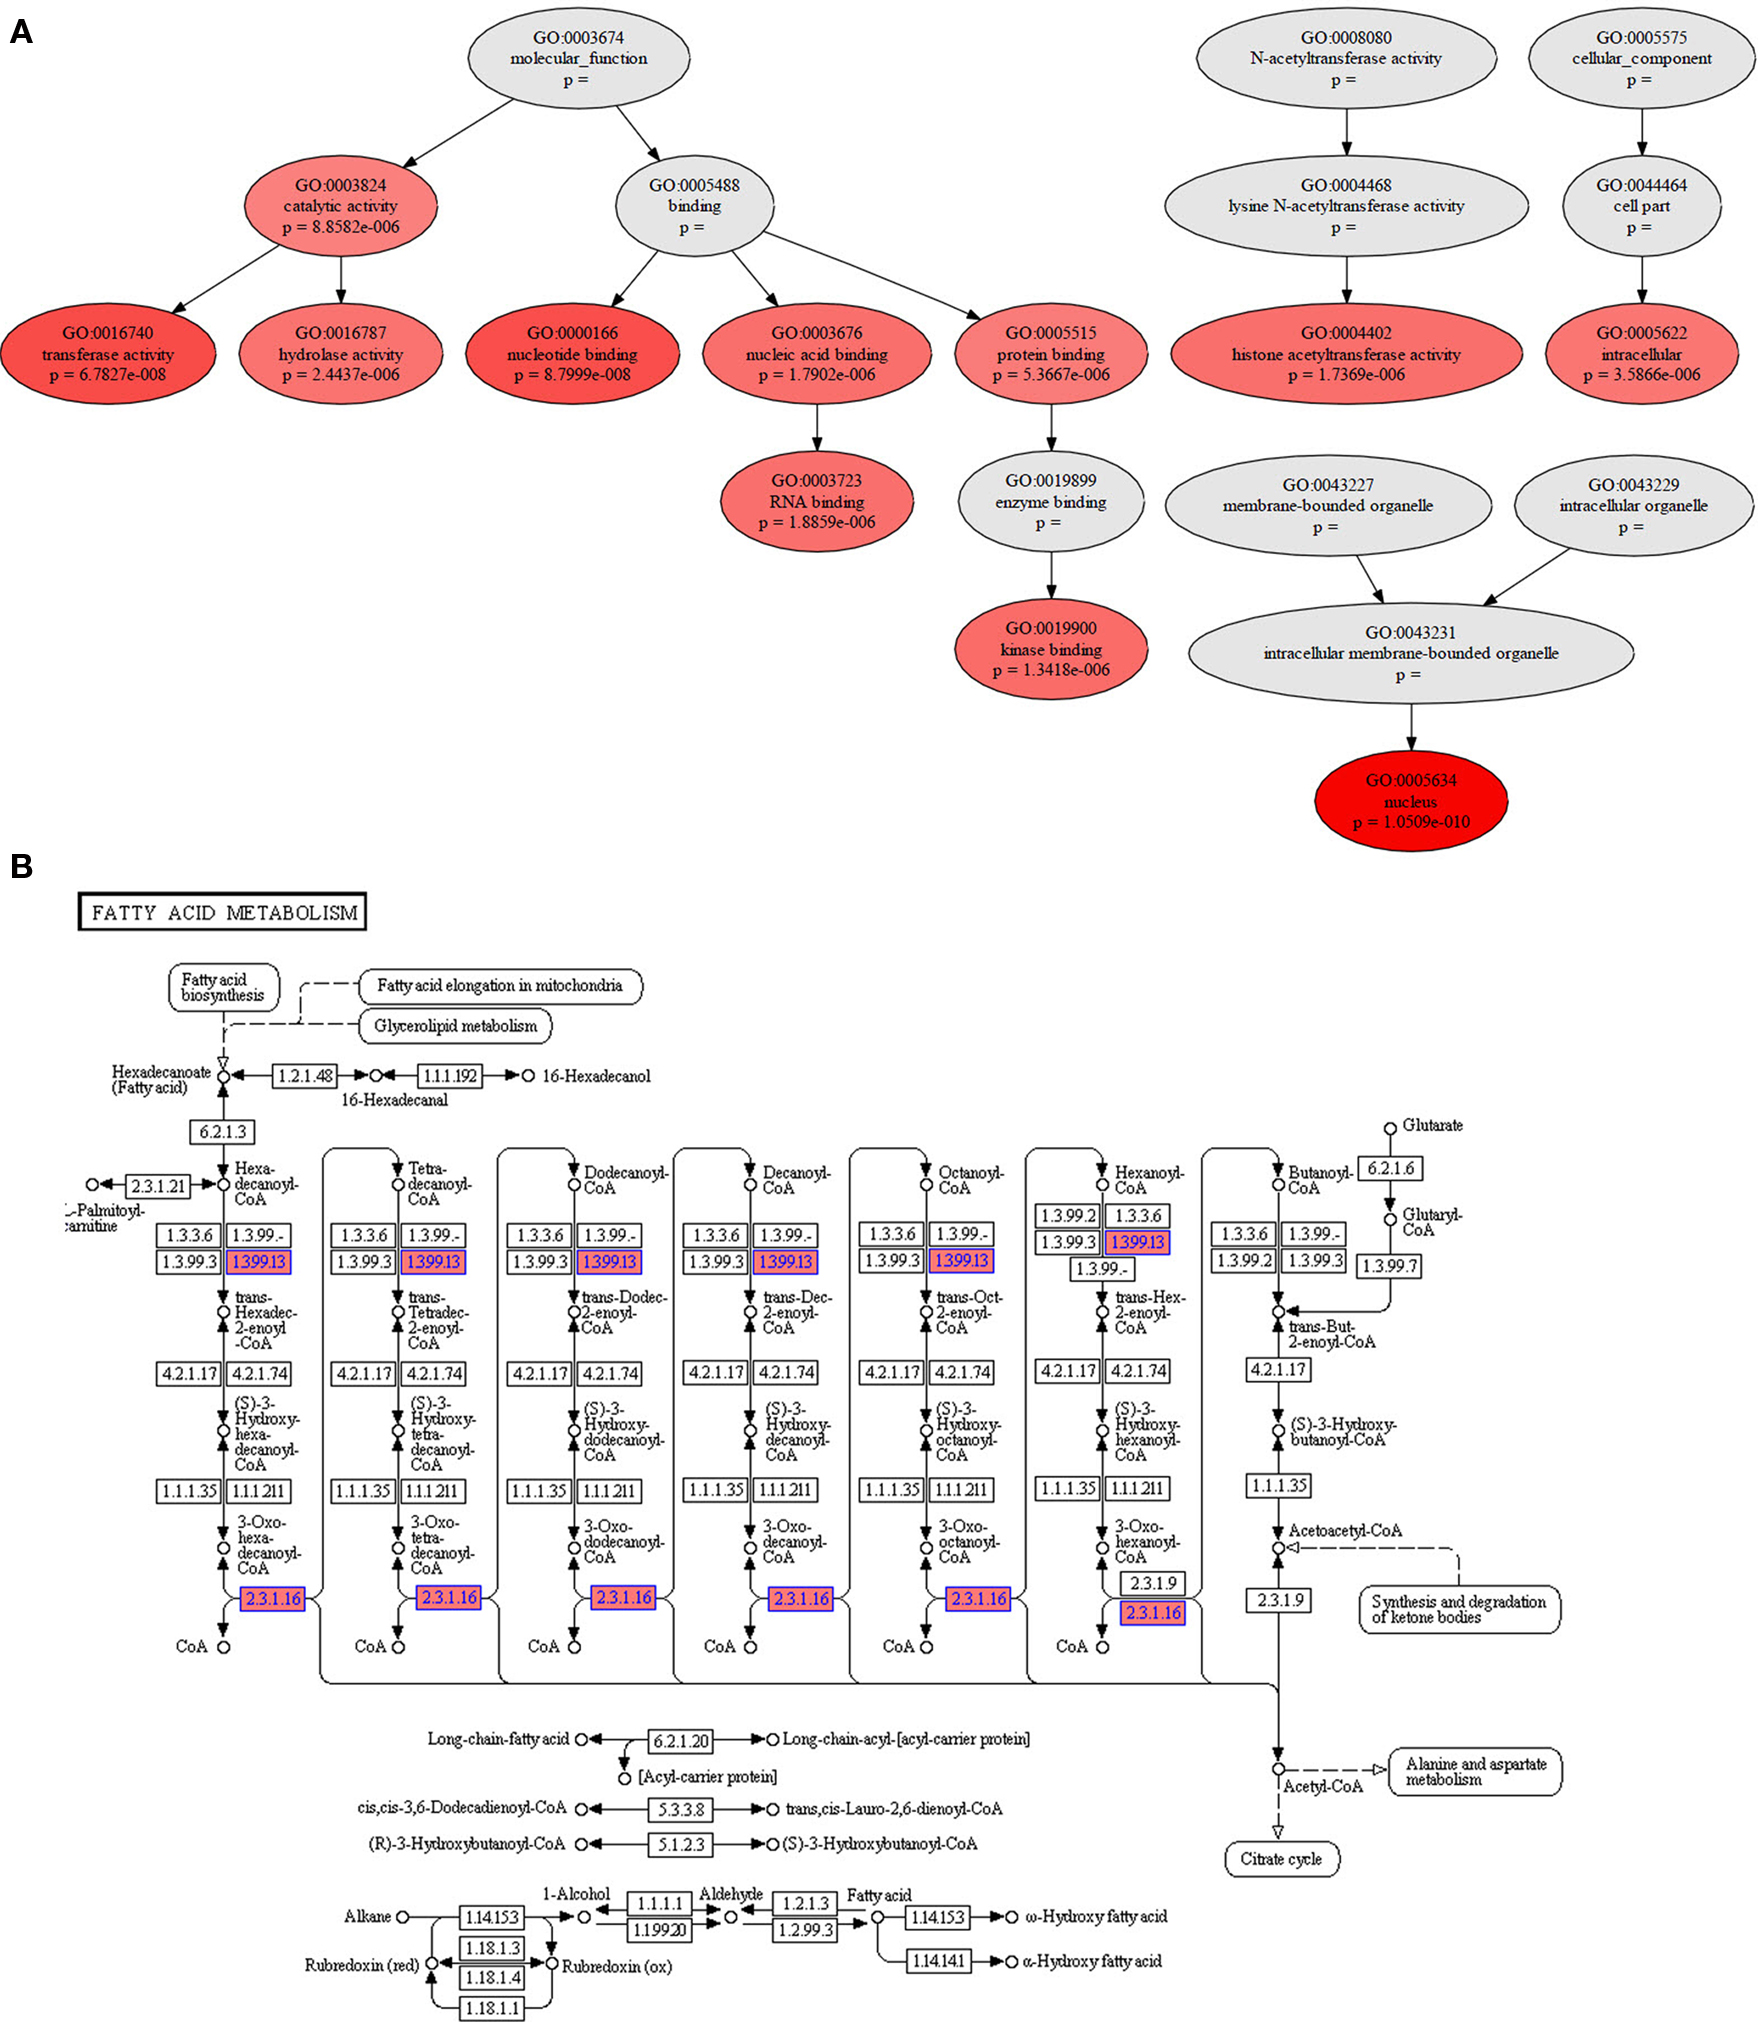
Figure 2. Two graphical outputs from StRAnGER applications. (A) A tree view presenting the relationships among the 10 top GO terms from Table 1. The ancestor depth has been set at 2. The significance of each GO term is depicted by the accent of the fill color in the respective nodes (here red), that has been selected to map each dataset. (B) Illustration of KEGG pathway “Fatty acid metabolism” from Table 2, with colored components.
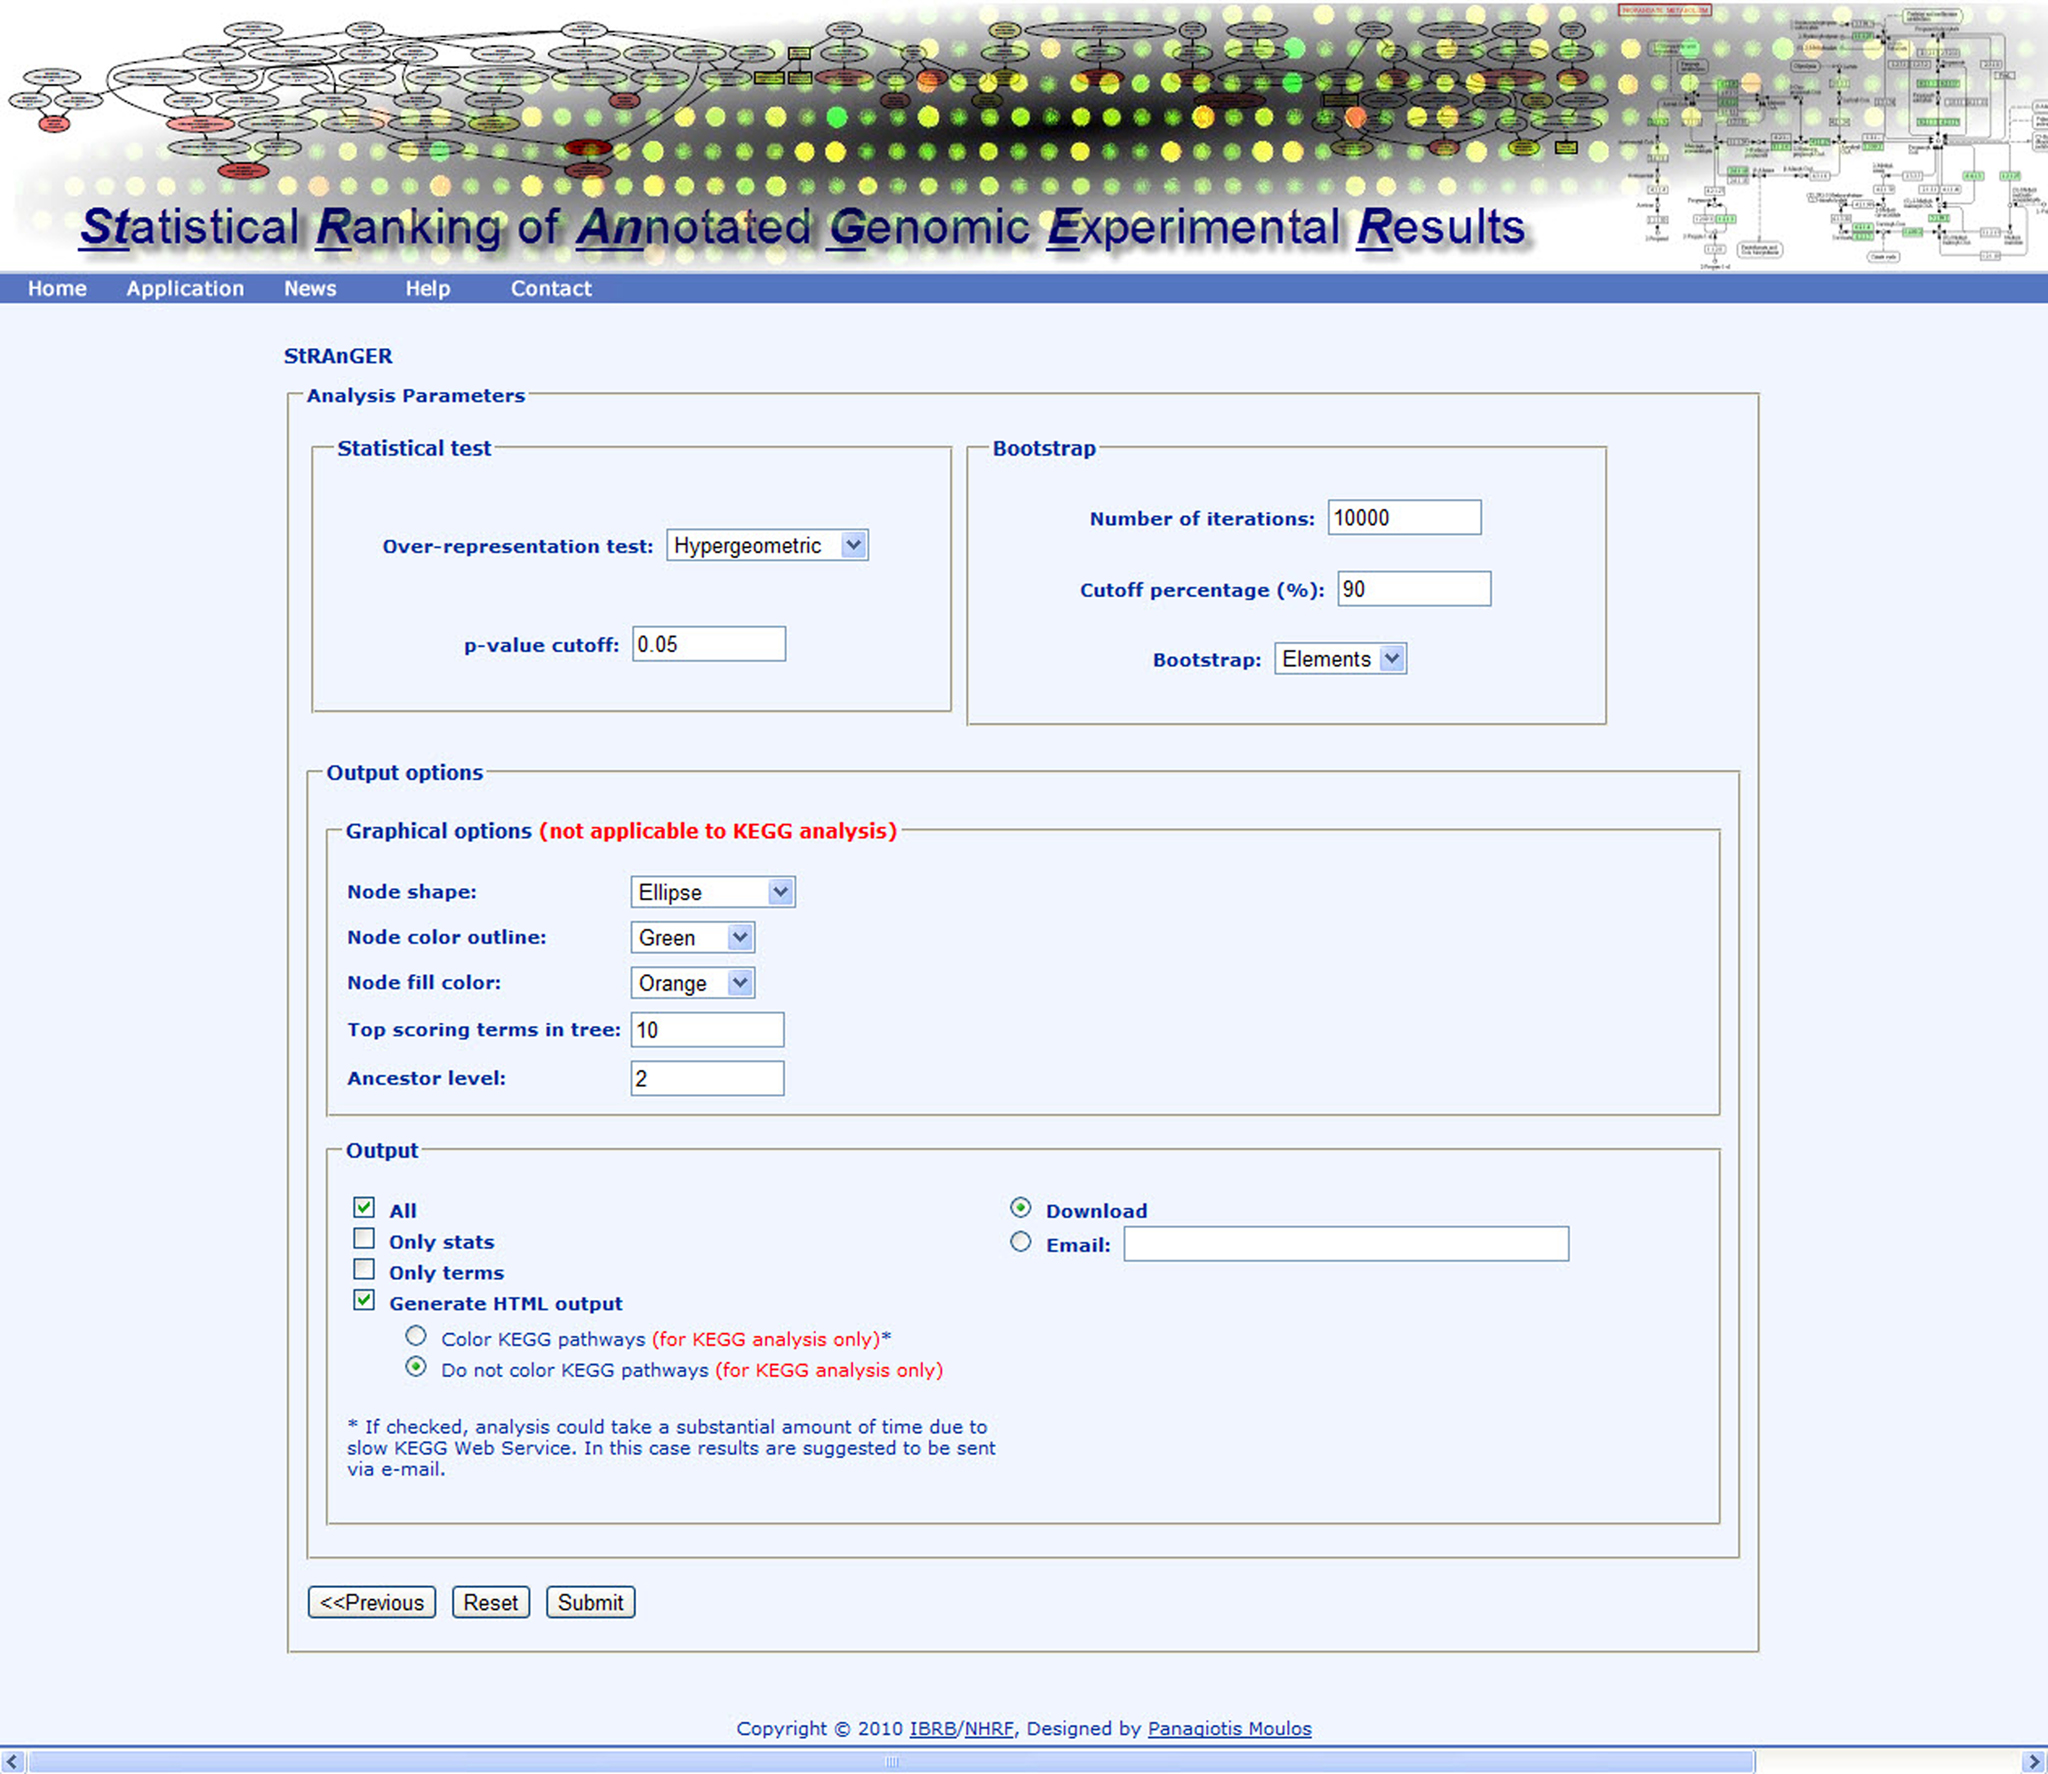
Figure 3. Instance of the StRAnGER application web interface depicting various parameters of the StRAnGER algorithm and the tree visualization.
StRAnGER is fully operative1. StRAnGER has been successfully used, routinely, for analysis of several microarray datasets, exploiting either GO or KEGG Pathways, among which, datasets concerning human PC-3 prostate cancer cell survival (Tenta et al., 2007) and the effects of mastic oil on mouse lung cancer cells (Moulos et al., 2009). In order to demonstrate the usefulness of StRAnGER in enabling prioritized functional analysis, by deriving a sorted list of GO terms or KEGG pathways, the results of the analysis of the effects of mastic oil on mouse lung cancer cells are presented in brief. Mastic oil, a natural extract from Pistacia lentiscus variation chia is a blend of bioactive terpenes with identified therapeutic properties (Koutsoudaki et al., 2005). It has been shown to induce anti-tumor activities by possibly inhibiting cancer cell proliferation, survival, angiogenesis, and inflammatory response (Magkouta et al., 2009). In Moulos et al. (2009), StRAnGER was used to infer enriched GO terms, in a designed time-course DNA microarray study, performed to reveal possible anti-tumor effects exerted by mastic oil treatment on mouse Lewis lung carcinoma (LLC) cells. The significantly enriched GO terms according to StRAnGER, are presented in Table 1. The correlation of the enriched GO terms, to specific biological processes, was assessed based on the resampling distance-based algorithm described in Section “Materials and Methods” (pF = 0 and pP = 0.001), supporting the validity of those terms.

Table 1. A list of significantly enriched GO terms derived from the data in (Moulos et al., 2009) after the application of StRAnGER.
From those top performing GO terms according to StRAnGER, emphasis was given to four of them, GO:0008285 (negative regulation of cell proliferation), GO:0007049 (cell cycle), GO:0006917 (induction of apoptosis) and GO:0043123 (positive regulation of I-κB kinase/NF-κB cascade). Those terms were selected on the basis of including genes with high expression rates but also for their established role in cancer progression supported by previous experimental evidence (Magkouta et al., 2009). The phosphatase and tensin homolog deleted on chromosome ten (Pten) gene was found to be involved in three of the selected GO categories while there is evidence supporting a functional cross-talk between PTEN and NF-κB signaling (Vasudevan et al., 2004). Pten along with three other genes, E2f7, Nod1, and Hmox1, were validated by RT-PCR analysis in all time points of the experiment, presenting overall good correlation with the microarray analysis profile of differential expression.
Besides GO analysis, the algorithm of StRAnGER was applied in terms of the KEGG Ontology (KO), which emphasize in a detailed description of various aspects of cellular metabolism (KEGG Pathways) across different species. Both approaches are complementary since GO-analysis retrieves functional information concerning cellular physiology in a broader molecular context, while KEGG pathway analysis maps the alterations observed at the -omic experiments, at detailed biochemical cellular reaction networks. Coupled to the interesting cancer-related processes, which were highlighted by GO analysis, and imply perturbation of cell cycle (“negative regulation of cell proliferation,” “DNA replication initiation,” “cell cycle,” “cell division”), KEGG analysis (Table 2) corroborates GO-analysis, regarding glutathione and fatty acid metabolism, DNA-related procedures (purine and pyrimidine metabolism), whereas it gives also emphasis to xenobiotic metabolism due to the combined alterations observed in these molecular pathways. Overall, it can be said that the physiological information captured through both analyses, epitomized in the functional description of these terms, reflects a consistent, combined overview of the cancerous physiology, revealing however crucial functional parameters that may aid the expert in gaining insight into the intricacies of its manifestation. Glutathione metabolism for instance is tightly related to the manifestation of antioxidant action and could thus provide missing links for the explanation of the apparent anti-tumorigenic activity of mastic oil. On the other hand, as mastic oil is a plant derived mixture of terpenes, it induces a systemic cellular response, demonstrated by the activation of xenobiotic metabolic pathways. Albeit these findings represent suggestions for further investigation, it is obvious that StRAnGER facilitates the design of targeted experiments, for validation of new hypotheses, as was the case in (Moulos et al., 2009). Yet, the ranked list of terms, accompanied by the individual significant molecular players linked to these terms, and useful information about their expression, constitutes a case-specific valuable pool of scalable, biological information that can be integrated at a controlled pace.
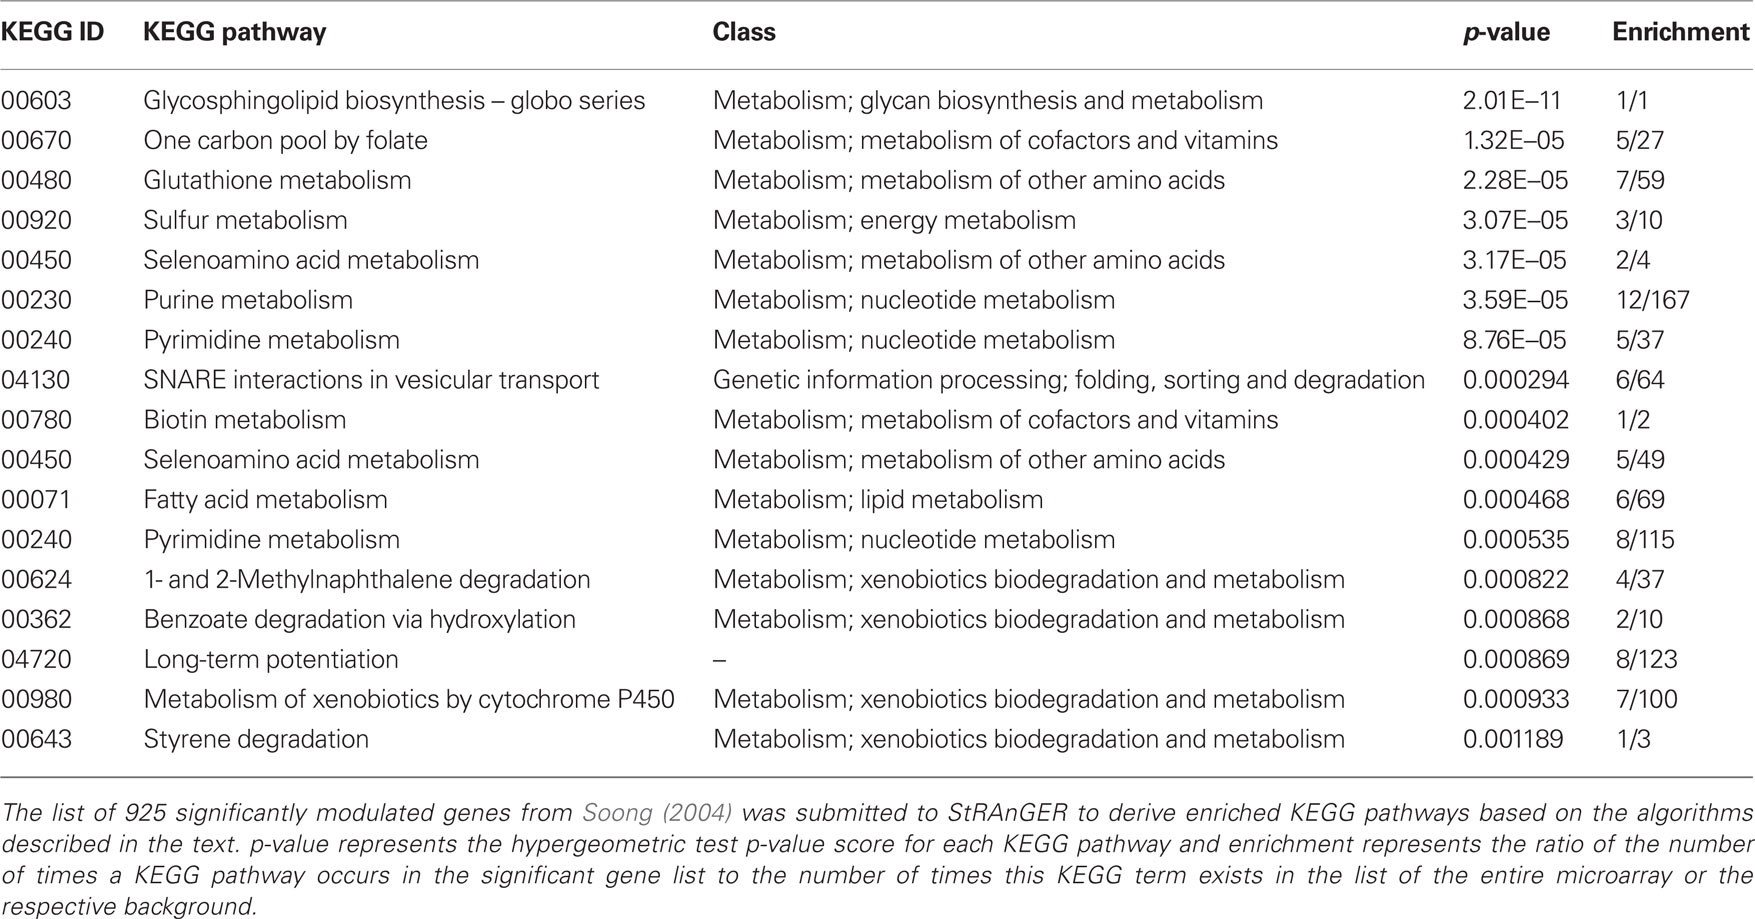
Table 2. A list of significantly enriched KEGG pathways derived from the data in Moulos et al. (2009) after the application of StRAnGER.
In order to evaluate the performance of StRAnGER compared to other state of the art GO analysis tools, a simple comparison of the results of StRAnGER with those of, GOEAST (Zheng and Wang, 2008) and GOstat (Beissbarth and Speed, 2004) was performed. The data of Moulos et al. (2009) were used for statistical GO analysis through GOEAST and GOstat, applying two different statistical configurations: (i) no multiple-testing correction (ii) Benjamini–Yekutieli correction of FDR under-dependencies. The number of the resulting GO terms for a p-value cutoff of 0.05 was measured and the results are presented in Figure 4. The default StRAnGER algorithm, with a p-value cutoff of 0.05 and a 90th percentile cutoff to its element distribution, results in 63 GO terms while GOEAST results in 721 and 133 terms without and with multiple-testing correction respectively, and GOstat results in 359 and 37 terms without and with multiple-testing correction respectively. The results of all executions are provided in Supplementary file 1 online.
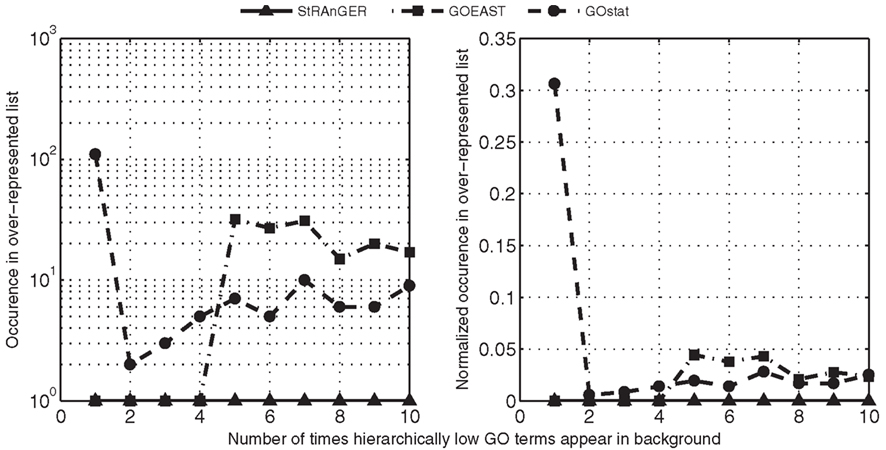
Figure 4. Observations of hierarchically low GO terms in the resulting list of significantly enriched GO terms, derived from the usage of StRAnGER and two widely used software packages: GOEAST and GOstat. In both panels, numbers in the horizontal axis represent the number of times that GO terms, connected to only one or very few genes, describing a very specific and limited from the pathway perspective, action, appear in the background list that is used (in this case, all annotated probes in the microarray), while in the vertical axis a measure of observation of these low frequency GO terms is depicted, regarding the significant list of over-represented ones. The vertical axis in left panel depicts a simple count of low frequency GO terms in the significantly over-represented GO terms (how many times these terms infiltrate the significant list), resulting from the usage of the three packages, while in the right panel, the count of low frequency GO terms is normalized to the total number of over-represented GO terms returned by each package. In both cases, StRAnGER performs, as its curve shows, better or at the same level (in the case of GOEAST for very low frequency terms) with the others, implying that its prioritization algorithm manages to filter out noise caused by very specific functions, being low at the GO hierarchy, without the application of any multiple-testing correction methodology, a strategy reported as controversial (see main text).
A comparison of the results of StRAnGER with both lists derived from GOEAST reveals that in both cases, StRAnGER returns fewer (Figure A1A in Appendix) and more specific in terms of biological function terms, with the prioritization algorithm being able to filter out very generic functions such as “cell part” or “binding.” It is to be noted that even after multiple-testing correction in GOEAST, such terms remain, with some of them representing root nodes in the GO hierarchical tree, e.g., “cell.” Regarding the results of GOstat, it should be stressed that in the case of the uncorrected GO terms list, a plethora of GO terms with enrichment 1/1 are present, which constitute “leaves” of the GO tree and are totally uninformative in the pathway context, (see Supplementary Material), while in the list derived after application of the multiple-testing correction, mainly generic nodes such as “membrane-bounded organelle” are qualified, even if the total number of returned GO terms is lower than the number of terms returned by StRAnGER. This happens because the application of the multiple-testing correction is applied solely in the distribution of p-values, thus applying a stricter statistical threshold. As the classical enrichment tests favor terms enumerating many members, this has a clear impact in the resulting list of terms.
Even though the application of multiple-testing correction partially limits the presence of very general biological terms in the output lists of GOEAST and GOstat, the final outcome depends heavily on the internal structure of the molecular lists, comprising the list of significantly differentially expressed molecules, but also the list to be used as background. This is due to the finite nature of the statistical tests based in the concept of over-representation. In addition, the application of classical multiple-testing correction in the case of GO-based gene list interpretation has been reported controversial (Osier et al., 2004), as it can prove excessively or less conservative depending on the correction method applied (family wise error rate, FWER; false discovery rate, FDR). Two major concerns with these procedures are that: (i) they assume general independence among tests, something clearly violated in the case of ontological terms (Osier et al., 2004), where strong covariance exists for numerous ontological terms as a result of the underlying biology and (ii) they do not take into account the graph hierarchical structure and the inherent properties of GO (Goeman and Mansmann, 2008). Regarding case (i), the FDR control under-dependencies (Benjamini and Yekutieli, 2001) is often applied, assuming positive regression dependency among test. However, this approach may also prove inadequate to explain the complex hierarchical properties of GO. Taking into account the aforementioned concerns, an evaluation of the outcomes of StRAnGER was performed through comparison with the outcomes of GOEAST and GOstat without using any multiple-testing correction procedure, in order to evaluate the ability of StRAnGER to filter out very specific (leaves of the GO tree) and very generic biological functions under a strict, formal, equivalent for all methods, evaluation framework.
Our presumption, which serves as a performance criterion, is that GO terms representing very specific biological functions, identical in practice with those of one or two genes, lying very low in the GO hierarchy (very poor information content in the pathway context), should be filtered from an output list of GO terms, despite the fact they present an extremely high enrichment. To assess the ability of the three packages to filter these hierarchically low terms, their observations were counted in the outcome lists. The results are shown in Figure 4, both as simple counts (A), as well as normalized to the total number of terms for each outcome (B). It should be noted that even though this scaling step was not entirely necessary, as the algorithm of each program is independent and responsible for the noise included in each outcome, it was performed in order to avoid possible bias in the scoring scheme, caused by large differences in the numbers of enriched GO terms, derived by each application. Moreover, in order to standardize the evaluation of the three solutions, trivial terms presenting a very low gene content (i.e., 1, 2, 3 genes), and at the same time yield a very high enrichment score (p-value < 0.001) were filtered out. It should be noted that StRAnGER, by its inner logic, is always capable of eliminating these terms, so these terms were excluded from the comparative analysis, in order to neutralize the evaluation and avoid favoring its results pro StRAnGER. However, still the curve corresponding to StRAnGER (solid line with triangle markers) lies constantly below the curves of GOEAST (dash-dotted line with square markers) and GOstat (dashed line with circle markers), stressing out the ability of the prioritization algorithm to filter out hierarchically low GO terms of limited biological significance in a pathway context, without the use of multiple-testing correction. Similar results are acquired for GO terms connected to generic functions (count in background list > 2000), where StRAnGER filters out many of them (Figure A1B in Appendix).
Overall, the uniqueness of StRAnGER in forming a ranked distribution of terms, according to their enrichment scores and then applying resampling techniques, mitigates the bias either in favor of very high enrichment scores, or of very general terms, with high gene membership. Overall, it seems that StRAnGER is able to capture a significant portion of crucial biological functions encountered in the dataset, while at the same time, through prioritization, renders the inflow of information, for integration purposes from the resulting list, manageable by the expert.
StRAnGER aspires to provide researchers with rational targets for further research by exploiting either the GO or the KEGG pathway database. However, the methodology is generic enough, to efficiently accommodate in the near future, other biological ontologies and support analysis, by using their annotations. Despite the wealth of tools for ontological analysis, to the best of our knowledge there is no other approach, combining the application of biological prioritization on the terms, based on the types of enrichments observed in the population of terms, with the subsequent, generic use of strict statistical criteria together with bootstrapping, as a means to ensure robustness of the results. StRAnGER provides correction by applying a stringent distribution-free criterion through the use of bootstrapping than just by using the raw statistical test alone. The use of resampling enables the robust automated derivation of the list of significant processes At the same time, p-value correction based on widely used FWER methods (Dudoit et al., 2002) is also provided as additional information in the resulting output list. The resulting list of GO or KEGG Pathway terms and their clear mapping to distinct cellular procedures, introduce a pathway perspective as regards the interpretation of these experiments, thus refactoring the analysis of lists of significant genes, to empower a systems level functional interpretation.
Conflict of Interest Statement
The authors declare that the research was conducted in the absence of any commercial or financial relationships that could be construed as a potential conflict of interest.
Acknowledgments
The authors would like to thank Efthimios Ladoukakis for essential contribution in the development of the generic tree visualization and CERVis tools using the graphviz libraries and also Ioannis Kanaris and Ioannis Valavanis for generous help in the development of the PHP front-end for the StRAnGER application.
Supplementary Material
The Supplementary Material for this article can be found online at http://www.frontiersin.org/systems_biology/10.3389/fnins.2011.00008/
Footnotes
References
Alexa, A., Rahnenfuhrer, J., and Lengauer, T. (2006). Improved scoring of functional groups from gene expression data by decorrelating GO graph structure. Bioinformatics 22, 1600–1607.
Ashburner, M., Ball, C. A., Blake, J. A., Botstein, D., Butler, H., Cherry, J. M., Davis, A. P., Dolinski, K., Dwight, S. S., Eppig, J. T., Harris, M. A., Hill, D. P., Issel-Tarver, L., Kasarskis, A., Lewis, S., Matese, J. C., Richardson, J. E., Ringwald, M., Rubin, G. M., and Sherlock, G. (2000). Gene ontology: tool for the unification of biology. The gene ontology consortium. Nat. Genet. 25, 25–29.
Bauer, S., Grossmann, S., Vingron, M., and Robinson, P. N. (2008). Ontologizer 2.0 – a multifunctional tool for GO term enrichment analysis and data exploration. Bioinformatics 24, 1650–1651.
Beissbarth, T., and Speed, T. P. (2004). GOstat: find statistically overrepresented gene ontologies within a group of genes. Bioinformatics 20, 1464–1465.
Benjamini, Y., and Yekutieli, D. (2001). The control of the false discovery rate in multiple testing under dependency. Ann. Stat. 29, 1165–1188.
Boyle, E. I., Weng, S., Gollub, J., Jin, H., Botstein, D., Cherry, J. M., and Sherlock, G. (2004). GO::TermFinder – open source software for accessing gene ontology information and finding significantly enriched gene ontology terms associated with a list of genes. Bioinformatics 20, 3710–3715.
Carbon, S., Ireland, A., Mungall, C. J., Shu, S., Marshall, B., and Lewis, S. (2009). AmiGO: online access to ontology and annotation data. Bioinformatics 25, 288–289.
Conesa, A., Gotz, S., Garcia-Gomez, J. M., Terol, J., Talon, M., and Robles, M. (2005). Blast2GO: a universal tool for annotation, visualization and analysis in functional genomics research. Bioinformatics 21, 3674–3676.
Dennis, G. Jr., Sherman, B. T., Hosack, D. A., Yang, J., Gao, W., Lane, H. C., and Lempicki, R. A. (2003). DAVID: database for annotation, visualization, and integrated discovery. Genome Biol. 4, P3.
Dudoit, S., Yang, Y. H., Callow, M. J., and Speed, T. P. (2002). Statistical methods for identifying differentially expressed genes in replicated cDNA microarray experiments. Stat. Sin. 12, 111–140.
Flicek, P., Aken, B. L., Beal, K., Ballester, B., Caccamo, M., Chen, Y., Clarke, L., Coates, G., Cunningham, F., Cutts, T., Down, T., Dyer, S. C., Eyre, T., Fitzgerald, S., Fernandez-Banet, J., Graf, S., Haider, S., Hammond, M., Holland, R., Howe, K. L., Howe, K., Johnson, N., Jenkinson, A., Kahari, A., Keefe, D., Kokocinski, F., Kulesha, E., Lawson, D., Longden, I., Megy, K., Meidl, P., Overduin, B., Parker, A., Pritchard, B., Prlic, A., Rice, S., Rios, D., Schuster, M., Sealy, I., Slater, G., Smedley, D., Spudich, G., Trevanion, S., Vilella, A. J., Vogel, J., White, S., Wood, M., Birney, E., Cox, T., Curwen, V., Durbin, R., X. Fernandez-Suarez, M., Herrero, J., Hubbard, T. J., Kasprzyk, A., Proctor, G., Smith, J., Ureta-Vidal, A., and Searle, S. (2008). Ensembl 2008. Nucleic Acids Res. 36, D707–D714.
Gentleman, R. C., Carey, V. J., Bates, D. M., Bolstad, B., Dettling, M., Dudoit, S., Ellis, B., Gautier, L., Ge, Y., Gentry, J., Hornik, K., Hothorn, T., Huber, W., Iacus, S., Irizarry, R., Leisch, F., Li, C., Maechler, M., Rossini, A. J., Sawitzki, G., Smith, C., Smyth, G., Tierney, L., Yang, J. Y., and Zhang, J. (2004). Bioconductor: open software development for computational biology and bioinformatics. Genome Biol. 5, R80.
Goeman, J. J., and Mansmann, U. (2008). Multiple testing on the directed acyclic graph of gene ontology. Bioinformatics 24, 537–544.
Grossmann, S., Bauer, S., Robinson, P. N., and Vingron, M. (2007). Improved detection of overrepresentation of Gene-Ontology annotations with parent child analysis. Bioinformatics 23, 3024–3031.
Hosack, D. A., Dennis, G. Jr., Sherman, B. T., Lane, H. C., and Lempicki, R. A. (2003). Identifying biological themes within lists of genes with EASE. Genome Biol. 4, R70.
Huang, W. D., Sherman, B. T., and Lempicki, R. A. (2009). Bioinformatics enrichment tools: paths toward the comprehensive functional analysis of large gene lists. Nucleic Acids Res. 37, 1–13.
Hull, D., Wolstencroft, K., Stevens, R., Goble, C., Pocock, M. R., Li, P., and Oinn, T. (2006). Taverna: a tool for building and running workflows of services. Nucleic Acids Res. 34, W729–W732.
Kanehisa, M., Goto, S., Furumichi, M., Tanabe, M., and Hirakawa, M. (2010). KEGG for representation and analysis of molecular networks involving diseases and drugs. Nucleic Acids Res. 38, D355–D360.
Koutsoudaki, C., Krsek, M., and Rodger, A. (2005). Chemical composition and antibacterial activity of the essential oil and the gum of Pistacia lentiscus Var. chia. J. Agric. Food Chem. 53, 7681–7685.
Lee, H. K., Braynen, W., Keshav, K., and Pavlidis, P. (2005). ErmineJ: tool for functional analysis of gene expression data sets. BMC Bioinformatics 6, 269. doi: 10.1186/1471-2105-6-269
Magkouta, S., Stathopoulos, G. T., Psallidas, I., Papapetropoulos, A., Kolisis, F. N., Roussos, C., and Loutrari, H. (2009). Protective effects of mastic oil from Pistacia lentiscus variation chia against experimental growth of lewis lung carcinoma. Nutr. Cancer 61, 640–648.
Martin, D., Brun, C., Remy, E., Mouren, P., Thieffry, D., and Jacq, B. (2004). GOToolBox: functional analysis of gene datasets based on gene ontology. Genome Biol. 5, R101.
Maynard, S. E., Min, J. Y., Merchan, J., Lim, K. H., Li, J., Mondal, S., Libermann, T. A., Morgan, J. P., Sellke, F. W., Stillman, I. E., Epstein, F. H., Sukhatme, V. P., and Karumanchi, S. A. (2003). Excess placental soluble fms-like tyrosine kinase 1 (sFlt1) may contribute to endothelial dysfunction, hypertension, and proteinuria in preeclampsia. J. Clin. Invest. 111, 649–658.
Moulos, P., Papadodima, O., Chatziioannou, A., Loutrari, H., Roussos, C., and Kolisis, F. N. (2009). A transcriptomic computational analysis of mastic oil-treated Lewis lung carcinomas reveals molecular mechanisms targeting tumor cell growth and survival. BMC Med. Genomics 2, 68. doi: 10.1186/1755-8794-2-68
Osier, M. V., Zhao, H., and Cheung, K. H. (2004). Handling multiple testing while interpreting microarrays with the gene ontology database. BMC Bioinformatics 5, 124. doi: 10.1186/1471-2105-5-124
Safran, M., Dalah, I., Alexander, J., Rosen, N., Iny Stein, T., Shmoish, M., Nativ, N., Bahir, I., Doniger, T., Krug, H., Sirota-Madi, A., Olender, T., Golan, Y., Stelzer, G., Harel, A., and Lancet, D. (2010). GeneCards Version 3: the human gene integrator. Database (Oxford) 2010, baq020.
Soong, T. T. (2004). Fundamentals of Probability and Statistics for Engineers. Hoboken, NJ: John Wiley & Sons.
Subramanian, A., Tamayo, P., Mootha, V. K., Mukherjee, S., Ebert, B. L., Gillette, M. A., Paulovich, A., Pomeroy, S. L., Golub, T. R., Lander, E. S., and Mesirov, J. P. (2005). Gene set enrichment analysis: a knowledge-based approach for interpreting genome-wide expression profiles. Proc. Natl. Acad. Sci. U.S.A. 102, 15545–15550.
Tarca, A. L., Romero, R., and Draghici, S. (2006). Analysis of microarray experiments of gene expression profiling. Am. J. Obstet. Gynecol. 195, 373–388.
Tenta, R., Katopodis, H., Chatziioannou, A., Pilalis, E., Calvo, E., Luu-The, V., Labrie, F., Kolisis, F., and Koutsilieris, M. (2007). Microarray analysis of survival pathways in human PC-3 prostate cancer cells. Cancer Genomics Proteomics 4, 309–318.
Vasudevan, K. M., Gurumurthy, S., and Rangnekar, V. M. (2004). Suppression of PTEN expression by NF-kappa B prevents apoptosis. Mol. Cell Biol. 24, 1007–1021.
Zhang, B., Kirov, S., and Snoddy, J. (2005). WebGestalt: an integrated system for exploring gene sets in various biological contexts. Nucleic Acids Res. 33, W741–W748.
Zheng, Q., and Wang, X. J. (2008). GOEAST: a web-based software toolkit for gene ontology enrichment analysis. Nucleic Acids Res. 36, W358–W363.
Keywords: ontological analysis, pathway analysis, gene enrichment analysis
Citation: Chatziioannou AA and Moulos P (2011) Exploiting statistical methodologies and controlled vocabularies for prioritized functional analysis of genomic experiments: the StRAnGER web application. Front. Neurosci. 5:8. doi: 10.3389/fnins.2011.00008
Received: 27 July 2010;
Accepted: 11 January 2011;
Published online: 26 January 2011.
Edited by:
Radhakrishnan Nagarajan, University of Arkansas for Medical Sciences, USACopyright: © 2011 Chatziioannou and Moulos. This is an open-access article subject to an exclusive license agreement between the authors and Frontiers Media SA, which permits unrestricted use, distribution, and reproduction in any medium, provided the original authors and source are credited.
*Correspondence: Aristotelis A. Chatziioannou, Institute of Biological Research and Biotechnology, National Hellenic Research Foundation, 48 Vassileos Constantinou Avenue, Athens 11635, Greece. e-mail: achatzi@eie.gr