 Ted G. Laderas1,2,3 Nicole A. R. Walter4,5,6 Michael Mooney3 Kristina Vartanian7 Priscila Darakjian5 Kari Buck4,5,6 Christina A. Harrington7 John Belknap4,5,6 Robert Hitzemann4,5,6 Shannon K. McWeeney1,2,3,5,8*
- 1 Oregon Clinical Research and Translational Institute, Oregon Health and Science University, Portland, OR, USA
- 2 Knight Cancer Institute, Oregon Health and Science University, Portland, OR, USA
- 3 Department of Medical Informatics and Clinical Epidemiology, Oregon Health and Science University, Portland, OR, USA
- 4 Portland Veteran Administration Medical Center, Portland, OR, USA
- 5 Portland Alcohol Research Center, Portland, OR, USA
- 6 Department of Behavioral Neuroscience, Oregon Health and Science University, Portland, OR, USA
- 7 Gene Microarray Shared Resource, Oregon Health and Science University, Portland, OR, USA
- 8 Division of Biostatistics, Department of Public Health and Preventive Medicine, Oregon Health and Science University, Portland, OR, USA
Background: With the advent of the GeneChip Exon Arrays, it is now possible to extract “exon-level” expression estimates, allowing for detection of alternative splicing events, one of the primary mechanisms of transcript diversity. In the context of (1) a complex trait use case and (2) a human cerebellum vs. heart comparison on previously validated data, we present a transcript-based statistical model and validation framework to allow detection of alternative exon usage (AEU) between different groups. To illustrate the approach, we detect and confirm differences in exon usage in the two of the most widely studied mouse genetic models (the C57BL/6J and DBA/2J inbred strains) and in a human dataset. Results: We developed a computational framework that consists of probe level annotation mapping and statistical modeling to detect putative AEU events, as well as visualization and alignment with known splice events. We show a dramatic improvement (∼25 fold) in the ability to detect these events using the appropriate annotation and statistical model which is actually specified at the transcript level, as compared with the transcript cluster/gene-level annotation used on the array. An additional component of this workflow is a probe index that allows ranking AEU candidates for validation and can aid in identification of false positives due to single nucleotide polymorphisms. Discussion: Our work highlights the importance of concordance between the functional unit interrogated (e.g., gene, transcripts) and the entity (e.g., exon, probeset) within the statistical model. The framework we present is broadly applicable to other platforms (including RNAseq).
Background
Alternative splicing is viewed as one of the major sources of transcript diversity with estimated rates of alternative splicing ranging between 92 and 94% for all human genes (Modrek and Lee, 2002; Wang et al., 2008) and 74% for multi-exon human genes (Johnson et al., 2003). Kim et al. (2004) calculated that there are on average 3.5 alternative transcripts per human gene and approximately 2.5 alternative transcripts per mouse gene. Additionally, it has been shown that alternate exon usage (AEU) events are especially high in the brain (Ramsköld et al., 2009). Alternative transcripts are often classified by the form of alternative splice event. These events include AEU, retained introns and alternative splicing in conjunction with the use of alternative promoters (McKeown, 1992). AEU can be further subdivided into cassette exons (discrete exons that can be independently included or excluded) and mutually exclusive splicing (which involves the selection of only one from a group of two or more exon variants; Figure 1). In addition, there may be “exon modifications” due to competing 5′ and 3′ splice sites. Clark and Thanaraj (2002) found 60% of alternative splicing events involve cassette and mutually exclusive exons.
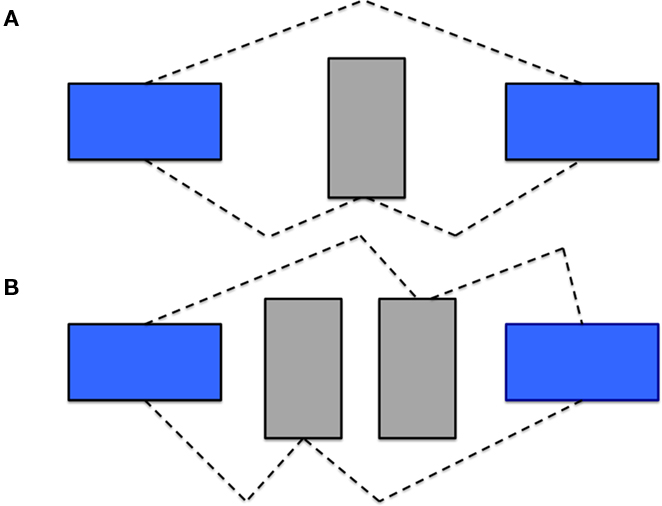
Figure 1. Types of AEU Events. In detecting AEU events, one can identify both (A) cassette exon events and (B) mutually exclusive exon events. The dashed line indicates the transcript structure.
Exon Arrays (e.g., the Affymetrix GeneChip Mouse Exon 1.0 ST Array used in the present studies) make it possible to interrogate the exon structure of the entire transcript (Gardina et al., 2006; Clark et al., 2007) allowing for the detection of AEU events. Utilizing these data, we developed a computational framework to identify and prioritize AEU events. We highlight the importance of concordance among the functional unit interrogated (i.e., gene, transcripts) with the statistical model. This work is presented in the context of two use cases: (1) A complex trait use case, where we wish to detect “differential exon usage” between two of the most commonly used inbred mouse strains, and (2) human tissue data, detecting differential exon usage between a brain region and the heart on previously validated data.
Results
The framework consists of probe level annotation mapping and statistical modeling to detect putative AEU events, as well as visualization and alignment with known splice events (Figure 2). We first present the analysis based on an Ensembl transcript mapping of the probes and then compare this with the Affymetrix gene aggregate model. The results reported here refer only to the “core” probe sets (supported by either RefSeq or GenBank transcripts with complete CDS information), which are approximately 1/6 of the probesets on the GeneChip Mouse Exon 1.0 ST Array.
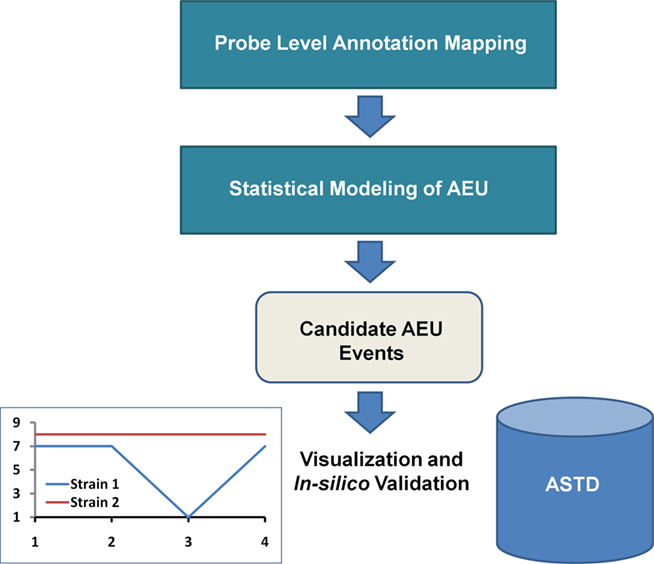
Figure 2. Computational Framework for AEU Detection. Prior to statistical analysis, the probe level data is mapped to a single transcript annotation. After statistical modeling, putative candidates are identified, which can be visualized via interaction plots and alignment with entries of known AEU/splice events from a source such as the alternative splicing and transcript diversity database (ASTD)1.
Use Case 1: Applying the Differential Exon Usage Model on Mouse Brain Data
In our first illustration, we apply the framework to mouse whole-brain samples to detect strain-specific AEUs. A linear model was fit per transcript to the Mouse Exon Array data; the observed transcript level expression values were viewed as being comprised of strain and exon main effects. The interaction between strain and exon allowed us to identify strain-specific differential exon usage (strain-specific alternative splicing/expression). Applying this analysis to all transcripts that have more than one exon (Ensembl transcript annotation), 4614 transcripts were significantly (q < 0.05) differentially expressed between the two strains. Among these, 493 transcripts demonstrated significant exon by strain interactions (Table S1 in Supplementary Material). Additionally, a large number of transcripts had significant differences in exon usage that were not strain specific. This pattern likely reflects AEU common to both strains as well as probeset performance differences across a gene/transcript. Finally, 58 single-mapped exon transcripts (that is, transcripts that were only mapped to one exon using on our mapping based on Ensembl annotation within the core probesets) were detected as significantly differentially expressed (q < 0.05).
Effect size can be dampened when the sample source is heterogeneous (such as with mouse whole brain) because alternative splice variation may be context or location specific. One strategy to adjust for this is to specify a probeset model with no exon aggregation to detect expression differences within exons. This avoids aggregating across exons where probes within the exon may exhibit different expression distributions (due to different sources such as brain regions), potentially canceling out differences due to the actual treatment or group factor of interest. This model is highly sensitive, as it looks for any probeset-level expression difference between the two strains for each transcript and is advised in a scenario where one wants to minimize the false non-discovery rate (FnDR). At a q-value of 0.05, 16,732 transcripts were found to have differential expression at the probeset level between the two strains (Table S2 in Supplementary Material). Additionally for the validation of candidates, we filtered by effect size, choosing only transcripts that had a maximum probeset delta (log expression difference) greater than 1 and no B6/D2 SNPs (see section Use Case 1: Index assessment of putative AEU events), further reducing the set to 1295 transcripts, which mapped to 687 unique genes.
Use Case 1: visualization of Strain-Specific Exon Usage and ΔExon
Interaction plots were utilized to visualize strain-specific exon usage. For those transcripts with a significant exon by strain interaction (q < 0.05), the range of differences between strains in individual exons (Δexon) ranged from 0.329 to 7.055 (on a log2 scale) for the exon-level model. For 33% of the significant exon-level transcripts, the location of the exon with the maximal difference between the strains was the first or last exon.
Use Case 1: Impact of Transcript Definition and Annotation
We compared the results of our statistical modeling for probe mapping based on the Ensembl transcript definition vs. probe mapping based on the Affymetrix Transcript Cluster definition (Figure 3). Affymetrix defines a Transcript cluster as being the aggregate of the multiple transcripts that belong to a gene, so using Transcript cluster as a functional unit corresponds to modeling at the gene level for every potential exon. In contrast, the entity in Ensembl is truly at the single transcript level, and so modeling at the transcript level allows for comparison of individual transcript differences. Biologically, this model is the most realistic as any subsequent validation would involve primers designed at the transcript, not gene, or cluster level.
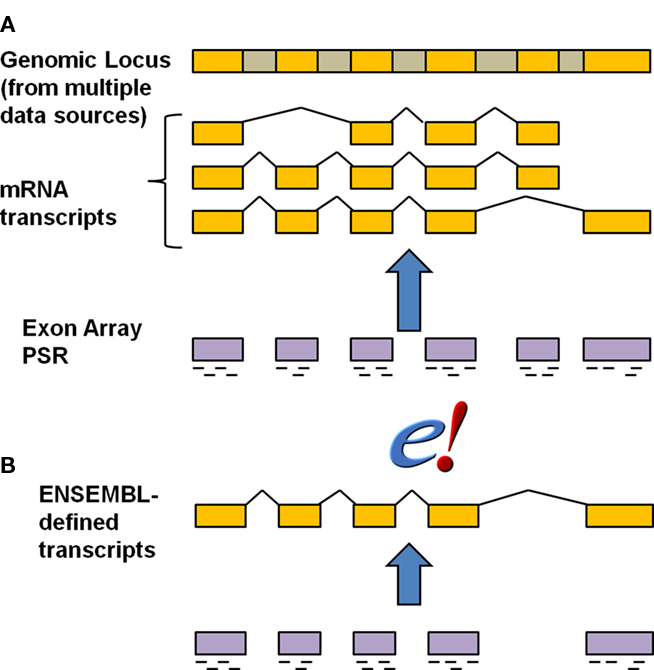
Figure 3. Annotation strategies for exon array probes. The schematic indicates the relationship of gene, transcript and exon structure annotation to probes. Golden regions are exons whereas the gray regions represent introns that are removed during splicing. The short dashes underneath the exon regions for the exon array probe selection region (PSR) indicate individual probes representing that PSR. The default Affymetrix transcript cluster annotation (A) was compared with a mapping of the probes to Ensembl at the individual transcript (B) level. Figure is modified from Affymetrix technical report (Affymetrix).
Strikingly, there was approximately a 25-fold difference in the number of putative alternative transcripts detected. Only 20 AEU events were detected based on the transcript cluster annotation (Table A1 in Appendix). In the Affymetrix Transcript cluster definition, the modeling must be done at the gene level, which can obscure individual transcript differences (Figure 3). Another important consideration is that the Affymetrix annotation is derived from multiple data sources, which can lead to confusion over exon boundaries. Further, there is no notion of exon, only of exon cluster defined from multiple data sources. As a result, numerous examples exist of single exon genes with two exon clusters (Figure A1 in Appendix). Such ambiguities and errors can adversely affect analyses such as those we present here.
Use Case 1: in silico Validation of Exon-Level Model Results Using the EBI ASTD Database
We used in silico validation of our results utilizing the EBI alternative splicing and transcript diversity (ASTD) database2. Of the 493 Ensembl transcripts detected with strain-specific exon usage, 366 (74.2%) had associated splicing events (Table 1). Alignment of the ASTD entries with the interaction plots for each AEU event allows visualization and assessment of concordance (Figure 4).
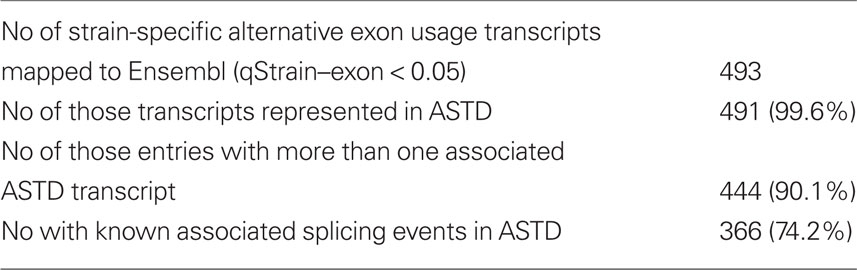
Table 1. Concordance of putative AEU of probeset model with public domain data from ASTD.
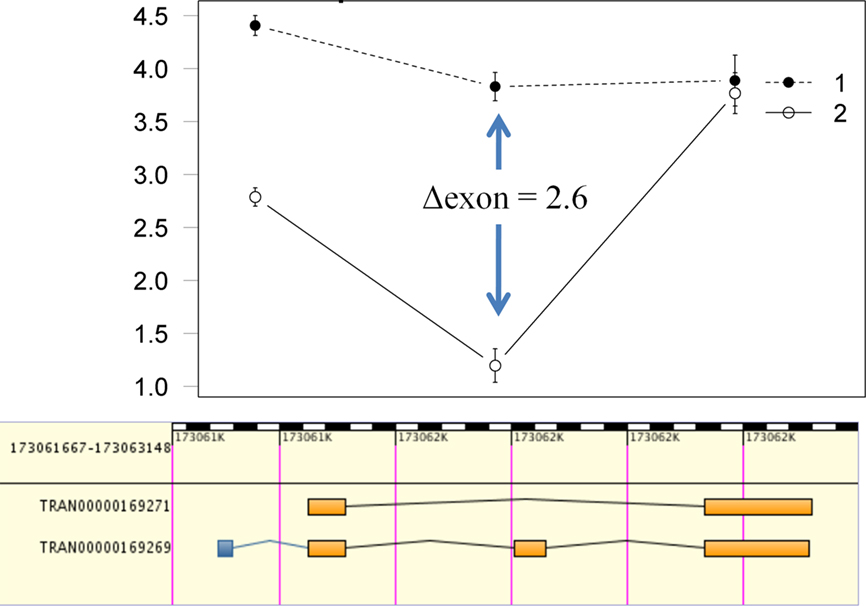
Figure 4. Visualization and concordance of putative alternative splice candidates. Data for putative alternative splice candidates can be visualized via interaction plots with the log2 intensity on the Y axis and Ensembl exons on the X axis. The plots can then be aligned with entries from ASTD to determine if there is concordance between putative alternative exon usage from the computational detection framework and known splice events (such as the cassette exon in this example).
Use Case 1: Index Assessment of Putative AEU Events
All data entered in to the analyses were preprocessed such that any probes impacted by known SNPs between the two strains were removed to avoid spurious hybridization artifacts and the probeset was resummarized with the remaining probes (Walter et al., 2007). As a result of the SNP mask process, an impacted probeset could be entirely removed or have from 1 to 3 probes remaining. A simple probe index was created to easily identify those cases where a putative AEU event was based on only 1 probe and therefore could be considered a lower confidence expression estimate. In these cases the putative AEU event is particularly vulnerable to the effects of cryptic (unknown) SNPs. Consider Psmb6, which had a putative AEU event detected between the two strains. Upon examination, it was determined that the exon with maximal difference had a probe index of 1 (Figure 5). Sequencing confirmed the presence of a cryptic SNP that was impacting the remaining probe. In these cases, the model correctly detected an exon difference in expression intensity between the two strains but the cause is not exon usage differences but the underlying sequence differences impacting the array. The probe index provides an important annotation to aid in ranking and prioritizing candidates for validation.
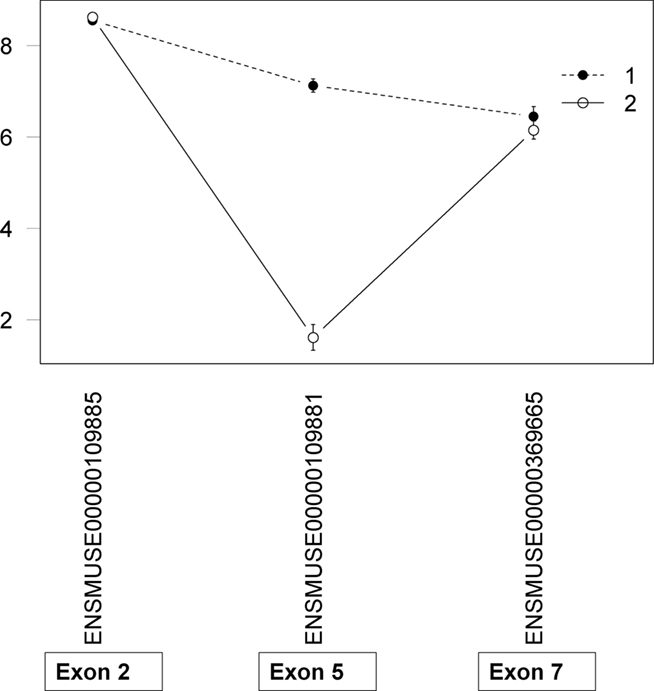
Figure 5. Assessment of putative AEUs for cryptic SNPs. The probe index is simply the number of probes remaining in the probeset after the application of the SNP mask. In this example, there was a known SNP in Exon 5 of Psmb6, which was found in three of the four probes within the probeset. The single remaining probe showed the maximal exon usage difference between strains which in turn led to a significant exon x strain interaction. Sequencing revealed an unknown SNP (cryptic) within the probe.
Validation of AEU in Use Case 1 Using Real-Time Quantitative PCR
Three candidates were selected from the probeset-level model results for quantitative PCR (qPCR) validation: Atp1a2, Kcnj9, and Adam33 (Figure 6; Figures A2 and A3 in Appendix). All three candidates showed differential exon expression between the B6 and D2 strains for probesets that showed potential exon expression differences in the interaction plot compared to other probesets in the transcript that did not. It should be noted that Kcnj9 (Figure 6) is an interesting case that did not show up as DE with the exon-level model, due to four probesets (4879943, 5079913, 4465532, and 4583369) that were not DE, but one that is (4485754). As discussed above, the actual expression difference can be washed out by aggregating at the exon level when the source material is heterogeneous. This reiterates the importance of specifying the model carefully.
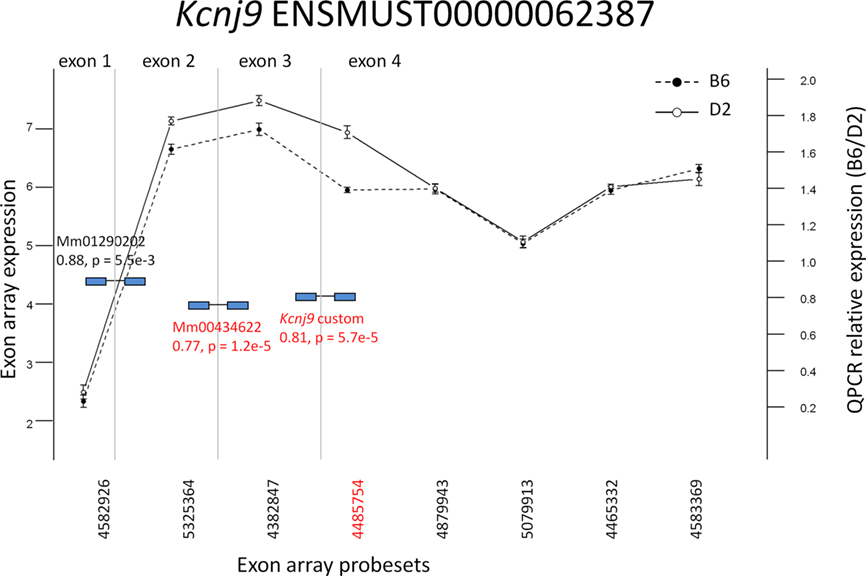
Figure 6. Exon array expression at probeset-level and confirmation by qPCR. Exon array probesets indicated in red are the largest exon delta for a transcript detected as significant by the algorithm for (q < 0.05) strain by probeset interaction in whole brain. TaqMan (Applied Biosystems, Foster City, CA, USA) qPCR probes spanning exons are indicated in blue. Those with p < 0.005 are indicated in red as differentially expressed. The vertical lines indicate exon boundaries and are not drawn to scale.
Use Case 2: Validation of AEU in Humans
In our second use case, we examine tissue-specific differences that generally have much larger effect sizes. We utilized our model to assess tissue-specific AEU using a Human Tissue dataset using the GeneChip Human Exon 1.0 ST Array3. This dataset consists of exon expression data for 11 brain regions and peripheral organ tissues. Clark et al. (2007) identified brain-specific AEU events by comparing six brain regions to nine other organ systems in the body. However, in the publicly available dataset, only the cerebellum samples were made available to compare with the other organ tissues. In order to identify brain-specific AEU events, we compared cerebellum tissue to heart tissue as the closest match to the original comparison of brain tissue vs. other organ tissue using the Splicing Index. We utilized the Xmap Exon Array/Ensembl database4 mapping in modeling transcript behavior by building a bridge between our package and the xmapcore Bioconductor package and database (Yates et al., 2008). We recognize that the results will not be identical to that in the original paper as (1) it is based on a subset of the total dataset (i.e., three heart and three cerebellum samples from the total dataset of 18 brain and 27 other organ samples), leading to decreased power and (2) the comparison of cerebellum to heart is not representative of all possible AEU events between brain tissue and other organ tissues. Using our algorithm on the reduced dataset, we detected 7442 potential AEU events. Thirty six events were previously confirmed as differentially expressed between brain tissue and other organ tissue by RT-PCR in Clark et al. (2007). Our method, despite the incomplete comparison, confirmed possible AEU events (significant strain by tissue interaction) in the heart/cerebellum comparison for 16/36 (44%) of these confirms. Further examination of the interaction plots shows a large expression difference at the RT-PCR confirmed cassette exon events, showing the utility of our model to detect AEU events in tissue comparisons (Figure 7).
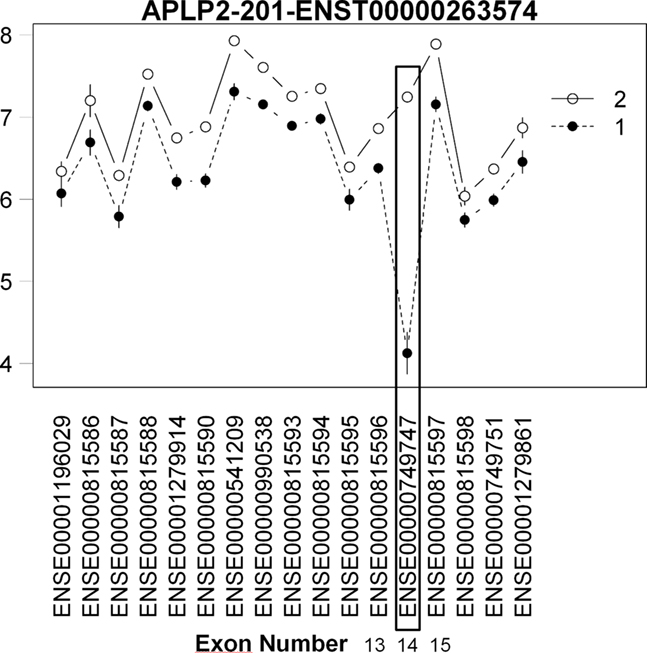
Figure 7. Plot of brain specific AEU event in human tissue dataset. Interaction plot of brain specific AEU event in human tissue dataset. Note that expression in exon 14 is large for group 2 (brain) while for heart (group 1), the expression is much lower. This cassette exon event has been confirmed by RT-PCR in Clark et al.’s (2007) study.
Discussion
We have presented a computational framework that allows for statistical modeling at the transcript level in order to examine exon-level differences in expression between groups of interest, as well as a confidence index to aid in validation. Importantly, it is open source and integrated into the R libraries for greater functionality, and we explicitly incorporate the annotation mapping and transcript structure into the package and the model. This extends the excellent work of Su et al. (2008) in which they modeled both strain and gender differences. An important difference to point out between the two models is that we incorporate the exon structure explicitly in ours to allow detection of strain-specific alternative exon usage using data from the entire transcript. In the Su et al. (2008) paper, they fit the gene and exon data to the model individually. Another statistical method, FIRMAGene, utilizes residuals from probe level modeling from the Robust Multichip Analysis normalization as a method of detecting AEU events (Purdom et al., 2008). Chains of adjacent residuals that deviate from 0 are taken as evidence of AEU events. FIRMAGene differs from our model in at least two respects. First of all, identification of candidate genes is done on a per-sample level, whereas our model allows for the explicit comparison of groups such as tissues or strains on both the exon-level and transcript level. Secondly, FIRMAGene does not distinguish between residuals that are due to alternative splicing from residuals that are the result of poor probe design, whereas in our methodology poor probe design is apparent when comparing the expression of exons across groups in the context of the probe index.
The computational framework provided here allows for detection of differential AEU events between two groups (such as inbred strains or tissues). It is critical to consider how the probe sets are mapped to annotation, particularly when one is attempting to model transcript level diversity. Different strategies in probe annotation and gene vs. transcript structure can lead to dramatic differences in detection and can impact the ability to interpret the results. In addition, the presence of underlying heterogeneity in the source material can guide the choice of exon vs. probeset models.
Visualization and integration with known splice/alternative transcript data can allow assessment of putative strain-specific exon usage. Alignment with databases such as ASTD can provide a measure of in silico validation for AEU events. We note that our approach will identify an AEU but is not able to distinguish between different types of AEU events. This can be easily incorporated into the model framework and is an area of future research. However, given that much of the transcript diversity is still not well understood, experimental confirmation is a necessary step for the validation of novel events. However, it is important to extract as much information from the data as possible with regard to data confidence to guide evaluation of putative AEUs.
It has been noted that the impact of SNPs due to strain differences from the target sequence can be reduced by SNP masking (Walter et al., 2007), and with the recent availability of the complete B6 vs. D2 SNP list5, the confounding effects of the SNPs can been greatly reduced (at the time of this manuscript, the Sanger data was still under embargo and not utilized for this analysis). However, a reduced probe number per probe set can decrease the power to detect events. When using a SNP mask, it is essential to capture the number of probes remaining within a probeset that were used to detect the exon signal. We utilize this annotation (the probe index) to aid in our assessment of putative candidates. Our current opinion is that when only 1 probe remains and when apparent significant differences in expression are detected, the results should be viewed very cautiously. An issue in part related to the application of a SNP mask is that not all of the signal estimates are independent. In smaller exons, probes often overlap, effectively reducing the number of independent probes and allowing for a single SNP to impact multiple probes. Therefore, all candidate strain-dependent AEU events need to be independently confirmed. We note that this issue is not unique to mouse but can occur in any population where naturally occurring polymorphisms could impact hybridization (such as human). In addition to the issue of probe independence, probe quality is a potential concern. We detected significant strain independent exon effects that could be due to probe quality, exon shut-off or annotation issues. Low level analysis is crucial for accurate detection of putative AEU events. Recent work by Kapur et al. (2007) utilized a probe selection strategy to identify probes with highly correlated intensities across multiple samples to improve gene-level expression estimates.
In addition, Purdom et al. (2008), developed an approach that also emphasizes low level analysis to evaluate levels of alternative splicing in individual samples without replication at the gene/transcript cluster level. Similar procedures could be utilized for individual transcript level estimates. We recognize that with the advent of RNA-seq, probe-based issues will no longer be a concern. Our workflow was utilized by Bottomly (2010) to detect alternative exon usage from RNAseq, highlighting the generalizability of our approach.
Methods
Sample Preparation
Naïve, adult, male C57BL/6J (B6; n = 12) and DBA/2J (D2; n = 12) strain mice were euthanized by cervical dislocation, the whole brain was rapidly removed and flash-frozen in liquid nitrogen. Total RNA was isolated using TRIzol® reagent (Invitrogen, Carlsbad, CA, USA) in a one-step guanidine isothiocyanate procedure. For microarray analyses, the extracted RNA was purified using RNeasy (Qiagen, Valencia, CA, USA). RNA samples were evaluated by ultraviolet spectroscopy for purity and concentration.
Affymetrix Exon Arrays
Samples containing at least 10 μg of total RNA were sent to the Oregon Health and Science University Gene Microarray Shared Resource facility for further quality assessment using an Agilent 2100 BioAnalyzer and for GeneChip array analysis. Because two samples were scanned following a recalibration of the scanner, the dataset reported here includes whole-brain samples from 22 individual mice (10 B6 and 12 D2). After ribosomal RNA reduction, amplification, and labeling, whole-brain total RNA samples were each hybridized to AffymetrixGeneChip® Mouse Exon 1.0 ST Array (24 arrays total). The procedures used follow the Affymetrix Whole Transcript Sense Target Labeling Assay, rev3, protocol. Additional details can be found at https://www.affymetrix.com/support/downloads/manuals/wt_sensetarget_label_manual.pdf. (Affymetrix, Inc., 2005).
Low Level Analysis
All CEL files were processed in the Affy package (version 1.12.2) in the statistical programming environment R under the Bioconductor package (R version 2.6.06, Bioconductor 2.17). All data was RMA [11] background corrected and normalized. Data were summarized at the probeset level using the median polish. The Mouseexonpmcdf annotation package was utilized for summarization at the probeset-level8. It should be noted that the control probesets Affymetrix uses for background estimation are not included in this mapping.
SNP Masking
As in Walter et al. (2007), the data were SNP masked at the probe level. Prior to the summarization step at the probeset level described above, individual probes were masked (expression value replaced by NA) if there was a known SNP within the boundaries of the probe. The SNP mask was built by comparing the Affymetrix design time annotation files (GFF) files (based on NCBI mouse build 36) for each chromosome to known SNP locations in DBSNP. A total of 12,101 probesets were masked to some degree, representing 5.4% of the core probesets. As the SNP mask removes probes from analysis, a probe index was created to determine how many probes/probesets remained in the analysis. The full, masked dataset is available on GEO under accession number GSE27282.
Data Filtering
The Affymetrix GeneChip® Mouse Exon 1.0 ST Array (Affymetrix, Santa Clara, CA, USA) is a single array with over 4.5 million unique 25-mer oligonucleotide features constituting approximately 1.2 million probe sets. To avoid signals influenced by non-specific hybridization, we based our analysis solely on the probesets with unique hybridization targets. Based on recent work by Robinson and Speed (2009) the data was further filtered such that only probe sets annotated as “core” were included for the exon-level model of Use Case 1. Core annotated probesets are supported by either RefSeq or GenBank transcripts with complete CDS information.
Annotation Mapping
All probes were mapped to transcripts using both the Affymetrix transcript cluster annotation and Ensembl transcript annotation. The Affymetrix transcript cluster is an aggregate of overlapping transcript information from a variety of annotation sources that roughly corresponds to the gene level (Affymetrix). For the Ensembl annotation, probes were mapped to an Ensembl transcript ID and Exon ID if they had any overlap within the boundaries of these entities. Elimination of probesets that were not completely contained within an Ensembl Exon produced minimal effects on the number of significant transcripts (Table A3 in Appendix). It should be noted that another mapping database for Mouse Exon entities exists: XMap9. This mapping was utilized for the probeset-level model, and the Human use case, as it maps beyond the core probesets, increasing our sensitivity to detecting possible splicing events in the 3′ UTR region (Yates et al., 2008). However, the XMap implementation also maps intronic regions and is not available as an easily portable Bioconductor database package. Our R package is also compatible with XMap, extending its utility to Human and Rat Exon arrays in addition to Mouse. The Ensembl mapping allowed us to utilize a single transcript level structure for the statistical modeling.
Data Stratification
It was noted that the transcript structure and probeset distribution were diverse. Transcripts were therefore classified into one of three categories. Category A transcripts were single exon transcripts. Category B transcripts were transcripts with multiple exons but only a single probeset per exon. Category C transcripts were transcripts with multiple exons and multiple probesets per exon. Each category was analyzed separately.
Statistical Modeling
For transcripts in category A, differential expression was determined using the Bioconductor multtest package. In these cases, the only detection that can be made is that of a strain difference. A two factor (strain, exon) linear model was fit to each transcript in Category B and C. This allowed detection of the main effect of strain (differential expression between strains as in Category A), the main effect of exon (differential expression levels among the exons) and the interaction (differential exon usage between strains). The model can be formally written as

Yijk = response (transcript expression)
μ = average expression of a transcript
α = strain effect (Between subjects factor) where j = 1–2 different strains
β = exon effect (within subjects factor) where k = 1 … x different exons in the transcript
π = individual mouse/subject effect (random subjects factor which is nested in strain)
αβ = interaction representing differential expression of exons between different strains
ε = error term.
For the purposes of detecting alternative splicing, the interaction term was of particular interest. To address the issue of multiple testing, all p-values were false discovery rate (FDR) adjusted using the q-value Bioconductor package from Storey (2002). The probeset-level model is identical to the exon-level model, except that the entity β is not Exon, but probeset, and the interaction of interest αβ represents probeset by strain. It should be noted that because the probesets are not aggregated, this model is highly sensitive to any possible changes in expression between the two strains.
Implementation of Software Packages
The statistical modeling routines used above have been integrated into two R/Bioconductor software packages: ExonModelStrain, which enables users to run this strain-specific exon modeling. The visualization of the significant interactions to allow rapid identification of AEUs of interest (and for comparison with other databases such as ASTD), is in the function PlotExonResults() within the ExonModelStrain package. This package is dependent on the exon probeset to Ensembl mapping, which is available as a separate SQLite based database called mouseexonensembl.db, or the exonmap Bioconductor package with a separate XMap install. Both of these packages are available at http://www.ohsu.edu/parc/exon/exon_R_packages.htm and will be contributed to the Bioconductor project10.
Quantitative Real-Time PCR
Quantitative PCR was performed using a standard TaqMan protocol on an ABI Prism7500 thermal cycler using 2-Step PCR Master Mix (Applied Biosystems, Foster City, CA, USA) as previously described in Kozell et al. (2009). Briefly, naïve D2 and B6 mice (adult males) were euthanized by cervical dislocation (n = 11 per strain), the brains were cut in half sagitally, flash-frozen in liquid nitrogen and stored at −80°C. Total RNA was reverse transcribed using random hexamers as per protocol (TaqMan Reverse Transcription Kit, Applied Biosystems, Foster City, CA, USA).
Because target probe sequence information for TaqMan assays is proprietary, amplicon sequences were approximated using the Applied Biosystems coordinates, which correspond to the amplicon’s center nucleotide and take into account the provided amplicon length. All primer and target probe sequences were aligned with SNP annotation. For each candidate, relative expression was measured using validated gene-specific, B6/D2 SNP-free TaqMan assays (Kcnj9: Mm01290202; Atp1a2: Mm00617899; Adam33: Mm00459691, Mm00459709). Additionally, a custom TaqMan probe was employed for Kcnj9 (forward primer: GTCATTCTCGAGGGCATGGT, reverse primer: CACCAGGTACGAGCTTCGA, reporter sequence: CCACGGGAATGACG) and Atp1a2 (forward primer: ATTGAGGTCTCCCTGAGTAGGTATC, reverse: CACCTCAGTGCACAGTGTCT, reporter: CTGCCCACCACATGCA). The comparative (ΔΔCt) method (Livak and Schmittgen, 2001) was used for relative quantification analyses.
Author’s Contributions
Ted Laderas analyzed and mapped the Exon Array data, developed the software packages, and contributed to the draft of the manuscript. Nicole A. R. Walter did the confirming qPCR studies, contributed to the design of the study, and contributed to the draft of the manuscript. Michael Mooney performed the in silico validation with the ASTD database, contributed to the design of the software package, and contributed to the draft of the manuscript. Priscila Darakjian assisted with the annotation mapping and contributed to the draft of the manuscript. Kristina Vartanian and Christina A Harrington consulted on the experimental design, processed the RNA and hybridized the Exon Arrays and contributed to the draft of the manuscript. Kari Buck, John Belknap, and Robert Hitzemann conceived of the study, participated in its design and coordination, and contributed to the draft of the manuscript. Shannon McWeeney was involved in the conception, design, and coordination of the study and the analysis, developed the initial models to be implemented and drafted the manuscript. All authors read and approved the final manuscript.
Conflict of Interest Statement
The authors declare that the research was conducted in the absence of any commercial or financial relationships that could be construed as a potential conflict of interest.
Acknowledgments
Supported by US National Institutes of Health grants AA010760, AA11034, AA13484, AA011114, DA05228, and MH51372, Department of Veterans Affairs Merit Awards, Affymetrix, and National Library of Medicine Biomedical Informatics Fellowships to M. Mooney (LM007088) and Ted Laderas.
Supplementary Material
The Supplementary Material for this article can be found online at http://www.frontiersin.org/neurogenomics/10.3389/fnins.2011.00069/abstract
Table S1|Putative strain-specific AEU candidates identified by transcript-based statistical modeling and annotation of exon-level model. qStrain/exon indicates the q-value for the strain–exon interaction. SNP-affected indicates that at least one probeset in the transcript was affected by a SNP in the masking procedure. ASTD event indicates a transcript was involved in a comparison of at least one AEU event. Single-mapped exon transcripts (that is, transcripts that only contained one exon in core and in our mapping) are also provided. (please see attached file Supplemental_Table 1.xls)
Table S2|Putative strain-specific AEU candidates identified by probeset-level model. Results are similar to Table S1 in Supplementary Material, except that the interaction term of interest is qStrain. Probeset, and that the model includes extended and full probesets.
Footnotes
- ^http://www.ebi.ac.uk/astd/
- ^http://www.ebi.ac.uk/astd/
- ^http://www.affymetrix.com/support/technical/sample_data/exon_array_data.affx
- ^http://xmap.picr.man.ac.uk/download/
- ^www.sanger.ac.uk/resources/mouse/genomes/
- ^http://www.r-project.org
- ^http://www.bioconductor.org
- ^http://xmap.picr.man.ac.uk/download/
- ^Available at http://xmap.picr.man.ac.uk/download/
- ^http://www.bioconductor.org
References
Affymetrix Inc. (2005). Technical Note: Gene Chip Exon Array Design. Available at: http://media.affymetrix.com/support/technical/technotes/exon_array_design_technote.pdf
Bottomly, D. (2010). An in Silico Assessment of Alternatively Spliced Isoforms in the Mouse Brain Using RNA-SEQ. Portland, OR: Oregon Health and Science University.
Clark, F., and Thanaraj, T A. (2002). Categorization and characterization of transcript-confirmed constitutively and alternatively spliced introns and exons from human. Hum. Mol. Genet. 11, 451–464.
Clark, T. A., Schweitzer, A. C., Chen, T. X., Staples, M. K., Lu, G., Wang, H., Williams, A., and Blume, J. E. (2007). Discovery of tissue-specific exons using comprehensive human exon microarrays. Genome Biol. 8, R64.
Gardina, P. J., Clark, T. A., Shimada, B., Staples, M. K., Yang, Q., Veitch, J., Schweitzer, A., Awad, T., Sugnet, C., Dee, S., Davies, C., Williams, A., and Turpaz, Y. (2006). Alternative splicing and differential gene expression in colon cancer detected by a whole genome exon array. BMC Genomics 7, 325. doi: 10.1186/1471-2164-7-325
Johnson, J. M., Castle, J., Garrett-Engele, P., Kan, Z., Loerch, P. M., Armour, C. D., Santos, R., Schadt, E. E., Stoughton, R., and Shoemaker, D. D. (2003). Genome-wide survey of human alternative pre-mRNA splicing with exon junction microarrays. Science 302, 2141–2144.
Kapur, K., Xing, Y., Ouyang, Z., and Wong, W. H. (2007). Exon arrays provide accurate assessments of gene expression. Genome Biol. 8, R82.
Kim, H., Klein, R., Majewski, J., and Ott, J. (2004). Estimating rates of alternative splicing in mammals and invertebrates. Nat. Genet. 36, 915–916.
Kozell, L. B., Walter, N. A. R., Milner, L. C., Wickman, K., and Buck, K. J. (2009). Mapping a barbiturate withdrawal locus to a 0.44 Mb interval and analysis of a novel null mutant identify a role for Kcnj9 (GIRK3) in withdrawal from pentobarbital, zolpidem, and ethanol. J. Neurosci. 29, 11662–11673.
Livak, K. J., and Schmittgen, T. D. (2001). Analysis of relative gene expression data using real-time quantitative PCR and the 2(-Delta Delta C(T)) method. Methods 25, 402–408.
Purdom, E., Simpson, K. M., Robinson, M. D., Conboy, J. G., Lapuk, A. V., and Speed, T. P. (2008). FIRMA: a method for detection of alternative splicing from exon array data. Bioinformatics 24, 1707–1714.
Ramsköld, D., Wang, E. T., Burge, C. B., and Sandberg, R. (2009). An abundance of ubiquitously expressed genes revealed by tissue transcriptome sequence data. PLoS Comput. Biol. 5, e1000598. doi: 10.1371/journal.pcbi.1000598
Robinson, M., and Speed, T. (2009). Differential splicing using whole-transcript microarrays. BMC Bioinformatics 10, 156. doi: 10.1186/1471-2105-10-156
Storey, J. (2002). A direct approach to false discovery rates. J. R. Stat. Soc. B Stat. Methodol. 64, 479–498.
Su, W.-L., Barmak, M., Debraj, G. T., Stephen, E., Jyoti, S., Amit, K., Archie, R., Eric, S., Jason, J., and John, C. (2008). Exon and junction microarrays detect widespread mouse strain- and sex-bias expression differences. BMC Genomics 9, 273. doi: 10.1186/1471-2164-9-273
Walter, N. A., McWeeney, S. K., Peters, S. T., Belknap, J. K., Hitzemann, R., and Buck, K. J. (2007). SNPs matter: impact on detection of differential expression. Nat. Methods 4, 679–680.
Wang, E. T., Sandberg, R., Luo, S., Khrebtukova, I., Zhang, L., Mayr, C., Kingsmore, S. F., Schroth, G. P., and Burge, C. B. (2008). Alternative isoform regulation in human tissue transcriptomes. Nature 456, 470–476.
Keywords: alternative splicing, exon array
Citation: Laderas TG, Walter NAR, Mooney M, Vartanian K, Darakjian P, Buck K, Harrington CA, Belknap J, Hitzemann R and McWeeney SK (2011) Computational detection of alternative exon usage . Front. Neurosci. 5:69. doi: 10.3389/fnins.2011.00069
Received: 04 March 2010;
Accepted: 27 April 2011;
Published online: 13 May 2011.
Edited by:
Edward S. Lein, Allen Institute for Brain Science, USAReviewed by:
Daniel Geschwind, University of California Los Angeles School of Medicine, USAEdward S. Lein, Allen Institute for Brain Science, USA
Copyright: © 2011 Laderas, Walter, Mooney, Vartanian, Darakjian, Buck, Harrington, Belknap, Hitzemann and McWeeney. This is an open-access article subject to a non-exclusive license between the authors and Frontiers Media SA, which permits use, distribution and reproduction in other forums, provided the original authors and source are credited and other Frontiers conditions are complied with.
*Correspondence: Shannon K. McWeeney, Knight Cancer Institute, Oregon Health and Science University, Mail Code CR145, 3181 SW Sam Jackson Park Road, Portland, OR 97239-3098, USA. e-mail: mcweeney@ohsu.edu