
- 1 Biobehavioral Medicine in Oncology Program, University of Pittsburgh Cancer Institute, Pittsburgh, PA, USA
- 2 Department of Medicine: Division of Gastroenterology, Hepatology, and Nutrition, University of Pittsburgh School of Medicine, Pittsburgh, PA, USA
- 3 Department of Anesthesiology, University of Pittsburgh School of Medicine, Pittsburgh, PA, USA
- 4 Center for Neuroscience, University of Pittsburgh, Pittsburgh, PA, USA
- 5 AgroSup Dijon, Dijon, France
- 6 Human Behavior Laboratory, University of Iceland, Reykjavik, Iceland
Nausea and vomiting are common symptoms in patients with many diseases, including cancer and its treatments. Although the neurological basis of vomiting is reasonably well known, an understanding of the physiology of nausea is lacking. The primary barrier to mechanistic research on the nausea system is the lack of an animal model. Indeed investigating the effects of anti-nausea drugs in pre-clinical models is difficult because the primary readout is often emesis. It is known that animals show a behavioral profile of sickness, associated with reduced feeding and movement, and possibly these general measures are signs of nausea. Studies attempting to relate the occurrence of additional behaviors to emesis have produced mixed results. Here we applied a statistical method, temporal pattern (t-pattern) analysis, to determine patterns of behavior associated with emesis. Musk shrews were injected with the chemotherapy agent cisplatin (a gold standard in emesis research) to induce acute (<24 h) and delayed (>24 h) emesis. Emesis and other behaviors were coded and tracked from video files. T-pattern analysis revealed hundreds of non-random patterns of behavior associated with emesis, including sniffing, changes in body contraction, and locomotion. There was little evidence that locomotion was inhibited by the occurrence of emesis. Eating, drinking, and other larger body movements including rearing, grooming, and body rotation, were significantly less common in emesis-related behavioral patterns in real versus randomized data. These results lend preliminary evidence for the expression of emesis-related behavioral patterns, including reduced ingestive behavior, grooming, and exploratory behaviors. In summary, this statistical approach to behavioral analysis in a pre-clinical emesis research model could be used to assess the more global effects and limitations of drugs used to control nausea and its potential correlates, including reduced feeding and activity levels.
Introduction
Cytotoxic chemotherapy agents used in cancer treatment (e.g., cisplatin) have multiple adverse side effects, including nausea, vomiting, anorexia, and fatigue, which impose a severe physical and emotional burden on cancer patients (Hainsworth and Hesketh, 1992; Hofman et al., 2007; Hesketh, 2008; Kaley and Deangelis, 2009). Some of these symptoms appear as symptom clusters (Dodd et al., 2004; Miaskowski et al., 2004, 2007; Cleeland, 2007; Fan et al., 2007; Henoch et al., 2009; Kirkova et al., 2010) and nausea and vomiting comprise the most consistent symptom cluster in cancer research (Fan et al., 2007). Even with the use of standard anti-emetics for highly emetic chemotherapy, approximately 50 and 25% of patients still experience nausea and vomiting, respectively (Campos et al., 2001; Chawla et al., 2003; Warr et al., 2005). Anti-emetic drugs control vomiting better than nausea and a primary focus of current research is to understand the biology of nausea (Sanger and Andrews, 2006; Olver et al., 2011).
Nausea, as a subjective experience, cannot be directly measured in non-human animals. Surrogate markers of nausea in animal studies have included conditioned flavor aversion, pica, and physiological measures. These approaches have major limitations, including the need for specific testing protocols, lack of face validity, and the need for invasive procedures. An alternative approach is the assessment of behavioral indices of sickness as a potential measure of nausea. In theory, animals should show behavioral changes that correlate with the level of nausea or malaise (Kent et al., 1992). Vomiting is an obvious indication of sickness but there might also be behavioral patterns leading up to and/or following an emetic episode. In this way the occurrence of vomiting could be used as an unequivocal anchor for evaluating the behavioral changes that occur with sickness, malaise, and potentially nausea. Reports suggest the existence of some species specific emesis-related behavioral responses. For example, lip-licking, backward walking, and burrowing behaviors have been observed in association with emesis in ferrets (Bermudez et al., 1988; Watson et al., 1995). However, there has been little effort focused on a quantitative analysis of the patterns of behavior related to emesis.
In the current studies we tested the hypothesis that emesis is associated with behavioral patterns of reduced feeding and movement, i.e., a profile of sickness or nausea. To test for behavioral patterns we employed temporal pattern (t-pattern) analysis (Magnusson, 2000) to determine statistically significant relationships between emetic events and other behaviors. T-pattern analysis can assess subtle patterns of behavior that can be difficult to discern by other methods (Magnusson, 2000; Bonasera et al., 2008; Casarrubea et al., 2010a). For example, there could be little change in the total occurrence of a behavior but its temporal relationship to other behaviors might be affected. To create the time-stamped event data needed for these analyses, we acquired digital video of behaving animals, manually coded behaviors (e.g., emesis, eating, drinking), and automatically tracked body movement with computer software. In these experiments we injected musk shrews with the chemotherapy agent cisplatin to induce emesis. The musk shrew (Suncus murinus) is a well established small animal model (mouse-sized) used for emesis research (e.g., Andrews et al., 2000; Sam et al., 2003; Chan et al., 2007; De Jonghe and Horn, 2009; Percie Du Sert et al., 2010a; Horn et al., 2010b). The chemotherapy agent cisplatin was used as the emetic stimulus because it produces a potent emetic response in animal studies (Sam et al., 2003; Warr et al., 2005; Percie Du Sert et al., 2010b) and is associated with a high level of nausea and vomiting in humans (Warr et al., 2005).
Materials and Methods
Subjects
The subjects were 16 adult musk shrews (>162 days of age) with body weights of 56–82 g for males and 40–49 g for females. We have previously reported the emesis patterns from these animals using a machine learning approach (Huang et al., 2011). Animals were derived from breeding stock acquired from Prof. John Rudd, the Chinese University of Hong Kong (a strain originating from Taiwan) and housed individually in clear plastic cages (28 cm × 17 cm × 12 cm), with a filtered air supply, using a 12 h light/12 h dark cycle (0700–1900 hours light period), and had free access to food and water. Food consisted of a mixture of 75% Purina Cat Chow Complete Formula and 25% Complete Gro-Fur mink food pellets (Rissman et al., 1988). All experiments were approved by the University of Pittsburgh Institutional Animal Care and Use Committee.
Procedures for Experiments 1 (2 h) and 2 (72 h)
In Experiment 1, at ∼1000 h 10 animals (5 male and 5 female) were injected with cisplatin (20 mg/kg, i.p.) and placed in a round chamber (Figure 1) for ∼2 h under an animal transfer hood where behavior was video-recorded (Sony Handycam; DCR-SR300). Two animals were run simultaneously on each test day. Videos were stored on the internal hard drive of the camera. White lab paper was used on the bottom of each chamber to produce a high contrast with the dark coat of the musk shrew. One of the cameras stopped at 1 h and 50 min because of power loss; however, the other four experiments (from animals showing emesis) were ∼2 h and 7 min each and the average time included in the subsequent analysis was 2.1 h.
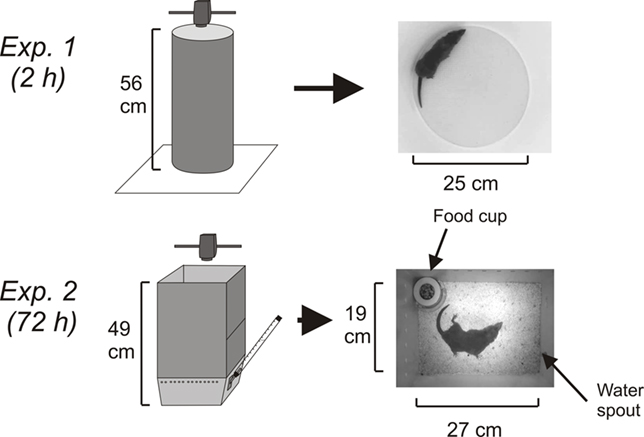
Figure 1. Experimental chambers and camera position. In Experiment 1 (2 h), the circular test chamber was positioned on white laboratory paper. In Experiment 2 (72 h), a rectangular white acrylic enclosure was positioned on top of a test cage with food and water. In both experiments the camera was placed 61 cm above the floor of the test area.
In Experiment 2, the behavior of six male musk shrews was video-recorded for 96 h (24 h before and 72 h after injection of 30 mg/kg of cisplatin, i.p.). A camera (Sony, DCR-SR300; internal sensor and IR light for recording dark phase activity) was placed above the cage and attached to a computer via a USB port (USB 2.0 Video Capture Cable; StarTech.com). Only one animal was tested each week (4 days in the observation chamber). The videos were captured using Movie Maker software (Microsoft). At ∼945 h animals were transferred to the test cages (Figure 1), which were kept under an animal transfer hood. One day after the acquisition day (baseline), animals were injected with cisplatin (∼945 h). The cage contained a food cup, and water was provided from a sipper tube attached to a graduated cylinder (Figure 1). Each morning at ∼945 h, the musk shrews were weighed and food and water containers were checked and refilled. Because of the need to make these measurements, on the baseline day and Days 1 and 2 post-injection there was an average of 16 min less video time for each 24 h segment. One of the baseline days (the 24 h before cisplatin injection) from one animal was recorded for only 14 h due to a software crash (these data are not included in t-pattern analysis).
Manual Coding of Emesis Using Computer Software
Videos (MPEG-2) were imported into behavioral coding software (The Observer XT 10.1; Noldus Information Technology, www.noldus.com, The Netherlands). Emetic episodes and other behaviors were recorded manually with keystrokes by a trained observer viewing a computer monitor (Table 1). A second trained observer validated the occurrence of all emetic episodes and random sections of data for other behaviors. An emetic episode was recognized as a sequence of contractions of the abdomen and head movements (retching). An emetic episode can occur with or without the expulsion of gastric contents (Horn et al., 2010b) and, therefore, episodes without expulsion were also counted. The Observer software allows users to slow down, reverse, and check the coding of behaviors stored in a computer file containing the codes and timestamps.
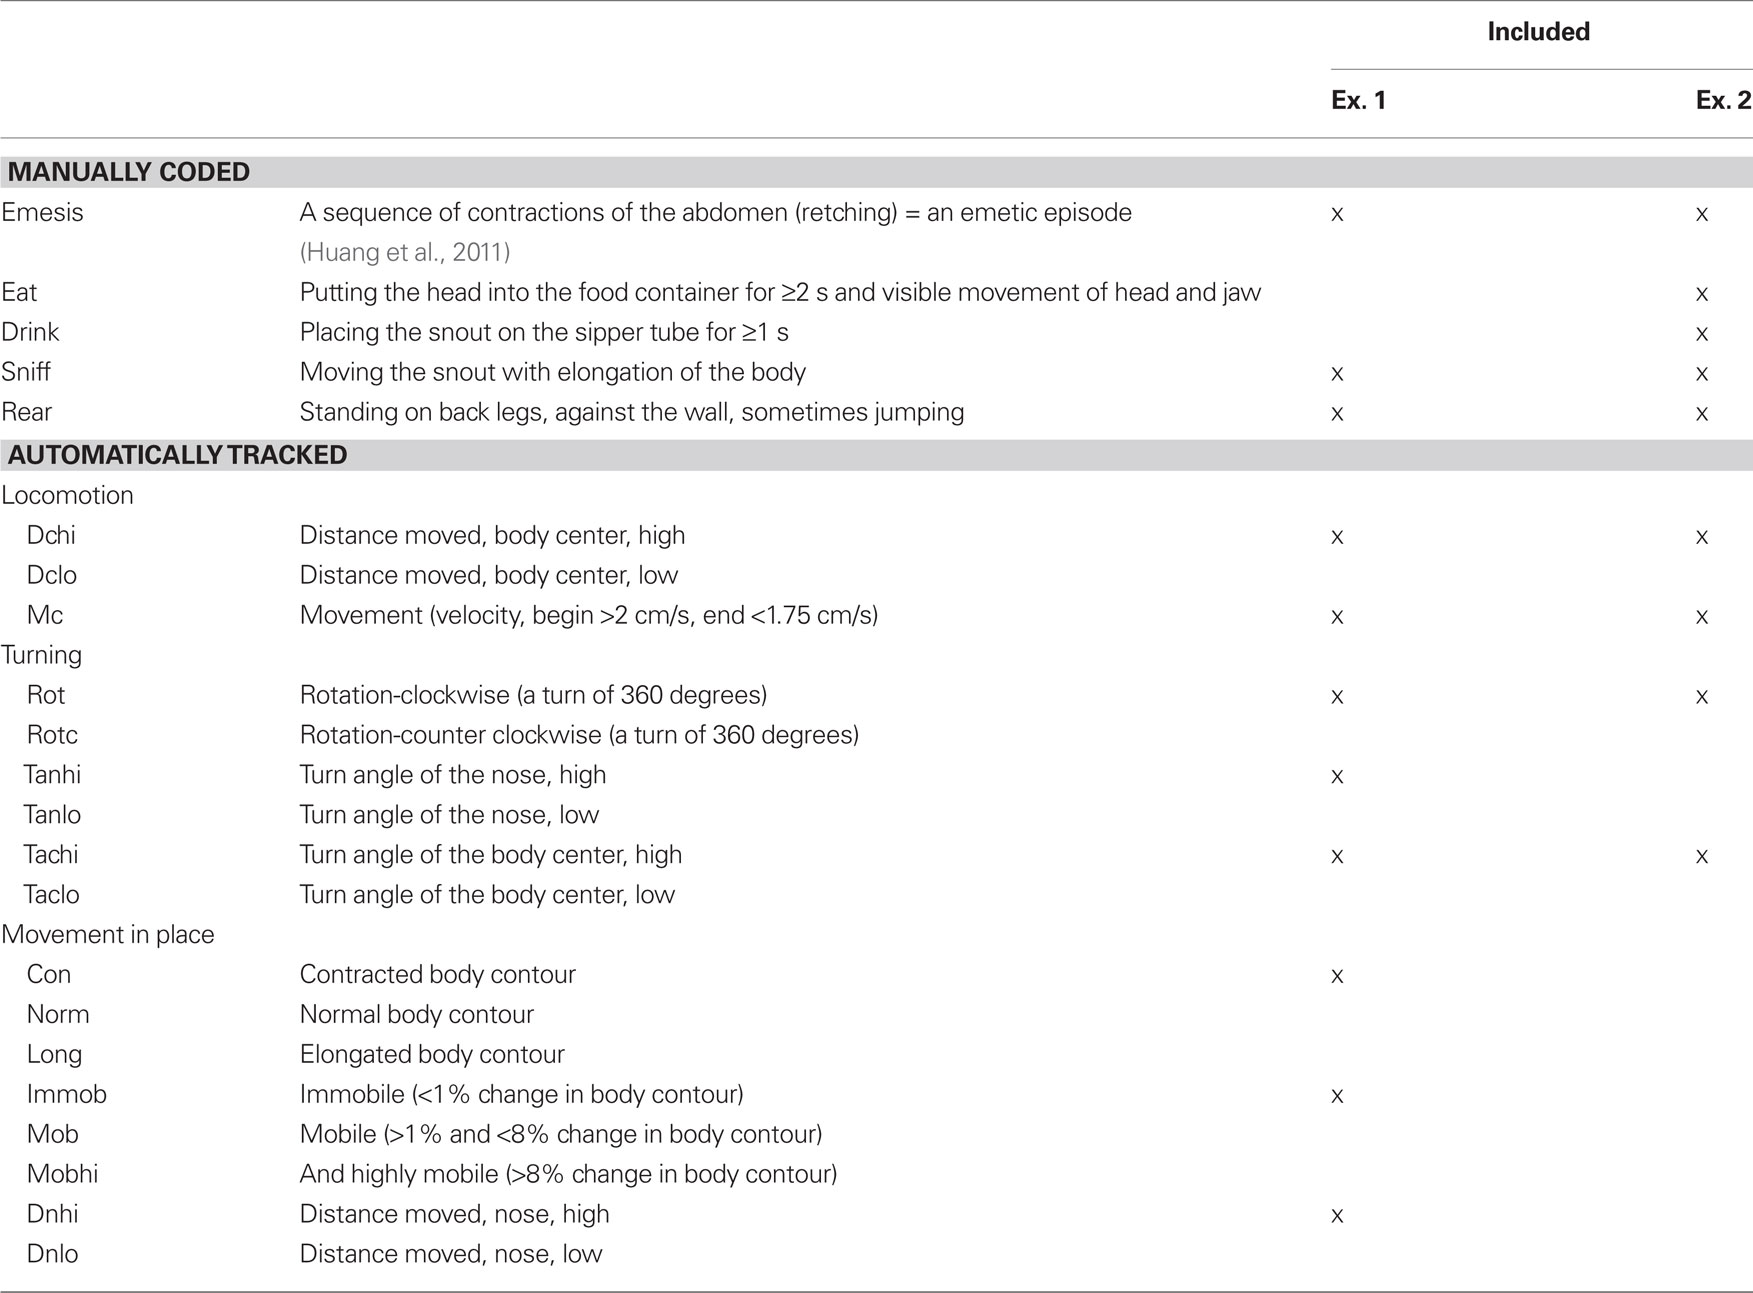
Table 1. Musk shrew behavioral event types.
Automatic Tracking of Movements Using Computer Software
Videos were imported into animal tracking software (Ethovision 7.1; Noldus). In Experiment 1, using gray scaling of the body contour, animals’ nose, center, and body points were tracked (NTSC, 29.97 frames/s, 480 × 720, MPEG-2; advanced model based nose–tail detection, smoothing of 1 pixel erosion and then 1 pixel dilation of the tracked contour). For Experiment 2, it was not possible to load daily videos (∼20 GB each) into the Ethovision software without compression and we determined that conversion to PAL (25 frames/s) using the AVI-MPEG4 format worked well (432 × 720). In the longer term videos (Figure 1), there were significant shadow effects that affected the tracking of body contour (particularly as the animal approached the sides of the chamber) and therefore only the center body point was tracked for each daily video (15 frames/s using model based tracking with medium pixel smoothing, and 4 pixel erosion and then 2 pixel dilation). In these 24 h videos, we used difference thresholding to track the body contour, i.e., a reference image was automatically updated over the course of the video tracking to correct for changes in illumination and position of bedding material.
Data Processing and Analysis of Individual Behaviors
Manually scored events were time-stamped and automatically tracked measures were exported from Noldus software as Microsoft Excel or text files. Custom scripts written in Matlab (Version 7.1; Mathworks) were used to process large text files for import to t-pattern software. Continuous variables that were automatically tracked, e.g., distance moved and velocity, were converted to discrete events using a threshold cutoff of 2 SD (standard deviation) above or below the mean values to generate time stamps (Table 1). In preliminary analyses we determined that relatively low cutoffs (e.g., ±1 SD) were too computationally intensive for the t-pattern analysis software. Computers used for tracking and analysis included (1) Dell OptiPlex 755, Intel Quad Core (4 CPUs, 2.4 GHz) and (2) Dell T3500 workstation, Intel Xeon (4 CPUs, 2.67 GHz). Both machines had 32 bit architecture running Windows 7. Noldus software (Observer XT 10 and Ethovision XT 7) does not support 64 bit machines and, as a result, RAM was limited to 4 GB.
We conducted standard analyses on the number of emetic episodes, food intake, etc., using analysis of variance (ANOVA) on hourly and daily time bins (Statistica 11.0; StatSoft). When an ANOVA was statistically significant, we conducted mean comparisons using Tukey’s honestly significant difference test (HSD) on hourly data and the least significance difference test (LSD-test) for daily data. For all ANOVA and mean comparisons, p < 0.05 was used to detect statistical significance.
T-Pattern Analysis
Temporal pattern analysis was conducted using computer software (Theme 6; Noldus Technologies). These algorithms have been tested on numerous data sets (Lyon and Kemp, 2004; Kerepesi et al., 2005; Kemp et al., 2008; Castaner et al., 2009), including several reports using laboratory mice and rats in anxiety testing and stereotypy (Bonasera et al., 2008; Casarrubea et al., 2010a,b). Here we briefly explain the detection algorithm but more details are presented in a theoretical paper (Magnusson, 2000).
Temporal pattern analysis detects the complex repeated patterns that otherwise remain hidden to the naked eye and are very hard or impossible to detect using other methods. The binomial test is used to determine statistically related patterns of behaviors. Figure 2 shows the detection of pattern “BG” then “Q” in a complex data set with many behavioral event types. For example, the algorithm starts by analyzing the occurrence of event “B” followed by event “G.” The hypothesis is that “B” is followed by “G” with an approximate distance (time) significantly more often than expected by chance. The null hypothesis is that “G” has a fixed probability of occurrence per unit time and if this is rejected by the relationship test of “B” then “G” this relationship becomes a new event type, i.e., “BG.” “BG” can then be used to test other relationships involving more complex patterns, for example, “BG” followed by event “Q” (Figure 2). Behaviors can also have a beginning “b” and an ending “e,” which are not shown.
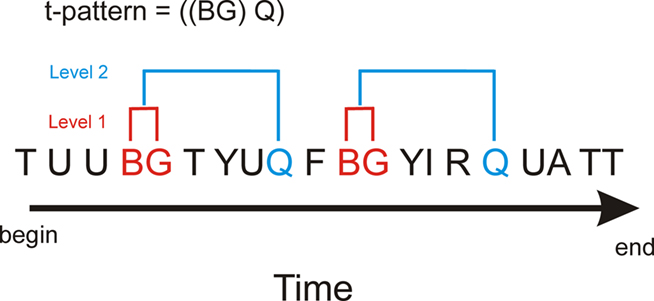
Figure 2. Hypothetical example of t-pattern detection in a data set with multiple behavioral events. Analysis for t-patterns is a bottom-up process and in this example behavioral event types “B” and “G” form a statistically significant relationship (level one). Subsequent analysis using “BG” as a new event could result in detection of a statistically significant relationship to behavior type “Q” [a level two relationship, i.e., ((BG) Q)]. This analysis can then proceed to higher levels to test for more complex patterns (Magnusson, 2000).
The results of t-pattern analysis are affected by several secondary parameters. In this report we used settings that would preserve power to detect behavioral patterns related to the infrequent event of emesis. The criteria for detection of patterns was a least two occurrences per animal in at least two animals, a significance level of p < 0.005, and only patterns with lengths that exceeded 1 SD difference from randomized detection of emesis-related patterns.
New features of t-pattern software (Theme 6; Noldus) were also used, including detection of bursts and positive and negative associates of t-patterns. Bursts are a special type of t-pattern that occur in succession with distances between events that are much shorter than average. T-pattern bursts can also form components of more complex patterns (Magnusson, 2006). Positive and negative associates of t-patterns are behavioral event types that are not part of a specific t-pattern but occur within or around (positive) or less often (negative) than expected by chance.
Temporal pattern detection on real data was compared to detection on randomized data by shuffling and rotating each data set (Theme 6). Ten trials of shuffling and 10 trials of rotation were used to generate a mean and SD for random detection of patterns. Event types that occurred in detected patterns, or as predictions of the current study, i.e., changes in ingestive behaviors and locomotion, were compared to the randomized data using t-tests (two-tailed, within subjects, p < 0.05 for statistical significance). The percentage occurrence of event types occurring before or after emesis was used for these comparisons.
Results
Experiment 1: Short-Term (2 h) Analysis
Cisplatin injection (20 mg/kg) produced emetic episodes (6.6 ± 1.4 events) in 5 of the 10 animals tested, 3 males and 2 females. This result is similar to other reports showing that not all animals develop emesis with this dose (Sam et al., 2003). Figure 3 shows the occurrences of all event types from one animal during a 2-h test.
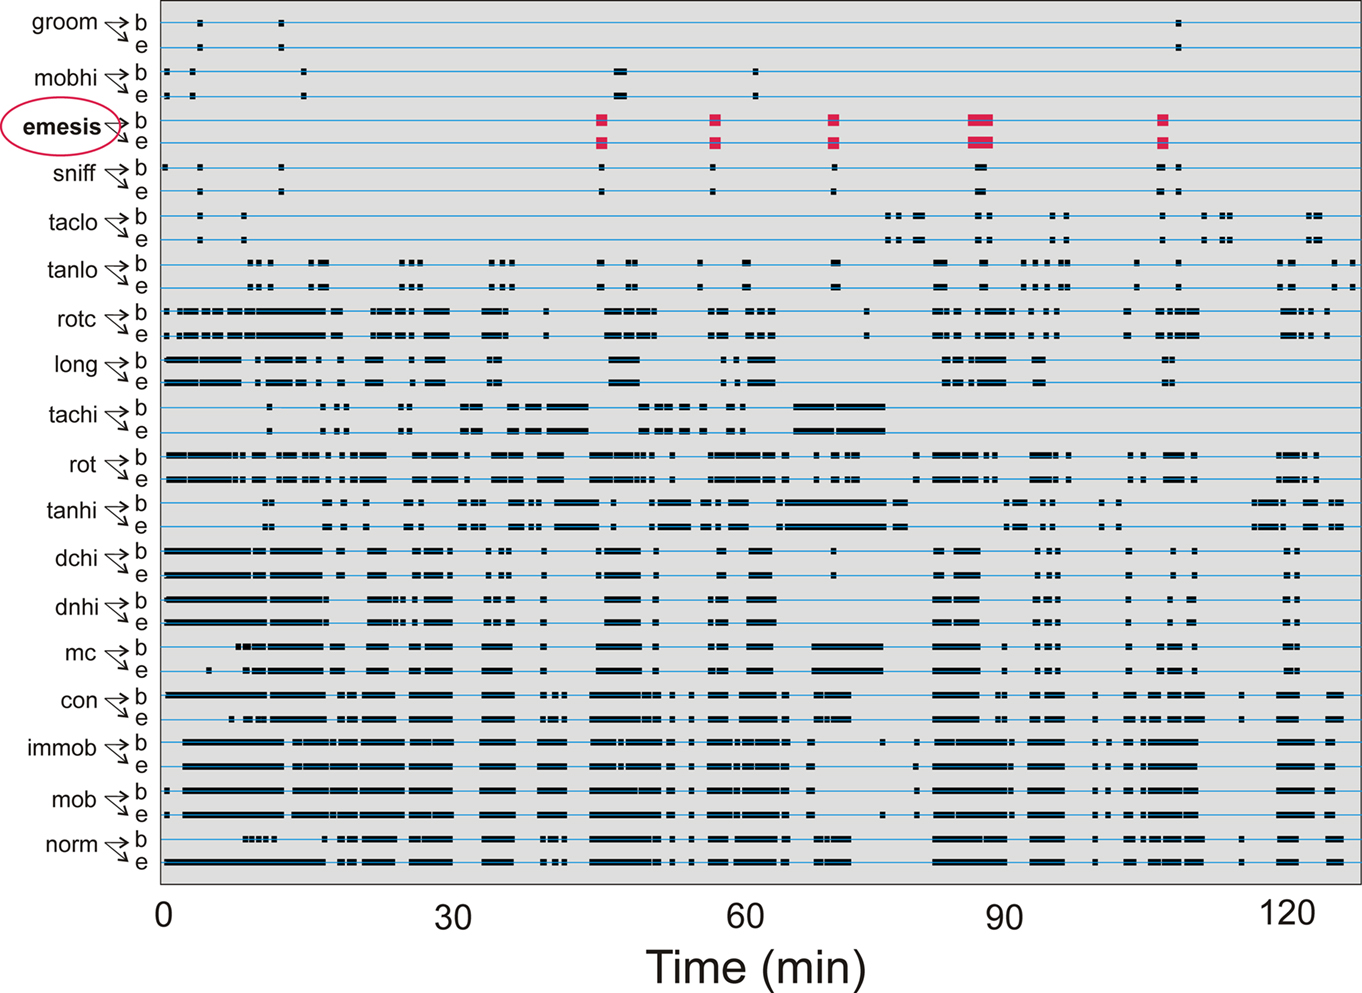
Figure 3. Representative time-stamped behavioral events for one animal from Experiment 1: short-term (2 h after injection with cisplatin, 20 mg/kg). See Table 1 for list of behaviors. Behaviors are organized with least frequent events at the top. “b” Shows the beginning and “e” represents the ending of each event type. Emetic episodes are shown in red.
We conducted three independent analyses using the following sets of event types (always including emesis as one event type): (A) locomotion behaviors and other manually labeled behaviors, (B) turning variables, and (C) measures of movement in place (see Table 1). Our initial analysis revealed a large number of statistically significant behavioral patterns with a subset containing emesis events. In analysis A, there was a total of 482 ± 134 (mean ± SEM) detected patterns and 95 ± 23 containing emesis. In analysis B, there was a total of 598 ± 121 and 49 ± 32 with emesis. In analysis C, there was a total of 3191 ± 556 and 149 ± 55 with emesis. Comparisons of emesis-related patterns between real and randomized data revealed a much larger number of detections in real data (Figure 4).
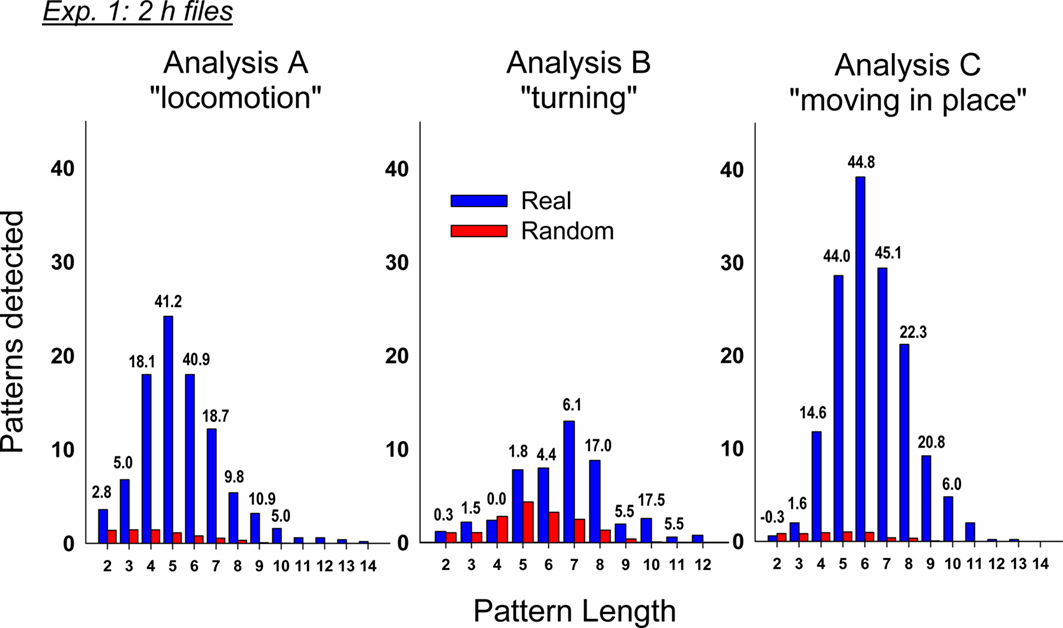
Figure 4. Comparison of real and randomized detection of t-patterns from the three analyses in Experiment 1 (2 h after injection with cisplatin, 20 mg/ kg, i. p., n = 5). Bars represent the average number of detected patterns for each pattern length (i.e., the number of event types in a pattern). Numbers above the bars show the SD difference between real and random data. Random bars are the mean results of 20 randomizations (10 shuffles and 10 rotations). Bars without a number have an extremely large SD between real and random detection.
Table 2 shows t-patterns that met the detection criteria (see Materials and Methods: T-pattern analysis). Movement (mc), body contraction of normal (norm), contracted (con), elongated (long), sniff, and low turn angle of the nose (tanlo) occurred in these patterns. This table is divided into subset and primary patterns. Subset patterns are components of primary patterns, which can also occur independently. Representative samples of patterns from the three analyses are shown in Figure 5. None of these analyses showed statistically significant negative associates of emesis-related patterns but positive associates were present for several of the event types that occurred as part of detected patterns.
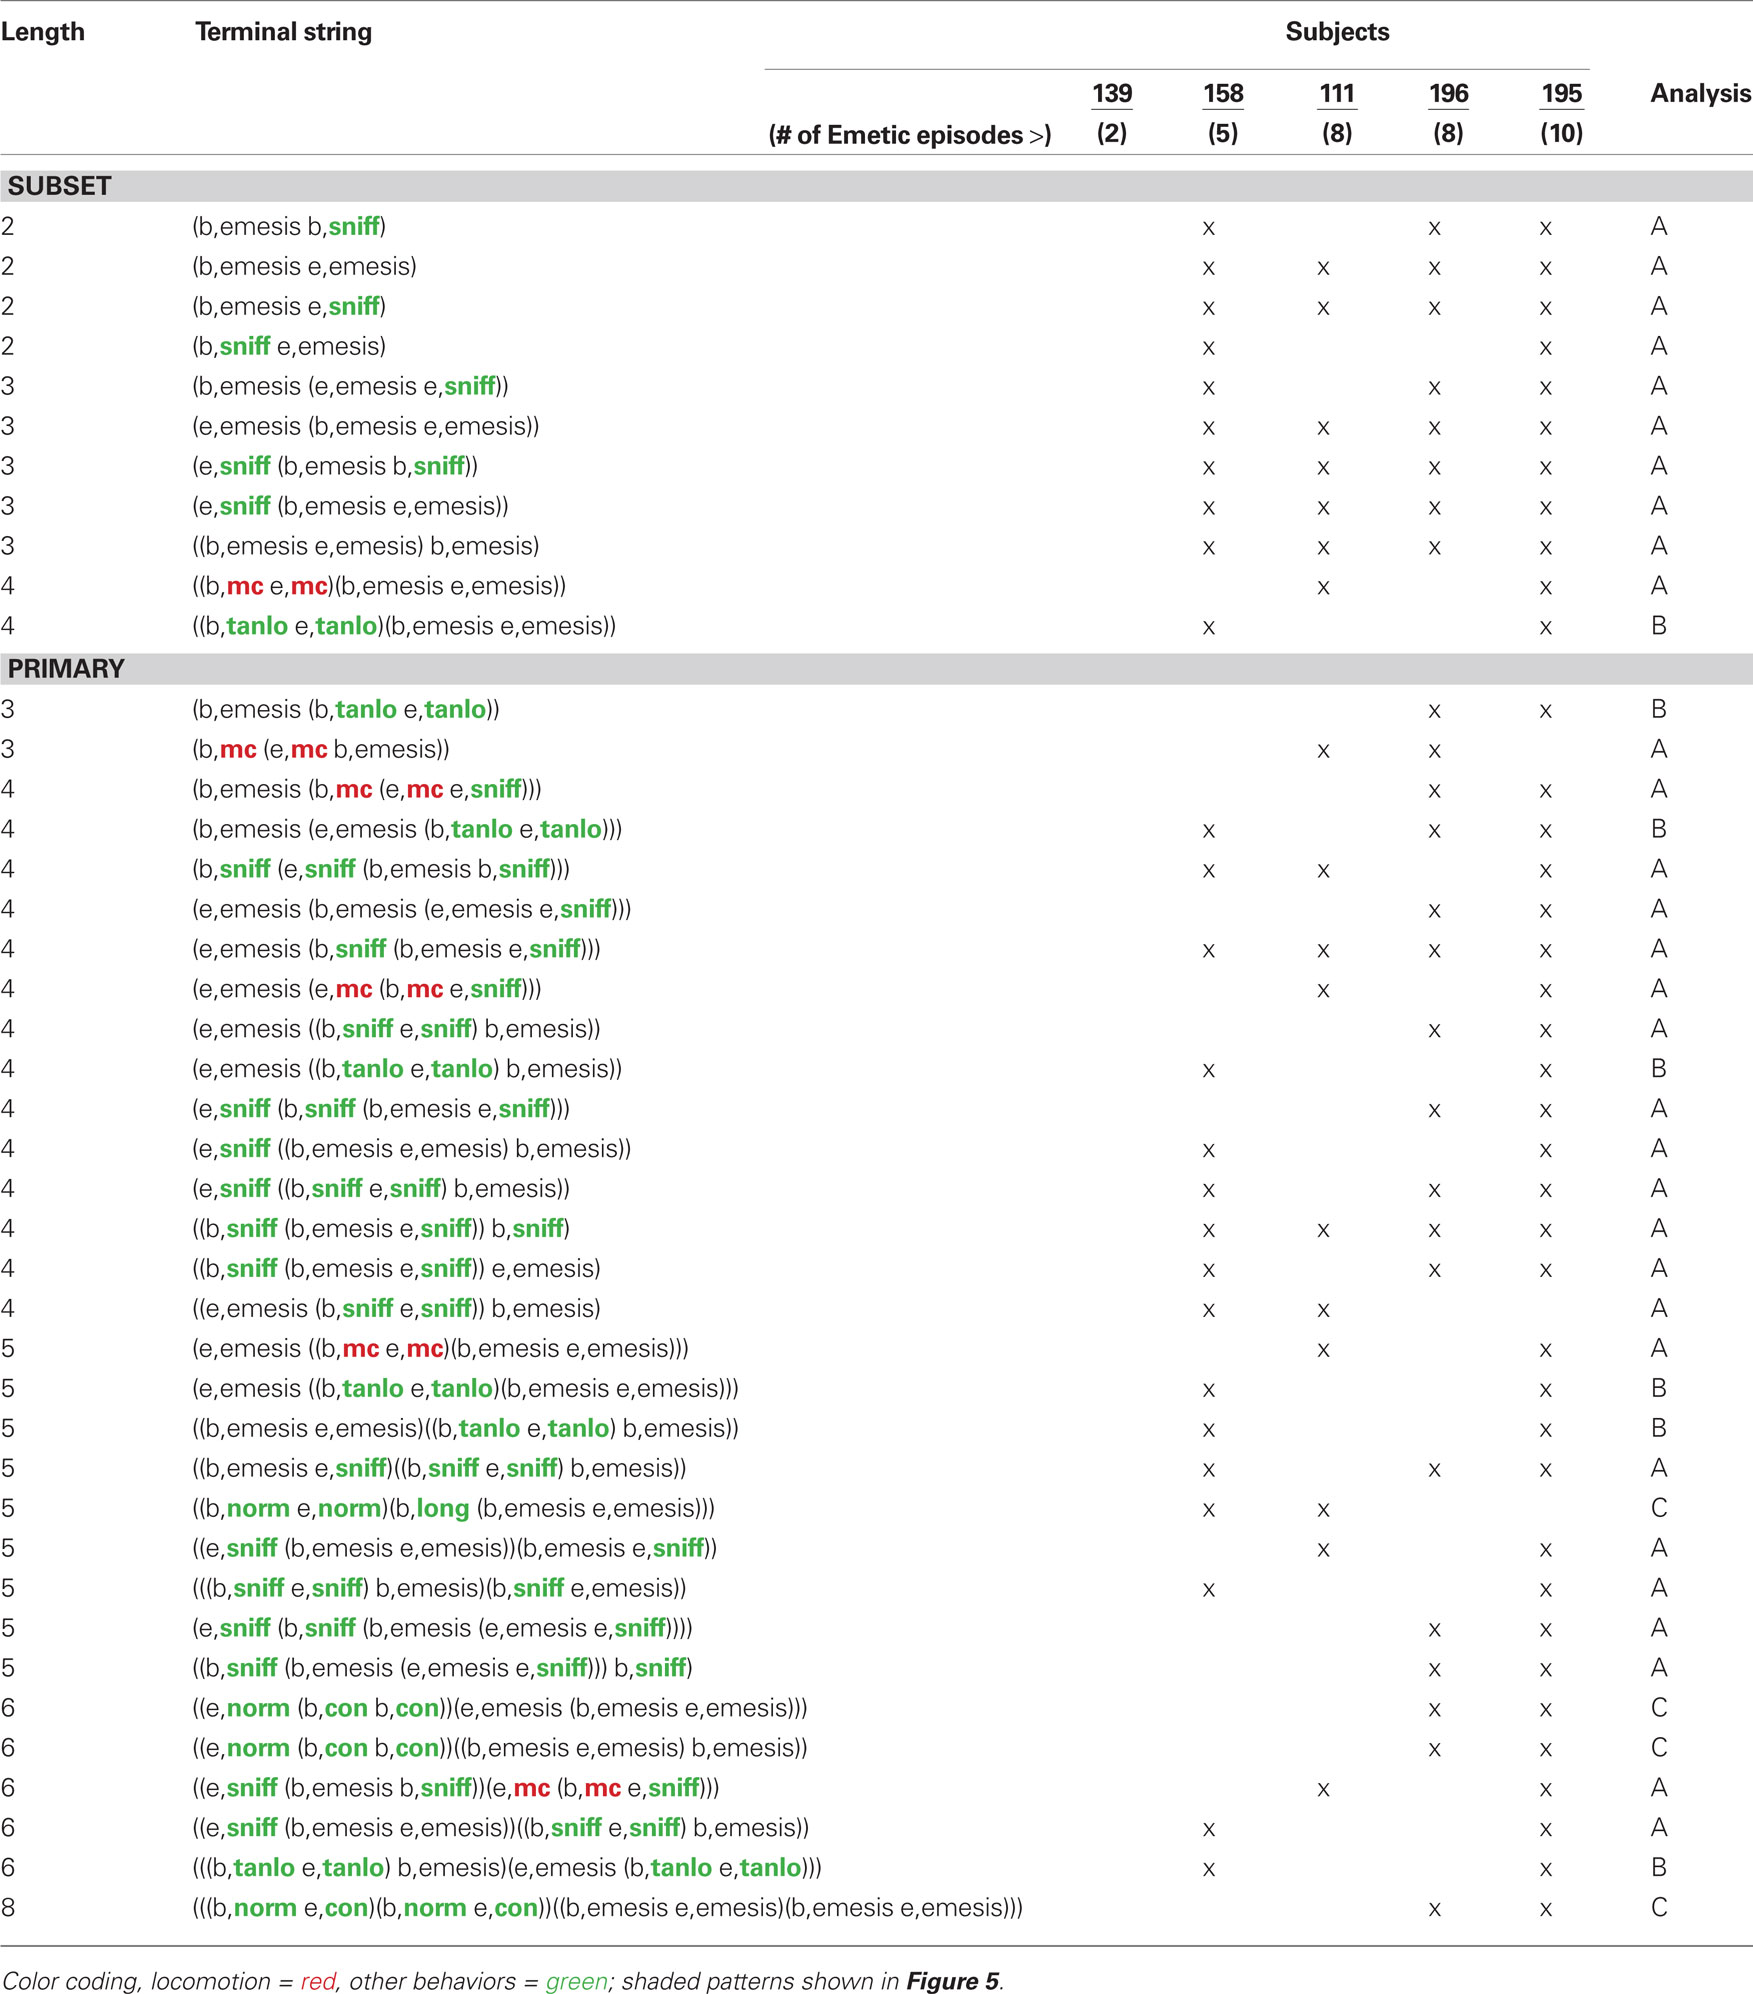
Table 2. Temporal patterns in the short-term experiment (2 h).
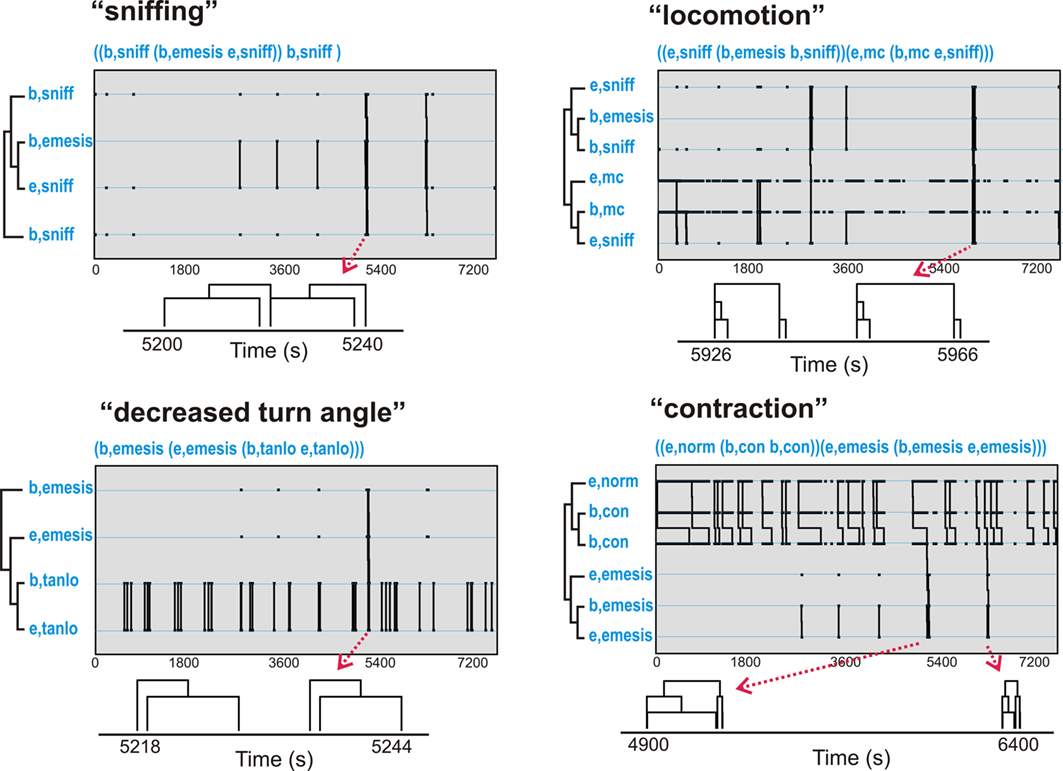
Figure 5. Representative t-patterns detected in Experiment 1 (2 h after injection with cisplatin, 20 mg/kg, i. p.; Table 2). These four patterns contain a collection of event types, including, sniffing (sniff), decreased turn angle (tanlo), locomotion (mc), and contraction (con). The sequence of “b,tanlo” plus “e,tanlo” (decreased turn angle) and “e,norm,” “b,con,” plus “e,con” (contraction of the body) represent patterns of bursts that are contained within larger patterns. Diagrams below each graph represent smaller time scale sub-sections of pattern trees. Note that some of the pattern trees are reduced in the diagrams because bursting events are collapsed into a single limb (e.g., “b,tanlo” and “e,tanlo”).
Figure 6 shows the occurrence of event types before or after emesis comparing real and randomized data. More locomotion (mc) occurred before emesis and less distance was (dchi) moved after emesis in the real data compared to randomized data. Sniffing (sniff) and normal contraction of the body (norm) were more common event types in emesis-related patterns in real versus randomized data.
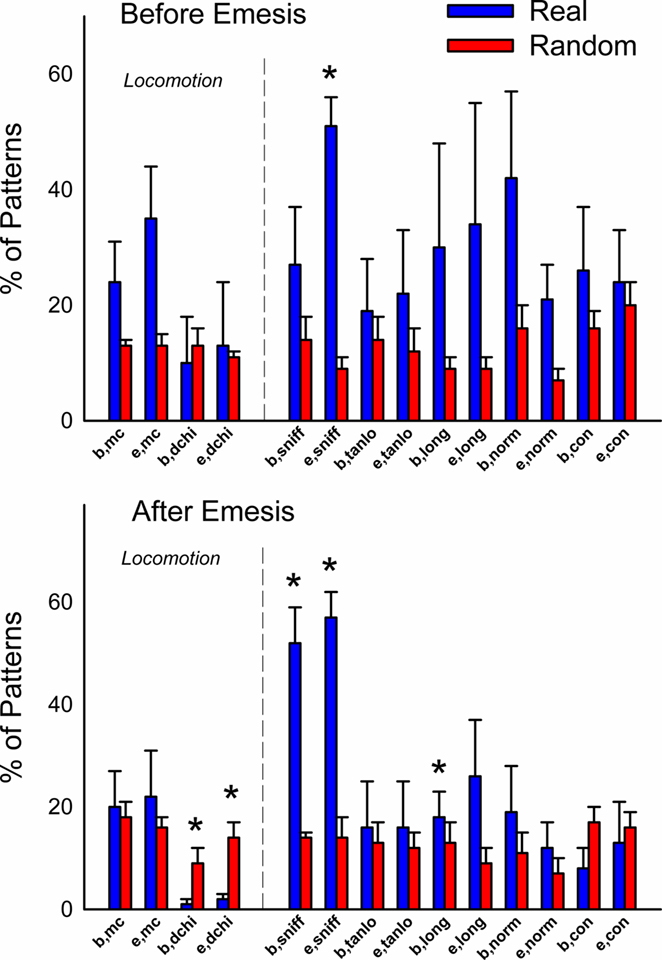
Figure 6. Comparison of event types in emesis-related t-patterns detected in Experiment 1 (2 h after injection with cisplatin, 20 mg/kg, i. p., n = 5). Results represent the mean ± SEM. *p < 0.05, two-tailed t-test, real versus random data.
Experiment 2: Long-Term (72 h) Analysis
Cisplatin injection produced the predicted outcomes, including emesis, reduced feeding and drinking, and loss of body weight [Figure 7; F(3,15) ≥ 3.9, p ≤ 0.03]. Feces production was not significantly changed (ANOVA). Hence, these animals would be defined as sick on multiple dimensions by Day 3 after cisplatin injection. Cisplatin treatment (30 mg/kg) induced acute (<24 h) and delayed (>48 h) phases of emesis (Figures 7–9). One animal showed three emetic episodes during the baseline day (prior to cisplatin treatment). On measures of food and water intake and body weight this animal was not significantly different from the other five animals. These few emetic episodes in one animal might be attributable to stress.
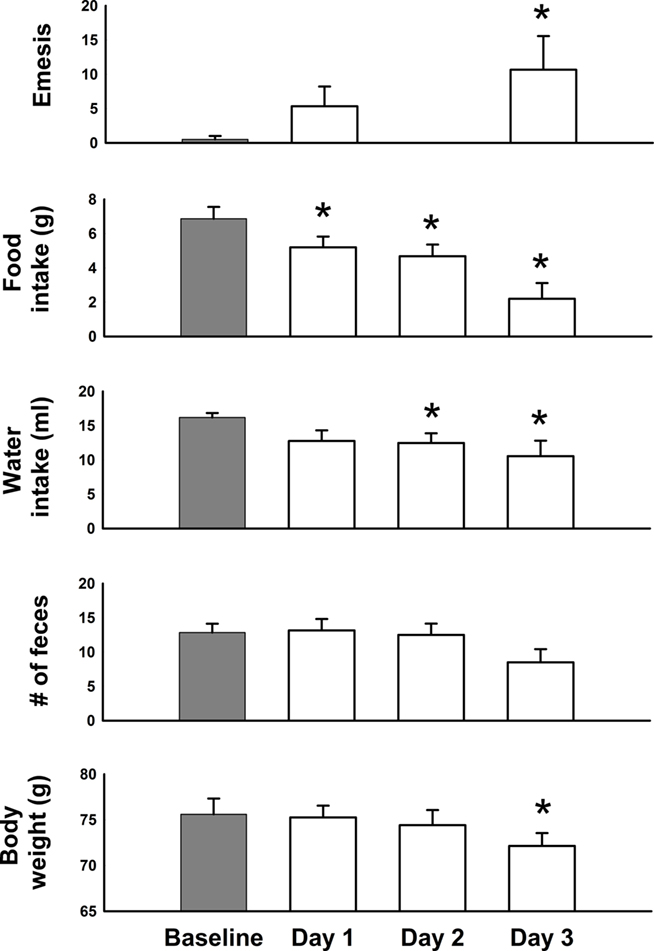
Figure 7. Daily effects of cisplatin on emesis, food and water intake, number of feces, and body weight in Experiment 2 (72 h after injection with cisplatin, 30 mg/kg, i. p., n = 6). Values were recorded for 1 day before (baseline control) and 3 days after injection of cisplatin. Results represent the mean ± SEM. *p < 0.05 versus baseline, LSD-test.
Figures 8 and 9 show behavioral events per hour for manually and automatically tracked behaviors. Distance moved and turn angle are represented as continuous data prior to detection of discrete events using ±2 SD. There were small but statistically significant changes in behavior over the 4 days [Fs(69,345) ≥ 1.4, ps ≤ 0.05, ANOVA, day by hour interaction effect for measures of eat, drink, groom, sniff, rear, mc, rot, rotc, distance moved, and velocity; F(3,15) = 5.1, p < 0.05, ANOVA, main effect of day for emesis]. There were no statistically significant effects for turn angle.
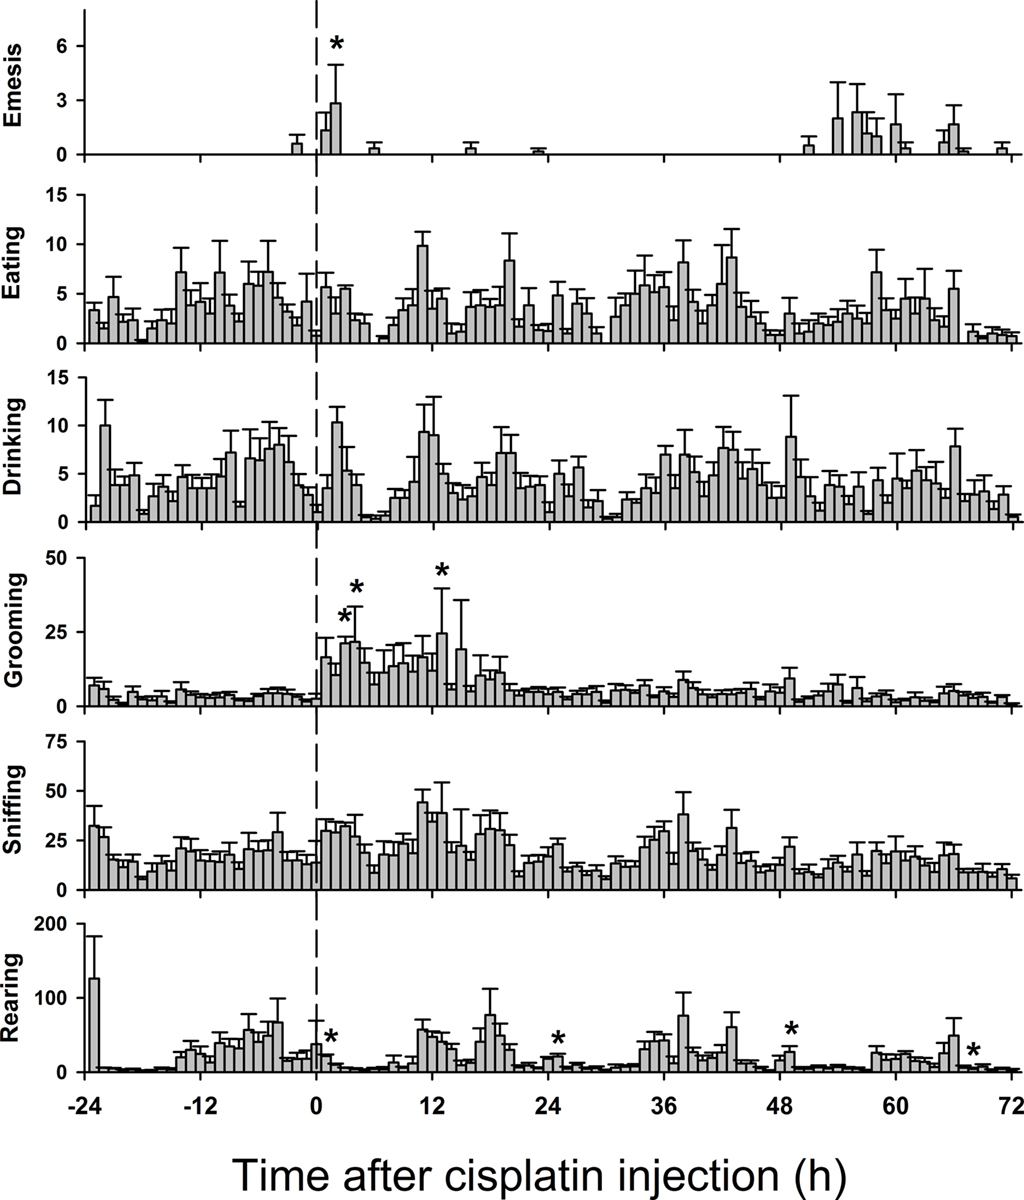
Figure 8. Hourly effects of cisplatin on emesis, eating, drinking, grooming, sniffing, and rearing in Experiment 2 (72 h after injection with cisplatin, 30 mg/kg, i. p., n = 6). Behaviors were recorded for 1 day before (baseline control) and 3 days after the injection of cisplatin. Results represent the mean ± SEM. *p < 0.05 versus corresponding hour from baseline before cisplatin injection, Tukey’s HSD test.
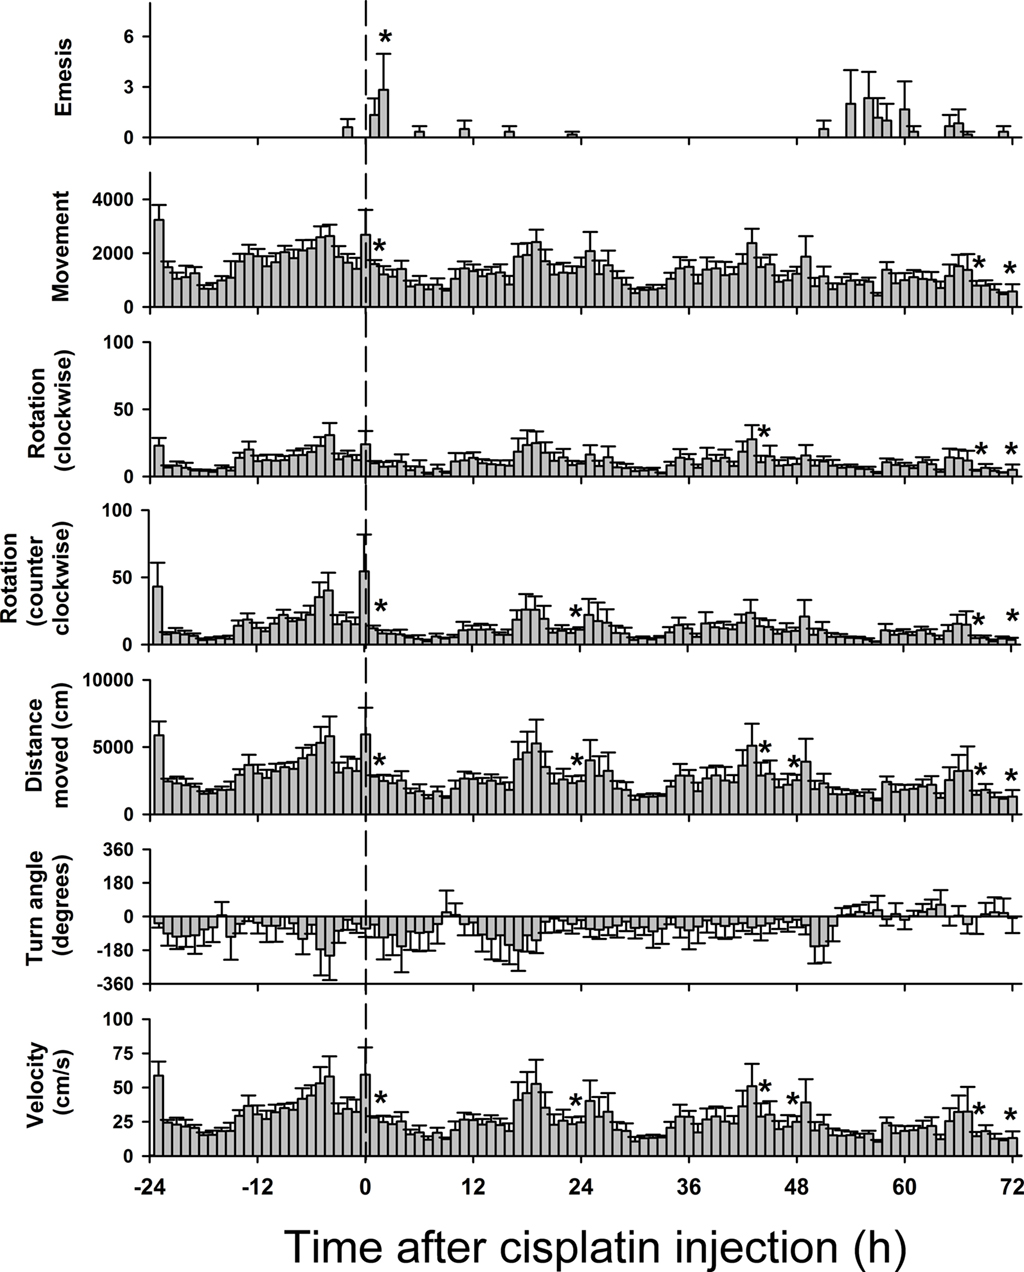
Figure 9. Hourly effects of cisplatin on emesis and multiple tracked behaviors in Experiment 2 (72 h after injection with cisplatin, 30 mg/kg, i. p., n = 6). Behaviors were recorded for 1 day before (control) and 3 days after the injection of cisplatin. Results represent the mean ± SEM. *p < 0.05 versus corresponding hour from baseline before cisplatin injection, Tukey’s HSD test.
There was a nearly perfect correlation between distance moved and velocity (r = 0.99, Pearson); therefore we did not use velocity as a metric in the t-pattern analysis. Furthermore, unlike the short-term experiment, there were no low distance moved events (dclo; 2 SD below the mean). T-pattern analysis included 12 event types: emesis, groom, rear, sniff, eat, drink, mc, dchi, rotc, rot, tachi, and taclo (see Table 1).
The analysis was focused on Days 1 and 3 post-injection with cisplatin since these represent acute and delayed phases of emesis. Even with only 12 event types it became clear that t-pattern analysis was not capable of evaluating large daily data sets using all variables simultaneously. To solve this issue we divided the analysis into sets of event types and also ran analyses on data from 1 h before and 1 h after each cluster of emetic episodes (i.e., 2 h files; note that these are different 2 h files than those from Exp. 1). Emetic episodes that occurred with intervals greater than 1 h were considered as new clusters. There were six independent analyses (always including emesis as one event type): (A) 24 h data; including groom, sniff, eat, and drink events, (B) 24 h data; with groom, rear, eat, and drink events, (C) 24 h data; using dchi events, (D) 2 h data; including groom, rear, sniff, eat, drink, and mc events, (E) 2 h data; using groom, rear, sniff, eat, drink, and dchi events, and (F) 2 h data; with groom, rear, sniff, eat, drink, rot, rotc, tachi, and taclo events (see Table 1).
Similar to the short-term experiment, our analyses revealed a large number of statistically significant behavioral patterns with a subset containing emesis: (A) total detected patterns in Day 1 = 6507 ± 1837 (mean ± SEM) and Day 3 = 3335 ± 975, with 46 ± 14 and 227 ± 110 emesis-related patterns, respectively, (B) total Day 1 = 4838 ± 1160 and Day 3 = 2665 ± 737, with 41 ± 16 and 80 ± 42 emesis-related, respectively, (C) total Day 1 = 22 ± 5 and Day 3 = 29 ± 6, with 9 ± 4 and 19 ± 6 emesis-related, respectively, (D) total Day 1 = 5684 ± 4330 and Day 3 = 2040 ± 885, with 77 ± 46 and 40 ± 17 emesis-related, respectively, (E) total Day 1 = 4252 ± 3141 and Day 3 = 1957 ± 752, with 84 ± 53 and 40 ± 12 emesis-related, respectively, and (F) total Day 1 = 3667 ± 2653 and Day 3 = 1317 ± 439, with 67 ± 39 and 13 ± 4 emesis-related, respectively. Comparison of the emesis-related patterns between real and randomized data revealed a much larger number of emesis-related patterns in real data (Figure 10).
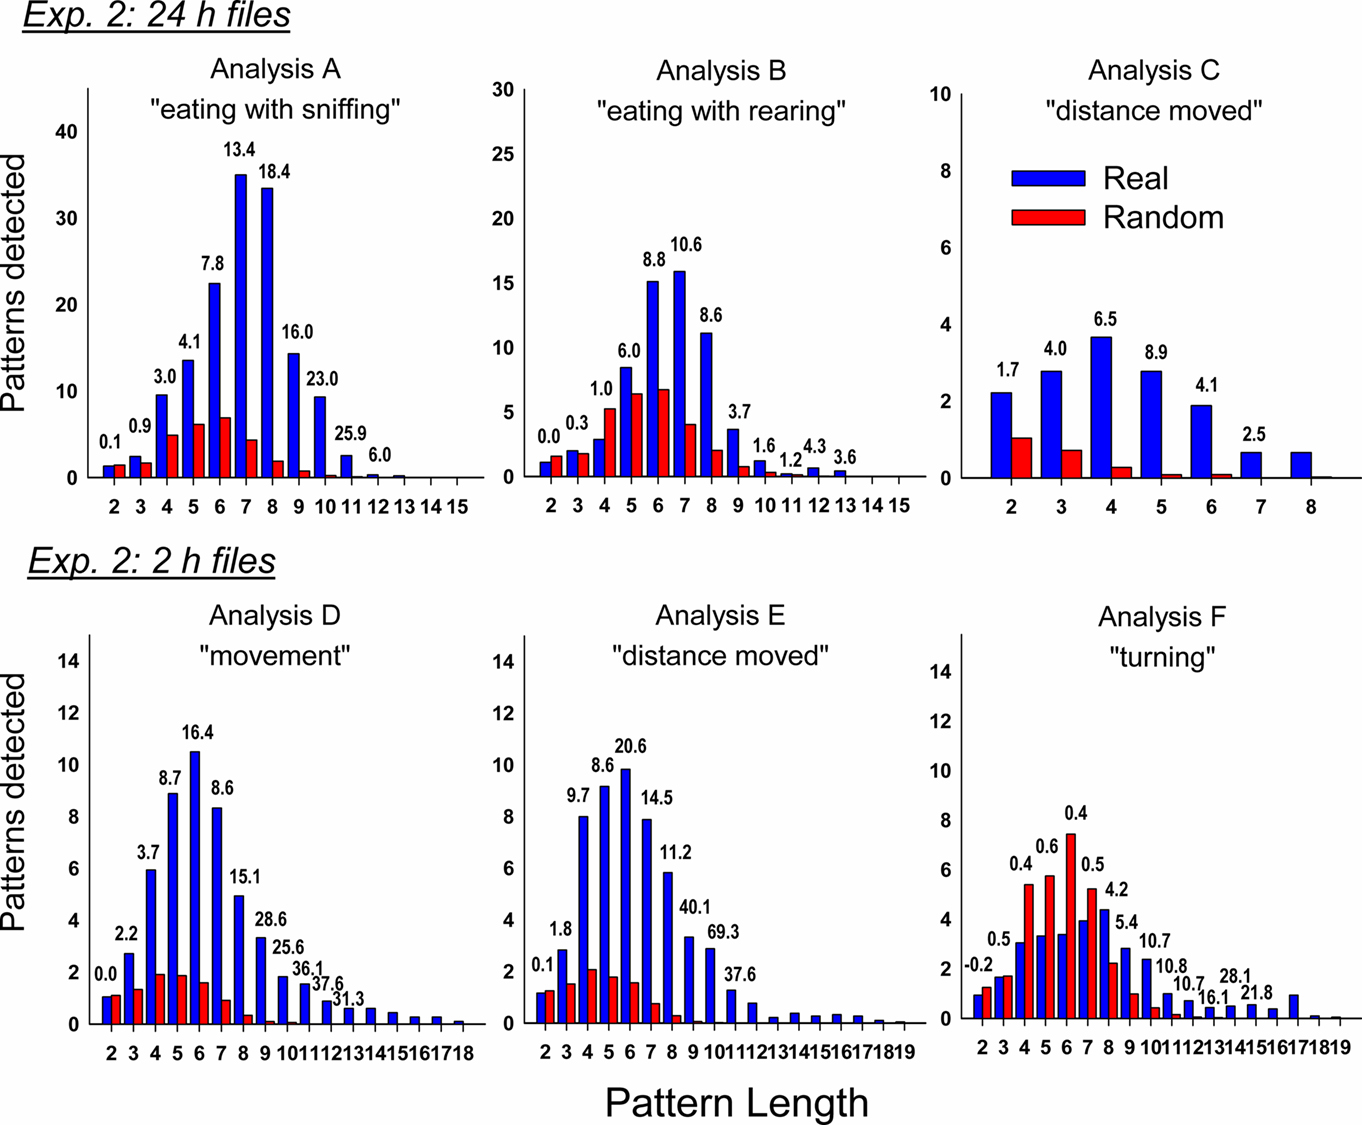
Figure 10. Comparison of real and randomized detection of t-patterns from the six analyses in Experiment 2 (72 h after injection with cisplatin, 30 mg/kg, i. p., n = 6). See text for details on the analyses using different files sizes (24 and 2 h). Bars represent the average number of detected patterns for each pattern length (i.e., the number of event types in a pattern). Numbers above the bars show the SD difference between real and random data. Random bars are the mean results of 20 randomizations (10 shuffles and 10 rotations). Bars without a number have an extremely large SD between real and random detection.
Table 3 shows t-patterns that met the detection criteria. Distance moved (dchi), movement (mc), sniff, drink, groom, rear, and rotation (rot) occurred in these patterns with many more in Day 3 compared to Day 1. This table is divided into subset and primary patterns. Subset patterns are found in primary patterns but can also occur independently. Representative samples of patterns from the six analyses are shown in Figure 11. None of these analyses showed statistically significant negative associates of emesis-related patterns but positive associates were present for several of the event types that had also occurred as part of detected patterns.
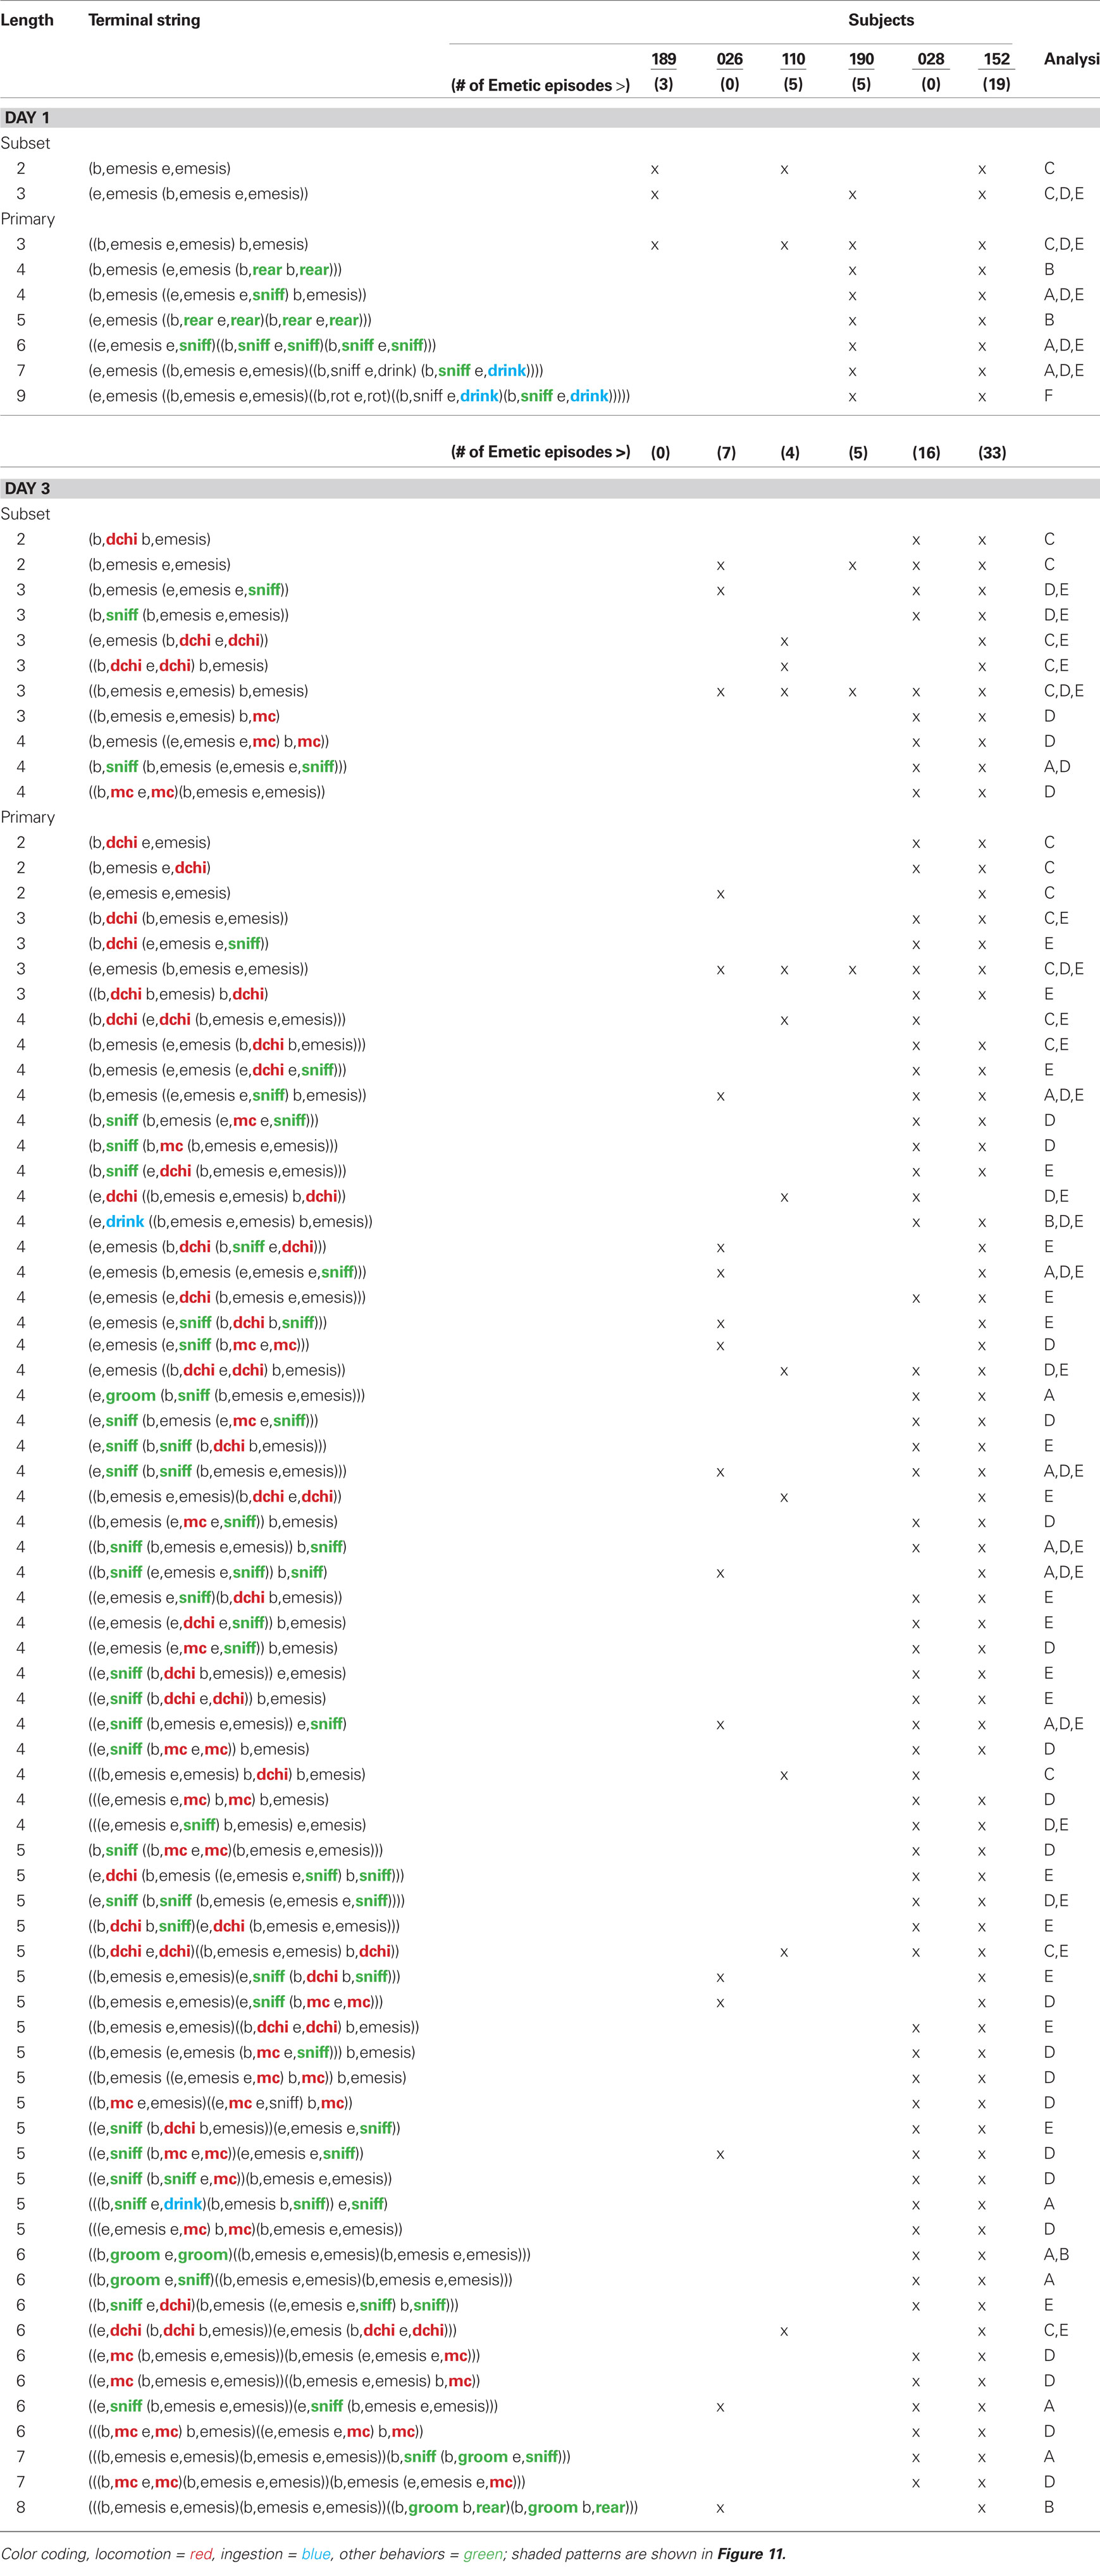
Table 3. Temporal patterns in the long-term experiment (3 days).
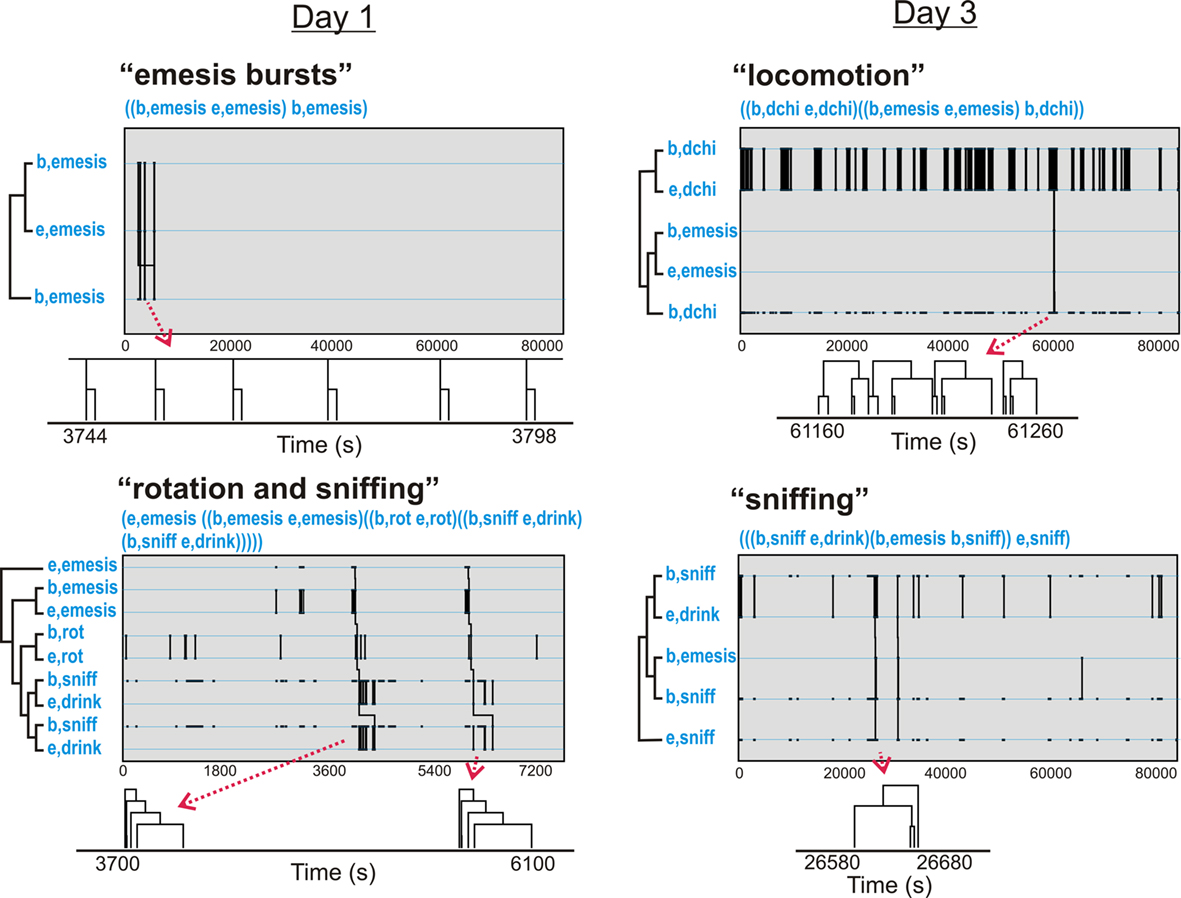
Figure 11. Representative t-patterns detected in Experiment 2 (72 h after injection with cisplatin, 30 mg/kg, i. p.; Table 3). These four patterns contain a collection of event types, including rotation (rot), locomotion (dchi), and sniffing (sniff). The sequences of “b,dchi” plus “e,dchi,” etc., represent patterns of bursts that are contained within larger patterns. Diagrams below each graph show smaller time scale sub-sections of pattern trees. Note that some of the pattern trees are reduced in the diagrams because bursting events are collapsed into a single limb.
Figures 12 and 13 (Day 1 and 3) show the occurrence of event types before or after emesis comparing real and randomized data. Locomotion (mc) occurred significantly more often before emesis on Day 3 than on Day 1 in real versus random t-patterns. Ingestive behaviors before and after emesis were less common in real compared to random patterns. Furthermore, animals showed less complex movements, i.e., grooming, rearing, and rotation, from real versus randomized emesis-related patterns.
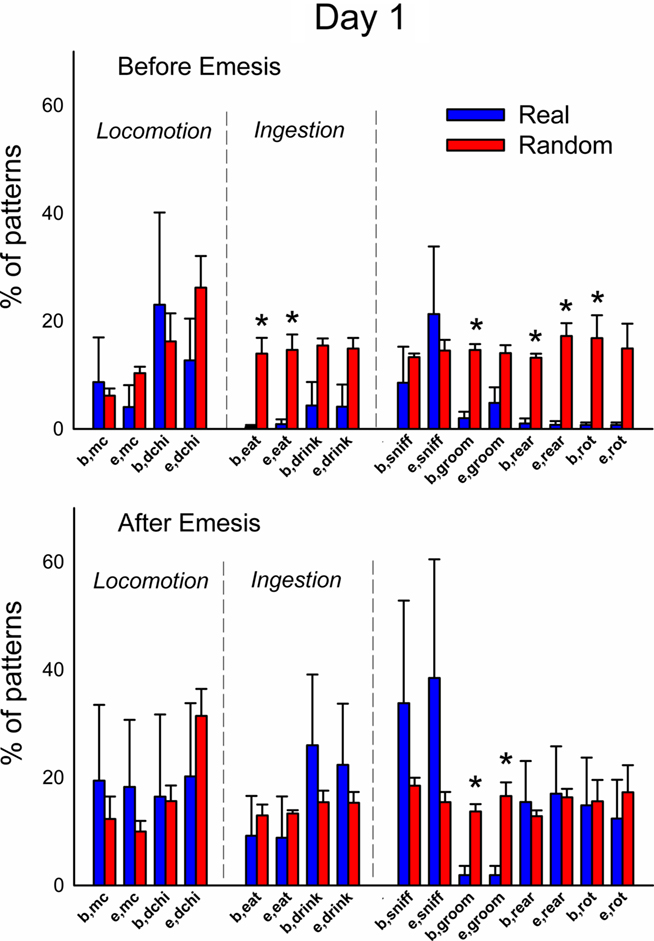
Figure 12. Comparison of event types in emesis-related t-patterns detected in Experiment 2, Day 1 (24 h after injection with cisplatin, 30 mg/kg, i. p., n = 6). Results represent the mean ± SEM. * = p < 0.05, two-tailed t-test, real versus random data.
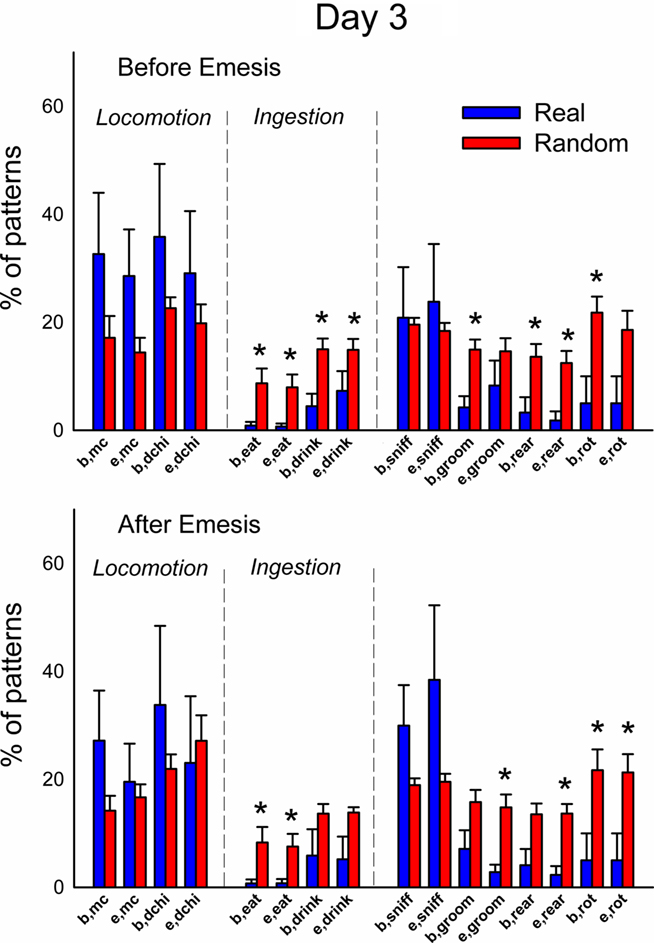
Figure 13. Comparison of event types in emesis-related t-patterns detected in Experiment 2, Day 3 (48 h–72 h after injection with cisplatin, 30 mg/kg, i. p., n = 6). Results represent the mean ± SEM. * = p < 0.05, two-tailed t-test, real versus random data.
Discussion
Temporal pattern analysis revealed a large number of non-random patterns of behavior associated with emesis in musk shrews, including sniffing, changes in body contraction, and locomotion. There was little evidence that locomotion was inhibited in the 72-h experiment by the occurrence of emesis (using either of the two metrics; mc, discrete velocity cutoffs or dchi, distance moved, 2 SD above the mean). However, eating was not significantly associated with emesis-related behavioral patterns. Eating, drinking, and other large body movements, including rearing, grooming, and body rotation, were significantly less common events contained in emesis-related behavioral patterns in real versus randomized data.
This report represents a balanced approach to detection of behavioral patterns. Emesis is more difficult to analyze with t-pattern analysis because there are many fewer emesis events compared to other types of behavior. For example, there were 1000s of events of sniffing but only from 1 to 33 emetic episodes in each data file. As a solution to this sparseness of emesis data, we used a minimum of two occurrences (in two animals) for the detection of emesis-related patterns. We also substantially narrowed the focus by selecting only patterns containing emesis as an event type, which resulted in a greater than 10-fold reduction in the number of patterns in real and random detection. Although patterns were unique to some animals, it was obvious from the set of detected patterns that many animals share similar event types in these emesis-related patterns. We therefore looked more closely at these commonalities by analyzing the occurrence of specific event types within t-patterns. A comparison of real and randomized data showed that locomotion (see Figure 6; dchi) was inhibited after the occurrence of emesis but in the longer term (72 h) experiment there were no significant changes in locomotion before or after emesis (see Figures 12 and 13). A prior report also showed little change in locomotion during periods of cisplatin-induced emesis in musk shrews (Lau et al., 2005). However, ingestive behavior and more complex movements, including rearing, grooming, and rotation, were significantly less common events in emesis-related patterns (see Figures 12 and 13).
It is unclear how to reduce the complexity of the data without losing potentially important information (see Tables 2 and 3). For this reason, we chose not to exclude patterns that were subsets of generally more complex primary patterns or combine the beginning and ending for event types that have a short duration. Tables 2 and 3 show simple patterns that are “subsets” of “primary” patterns. A rule used by the Theme analysis software is that patterns that occur as parts of more complex patterns are only reported if they also occur outside them (i.e., independently). In general, although pattern subsets occur in most animals their inclusion in more complex primary patterns represents a smaller portion of animals. Furthermore, the beginning and ending of events are treated independently in the analysis. The beginning will always be correlated with the ending of an event. However, there are temporal differences between “b” and “e” for most behaviors including sniffing. The only place where “b” and “e” are likely not important is with the “emesis” event type, because these events have a duration of ∼1 s between “b” and “e” (Huang et al., 2011) and the resolution of our data files is only 1 s. However, it is important to show “b,emesis e,emesis” patterns (and other combinations of emesis event types) for several reasons: (1) it is an internal check on the data, i.e., these events should be detected often with t-pattern analysis (as seen in Tables 2 and 3), (2) emesis associations show the bursting property of these events (see Figures 5 and 11), and (3) they can occur independently of more complex primary patterns. Finally, a methodological reason for not combining “b” and “e” of the same event type is that t-pattern analysis algorithms were designed with the premise that each event type will have a beginning and ending and mathematical algorithm testing and modification of the already standard use of t-patterns is beyond the scope of the current report.
It appears that simple plots of single behaviors (Figures 8 and 9) are not very informative for understanding behavioral changes that occur with emesis. There was very little change in the number of eating, drinking, and other bouts of movement over the course of the long-term experiment (3 days after cisplatin injection). Animals were also more active in the short-term experiment (2 h) and the first few hours of the long-term study. This is not surprising since the chambers were novel for these animals and were likely to promote exploratory behavior. Notably there were small increases in activity during the dark phase (e.g., locomotion and rearing), which has been reported in other studies using musk shrews (Ishii et al., 2002).
We detected 1000s of statistically significant behavioral patterns in the musk shrew that did not include emesis. Although investigation of these patterns is beyond the scope of the current report, these should provide a rich source of information for future work. Indeed this represents the first report from any species that shows daily t-patterns at a temporal resolution of 1 s. Many of these patterns were revealed as bursts of activity, for example, feeding, drinking, and locomotion (e.g., Figure 11). Although some of these patterns were not associated with emesis, their frequency might be affected by emesis and sickness. Reductions in non-emesis-associated behavioral patterns could provide insight into changes in the allocation of behavior during sickness. It is likely that animals will curtail other behavioral sequences as a result of sickness. We were unable to detect negative associates of emesis-related patterns. This analysis was restricted to single event types as negative associates (a current feature of Theme 6 software). Assessing whole patterns as negative associates of emesis-related patterns should be possible in future studies.
Temporal pattern analysis is not the only approach to the complex problem of detecting emesis-related behavioral patterns. Other approaches might prove to be equally or more useful. For example, these data could be analyzed using conventional time series methods based on linear dynamical systems (Kim and Smyth, 2006; Oh et al., 2008) or recent extensions to cluster time series based on aligned cluster analysis (Zhou et al., 2008, 2010). This latter method is a computer vision approach that is related to our work on automatic detection of emesis in videos of musk shrews (Huang et al., 2011). Extension of these computer algorithms to include other behaviors could produce detection of emesis-associated behavioral changes.
This study represents the first use of a computational approach to understand emesis-related behavioral change and could represent a novel way to develop a behavioral index of nausea. Surrogate markers of nausea in animal studies have included conditioned flavor aversion, pica, and physiological measures. Many of these studies have relied on the use of rats or mice, which, as rodents, lack a vomiting response (Andrews, 1995; Andrews and Horn, 2006; Horn et al., 2010a). It has been suggested that conditioned gaping in the rat, produced by taste aversion learning, could be used as a marker for nausea (Parker and Limebeer, 2006). However, injection of rats with emetic agents does not produce this response, and thus, gaping appears to be an emergent process of conditioning (Yamamoto et al., 2004). This indicates that the occurrence of gaping as an index of nausea is questionable. Laboratory rats also ingest kaolin clay (a pica response) when injected with toxins, such as cisplatin, and this response has been used as a marker of sickness (Takeda et al., 1993, 1995). The amount of clay ingestion in the rat induced by different chemotherapies is related to the emetic potency of these agents in humans (Yamamoto et al., 2007). Like conditioned gaping, it is difficult to relate the pica response to nausea in humans. Other metrics of nausea, such as salivation (Furukawa et al., 1998), gastric dysrhythmia (Percie Du Sert et al., 2009, 2010a), and systemic vasopressin release (Billig et al., 2001) occur in humans (Koch, 1997), but these can be difficult to measure and can require invasive procedures (Lau et al., 2005; Percie Du Sert et al., 2009, 2010a). The current results suggest a useful, non-invasive, approach to measuring sickness or nausea in an animal model.
On the other hand, these behavioral patterns associated with emesis must be validated with other emetic stimuli. For example, standard emetic inputs that include vestibular, area postrema, vagal, and conditioning (arguably a forebrain component) should be activated to determine emesis-related patterns (e.g., Andrews et al., 1996; Yamamoto et al., 2004; Parker et al., 2006; Rybak, 2007). Stimuli, such as cisplatin, have additional adverse effects beyond emesis or nausea. Cisplatin treatment produces hearing loss, kidney damage, and peripheral neuropathy and it is likely that these effects impact behavior (e.g., Yao et al., 2007; Joseph and Levine, 2009). It is unknown whether these potential drug-related behavioral actions would also be linked to emesis or would be defined as a new set of behavioral patterns. It is also unclear whether the time course of kidney damage, hearing loss, peripheral neuropathy, or other effects produced by cisplatin treatment in the current model system (using a specific drug dose) would overlap with the occurrence of emesis and other sickness phenomena, i.e., reduced feeding. Other stimuli, including emetic agents commonly used in emetic research (e.g., nicotine, intragastric copper sulfate) would have their own unique behavioral effects. Tests to determine the role of anti-emetic agents on behavioral patterns might also provide insight into the commonalities in behavioral patterns associated with emesis produced by different emetic treatments.
The current approach might eventually lead to a focus on patterns of behavioral change as appropriate targets for assessing the more global effects of potential anti-nausea drugs. Conversely, having a more thorough assessment of animal behavioral patterns might show potential limitations of anti-emetic drugs to control nausea and/or visceral sickness (reduced food intake). These approaches could open a new door into nausea and emesis research to examine behavioral patterns associated with vomiting that are produced by a large number of drugs and diseases. Complex high dimensional behavioral analyses have become a growing force in the field of behavioral neuroscience, particularly in the areas of anxiety and pain research (e.g., Bonasera et al., 2008; Ramos et al., 2008; Casarrubea et al., 2010a,b; Langford et al., 2010). Researchers have been challenged to find reproducible behavioral metrics of psychological states and it is increasingly clear that single measures are unreliable. We believe that this also applies to work in the field of nausea and emesis. The current study suggests a new approach that should foster the formation of computational models of behavioral change produced by emetic agents and facilitate drug development.
Conflict of Interest Statement
The authors declare that the research was conducted in the absence of any commercial or financial relationships that could be construed as a potential conflict of interest.
Acknowledgments
We wish to thank the University of Pittsburgh, Division of Laboratory Animal Research, especially Dawn Everard, Katie Leschak, Megan Lambert, and Dr. Joseph Newsome for excellent care of the musk shrew colony at the University of Pittsburgh Cancer Institute (UPCI). We gratefully acknowledge the funding support for this work from the Tobacco Settlement Fund (PA Department of Health) and NIH grants R01DK065971 and P30 CA047904 (Cancer Center Support Grant; CCSG).
References
Andrews, P., Torii, Y., Saito, H., and Matsuki, N. (1996). The pharmacology of the emetic response to upper gastrointestinal tract stimulation in Suncus murinus. Eur. J. Pharmacol. 307, 305–313.
Andrews, P. L., and Horn, C. C. (2006). Signals for nausea and emesis: implications for models of upper gastrointestinal diseases. Auton. Neurosci. 125, 100–115.
Andrews, P. L., Okada, F., Woods, A. J., Hagiwara, H., Kakaimoto, S., Toyoda, M., and Matsuki, N. (2000). The emetic and anti-emetic effects of the capsaicin analogue resiniferatoxin in Suncus murinus, the house musk shrew. Br. J. Pharmacol. 130, 1247–1254.
Bermudez, J., Boyle, E. A., Miner, W. D., and Sanger, G. J. (1988). The anti-emetic potential of the 5-hydroxytryptamine3 receptor antagonist BRL 43694. Br. J. Cancer 58, 644–650.
Billig, I., Yates, B. J., and Rinaman, L. (2001). Plasma hormone levels and central c-Fos expression in ferrets after systemic administration of cholecystokinin. Am. J. Physiol. Regul. Integr. Comp. Physiol. 281, R1243–R1255.
Bonasera, S. J., Schenk, A. K., Luxenberg, E. J., and Tecott, L. H. (2008). A novel method for automatic quantification of psychostimulant-evoked route-tracing stereotypy: application to Mus musculus. Psychopharmacology (Berl.) 196, 591–602.
Campos, D., Pereira, J. R., Reinhardt, R. R., Carracedo, C., Poli, S., Vogel, C., Martinez-Cedillo, J., Erazo, A., Wittreich, J., Eriksson, L. O., Carides, A. D., and Gertz, B. J. (2001). Prevention of cisplatin-induced emesis by the oral neurokinin-1 antagonist, MK-869, in combination with granisetron and dexamethasone or with dexamethasone alone. J. Clin. Oncol. 19, 1759–1767.
Casarrubea, M., Sorbera, F., Magnusson, M., and Crescimanno, G. (2010a). Temporal patterns analysis of rat behavior in hole-board. Behav. Brain Res. 208, 124–131.
Casarrubea, M., Sorbera, F., Magnusson, M. S., and Crescimanno, G. (2010b). T-pattern analysis of diazepam-induced modifications on the temporal organization of rat behavioral response to anxiety in hole board. Psychopharmacology (Berl.) 215, 177–189.
Castaner, M., Torrents, C., Anguera, M. T., Dinusova, M., and Jonsson, G. K. (2009). Identifying and analyzing motor skill responses in body movement and dance. Behav. Res. Methods 41, 857–867.
Chan, S. W., Rudd, J. A., Lin, G., and Li, P. (2007). Action of anti-tussive drugs on the emetic reflex of Suncus murinus (house musk shrew). Eur. J. Pharmacol. 559, 196–201.
Chawla, S. P., Grunberg, S. M., Gralla, R. J., Hesketh, P. J., Rittenberg, C., Elmer, M. E., Schmidt, C., Taylor, A., Carides, A. D., Evans, J. K., and Horgan, K. J. (2003). Establishing the dose of the oral NK1 antagonist aprepitant for the prevention of chemotherapy-induced nausea and vomiting. Cancer 97, 2290–2300.
Cleeland, C. S. (2007). Symptom burden: multiple symptoms and their impact as patient-reported outcomes. J. Natl. Cancer Inst. Monographs 37, 16–21.
De Jonghe, B. C., and Horn, C. C. (2009). Chemotherapy agent cisplatin induces 48-h Fos expression in the brain of a vomiting species, the house musk shrew (Suncus murinus). Am. J. Physiol. Regul. Integr. Comp. Physiol. 296, R902–R911.
Dodd, M. J., Miaskowski, C., and Lee, K. A. (2004). Occurrence of symptom clusters. J. Natl. Cancer Inst. Monographs 32, 76–78.
Fan, G., Filipczak, L., and Chow, E. (2007). Symptom clusters in cancer patients: a review of the literature. Curr. Oncol. 14, 173–179.
Furukawa, N., Fukuda, H., Hatano, M., Koga, T., and Shiroshita, Y. (1998). A neurokinin-1 receptor antagonist reduced hypersalivation and gastric contractility related to emesis in dogs. Am. J. Physiol. 275, G1193–G1201.
Hainsworth, J. D., and Hesketh, P. J. (1992). Single-dose ondansetron for the prevention of cisplatin-induced emesis: efficacy results. Semin. Oncol. 19, 14–19.
Henoch, I., Ploner, A., and Tishelman, C. (2009). Increasing stringency in symptom cluster research: a methodological exploration of symptom clusters in patients with inoperable lung cancer. Oncol. Nurs. Forum 36, E282–E292.
Hofman, M., Ryan, J. L., Figueroa-Moseley, C. D., Jean-Pierre, P., and Morrow, G. R. (2007). Cancer-related fatigue: the scale of the problem. Oncologist 12(Suppl. 1), 4–10.
Horn, C. C., Kimball, B. A., Gathright, G. R., Yates, B. J., and Andrews, P. L. R. (2010a). “Why don’t rats and mice vomit? A behavioral and anatomical investigation,” in Society for the Study of Ingestive Behavior annual meeting, Pittsburgh, PA, USA.
Horn, C. C., Still, L., Fitzgerald, C., and Friedman, M. I. (2010b). Food restriction, refeeding, and gastric fill fail to affect emesis in musk shrews. Am. J. Physiol. Gastrointest. Liver Physiol. 298, G25–G30.
Huang, D., Meyers, K., Henry, S., De La Torre, F., and Horn, C. C. (2011). Computerized detection and analysis of cancer chemotherapy-induced emesis in a small animal model, musk shrew. J. Neurosci. Methods 197, 249–258.
Ishii, K., Uchino, M., Kuwahara, M., Tsubone, H., and Ebukuro, S. (2002). Diurnal fluctuations of heart rate, body temperature and locomotor activity in the house musk shrew (Suncus murinus). Exp. Anim. 51, 57–62.
Joseph, E. K., and Levine, J. D. (2009). Comparison of oxaliplatin- and cisplatin-induced painful peripheral neuropathy in the rat. J. Pain. 10, 534–541.
Kaley, T. J., and Deangelis, L. M. (2009). Therapy of chemotherapy-induced peripheral neuropathy. Br. J. Haematol. 145, 3–14.
Kemp, A. S., Fillmore, P. T., Lenjavi, M. R., Lyon, M., Chicz-Demet, A., Touchette, P. E., and Sandman, C. A. (2008). Temporal patterns of self-injurious behavior correlate with stress hormone levels in the developmentally disabled. Psychiatry Res. 157, 181–189.
Kent, S., Bluthe, R. M., Kelley, K. W., and Dantzer, R. (1992). Sickness behavior as a new target for drug development. Trends Pharmacol. Sci. 13, 24–28.
Kerepesi, A., Jonsson, G. K., Miklosi, A., Topal, J., Csanyi, V., and Magnusson, M. S. (2005). Detection of temporal patterns in dog-human interaction. Behav. Processes 70, 69–79.
Kim, S., and Smyth, P. (2006). Segmental hidden Markov models with random effects for waveform modeling. J. Mach. Learn. Res. 7, 945–969.
Kirkova, J., Walsh, D., Aktas, A., and Davis, M. P. (2010). Cancer symptom clusters: old concept but new data. Am. J. Hosp. Palliat. Care 27, 282–288.
Koch, K. L. (1997). A noxious trio: nausea, gastric dysrhythmias and vasopressin. Neurogastroenterol. Motil. 9, 141–142.
Langford, D. J., Bailey, A. L., Chanda, M. L., Clarke, S. E., Drummond, T. E., Echols, S., Glick, S., Ingrao, J., Klassen-Ross, T., Lacroix-Fralish, M. L., Matsumiya, L., Sorge, R. E., Sotocinal, S. G., Tabaka, J. M., Wong, D., Van Den Maagdenberg, A. M., Ferrari, M. D., Craig, K. D., and Mogil, J. S. (2010). Coding of facial expressions of pain in the laboratory mouse. Nat. Methods 7, 447–449.
Lau, A. H., Rudd, J. A., and Yew, D. T. (2005). Action of ondansetron and CP-99,994 on cisplatin-induced emesis and locomotor activity in Suncus murinus (house musk shrew). Behav. Pharmacol. 16, 605–612.
Lyon, M., and Kemp, A. S. (2004). Increased temporal patterns in choice responding and altered cognitive processes in schizophrenia and mania. Psychopharmacology (Berl.) 172, 211–219.
Magnusson, M. S. (2000). Discovering hidden time patterns in behavior: T-patterns and their detection. Behav. Res. Methods Instrum. Comput. 32, 93–110.
Magnusson, M. S. (2006). “Structure and communication in interactions,” in Communication to Presence: Cognition, Emotions and Culture Towards the Ultimate Communicative Experience. Festschrift in Honor of Luigi Anolli, eds G. Riva, M. T. Anguera, B. K. Wiederhold, and F. Mantovani (Amsterdam: IOS Press), 127–146.
Miaskowski, C., Aouizerat, B. E., Dodd, M., and Cooper, B. (2007). Conceptual issues in symptom clusters research and their implications for quality-of-life assessment in patients with cancer. J. Natl. Cancer Inst. Monographs 37, 39–46.
Miaskowski, C., Dodd, M., and Lee, K. (2004). Symptom clusters: the new frontier in symptom management research. J. Natl. Cancer Inst. Monographs 32, 17–21.
Oh, S. M., Rehg, J. M., Balch, T., and Dellaert, F. (2008). Learning and inferring motion patterns using parametric segmental switching linear dynamic systems. Int. J. Comput. Vis. 77, 103.
Olver, I., Molassiotis, A., Aapro, M., Herrstedt, J., Grunberg, S., and Morrow, G. (2011). Antiemetic research: future directions. Support. Care Cancer. 19(Supp. 1), S49–S55.
Parker, L. A., Kwiatkowska, M., and Mechoulam, R. (2006). Delta-9-tetrahydrocannabinol and cannabidiol, but not ondansetron, interfere with conditioned retching reactions elicited by a lithium-paired context in Suncus murinus: an animal model of anticipatory nausea and vomiting. Physiol. Behav. 87, 66–71.
Parker, L. A., and Limebeer, C. L. (2006). Conditioned gaping in rats: a selective measure of nausea. Auton. Neurosci. 129, 36–41.
Percie Du Sert, N., Chu, K. M., Wai, M. K., Rudd, J. A., and Andrews, P. L. (2009). Reduced normogastric electrical activity associated with emesis: a telemetric study in ferrets. World J. Gastroenterol. 15, 6034–6043.
Percie Du Sert, N., Chu, K. M., Wai, M. K., Rudd, J. A., and Andrews, P. L. (2010a). Telemetry in a motion-sickness model implicates the abdominal vagus in motion-induced gastric dysrhythmia. Exp. Physiol. 95, 768–773.
Percie Du Sert, N., Rudd, J. A., Apfel, C. C., and Andrews, P. L. (2010b). Cisplatin-induced emesis: systematic review and meta-analysis of the ferret model and the effects of 5-HT(3) receptor antagonists. Cancer Chemother. Pharmacol. 67, 667–686.
Ramos, A., Pereira, E., Martins, G. C., Wehrmeister, T. D., and Izidio, G. S. (2008). Integrating the open field, elevated plus maze and light/dark box to assess different types of emotional behaviors in one single trial. Behav. Brain Res. 193, 277–288.
Rissman, E. F., Silveira, J., and Bronson, F. H. (1988). Patterns of sexual receptivity in the female musk shrew (Suncus murinus). Horm. Behav. 22, 186–193.
Rybak, L. P. (2007). Mechanisms of cisplatin ototoxicity and progress in otoprotection. Curr. Opin. Otolaryngol. Head Neck Surg. 15, 364–369.
Sam, T. S., Cheng, J. T., Johnston, K. D., Kan, K. K., Ngan, M. P., Rudd, J. A., Wai, M. K., and Yeung, J. H. (2003). Action of 5-HT3 receptor antagonists and dexamethasone to modify cisplatin-induced emesis in Suncus murinus (house musk shrew). Eur. J. Pharmacol. 472, 135–145.
Sanger, G. J., and Andrews, P. L. (2006). Treatment of nausea and vomiting: gaps in our knowledge. Auton. Neurosci. 129, 3–16.
Takeda, N., Hasegawa, S., Morita, M., Horii, A., Uno, A., Yamatodani, A., and Matsunaga, T. (1995). Neuropharmacological mechanisms of emesis. II. Effects of antiemetic drugs on cisplatin-induced pica in rats. Methods Find. Exp. Clin. Pharmacol. 17, 647–652.
Takeda, N., Hasegawa, S., Morita, M., and Matsunaga, T. (1993). Pica in rats is analogous to emesis: an animal model in emesis research. Pharmacol. Biochem. Behav. 45, 817–821.
Warr, D. G., Grunberg, S. M., Gralla, R. J., Hesketh, P. J., Roila, F., Wit, R., Carides, A. D., Taylor, A., Evans, J. K., and Horgan, K. J. (2005). The oral NK(1) antagonist aprepitant for the prevention of acute and delayed chemotherapy-induced nausea and vomiting: pooled data from 2 randomised, double-blind, placebo controlled trials. Eur. J. Cancer 41, 1278–1285.
Watson, J. W., Gonsalves, S. F., Fossa, A. A., Mclean, S., Seeger, T., Obach, S., and Andrews, P. L. (1995). The anti-emetic effects of CP-99,994 in the ferret and the dog: role of the NK1 receptor. Br. J. Pharmacol. 115, 84–94.
Yamamoto, K., Nakai, M., Nohara, K., and Yamatodani, A. (2007). The anti-cancer drug-induced pica in rats is related to their clinical emetogenic potential. Eur. J. Pharmacol. 554, 34–39.
Yamamoto, K., Ngan, M. P., Takeda, N., Yamatodani, A., and Rudd, J. A. (2004). Differential activity of drugs to induce emesis and pica behavior in Suncus murinus (house musk shrew) and rats. Physiol. Behav. 83, 151–156.
Yao, X., Panichpisal, K., Kurtzman, N., and Nugent, K. (2007). Cisplatin nephrotoxicity: a review. Am. J. Med. Sci. 334, 115–124.
Keywords: emesis, vomiting, nausea, conditioned taste aversion, pica, avoidance, anorexia, cancer
Citation: Horn CC, Henry S, Meyers K and Magnusson MS (2011) Behavioral patterns associated with chemotherapy-induced emesis: a potential signature for nausea in musk shrews. Front. Neurosci. 5:88. doi: 10.3389/fnins.2011.00088
Received: 13 May 2011; Accepted: 25 June 2011; Published online: 14 July 2011.
Edited by:
Margaret A. Vizzard, University of Vermont College of Medicine, USAReviewed by:
John A. Rudd, Chinese University of Hong-Kong, ChinaThomas Houpt, Florida State University, USA
Copyright: © 2011 Horn, Henry, Meyers and Magnusson. This is an open-access article subject to a non-exclusive license between the authors and Frontiers Media SA, which permits use, distribution and reproduction in other forums, provided the original authors and source are credited and other Frontiers conditions are complied with.
*Correspondence: Charles C. Horn, Hillman Cancer Center – Research Pavilion, University of Pittsburgh Cancer Institute, G.17b, 5117 Centre Avenue, Pittsburgh, PA 15213, USA. e-mail: chorn@pitt.edu