 Nabil Imam1,2* Thomas A. Cleland3 Rajit Manohar1 Paul A. Merolla2 John V. Arthur2 Filipp Akopyan2 Dharmendra S. Modha2
- 1 Computer Systems Lab, Department of Electrical and Computer Engineering, Cornell University, Ithaca, NY, USA
- 2 Cognitive Computing Lab, IBM Research – Almaden, San Jose, CA, USA
- 3 Computational Physiology Lab, Department of Psychology, Cornell University, Ithaca, NY, USA
We present a biomimetic system that captures essential functional properties of the glomerular layer of the mammalian olfactory bulb, specifically including its capacity to decorrelate similar odor representations without foreknowledge of the statistical distributions of analyte features. Our system is based on a digital neuromorphic chip consisting of 256 leaky-integrate-and-fire neurons, 1024 × 256 crossbar synapses, and address-event representation communication circuits. The neural circuits configured in the chip reflect established connections among mitral cells, periglomerular cells, external tufted cells, and superficial short-axon cells within the olfactory bulb, and accept input from convergent sets of sensors configured as olfactory sensory neurons. This configuration generates functional transformations comparable to those observed in the glomerular layer of the mammalian olfactory bulb. Our circuits, consuming only 45 pJ of active power per spike with a power supply of 0.85 V, can be used as the first stage of processing in low-power artificial chemical sensing devices inspired by natural olfactory systems.
Introduction
Natural odor environments consist of complex, noisy, and high-dimensional combinations of chemical features derived from many different sources. Biological olfactory systems detect potential signals of interest in these environments, extract and classify the relevant feature combinations, associate them with memories, and determine appropriate responses. Insights into the physiological and molecular mechanisms of signal transduction and subsequent processing in the olfactory system have revealed much about the algorithms with which neural circuits solve these complex computational problems (Cleland and Linster, 2005, 2009; Cleland, 2010), providing critical insights applicable to machine olfaction.
The diagnostic feature of “artificial olfaction” within the larger scope of chemosensor research has been the use of large arrays of diverse, relatively non-specific primary sensors followed by some form of pattern recognition to identify particular analytes based on specific response patterns across the sensor array (Persaud and Dodd, 1982). Presently, most artificial olfaction research is focused on sensor technology; for example, metal oxide transistors (Gonzalez-Jimenez et al., 2011), polymer-immobilized fluorescent dyes (Dickinson et al., 1996), metalloporphyrins (Paolesse et al., 2008), conductive polymer arrays (Beccherelli et al., 2010) and fiber webs (Zampetti et al., 2011), and even carbon nanotube transistors functionalized for diversity with single-strand DNA (Staii et al., 2005) or by coupling to G-protein coupled receptors (Goldsmith et al., 2011) have been developed to try and increase the sensitivity and diversity of primary analyte detection while reducing the costs and practical difficulties of deployment (Hierlemann and Gutierrez-Osuna, 2008). Somewhat less attention, however, has been paid to the subsequent analysis of these response patterns in artificial systems. Typically, activated sensor arrays are analyzed using a variety of general pattern recognition algorithms (Gutierrez-Osuna, 2002). However, biomimetic algorithms inspired by the olfactory bulb also have been developed for this purpose (reviewed in Marco and Gutierrez-Galvez, 2009), some implementing key biological features such as the chemotopic convergence of multiple instances of a given sensor onto a single circuit element and/or contrast enhancement to improve the discriminability of similar analytes by decorrelating their response patterns (Gutierrez-Galvez and Gutierrez-Osuna, 2006; Raman et al., 2006). Current in silico algorithms, however, still lack many of the important capabilities of biological olfaction. For example, none perform contrast enhancement in the native, high-dimensional similarity space of an arbitrary chemosensor array, but rather implement topographical (two-dimensional) lateral inhibitory networks that are necessarily mismatched to these similarity spaces. The high-dimensional, non-topographical contrast enhancement (NTCE) algorithm implemented here not only enhances odor decorrelation while retaining sensitivity (Cleland, 2010; Cleland and Linster, 2012), but also supports the dynamic regulation of contrast enhancement efficacy (Mandairon et al., 2006; Chaudhury et al., 2009), potentially optimizing the degree of decorrelation in service to a process of selective categorization (Cleland et al., 2012). Additional operations such as limited concentration invariance, progressive adaptation to the statistics of the chemical environment, and the utilization of odor memory also appear to be critical components of biological olfaction and require post-transduction neural computations within the olfactory bulb (Cleland and Sethupathy, 2006; Cleland et al., 2007, 2012; Sultan et al., 2010). Implementation of these sophisticated biomimetic algorithms should substantially improve the performance and robustness of artificial chemosensory systems.
Artificial chemosensory systems are typically used in mobile platforms where strict energy and real-estate budgets need to be met. Therefore it is critical that low-power and low-area hardware is developed to support the neural algorithms. Commodity chip solutions [DSPs (Shi et al., 2006); GPUs (Nageswaran et al., 2009); or FPGAs (Maguire et al., 2007)] are not natural fits to the parallel and event-driven nature of neural computations. Specifically, these chips require high bandwidth to transmit spikes effectively between processor and memory. To achieve real-time performance, clock speeds are typically run in the gigahertz range, leading to high power consumption that limits scaling. In contrast, custom Very Large-Scale Integration (VLSI) implementations of large-scale biologically inspired neural networks enable development of low-power, low-area, and highly scalable solutions. These neuromorphic chips implement models of biological neurons (Indiveri et al., 2011) and their networks (Scholze et al., 2011) directly in silicon, and have been used in real-time and low-power visual (Yu et al., 2005) and auditory (Liu et al., 2010) systems. However, neuromorphic implementations of olfactory bulb networks are relatively new (Koickal et al., 2006; Beyeler et al., 2010), and do not yet incorporate the more sophisticated algorithms described above.
In this paper, we present an implementation of glomerular-layer circuitry from the mammalian olfactory bulb in a digital neurosynaptic core (Merolla et al., 2011). The core operates with ultra-low energy consumption by using event-driven asynchronous circuits and a crossbar synapse array that efficiently implements large neural fan out. The mapping of the neural circuits in the core is columnar, designed to be driven by an array of sensors incorporating chemotopic convergence. That is, multiple sensors of the same type converge onto each columnar circuit (glomerulus), and different sensor types in the array drive different columnar circuits on the core. Chemotopic convergence increases the signal-to-noise ratio, and thereby also increases the sensitivity of the system. It also can enhance concentration invariance (Cleland et al., 2012), an important necessity for sensor types that, like olfactory G–protein coupled receptors themselves, have relatively narrow concentration tuning ranges. The NTCE algorithm (Cleland and Sethupathy, 2006) is then computed within each columnar circuit, with competitive normalization computed across columns (Cleland et al., 2007). Our implementation consists of 48 columnar circuits, each incorporating 10 convergent sensor inputs as well as all of the cell types necessary to produce these functional transformations. The “secondary representation” generated by this chip can be passed to higher-order biomimetic neural circuits, or to standard pattern recognition engines, for further transformation and analysis.
The paper is organized as follows: Section “Computations of the Olfactory Bulb Glomerular Layer” describes the major transformations of odor representations performed by the mammalian olfactory bulb. Section “Materials and Methods” provides an overview of the chip and its configuration to replicate glomerular-layer circuitry. Section “Results” illustrates the functionality and the performance of the chip when driven by patterned input representing the output of chemosensor arrays. Section “Conclusion” discusses the scalability of the chip and outlines some planned enhancements of the design to replicate additional higher-level functions of biological olfactory systems.
Computations of the Olfactory Bulb Glomerular Layer
In biological olfaction, inhaled odorants associate with olfactory receptors (ORs) expressed on the apical cilia of olfactory sensory neurons (OSNs) that line the nasal cavity (a circuit diagram depicting OSN projections and the olfactory bulb glomerular layer is depicted in Figure 1). ORs are typical G-protein coupled receptors, but are hugely diverse in their ligand selectivities; overall, roughly 350 different functional ORs are expressed in humans, and over 1000 in mice and rats. The range of odor ligand features that bind to and activate a given OR constitute its chemoreceptive field (aka molecular receptive range). The chemoreceptive fields of different ORs overlap substantially, such that odors – even those comprising only one type of molecule – will activate a substantial fraction of the available ORs to a greater or lesser degree. It is the combinatorial pattern across the set of receptors that forms the basis for odor perception and identification, and, importantly, the basis for odor similarity. Perceptually similar odors activate a correspondingly greater number of common ORs, and evoke more highly overlapping primary odor representations. However, perceptual similarity is also substantially regulated by centrifugal neuromodulatory inputs and by intrinsic learning (Cleland et al., 2009; Mandairon and Linster, 2009), and mediated by the intrinsic circuitry of olfactory bulb.
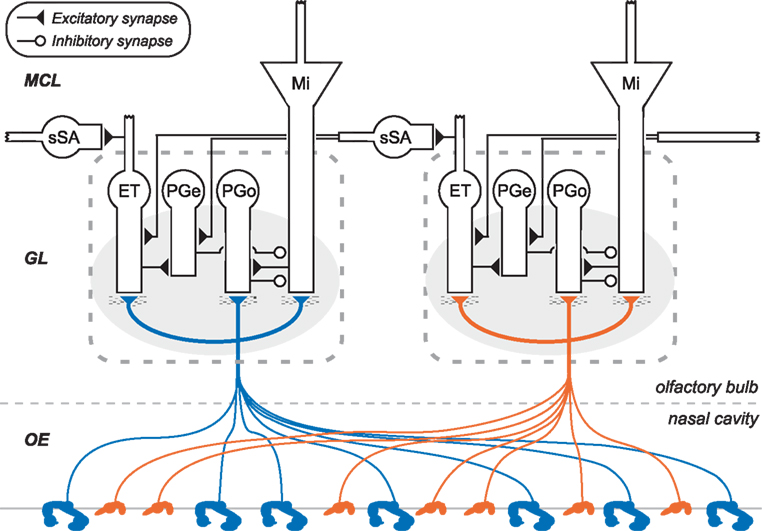
Figure 1. Circuit diagram of the mammalian olfactory bulb glomerular layer (two columns depicted). Olfactory sensory neurons (OSNs), housed in the olfactory epithelium of the nasal cavity (OE), project their axons into olfactory bulb. OSN axons expressing the same odorant receptor type converge to form glomeruli (shaded ovals) on the surface of the olfactory bulb, within which they interact with multiple classes of olfactory bulb principal neurons and interneurons. Principal neurons include mitral cells (Mi) and middle/deep tufted cells (often considered together with mitral cells; not shown). Glomerular interneurons include olfactory nerve-driven periglomerular cells (PGo), external tufted (ET) cell-driven periglomerular cells (PGe), and multiple subtypes of ET cells; both types of PG cells inhibit mitral cells. Superficial short-axon cells (sSA) are not associated with specific glomeruli but project broadly and laterally within the deep glomerular layer, interacting with glomerular interneurons. GL, glomerular layer; MCL, mitral cell layer. Deeper layers of olfactory bulb (Cleland, 2010) are not depicted.
There are on the order of millions of OSNs in the nose, and on the order of thousands of OSNs that express any given OR. In mammals, the axons of OSNs that express the same OR selectively converge together to a common glomerulus; consequently, olfactory bulb glomeruli inherit the basic chemoreceptive field of exactly one OR. Despite this uniformity, convergent OSN populations are not necessarily identical in all ways. A hypothesized diversity in receptor reserve levels among convergent OSNs may be responsible for spreading out their concentration specificities, such that the glomerulus in aggregate enjoys a substantially broader dynamic range across odorant concentrations than can be achieved by any single OR (Cleland and Linster, 1999). This is an important feature contributing to concentration invariance in models of biological olfaction (Cleland et al., 2012), and which could be implemented in some types of artificial chemosensor arrays. Even in the absence of such diversity in ligand-receptor dissociation constants, chemotopic convergence will improve the signal-to-noise ratio within convergent populations and hence the maximum odorant sensitivity measured at the glomerulus. The chip described herein is configured to receive 10 convergent sensor inputs per “glomerular” column.
On-center/inhibitory surround contrast enhancement has been observed in mitral cells (second-order principal neurons; Figure 1) along a trajectory of odor similarity (Yokoi et al., 1995). Critically, such maps of similarity among the aggregate chemoreceptive fields of all glomeruli in the olfactory bulb are intrinsically high-dimensional. That is, if OR chemoreceptive fields are compactly modeled (e.g., as hyperellipses), there are no low-dimensional solutions to the problem of mapping all of these fields into a common space such that all of their similarity relationships (degrees of pairwise overlap) are respected. Consequently, the glomerular layer does not contain a true map of odor similarity or perceptual quality, but does comprise a lookup table of OR chemoreceptive fields (Murthy, 2011). This becomes important because decorrelation operations such as contrast enhancement are similarity-dependent computations; that is, to sharpen an odor representation, the contrast enhancement operation must operate within this high-dimensional similarity space such that the “edges” of the odor representation are selectively inhibited. Two-dimensional algorithms such as lateral inhibition are wholly ineffective in this environment (Cleland and Sethupathy, 2006), except to the extent that disordered inhibition (which does not generate an inhibitory surround) can decorrelate such representations by broadly reducing sensitivity (Cleland and Linster, 2012). In the olfactory bulb, high-dimensional contrast enhancement arises via an intra-glomerular, non-topographical computation based on OSN input to mitral cells paired with feed-forward inhibition via olfactory nerve-driven periglomerular (PGo) cells. Briefly, at lower relative input levels (i.e., compared to the overall activity across all glomeruli), the feed-forward inhibition dominates, inhibiting mitral cells below baseline to generate the inhibitory surround. At higher relative input levels, direct OSN excitation overcomes PGo-mediated inhibition such that the mitral cell is excited by the odor. The net effect is that the most highly excited mitral cells are activated, whereas mitral cells that receive only moderate levels of OSN input are selectively and disproportionately inhibited, thereby generating surround inhibition in the native similarity space of the sensor array. Importantly, from an artificial systems perspective, this property enables contrast enhancement to be performed on input from any arbitrary sensor complement without the need for sensor-specific programming. The chip described herein replicates this functionality (Figure 9), while replacing the shunting inhibition-based biological mechanism with a low-power spike-based algorithm.
The NTCE algorithm requires global normalization to generate relational representations. The existence of a normalization circuit in olfactory bulb can be inferred in that, unlike OSNs, mitral cells do not exhibit monotonic increases in activation as ligand concentrations increase, instead exhibiting a variety of profiles including transitions from excitation to inhibition or vice versa. A competitive normalization algorithm based on external tufted (ET) cells, ET cell-driven periglomerular (PGe) cells, and superficial short-axon (sSA) cells has been proposed that delivers global feedback inhibition based on an estimate of aggregate input levels computed without requiring all-to-all connectivity, essentially by invoking small-world effects (Cleland et al., 2007; Cleland, 2010). Briefly, the ET/sSA circuit integrates heterogenous activity level across the layer and delivers a uniform level of excitation onto PGe cells in each glomerulus, which in turn inhibit their co-glomerular mitral cells. In the biological system, this circuit conserves volume and energy by reducing neuron numbers and interneuronal connectivity density in the glomerular layer. Interestingly, in the present implementation, normalization via a small-world distributed integrator based on these same cell types and circuits also substantially reduces circuit footprint and power consumption over that required by a global integrator.
Glomerular-layer circuits in the olfactory bulb transform raw OSN input into a secondary odor representation, mediated by mitral cells, upon which further transformations are performed by subsequent circuits such as deep olfactory bulb, anterior olfactory nucleus, and piriform cortex. The neuromorphic implementation of glomerular-layer circuitry described in subsequent sections generates normalized output that enables a powerful and potentially adjustable decorrelation of odor representations generated by arbitrary sensor arrays and contributes substantially to resolving the extremely difficult problem of rejecting concentration-dependent variance (Cleland et al., 2012). Subsequent operations of the biological olfactory system, including the generation and utilization of olfactory learning and memory as well as mechanistic processes such as the regulation of spike timing, are not implemented in the present design.
Materials and Methods
Chip Architecture
The digital neurosynaptic core in the chip consists of 256 single-compartment leaky-integrate-and-fire neurons, a 1024 × 256 crossbar synapse array, and communication circuits to transfer spike trains (Figure 2). The crossbar array is freely configurable so that arbitrary networks can be set up in the system. Each row of the crossbar corresponds to an axon which is driven by off-chip sensor arrays or by one of the on-chip neurons. Each column corresponds to a dendrite of a particular neuron. A memory cell resides at each intersection of a row and a column, and the state of this cell represents whether or not a connection exists between that particular axon-dendrite pair. Hence, each neuron may receive up to 1024 synaptic inputs (via its dendrite) depending on the configuration of the crossbar and the activity of the axons.
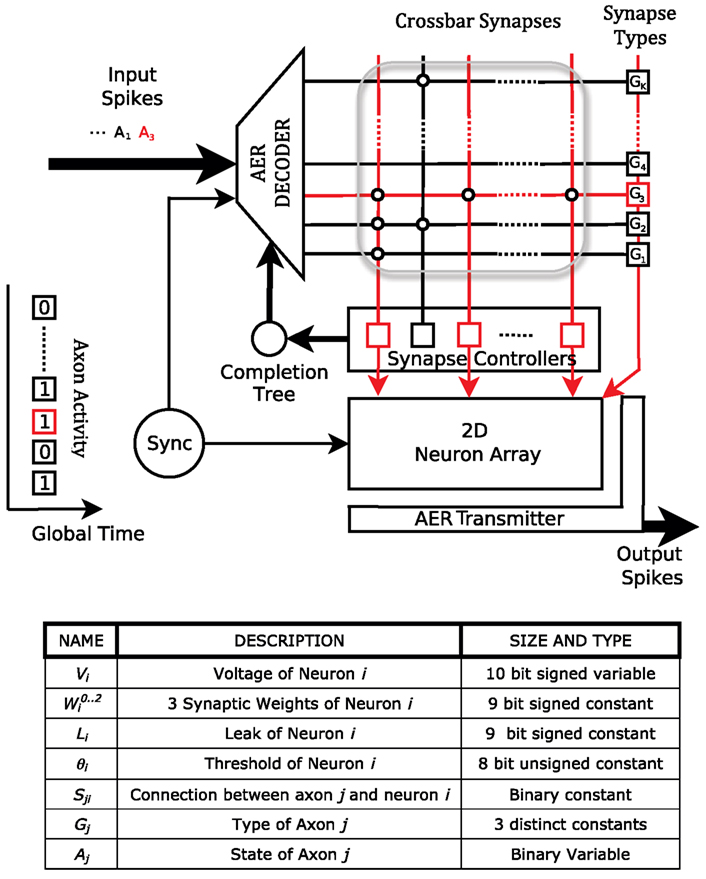
Figure 2. Top: The architecture of the neurosynaptic core. Each core consists of an array of neurons, a crossbar array of synapses (bounded by gray box) and AER receiver (decoder) and transmitter. Each junction in the crossbar represents a potential synapse between an axon (row) and dendrite (column). An example sequence of events in the core is illustrated. The AER decoder accepts an incoming address event and activates axon 3 (A3) by asserting the third wordline of the SRAM crossbar array. As a result, a synaptic event of type G3 is delivered to neurons N1, N3, and NM. The AER transmitter sends out the addresses of these neurons if they consequently spike. Bottom: Parameters and state variables of the system.
The dynamics of the core are driven by a discrete time step. At each time step t, each axon j is presented with an activity bit Aj(t) driven by its input (off-chip sensor or associated neuron). An axon can be one of three distinct types Gj that determine the polarity and efficacy of the synapses it makes onto dendrites. This information is stored in the crossbar memory along with the state Wji (i.e., existence) of each row-column intersection. Each postsynaptic neuron i weighs the synaptic input from axon j of type Gj with a weight that is configurable and can take integer values between −256 and +255. Thus, each neuron stores three distinct (and configurable) weight values that it respectively assigns to each of the three different types of synapses. This can, for example, distinguish between a strongly excitatory, a weakly excitatory, and an inhibitory synapse. Axon j therefore delivers the following synaptic input to each neuron i:
In addition to the weights of the input synapses along their dendrites, each neuron is also characterized by configurable leak L and threshold θ values. At each time step, the neuron voltages are updated as:
If the updated voltage of a neuron exceeds its threshold θ, the neuron emits a spike and resets its voltage to 0. The spike is sent off-chip and may be routed back onto the axons of the core through peripheral circuits. Neurons in the core communicate in this way.
Event-Driven Implementation
We implemented the architecture using asynchronous quasi-delay-insensitive (QDI; Martin, 1990) circuits that are globally synchronized with a clock. The use of QDI circuits keeps the dynamic power consumption of the core to a minimum during periods of low spiking activity. The global synchronization ensures strict correspondence between a neural algorithm running on the hardware and an equivalent algorithm running in a software neural network simulator. The period of the global clock is configured to 1 ms to enable the chip to operate in real-world environments.
Due to their use of physical primitives for computation, analog circuits have traditionally been the popular method for implementing low-power, small-footprint silicon neurons, whereas reliable digital circuits have been used for spike communication. Dense analog circuits, however, are sensitive to fabrication process variations, ambient temperature, and noisy environments, making it difficult to configure functional circuits that operate reliably under a wide range of external parameters. In contrast, our implementation is fully digital, making it completely deterministic by design and functionally equivalent to neural networks coded in software; that is, the activities of neurons in equivalent software and hardware implementations are identical at every time step. This greatly facilitates the design and configuration of specific neural circuits, and contributes to reliable operations. Despite the purely digital implementation, we were able to meet tight area budgets by utilizing new fabrication technologies in which increasing subthreshold currents and the lack of high-density capacitors render analog implementations even more difficult and unreliable. Low-power budgets also were met by using event-driven QDI circuits that drive active current only when useful computation is taking place (Manohar, 2000). QDI circuits also are particularly robust because their correct operation is independent of the timing parameters of the implementation. Consequently, they remain operational under a wide range of voltage and temperature variations, making them ideally suited for mobile, embedded systems.
Every block in the system carries out request-acknowledge handshakes with its neighbors. An example sequence of events in the core is illustrated in Figure 2. The crossbar is constructed with standard 6T SRAM cells. A receiver decodes axon addresses coming in due to spikes from on-chip neurons or from external sensors, and asserts the rows (or wordlines) of the crossbar one by one. An axon event is thus expressed as the assertion of a wordline in the memory array. This causes the synapse controllers to concurrently communicate with neurons whose dendrites (crossbar columns) have a connection with that particular axon (i.e., with the neurons corresponding to the 1-s in the crossbar row). Along with the communication of an axon event, type information Gj about the axon also is sent to the neuron. The neurons are implemented with standard asynchronous control and datapath blocks that implement the voltage updates. Spikes from the neurons are communicated out of the core through efficient asynchronous address-event representation (AER) transmitter circuits (Imam and Manohar, 2011) that send out spiking neuron addresses through a multiplexed channel. These addresses can be communicated out of the system, or can be routed back to the crossbar array with an appropriate axon address.
To ensure that the operation of the hardware after every time step is equivalent to a software simulation running the same neural algorithm, we divide the neuron and synapse updates into two phases. The positive edge of a global synchronization clock (“Sync” in Figure 2) initiates the first phase of operation. In this phase, the axons are asserted one by one and synaptic information is delivered to the neurons. The negative edge of the clock initiates the second phase of operation, during which the neuron voltages are updated and spikes are communicated out of the system or routed back to the AER receiver. The order in which spikes arrive at the core or are sent out of the core can be variable due to resource arbitration in the communication circuits. By first accounting for all the synaptic events and then checking for spikes in the neurons, we ensure that the hardware is in lockstep with an equivalent software simulation.
The core was fabricated in a 45-nm CMOS SOI process. To test it, we built a custom printed circuit board (Figure 3) that can interface with virtual and real environments through a USB link. This link also enables us to configure the parameters of the neurons and synapses in the core. The chip consumes only 45 pJ of active power per spike, and produces 1–1 correspondence with neural algorithms running on a software simulator (Merolla et al., 2011).
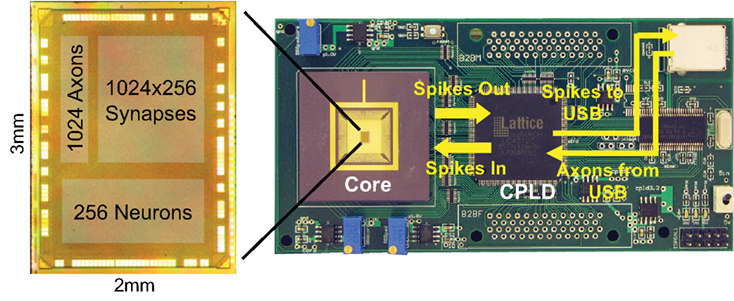
Figure 3. The fabricated chip on the test board. Spike events are sent to a PC via a USB 2.0 link and may also be routed back to the chip.
Network Configuration
The crossbar states and neuronal parameters were configured to replicate the connections among neurons in the glomerular layer of the mammalian olfactory bulb. A glomerular column in the core was represented by configuring five neurons (corresponding to mitral, PGo, ET, PGe, and sSA cells) and their interconnections (via the crossbar) according to the circuit diagram of Figure 1. This enabled 48 columns to be implemented on one core with each row of the 16 × 16 neuron array consisting of 3 glomerular columns. The crossbar was also configured such that a glomerular column would receive input from 10 convergent sensor inputs. Notably, in part because of the non-topographical architecture and small-world normalization schemes, the system is readily scalable both in terms of the numbers of neurons and synapses per core and in terms of the number of cores.
In lieu of actual sensors, we simulated the presentation of odors with 48-dimensional combinatorial activity patterns, each dimension representing the level of activation of one sensor type. Each of these input dimensions was mediated by 10 OSNs, each capable of an arbitrary number of activation levels represented by stochastic spike rates. The presence of a particular odorant was simulated with a characteristic pattern of relative activation levels of the sensors. The sensors were assumed to be broadly tuned and sensitive to concentration, each responding with a specific intensity to an odorant and each showing monotonic rise in activity as the concentration of the odorant increased. The OSNs were assumed to reside outside of the core and to provide spiking input to the core through the rows of the crossbar. The 10 inputs associated with the same sensor type were implemented homogeneously and projected convergently to the same glomerular column as depicted in Figure 4. The activation of a sensor was simulated by sending AER packets (“spikes”) into the core (to address the crossbar rows associated with the sensor) at a frequency corresponding to the activation level. At each time step, sensors that were highly responsive to a presented odorant had a higher probability of sending in AER packets into the core, compared to sensors that were less responsive. Consequently, any sensor that can be configured to output AER packets at a frequency proportional to its activation level can be used effectively with this chip.
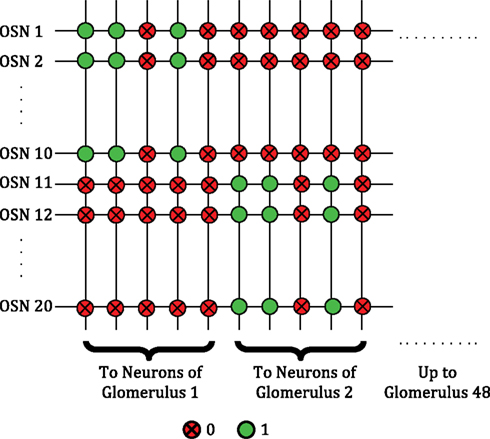
Figure 4. Crossbar connectivity depicting the convergence of OSNs expressing the same receptor type to the same glomerulus. A total of 48 distinct glomerular columns are implemented in one core.
The internal connections of each glomerular column were implemented by routing the spikes sent out of the core back to axons that connected to the appropriate column of the crossbar. For example, the reciprocal connections between mitral and PGo cells are illustrated in Figure 5. In biological olfactory bulbs, PGo cells short-circuit excitatory currents that are synaptically evoked in a mitral cell and thereby shunt the effects of OSN excitation. However, in our system, neurons only communicate through spikes. We replicated the effects of this shunt inhibition by configuring each mitral cell such that the activity of a spiking inhibitory PGo cell is integrated to shut down the effects of subsequent excitation that the mitral cell receives from the OSNs. The PGo cells were configured such that their spike rates saturated above a certain OSN activation level, ensuring that higher OSN activation levels will overpower PGo inhibition and enable excitation of the mitral cell. Setting the saturation level of the PGo cells is one way in which the degree of contrast enhancement can be adjusted in this circuit.
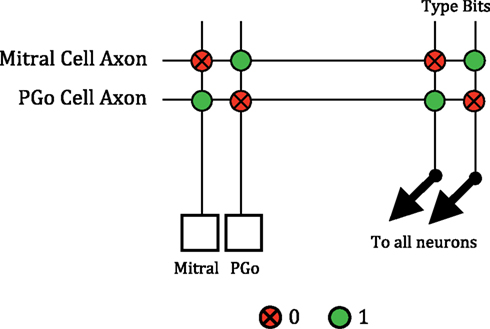
Figure 5. The reciprocal connections between mitral and PGo cells. Spikes from the mitral or PGo cell are sent off-chip by the AER transmitter and routed back to the appropriate axon. The mitral cell is configured so that a “10” type synapse is given a negative weight during synaptic integration. The spike of a PGo cell is routed to its axon in the crossbar which is configured to have a “10” type connection to inhibit the mitral cell. Similarly, the PGo cell is configured so that a “01” type synapse is given a positive weight. The mitral cell axon produces this type of synapse with the PGo cell to excite it.
The dense lateral network formed by ET and sSA cells has small-world-like connectivity (Cleland et al., 2007; Cleland, 2010; Figure 6A). This enables the integration of activity across the glomerular layer at a fraction of the energy and volume costs that would have been incurred with all-to-all connections. We followed this insight to configure an ET/sSA network in our chip (Figure 6B). The projection topology was sparse – a total of 10 sSA cells projected axons to a given glomerular column – and reflected a scaled version of the actual connectivity profile observed in the mouse olfactory bulb (Aungst et al., 2003). While the physical proximity of glomerular circuits on the chip is computationally irrelevant, for illustrative purposes we utilized their locations to organize the distribution of connectivity to resemble that of the ET/sSA network. Specifically, around 50% of the 10 sSA inputs arose from glomerular columns located more distant than two rows away in the two-dimensional neuron array, while around 20% arose from columns more than five rows away. An sSA axon branched to contact 10 different columns while its dendrite received input from the ET cells from the same row. We determined appropriate synaptic weights for the ET/sSA network by sweeping through a range of parameters and measuring the normalized Euclidean distance between the chip output and a z score normalization term produced by the same input pattern (Cleland et al., 2007). The z score was computed as [zi = (xi − μx)/σx], where μx was the mean of the synaptic inputs and σx was the standard deviation. The synaptic weights that minimized the normalized Euclidean distance were used.
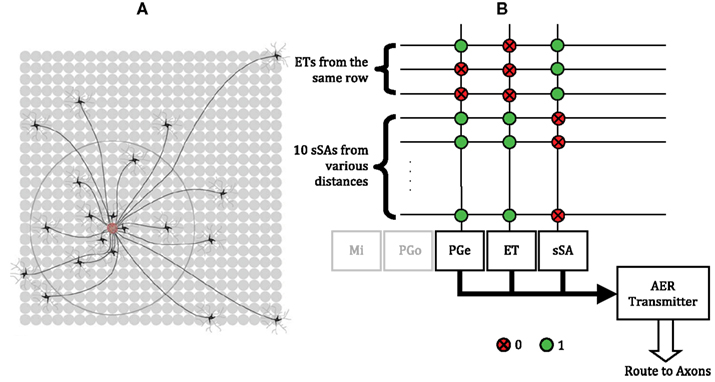
Figure 6. Normalization of the total activity of mitral cells via the ET/sSA network. (A) Illustration of the lateral connectivity of sSA cells. Glomeruli receive inputs from the axons of multiple sSA neurons located at a characteristic distribution of distances away. These axons branch extensively, although for clarity this is not shown. The sSA neurons receive synaptic input from ET cells in a small number of immediately neighboring glomeruli (depicted as the gray dendrites of the black sSA cells). Figure adapted from Cleland (2010). (B) Crossbar connectivity in the chip to replicate the normalization effects of the ET/sSA lateral network. Each sSA neuron receives input from ET cells from the same row. The PGe and ET neurons of each of the 48 columns receive input from 10 sSA neurons, most of which are located in neighboring rows, but some of which are more than five rows away. Spikes generated by an sSA neuron are routed to its axon in the crossbar which synapses with the PGe and ET cells of 10 different glomeruli. The outputs of the PGe and ET neurons also are routed to their axons in order to make the appropriate inter- and intra-glomerular connections (see Figure 1).
In all cases, mitral cell spike trains constitute the output of the present system.
Results
Chemotopic Convergence
With 48 glomerular columns, each receiving input from a distinct type of chemosensor, combinatorial representation in principle can represent a large number of different odorants. For example, if the chemosensors each have m distinct activation levels, then m48 separate odors can be represented in a single core. Noise in the chemosensors can be partially compensated by the convergence of multiple sensors of the same type onto one glomerulus, increasing the signal-to-noise ratio as well as the maximum sensitivity to low-concentration odorants. Consequently, the output of glomerular circuitry can offer a considerably more robust and reliable representation of low-concentration odors than can individual chemosensors. An example measurement from the chip is shown in Figure 7. We here define the signal-to-noise ratio as the number of spikes induced by odorant presentation divided by the total number of spikes (i.e., activity due to the stimulus plus background activity) during the presentation interval.
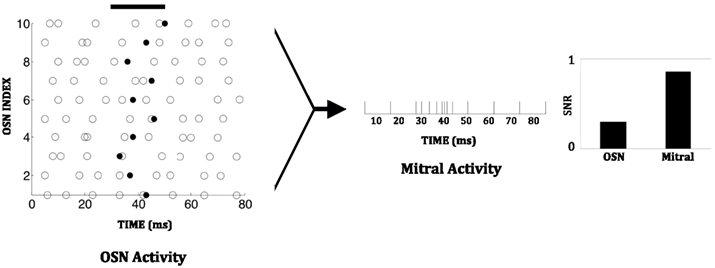
Figure 7. Chip data illustrating the enhanced signal-to-noise ratio (SNR) in a mitral cell compared to an OSN. A constant low-concentration odor was presented between 30 and 50 ms (solid black line). This increases the spiking probability of individual OSNs during one time step (1 ms) from 0.1 to 0.15. Background spiking is depicted by open circles; additional odor-evoked spikes are depicted by solid black dots. Since multiple OSNs converge on one mitral cell, mitral cell activity during the stimulus period exhibits a significant increase over its background level. The signal-to-noise ratio in an OSN is 0.3 while that in the mitral cell is 0.8.
Non-Topographical Contrast Enhancement
The connections between PGo and mitral cells (see Figure 1) sharpen the secondary representations of odors as described in Section “Computations of the Olfactory Bulb Glomerular Layer.” Mitral cell spike patterns measured from the chip confirm that feed-forward inhibition by PGo cells indeed can yield output that is more precisely tuned to specific odorants than are the broad primary representations mediated by OSNs (sensors). This chemotopic contrast enhancement is illustrated in Figure 8A. We represented the presence of an odor by externally driving OSN inputs such that a few had high spike rates (depicting strongly responsive chemosensors), some had moderate spike rates (depicting moderately/weakly responsive chemosensors), and some did not increase their spiking over the background rate (depicting insensitive chemosensors). As shown in the figure, those mitral cells corresponding to the most strongly activated OSNs increased their spiking activity, while those corresponding to the moderately/weakly activated OSNs shut down, resulting in a sharp population tuning curve. As illustrated in Figure 8B, this reduction in the overlap of the combinatorial representations of similar analytes creates a sharply decorrelated set of odor representations. The basic decorrelation function is illustrated in Figure 9.
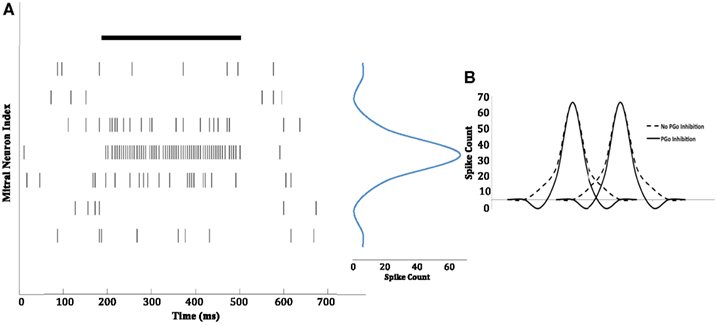
Figure 8. Chip data illustrating contrast enhancement. (A) An odor with a constant concentration was presented at the 200-ms time point, and persisted till the 500-ms time point (solid black line). As an illustration, the spiking activity (vertical bars) of seven mitral cells in response to the odor is shown. The mitral cells receiving input from OSNs that most strongly respond to the odor exhibit increased activity whereas those receiving input from weakly responsive OSNs are inhibited below baseline, such that they are less active even than completely insensitive mitral cells (see Figure 9). The activity patterns of the mitral cells shown are presented in a one-dimensional, two-tailed chemotopic arrangement for illustrative purposes; see Cleland and Linster (2012) for a high-dimensional illustration. The mitral cell depicted in the fourth row received input from the OSNs that responded most strongly, whereas the mitral cells depicted in the rows above and below it received progressively weaker OSN activity. The result is a sharply tuned population tuning curve (in blue) with a distinct inhibitory surround (the spike count is for the duration of the stimulus). (B) The representation of two different odors (two peaks) by a population of mitral cells (distributed along the abscissa in a one-dimensional chemotopic ordering for illustrative purposes). Non-topographical feed-forward (PGo) inhibition generates an inhibitory surround and reduces the overlap of the two combinatorial odor representations (solid line) compared to the overlap that would occur in the absence of PGo inhibition (dashed line).
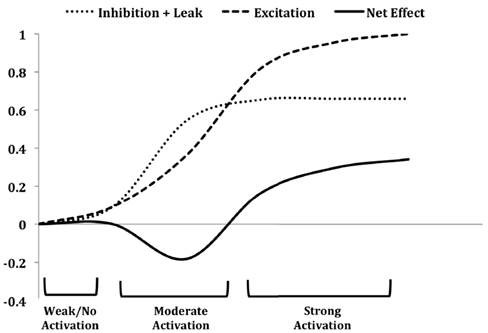
Figure 9. The contrast enhancement function in mitral cells on the chip in response to sensor inputs. Mitral cells corresponding to moderately activated sensors are predominantly inhibited (reducing the spike rate of some cells to nearly 20% below baseline activity) by feed-forward PGo inhibition (moderate activation), whereas mitral cells excited by strongly activated sensors overcome the saturated PGo inhibition and exhibit net excitation (strong activation). The leak portion of the “inhibition + leak” curve represents charge leakage out of the cell between successive excitatory spikes received from OSN inputs, and therefore is inversely related to the activity of the OSNs. For strongly activated sensors, the excitation delivered to the mitral cells is of sufficiently high frequency to overcome the combined effects of PGo inhibition and the leak current. Figure adapted from Cleland and Sethupathy (2006).
Concentration Invariance
Figure 10 illustrates the normalizing effects of the ET/sSA cell network on the activity of mitral cells in the chip. The uniform level of activation integrated by this network excites PGe and ET cells in all glomeruli and thereby uniformly inhibits all mitral cells in proportion to the global average level of OSN activation. This process generates a relational representation among mitral cells in which the relative (rather than the absolute) pattern of activity best represents the identity of an odor and also helps to preserve recognizable odor-specific activity patterns across concentrations (concentration invariance). This normalization also is necessary for NTCE to function across different concentrations. Optimal concentration invariance still will be limited by sensor non-linearities and ultimately may be improved by an adaptive algorithm as discussed in Cleland et al. (2012).
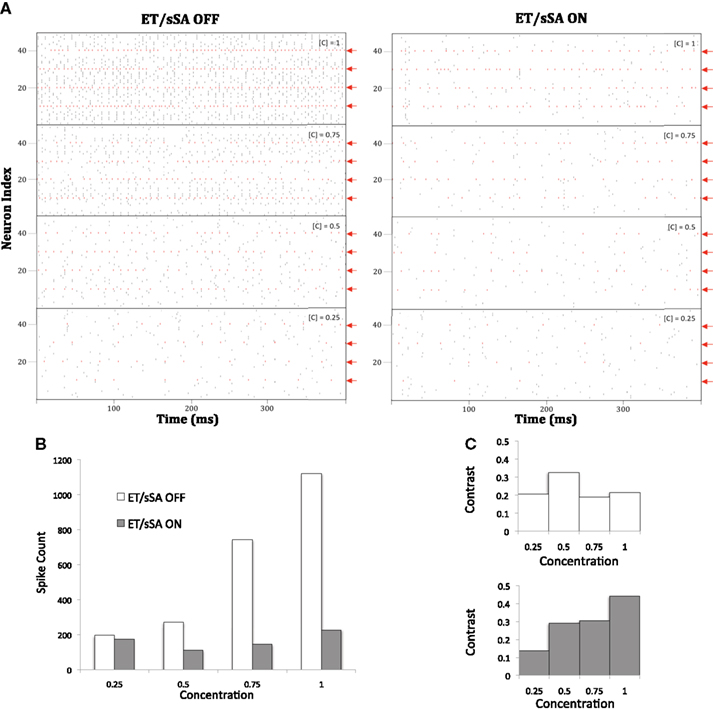
Figure 10. (A) With the ET/sSA network off, mitral cell population activity increases monotonically in proportion to input intensity (odor concentration, [C]). The spikes of those mitral cells that are most sharply tuned to the presented odor are depicted in red and indicated by red arrows; additional, weakly activated mitral cells also are recruited in to the active ensemble as concentration increases. With the ET/sSA network on, aggregate mitral cell population activity remains largely independent of concentration. Odor identity is represented by the profile of the most sharply tuned mitral cells, and their relative activities remain essentially stable after normalization. (B) Quantification of the normalizing effect of the ET/sSA network. Spiking activity of mitral cells that are moderately or poorly tuned to a given stimulus (i.e., the count of all black marks in the raster of (A), excluding the spikes from sharply tuned neurons as denoted in red) was plotted against odor concentration. The inhibitory effects of the ET/sSA network limit or prevent firing in more weakly tuned mitral cells, such as those that are recruited only at higher odor concentrations. At high concentration the normalizing effects reduce the spike count by as much as 80%. (C) Effects of ET/sSA network normalization on contrast enhancement. Contrast was calculated as the total number of spikes in the most strongly tuned neurons divided by the total number of spikes in the population. With the ET/sSA network disconnected (top), the recruitment of weakly tuned mitral cells by elevated odor concentrations prevents improvements in contrast across mitral cell population activity. With the ET/sSA network active (bottom), increases in concentration result in net inhibition of marginally activated neurons, increasing the contrast between them and the most strongly activated neurons.
The ET/sSA network is sparsely connected and fairly localized in its projection topology (see Network Configuration). However, the axonal profiles of this network contain sufficient long-range projections to evoke small-world effects (Watts and Strogatz, 1998). As a result, this sparse, localized connectivity profile is functionally equivalent to all-to-all connectivity while conserving substantial energy and space. We investigated the efficacy of this algorithm by varying the synaptic density of the sSA cells and observing the variance in their activities across the chip while measuring the power consumption for different connectivity profiles. The connectivity distribution took the form
where Pij is the probability of a synaptic connection between glomerular column i and sSA j, Po is a baseline probability factor, fgauss represents a gaussian distribution (parameterized by variance R), and dij is the distance between the glomerular column and the sSA cell. By varying Po and R, we changed the synaptic density and the projection distance of each sSA cell. An increase in either of these parameters increased the amount of excitation that each glomerular column receives from sSA cells. In order to observe only the effects of changing the connection distribution of the network and not changes in its overall strength, we reduced individual synaptic weights in proportion to the increase in connectivity. The coefficient of variation (CV) of sSA activity across the chip provides a measure of how uniform the network activity is, and consequently, the efficacy of the normalization process. We performed this analysis for several different odor-activated sensor patterns and averaged the results. When the average number of sSA inputs per glomerulus is low (0 in the extreme case of a completely isolated glomerulus), the CV is large, reflecting the heterogenous activation levels of different glomeruli. The CV converges rapidly to an asymptotic minimum as the density of sSA connections is increased (Figure 11; also see Cleland et al., 2007) The connectivity profile depicted by the vertical dotted line in Figure 11 (representing an average of 10 sSA inputs per glomerulus) substantially reduced energy consumption while generating approximately the same CV for sSA activity as that achieved by a fully connected ET/sSA network. Good normalization results were obtained for sSA densities as low as four inputs per glomerulus. These results demonstrate that a small-world network on the chip can achieve close to the maximum normalization quality using up to 10 times less energy compared to an all-to-all network. As we scale the system (through multiple cores), this effect will become increasingly significant, since all-to-all ET/sSA connectivity at larger scales would consume an increasingly disproportionate share of chip resources.
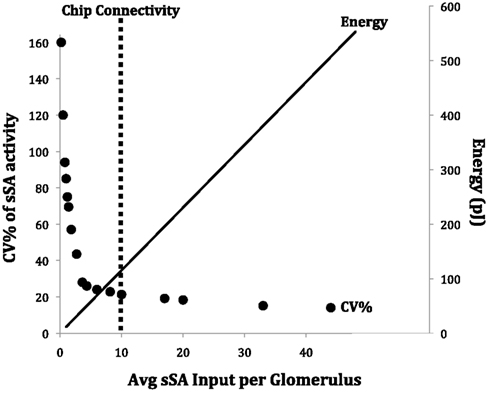
Figure 11. The sparse connectivity of the ET/sSA network on the chip is functionally equivalent to a fully connected network, but carries out global normalization at a reduced energy cost. The abscissa is a measure of the density of sSA connections, bounded by the extremes of a fully isolated network at x = 0 and an all-to-all interconnected network at x = 48. The primary ordinate (left) denotes the coefficient of variation (CV% – the standard deviation as a percentage of the mean) of sSA activity across the sSA population. Low CVs indicate high uniformity in sSA activity across the network. The secondary ordinate (right) denotes the energy consumed in the chip (at its present scale) by updating all synaptic inputs when sSA neurons spike. Denser interconnectivity requires more energy. The dotted vertical line denotes the density of sSA innervation presently implemented in the chip. This reasonably optimized solution corresponds directly to that which appears to be implemented in mouse and rat olfactory bulbs (cf. Figure 5B in Cleland et al., 2007).
Conclusion
We have presented the design of a low-power neuromorphic chip and have configured it to replicate the connectivity and functional transformations of the glomerular layer of the mammalian olfactory bulb. The architecture that we presented is both scalable and practically extensible in that the 48 glomeruli of each core are designed to communicate efficiently with the glomeruli of other cores. With multiple cores in a chip and the utilization of multiple chips in an operational system, this architecture could approach and even surpass the numbers of neurons and synapses in biological olfactory pathways.
This chip is designed to receive a primary olfactory representation comprised of spike trains generated by broadly tuned, concentration-sensitive sensors. With m distinct activation levels of each sensor, m48 different odors can in principle be represented. The convergence of 10 distinct sensors of the same type to one glomerulus increases the signal-to-noise ratio from 0.3 in the sensors to 0.8 in the mitral cells. NTCE results in moderately tuned mitral cells to be inhibited as much as 20% below their baseline spiking activity, thereby sharpening the tuning curves of the mitral cell population. Global normalization of mitral cell activity results from the effects of small-world connectivity in the ET/sSA network. The connectivity profile of this network follows a gaussian distribution with the connection probability between ET cells and sSA cells larger for cells closer to each other in the physical layout of the chip. With a connectivity profile corresponding to 10 sSA inputs per glomerulus, global spike count reduces by as much as 80% while largely preserving the activity of the most strongly responsive mitral cells. The CV of sSA activity in this network is within 5% of that in an all-to-all connected ET-sSA network while consuming six times less energy. By making the ET/sSA connection sparser, the energy consumption could be reduced to 10 times lower than that in a fully connected network, while keeping the CV within 10%.
As a result of the transformations in the chip, the secondary representation generated across mitral cell spike trains exhibits an improved signal-to-noise ratio, and is sharply tuned and normalized with respect to the global activity. Output representations from the chip (illustrated in Figure 12) can be further processed, analyzed, and/or classified by standard pattern recognition engines running in parallel with our system, or by another neuromorphic circuit (e.g., based on a new configuration of the present system) that replicates some functions of higher processing centers in biological olfactory pathways, such as the perceptual learning and higher-order feedback mechanisms exhibited by the in vivo olfactory system. Importantly, such neuromorphic implementations of subsequent layers of olfactory processing (e.g., the external plexiform layer of the olfactory bulb) are likely to require adaptive plasticity in synaptic weights and/or neuronal properties. The experience-dependent transformation of odor representation is likely to be a powerful technique for selectively grouping regions of olfactory variance into “odors” in accordance with the similarities of their implications. Such dynamic remapping of the connections within the chip (Sun Seo et al., 2011) can be achieved by enabling the neurons to change the state of the crossbar during run-time based on plasticity rules such as spike timing-dependent plasticity (Dan and Poo, 2006; Linster and Cleland, 2010).
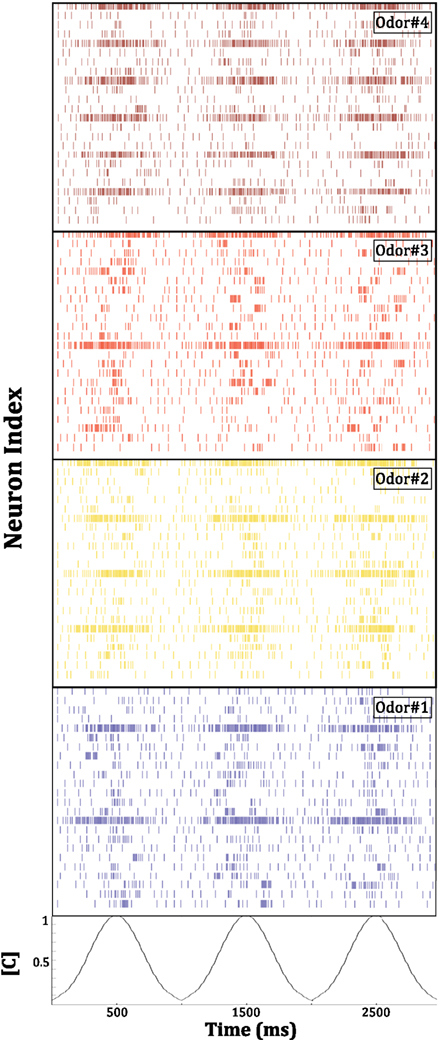
Figure 12. Mitral cell population activity in the chip in response to the presentation of four different odors. This activity constitutes the final output of the system in its present configuration. Spiking patterns from 24 of the 48 mitral cells on the chip are depicted. Odorant concentration [C] was modulated as depicted at the bottom of the figure. Compared to the primary representation of the chemical environment by the broadly tuned, concentration-sensitive population of simulated sensors driving the chip, this secondary representation is more sharply tuned, normalized, and exhibits an increased signal-to-noise ratio. For final odor identification and discrimination, this output activity can be sent to a standard pattern recognition engine, or to biomimetic circuits representing higher processing stages in olfactory pathways.
Conflict of Interest Statement
The authors declare that the research was conducted in the absence of any commercial or financial relationships that could be construed as a potential conflict of interest.
Acknowledgments
The research reported here was sponsored by the DARPA Defense Sciences Office program Systems of Neuromorphic Adaptive Plastic Scalable Electronics (SyNAPSE) under Contract HR0011-09-C-0002, and NIDCD grant DC012249 to TAC. The views and conclusions are those of the authors and should not be interpreted as representing the official policies, either expressly or implied, of DARPA or of the U.S. Government.
References
Aungst, J. L., Heyward, P. M., Puche, A. C., Karnup, S. V., Hayar, A., Szabo, G., and Shipley, M. T. (2003). Centre-surround inhibition among olfactory bulb glomeruli. Nature 426, 623–629.
Beccherelli, R., Zampetti, E., Pantalei, S., Bernabei, M., and Persaud, K. (2010). Design of a very large chemical sensor system for mimicking biological olfaction. Sens. Actuators B Chem. 146, 446–452.
Beyeler, M., Stefanini, F., Proske, H., Galizia, G., and Chicca, E. (2010). “Exploring olfactory sensory networks: simulations and hardware emulation,” in Proceedings of the IEEE Biomedical Circuits and Systems Conference BIOCAS 2010, 270–273.
Chaudhury, D., Escanilla, O., and Linster, C. (2009). Bulbar acetylcholine enhances neural and perceptual odor discrimination. J. Neurosci. 29, 52–60.
Cleland, T. A., Chen, S.-Y. T., Hozer, K. W., Ukatu, H. N., Wong, K. J., and Zheng, F. (2012). Sequential mechanisms underlying concentration invariance in biological olfaction. Front. Neuroeng. 4, 00021.
Cleland, T. A., Johnson, B. A., Leon, M., and Linster, C. (2007). Relational representation in the olfactory system. Proc. Natl. Acad. Sci. U.S.A. 104, 1953–1958.
Cleland, T. A., and Linster, C. (1999). Concentration tuning mediated by spare receptor capacity in olfactory sensory neurons: a theoretical study. Neural Comput. 11, 1673–1690.
Cleland, T. A., and Linster, C. (2005). Computation in the olfactory system. Chem. Senses 30, 801–813.
Cleland, T. A., and Linster, C. (2009). Glomerular microcircuits in the olfactory bulb. Neural Netw. 22, 1169–1173.
Cleland, T. A., and Linster, C. (2012). On-center/inhibitory-surround decorrelation via intraglomerular inhibition in the olfactory bulb glomerular layer. Front. Integr. Neurosci. 6:5. doi:10.3389/fnint.2012.00005
Cleland, T. A., Narla, V. A., and Boudadi, K. (2009). Multiple learning parameters differentially regulate olfactory generalization. Behav. Neurosci. 123, 26–35.
Cleland, T. A., and Sethupathy, P. (2006). Non-topographical contrast enhancement in the olfactory bulb. BMC Neurosci. 7, 7. doi:10.1186/1471-2202-7-7
Dan, Y., and Poo, M.-M. (2006). Spike timing-dependent plasticity: from synapse to perception. Physiol. Rev. 86, 1033–1048.
Dickinson, T. A., White, J., Kauer, J. S., and Walt, D. R. (1996). A chemical-detecting system based on a cross-reactive optical sensor array. Nature 382, 697–700.
Goldsmith, B. R., Mitala, J. J., Josue, J., Castro, A., Lerner, M. B., Bayburt, T. H., Khamis, S. M., Jones, R. A., Brand, J. G., Sligar, S. G., Luetje, C. W., Gelperin, A., Rhodes, P. A., Discher, B. M., and Johnson, A. T. (2011). Biomimetic chemical sensors using nanoelectronic readout of olfactory receptor proteins. ACS Nano 5, 5408–5416.
Gonzalez-Jimenez, J., Monroy, J. G., and Blanco, J. L. (2011). The multi-chamber electronic nose – an improved olfaction sensor for mobile robotics. Sensors (Basel) 11, 6145–6164.
Gutierrez-Galvez, A., and Gutierrez-Osuna, R. (2006). Increasing the separability of chemosensor array patterns with Hebbian/anti-Hebbian learning. Sens. Actuators B Chem. 116, 29–35.
Gutierrez-Osuna, R. (2002). Pattern analysis for machine olfaction: a review. IEEE Sens. J. 2, 189–202.
Hierlemann, A., and Gutierrez-Osuna, R. (2008). Higher-order chemical sensing. Chem. Rev. 108, 568–613.
Imam, N., and Manohar, R. (2011). “Address-event communication using token-ring mutual exclusion,” in Proceedings of the 17th IEEE International Symposium on Asynchronous Circuits and Systems (ASYNC) (Ithaca: IEEE Computer Society), 99–108.
Indiveri, G., Linares-Barranco, B., Hamilton, T. J., van Schaik, A., Etienne-Cummings, R., Delbruck, T., Liu, S.-C., Dudek, P., Häfliger, P., Renaud, S., Schemmel, J., Cauwenberghs, G., Arthur, J., Hynna, K., Folowosele, F., Saighi, S., Serrano-Gotarredona, T., Wijekoon, J., Wang, Y., and Boahen, K. (2011). Neuromorphic silicon neuron circuits. Front. Neurosci. 5:73. doi:10.3389/fnins.2011.00073
Koickal, T. J., Hamilton, A., Pearce, T. C., Tan, S. L., Covington, J. A., and Gardner, J. W. (2006). “Analog VLSI design of an adaptive neuromorphic chip for olfactory systems,” in Proceedings of the IEEE 2006 International Symposium on Circuits and Systems ISCAS.
Linster, C., and Cleland, T. A. (2010). Decorrelation of odor representations via spike timing-dependent plasticity. Front. Comput. Neurosci. 4:157. doi:10.3389/fncom.2010.00157
Liu, S. C., Mesgarani, N., Harris, J., and Hermansky, H. (2010). “The use of spike-based representations for hardware audition systems,” in Proceedings of 2010 IEEE International Symposium on Circuits and Systems (ISCAS), Paris, 505–508.
Maguire, L. P., McGinnity, T. M., Glackin, B., Ghani, A., Belatreche, A., and Harkin, J. (2007). Challenges for large-scale implementations of spiking neural networks on FPGAs. Neurocomputing 71, 13–29.
Mandairon, N., Ferretti, C. J., Stack, C. M., Rubin, D. B., Cleland, T. A., and Linster, C. (2006). Cholinergic modulation in the olfactory bulb influences spontaneous olfactory discrimination in adult rats. Eur. J. Neurosci. 24, 3234–3244.
Mandairon, N., and Linster, C. (2009). Odor perception and olfactory bulb plasticity in adult mammals. J. Neurophysiol. 101, 2204–2209.
Manohar, R. (2000). “A case for asynchronous computer architecture,” in Proceedings of the ISCA Workshop on Complexity-Effective Design, Vancouver.
Marco, S., and Gutierrez-Galvez, A. (2009). Recent developments in the application of biologically inspired computation to chemical sensing. AIP Conf. Proc. 1137, 151–154.
Martin, A. J. (1990). “Programming in VLSI: from communicating processes to delay-insensitive circuits,” in Developments in Concurrency and Communication, UT Year of Programming Series, ed. C. A. R. Hoare (Boston: Addison-Wesley), 1–64.
Merolla, P., Arthur, J., Akopyan, F., Imam, N., Manohar, R., and Modha, D. (2011). “A digital neurosynaptic core using embedded crossbar memory with 45pJ per spike in 45nm,” in Proceedings of the IEEE Custom Integrated Circuits Conference, San Jose.
Nageswaran, J. M., Dutt, N., Krichmar, J. L., Nicolau, A., and Veidenbaum, A. (2009). “Efficient simulation of large-scale spiking neural networks using CUDA graphics processors,” in Proceedings of the 2009 International Joint Conference on Neural Networks, IJCNN’09 (Piscataway, NJ: IEEE Press), 3201–3208.
Paolesse, R., Lvova, L., Nardis, S., Natale, C. D., Damico, A., and Castro, F. L. (2008). Chemical images by porphyrin arrays of sensors. Mikrochim. Acta 163, 103–112.
Persaud, K., and Dodd, G. (1982). Analysis of discrimination mechanisms in the mammalian olfactory system using a model nose. Nature 99, 352–355.
Raman, B., Yamanaka, T., and Gutierrez-Osuna, R. (2006). Contrast enhancement of gas sensor array patterns with a neurodynamics model of the olfactory bulb. Sens. Actuators B Chem. 119, 547–555.
Scholze, S., Schiefer, S., Partzsch, J., Hartmann, S., Mayr, C. G., Höppner, S., Eisenreich, H., Henker, S., Vogginger, B., and Chüffny, R. (2011). VLSI implementation of a 2.8 Gevent/s packet based AER interface with routing and event sorting functionality. Front. Neurosci. 5:117. doi:10.3389/fnins.2011.00117
Shi, B. E., Tsang, E. K. C., Lam, S. Y. M., and Meng, Y. (2006). “Expandable hardware for computing cortical feature maps,” in Proceedings of the International Symposium on Circuits and Systems (ISCAS 2006), 21–24 May, Island of Kos: IEEE.
Staii, C., Chen, M., Gelperin, A., and Johnson, A. T. (2005). DNA-decorated carbon nanotubes for chemical sensing. Nano Lett. 5, 1774–1778.
Sultan, S., Mandairon, N., Kermen, F., Garcia, S., Sacquet, J., and Didier, A. (2010). Learning-dependent neurogenesis in the olfactory bulb determines long-term olfactory memory. FASEB J. 24, 2355–2363.
Sun Seo, J., Brezzo, B., Liu, Y., Parker, B. D., Esser, S. K., Montoye, R. K., Rajendran, B., Tierno, J. A., Chang, L., Modha, D. S., and Friedman, D. J. (2011). “A 45nm CMOS neuromorphic chip with a scalable architecture for learning in networks of spiking neurons,” in IEEE Custom Integrated Circuits Conference, eds R. Patel, T. Andre, and A. Khan (San Jose: Proceedings of the IEEE Custom Integrated Circuits Conference), 1–4.
Watts, D. J., and Strogatz, S. H. (1998). Collective dynamics of ‘small-world’ networks. Nature 393, 440–442.
Yokoi, M., Mori, K., and Nakanishi, S. (1995). Refinement of odor molecule tuning by dendrodendritic synaptic inhibition in the olfactory bulb. Proc. Natl. Acad. Sci. U.S.A. 92, 3371–3375.
Yu, T., Choi, W., Merolla, P. A., Arthur, J. V., Boahen, K. A., and Shi, B. E. (2005). Neuromorphic implementation of orientation hypercolumns. IEEE Trans. Circuits. Syst. I Regul. Pap. 52, 1049–1060.
Keywords: neuromorphic, biomimetic, olfaction, artificial chemical sensing, neurosynaptic core, small-world, digital neuron, AER
Citation: Imam N, Cleland TA, Manohar R, Merolla PA, Arthur JV, Akopyan F and Modha DS (2012) Implementation of olfactory bulb glomerular-layer computations in a digital neurosynaptic core. Front. Neurosci. 6:83. doi: 10.3389/fnins.2012.00083
Received: 29 February 2012; Accepted: 18 May 2012;
Published online: 06 June 2012.
Edited by:
Gabriel A. Silva, University of California San Diego, USAReviewed by:
Vassiliy Tsytsarev, University of Maryland School of Medicine, USAShih-Chii Liu, University of Zurich/ETH Zurich, Switzerland
Copyright: © 2012 Imam, Cleland, Manohar, Merolla, Arthur, Akopyan and Modha. This is an open-access article distributed under the terms of the Creative Commons Attribution Non Commercial License, which permits non-commercial use, distribution, and reproduction in other forums, provided the original authors and source are credited.
*Correspondence: Nabil Imam, Computer Systems Lab, Department of Electrical and Computer Engineering, Cornell University, 314 Rhodes Hall, Hoy Road, Ithaca, NY 14850, USA. e-mail: ni49@cornell.edu