


94% of researchers rate our articles as excellent or good
Learn more about the work of our research integrity team to safeguard the quality of each article we publish.
Find out more
PERSPECTIVE article
Front. Neurosci. , 13 December 2012
Sec. Brain Imaging Methods
Volume 6 - 2012 | https://doi.org/10.3389/fnins.2012.00178
Pattern recognition methods have demonstrated to be suitable analyses tools to handle the high dimensionality of neuroimaging data. However, most studies combining neuroimaging with pattern recognition methods focus on two-class classification problems, usually aiming to discriminate patients under a specific condition (e.g., Alzheimer’s disease) from healthy controls. In this perspective paper we highlight the potential of the one-class support vector machines (OC-SVM) as an unsupervised or exploratory approach that can be used to create normative rules in a multivariate sense. In contrast with the standard SVM that finds an optimal boundary separating two classes (discriminating boundary), the OC-SVM finds the boundary enclosing a specific class (characteristic boundary). If the OC-SVM is trained with patterns of healthy control subjects, the distance to the boundary can be interpreted as an abnormality score. This score might allow quantification of symptom severity or provide insights about subgroups of patients. We provide an intuitive description of basic concepts in one-class classification, the foundations of OC-SVM, current applications, and discuss how this tool can bring new insights to neuroimaging studies.
Several quantitative methods are available to analyze neuroimaging data. The development of voxel-based-morphometry (Ashburner and Friston, 2000), cortical surface modeling (Fischl et al., 1999), and deep-structures volumetry (Bigler et al., 1997; Appenzeller et al., 2005; Zetzsche et al., 2006)started a remarkable series of innovation. At the same time, functional magnetic resonance imaging (fMRI) based on BOLD signal (Ogawa et al., 1990) has become widely used in Neuroscience research. All these recent developments combined with advances in imaging acquisition protocols led to the accumulation of a huge amount of data.
There have been many applications of machine learning to clinical problems (e.g., classifying patients vs. healthy controls; Kloppel et al., 2011; Mwangi et al., 2012). However an important aspect that has been less explored is how to define normative rules for neuroimaging data of a population in order to define what a “typical brain” is and how to measure the distance from a single subject to these patterns of typical brains. Pattern recognition methods are highly suitable for this purpose, since they were developed to automatically discover regularities in high dimensional data through the use of computer algorithms (Bishop, 2006). To the best of our knowledge, there are no initiatives toward trying to define normative rules in Neuroimaging using other unsupervised learning methods. There is an inherent difficulty in evaluating results from this kind of methods (e.g., how to determine the ideal number or size of the clusters). Optimization is usually solved in a suboptimal manner using heuristic means, as an objective solution is either unknown or unfeasible due to algorithmic complexity and computational effort (Möller et al., 2010). Janoos et al. (2010) presented preliminary results from the application of a diffusion distance to perform clustering on the space of fMRI volumes in order to identify distinct brain states. Nettiksimmonsa et al. (2010) were able to identify subtypes among healthy controls that might represent the earliest stages of subclinical cognitive decline and Alzheimer’s disease using clustering. However, they relied on visual assessment for choosing the number of clusters.
In this perspective article, we aim to discuss how the machine-learning framework can be applied to build normative rules from neuroimaging databases. We propose the one-class support vector machines (OC-SVM) as a suitable tool for this purpose. We also discuss some technological challenges and perspectives regarding applications of OC-SVM to neuroimaging data.
Most of the studies applying pattern recognition methods to clinical neuroimaging focus on two-class classification problems, usually a group of healthy/typical subjects and a group under a very specific condition (e.g., major depression, Alzheimer’s disease, etc). In the general framework, pattern recognition approaches receive a set of observations (input variables and their respective class labels) and estimate a decision rule or model that can be applied to new observations. Once the rule is learned, given the input variables of a new example the model returns its expected label. So, the pattern recognition framework can be described as a machine that makes a class prediction y (label) for some unseen input vector x (input variables).
The most popular pattern recognition approach used in neuroimaging applications is the Support Vector Machine (SVM, Boser et al., 1992; Cortes and Vapnik, 1995; Vapnik, 1998). The SVM has received increasing interest due its attractive properties such as high generalization power (i.e., its ability to perform accurately on new, unseen examples after trained on a data set, which is usually called training data) and good scalability for high dimensional data, a particularly important property for neuroimaging applications. An additional important property that will be discussed in following sections is the SVM ability to perform non-linear classification (when the rule to obtain class prediction is based on a non-linear function of the input variables).
The fact that the neural substrates of some neurological/psychiatric disorders are very heterogeneous might limit the applications of two-class SVM to discriminate these patients’ populations from healthy subjects. Individuals suffering from a pathological condition can exhibit different patterns of brain abnormalities (e.g., subtypes), which will affect the ability of pattern recognition approaches to find a reproducible discriminating pattern.
When only one input variable is available (e.g., neuropsychological scale), an intuitive approach to define normative rules is finding a “normative” interval containing most of the typical observations. Thus, for an unseen observation, we may decide whether it is typical or not by checking whether it is within the normative interval (Figure 1A). When a specific percentage is defined, for example 95%, this interval is usually defined by the minimum length interval containing 95% of the typical observations (and thus, 5% of typical observations would be declared as atypical). When two input variables are considered, we may extend this approach to a bidimensional probability distribution, and define a normative boundary, which is the minimum area containing 95% of the typical observations. In Figure 1B, observations outside the red circle defining the boundary would be considered outliers. The same approach can also be extended to the case of three input variables (Figure 1C), but it is easy to see that the problem becomes more difficult when the number of dimensions increases to tens or hundreds. In case of high dimensionality, one may be tempted to define normative rules independently for each variable (i.e., in a mass-univariate approach). However, if these variables are correlated (which is usually the case in neuroimaging data), even though a new observation is declared as typical by all “univariate” rules, it can be atypical from a multivariate perspective, i.e., when jointly taking into account all dimensions. In this situation, the most appropriate approach would be to define “multivariate” normative rules.
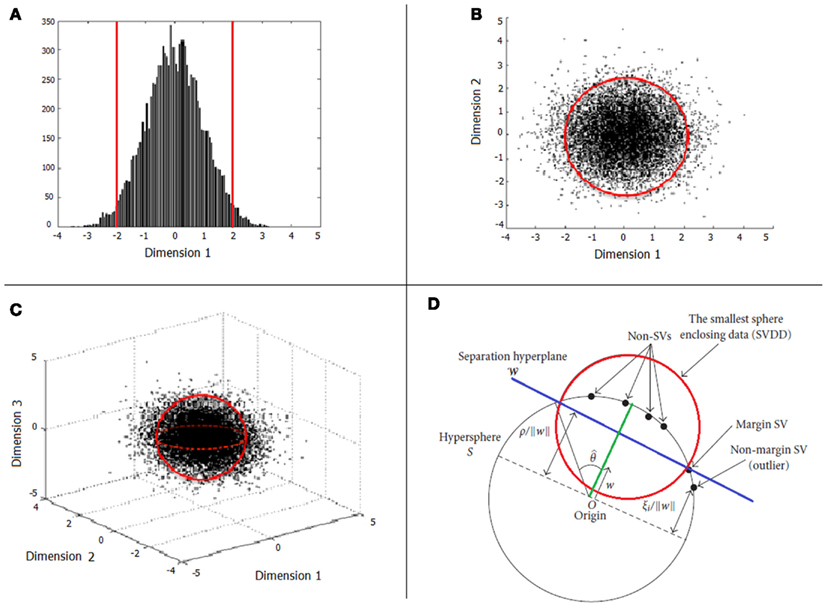
Figure 1. Examples of boundary specification in the cases of one (A), two (B), and three (C) input variables. Illustration of OC-SVM concepts are depicted in (D).
When the number of input variables is small compared to the number of observations, it is possible to use the data to estimate a multivariate density function (Scott, 1992). Computing the probability density for neuroimaging data might become intractable due to its extremely high dimensionality (equal to the number of input variables derived from an image, possibly the number of intracranial voxels) and the relatively small sample sizes usually available (number of subjects). Alternatively, one can use methods that only find a decision boundary and do not rely on density estimation such as the OC-SVM. In fact, most of the SVM theory was based on Vapnik’s (1998) principle: “never to solve a problem which is more general than the one we actually need to solve.” Thus, if our aim is determining the minimum region (interval, area, etc.) containing a fixed percentage of the typical data we do not need to estimate the full density function of the referred multidimensional variable.
The challenge of defining normative multivariate rules is also known as data description problem in the machine-learning literature (Fayyad et al., 1996; Tax and Laskov, 2003). This problem can be also framed as an outlier or novelty detection approach where the aim is to detect uncharacteristic observations. A possible application of data description is to classification problems where one of the groups (or classes) is representatively sampled (e.g., large random samples), while the other group is severely under sampled. Unbalanced classes are very common in clinical setting where data from healthy subjects can be easier or less expensive to obtain than data from patients.
The OC-SVM computes a decision boundary with the minimal volume around a set of observations from the target group. Once the decision boundary is computed it can be used to classify new observations as outliers (if they fall outside the boundary) or not.
One-class support vector machines is an unsupervised learning method proposed by Scholkopf et al. (2001). It focuses on determining a boundary enclosing the typical observations considering only one class of observations for training (called target class). After the training, new observations can be classified either as typical (in-class) or atypical (outliers), depending on their position in relation to the boundary.
Assume we have a training data D composed of N observations xi (e.g., brain images) of dimension d (number of input variables), i.e., D = {x1, …, xN} in . Our aim is to find the most compact region in containing most of the typical observations. The OC-SVM approach to solve this problem is to learn a mapping function from the input variables to a real number , such that most of data in D are mapped as positive values (the typical class) by fx. In other words, they belong to the set while minimizing the volume of Rx. This problem is called MVS (minimum volume set) estimation.
The OC-SVM belongs to the class of kernel methods. Kernel methods make use of kernel functions to find relationships or patterns in the data, which can be used to take actions such as classification (Shawe-Taylor and Cristianini, 2004). Kernel functions can be informally introduced as “similarity measures” to provide an intuitive understanding (Schölkopf and Smola, 2002). In the linear case this “similarity” can be expressed as the dot product between the input vectors representing the observations. A non-linear kernel corresponds to a mapping from the input variables (input space) to another space (feature space) using a non-linear transformation. A linear classification can then be carried out at this feature space and a linear boundary in the feature space corresponds to a non-linear boundary in the input space.
Formally a kernel function can be defined as a function that given two observations x and x′ ∈ X satisfies k(x, x′) = 〈Ø(x), Ø(x′)〉, where X is the input space or domain, Ø is a function mapping from X to a feature, and 〈 , 〉 is the dot product. Therefore non-linear kernels can be used to compute dot products in feature spaces without explicitly mapping the observations into the spaces, property commonly known as kernel trick.
A number of non-linear kernel functions have been proposed for kernel methods but the Gaussian or Radial Basis Function (RBF). Kernel is the most popular kernel function used with the OC-SVM. It depends on the Euclidian distance between the examples and is defined as . The parameter γ can be thought as the distance used to measure the dissimilarity between the examples and it will influence the smoothness of the boundary (in the input space). This parameter is usually set using heuristics or tuned using cross-validation procedures (Scholkopf et al., 2001).
In Figure 1D we present an illustration of the ν-OC-SVM solution based on the RBF kernel. The target data (solid black circles) is mapped (through the RBF kernel) from the input variables space onto a hypersphere (in black). The problem then consists in finding the smaller hypersphere (in red) enclosing a pre-defined percentage of the observations [i.e., the (1 − ν)]. Note that this optimization problem can be reformulated as finding the most distant hyperplane (in blue, defined by a weight vector w) from the origin, such that (1 − ν) percent of the observations will be separated from it. In other words, the OC-SVM algorithm returns a function f that takes a positive value in the minimum region capturing most of the training data (typical observations) points and a negative value elsewhere (atypical). The OC-SVM can also be viewed as a two-class classification problem where the target data is one of the classes and the origin is the other.
In one-class classification problems, a false positive occurs when a true typical observation is erroneously classified as being atypical. For a given classifier, the probability of false positive misclassification is named as the false positive rate. An issue to be addressed in OC-SVM is the choice of the false positive rate parameters ν. The parameter ν can be fixed a priori and it corresponds to the percentage of observations of the typical data, which will be assigned as atypical (Type I Error).
The classification in OC-SVM is based on the outcome of the decision function (fx), which in case of the RBF kernel is a non-linear function of the input variables. For a new observation, if this function value is positive, it means the observation is inside the boundary (“normative rule”) defining the typical examples. Otherwise, if the function value is negative it means the observation is outside the boundary and therefore is classified as atypical. Furthermore the relative position from the boundary can be used as a measure of abnormality (“normative metric”), which can then be correlated with other clinical or psychological measures for validation.
There have been a few applications of the OC-SVM to non-clinical fMRI data. Hardoon and Manevitz (2005) applied OC-SVM to learn the pattern of brain activity associated with a motor task. In a proof of concept paper, Sato et al. (2009) applied the method to motor networks based on functional connectivity estimation in order to construct a normative connectivity database. This study has shown that subjects identified as outliers were scored at the tails of the distribution of a laterality index (Edinburg Inventory). Song and Wyrwicz (2009) applied the OC-SVM as an approach to classify voxels as activated or non-activated. According to the authors this framework can provide robust and accurate mapping of functional activation.
Regarding clinical applications (see Figure 2), a recent work has demonstrated possible advantages of using OC-SVM with respect to two-class SVM in classifying depressed patients vs. healthy controls based on fMRI data. Fu et al. (2008) applied a standard two-class SVM to classify healthy controls vs. unipolar depressed patients based on the whole brain patterns of activation to an emotional stimulus (sad faces). However the authors were not able to predict treatment response with a significant accuracy as the number of responders and non-responders patients were not enough to train a two-class SVM. The same data set was later re-analyzed using the OC-SVM by Mourão-Miranda et al. (2011). In this study the authors found a significant correlation between the OC-SVM predictions and the patients’ Hamilton Rating Scale for Depression, i.e., the more depressed the patients were the higher their abnormality score was. Furthermore, the OC-SVM split the patient group into two subgroups whose memberships were associated with future response to treatment. This example illustrates the potential added value of using OC-SVM framework with respect to the two-class classification.
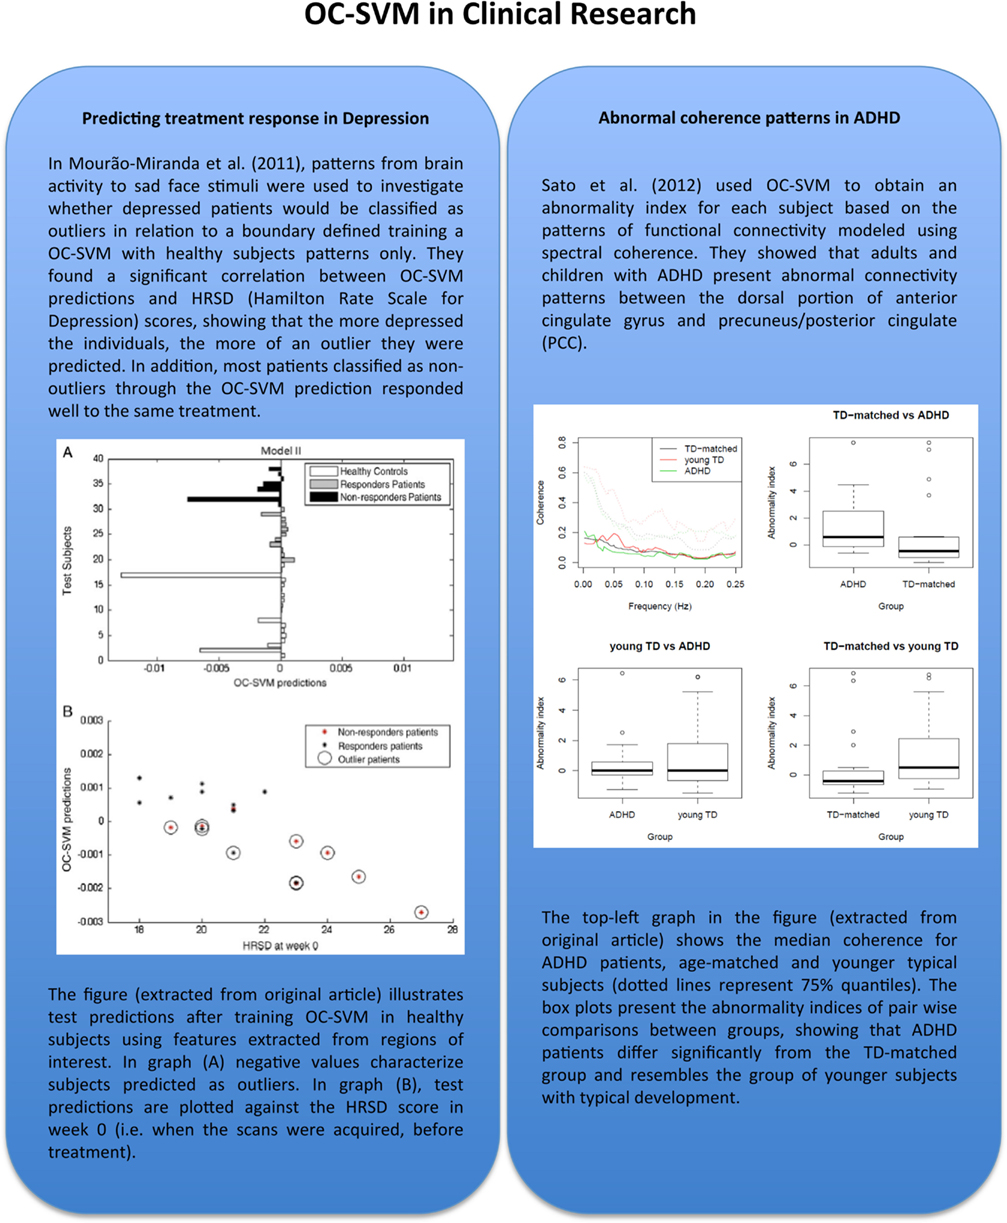
Figure 2. In this figure-box we illustrate two applications of OC-SVM in studies involving different neuropsychological conditions: major depression disorder and attention-deficit/hyperactivity disorder (ADHD), both addressing the question of defining a boundary characterizing distributions of brain activation patterns from a normal population. These papers are among the pioneer works representing important proof of concept that shows the potential of applying OC-SVM classifiers in order to obtain biomarkers for diagnosis or even prognosis in neuropsychological conditions. Although there are still few applications to date, this approach seems to be one of the trends in neuroimaging methods for clinical research with a high potential to be used in clinical routine in the near future. The figures were adapted and reproduced with the authorization of the original publishers.
A more recent application of OC-SVM to neuroimaging data has been to investigate attention-deficit hyperactivity disorder (ADHD, Sato et al., 2012; see Figure 2). In this work, the authors have applied OC-SVM to patterns of functional connectivity and demonstrated that adults and children with ADHD present abnormal connectivity. An interesting conclusion was that the connectivity patterns of ADHD patients were more similar to the ones of younger typical developments subjects, in agreement with the hypothesis that the disorder is associated with abnormal brain maturation.
It should be emphasized that the OC-SVM tries to solve a less constrained and therefore more difficult problem than the standard two-class SVM. In conventional two-class classification, in which the data from the two classes are available, the decision boundary is supported from both sides by training examples. In one-class classification only one class of data is available, and thus the boundary is only supported from one side. One of the challenges is to decide how tightly the boundary should fit in each of the dimensions around the data (defined by the kernel parameter). The curse of dimensionality becomes more severe in one-class classification problems as the boundary has to be defined in all directions. It is therefore expected that the one-class classification will require larger sample size for training in comparison with conventional classification.
Another obstacle, inherent to the unsupervised nature of OC-SVM, is the high susceptibility to noise and uninformative variables. OC-SVM attempts to take into account the entire set of input variables to learn common patterns. A direct consequence of this limitation is that the input variables should be carefully chosen when applying OC-SVM. Therefore priori knowledge about the relevance of input variables is necessary to increase the sensitivity of the method.
Finally, it is important to mention that the measure of abnormality obtained using OC-SVM is not specific, once this index reports deviation from normality in any direction. Thus, the labeling as an “outlier” does not provide any qualitative information about the abnormality, suggesting that further exploration of the data must be carried out.
Considering the increase of large multi-center neuroimaging databases available we foresee also an increase on the applications of one-class classification approaches for defining normative rules based on these data. There are already some initiatives aiming to build large-scale neuroimaging databases such as the 1000 Connectomes (Biswal et al., 2010), ADNI (Mueller et al., 2005), and the ADHD-200 Sample1. In addition, there are some interdisciplinary and collaborative efforts to provide preprocessed data for both functional and structural neuroimaging2. The relevance of these initiatives in clinical applications is evidenced by the recent boom of studies using these shared databases (Babiloni et al., 2012; Meier et al., 2012). Public available databases are very attractive resources for the application of pattern recognition, machine learning, and data-mining methods as they normally consist of large number of subjects enabling the development and test of different models.
As we previously discussed, one of the main obstacles when dealing with structural/functional normative databases is how to define a “typical” brain pattern using high dimensional data. The high inter-subject variability and distinct etiologies of most neurological and neuropsychiatric conditions make the problem extremely difficult to tackle. The OC-SVM is a promising tool that can be applied to explore and extract relevant characteristics and information from these large databases with the aim of building normative rules. As in other medical areas, a cut-off value can be determined by locating a subject score in relation to the distribution derived from a number of healthy subjects. The fact that the OC-SVM approach can rely entirely on data from a healthy control sample makes it particularly suitable for the identification of rare disorders when only data from a very small number of patients are available or for the identification of subgroups of patients.
The authors declare that the research was conducted in the absence of any commercial or financial relationships that could be construed as a potential conflict of interest.
João Ricardo Sato was supported by FAPESP – Brazil. Janaina Mourão-Miranda was funded by a Wellcome Trust Career Development Fellowship under grant no. WT086565/Z/08/Z (Janaina Mourão-Miranda). Jane Maryam Rondina was funded by CAPES (Coordination for the Improvement of Higher Education Personnel, Brazil), under grant 3883/11-6.
Appenzeller, S., Rondina, J. M., Li, L. M., Costallat, L. T., and Cendes, F. (2005). Cerebral and corpus callosum atrophy in systemic lupus erythematosus. Arthritis Rheum. 52, 2783–2789.
Ashburner, J., and Friston, K. J. (2000). Voxel-based morphometry – the methods. Neuroimage 11, 805–821. [Review].
Babiloni, C., Carducci, F., Lizio, R., Vecchio, F., Baglieri, A., Bernardini, S., et al. (2012). Resting state cortical electroencephalographic rhythms are related to gray matter volume in subjects with mild cognitive impairment and Alzheimer’s disease. Hum. Brain Mapp. (in press). doi: 10.1002/hbm.22005
Bigler, E. D., Blatter, D. D., Anderson, C. V., Johnson, S. C., Gale, S. D., Hopkins, R. O., et al. (1997). Hippocampal volume in normal aging and traumatic brain injury. AJNR Am. J. Neuroradiol. 18, 11–23.
Biswal, B. B., Mennes, M., Zuo, X. N., Gohel, S., Kelly, C., Smith, S. M., et al. (2010). Toward discovery science of human brain function. Proc. Natl. Acad. Sci. U.S.A. 107, 4734–4739.
Boser, B. E., Guyon, I. M., and Vapnik, V. N. (1992). “A training algorithm for optimal margin classifiers,” in 5th Annual ACM Workshop on COLT ed. D. Haussler (Pittsburgh: ACM Press), 144–152.
Fayyad, U. M., Piatetsky-Shapiro, G., and Smyth, P. (1996). Knowledge discovery and data mining: towards a unifying framework. Proc. Knowl. Discov. Data Min. 82–88.
Fischl, B., Sereno, M. I., and Dale, A. M. (1999). Cortical surface-based analysis. II: Inflation, flattening, and a surface-based coordinate system. Neuroimage 9, 195–207.
Fu, C. H., Mourao-Miranda, J., Costafreda, S. G., Khanna, A., Marquand, A. F., Williams, S. C., et al. (2008). Pattern classification of sad facial processing: toward the development of neurobiological markers in depression. Biol. Psychiatry 63, 656–662.
Hardoon, D. R., and Manevitz, L. M. (2005). “fMRI analysis via one-class machine learning techniques,” in Proceedings of the 19th International Joint Conference on Artificial Intelligence (IJCAI), Edinburgh, 1604–1606.
Janoos, F., Machiraju, R., Sammet, S., Knopp, M. V., and Morocz, I. A. (2010). Unsupervised learning of brain states from fMRI data. Med. Image Comput. Comput. Assist. Interv. 6362, 201–208.
Kloppel, S., Abdulkadir, A., Jack, C. R. Jr., Koutsouleris, N., Mourao-Miranda, J., and Vemuri, P. (2011). Diagnostic neuroimaging across diseases. Neuroimage 61, 457–463.
Meier, T. B., Desphande, A. S., Vergun, S., Nair, V. A., Song, J., Biswal, B. B., et al. (2012). Support vector machine classification and characterization of age-related reorganization of functional brain networks. Neuroimage 60, 601–613.
Möller, U., Ligges, M., Grünling, C., Georgiewa, P., Kaiser, W. A., Witte, H., et al. (2010). Pitfalls in the clustering of neuroimage data and improvements by global optimization strategies. Neuroimage 14, 206–218.
Mourão-Miranda, J., Hardoon, D. R., Hahn, T., Marquand, A. F., Williams, S. C., Shawe-Taylor, J., et al. (2011). Patient classification as an outlier detection problem: an application of the one-class support vector machine. Neuroimage 58, 793–804.
Mueller, S. G., Weiner, M. W., Thal, L. J., Petersen, R. C., Jack, C. R., Jagust, W., et al. (2005). Ways toward an early diagnosis in Alzheimer’s disease: the Alzheimer’s disease neuroimaging initiative (ADNI). Alzheimers Dement. 1, 55–66.
Mwangi, B., Matthews, K., and Steele, J. D. (2012). Prediction of illness severity in patients with major depression using structural MR brain scans. J. Magn. Reson. Imaging 35, 64–71.
Nettiksimmonsa, J., Harveya, D., Brewerb, J., Carmichaelc, O., DeCarlic, C., Jack, C. R., et al. (2010). Subtypes based on cerebrospinal fluid and magnetic resonance imaging markers in normal elderly predict cognitive decline. Neurobiol. Aging 31, 1419–1428.
Ogawa, S., Lee, T. M., Kay, A. R., and Tank, D. W. (1990). Brain magnetic resonance imaging with contrast dependent on blood oxygenation. Proc. Natl. Acad. Sci. U.S.A. 87, 9868–9872.
Sato, J. R., da Graça Morais Martin, M., Fujita, A., Mourão-Miranda, J., Brammer, M. J., and Amaro, E. Jr. (2009). An fMRI normative database for connectivity networks using one-class support vector machines. Hum. Brain Mapp. 30, 1068–1076.
Sato, J. R., Hoexter, M. Q., Castellanos, X. F., and Rohde, L. A. (2012). Abnormal brain connectivity patterns in adults with ADHD: a coherence study. PLoS ONE 7:e45671. doi:10.1371/journal.pone.0045671
Scholkopf, B., Platt, J., Shawe-Taylor, J., Smola, A., and Williamson, R. (2001). Estimating the support of a highdimensional distribution. Neural. Comput. 13, 1443–1472.
Scott, D. W. (1992). Multivariate Density Estimation. Theory, Practice and Visualization. New York: Wiley.
Shawe-Taylor, J., and Cristianini, N. (2004). Kernel Methods for Pattern Analysis. Cambridge: Cambridge University Press.
Song, X., and Wyrwicz, A. M. (2009). Unsupervised spatiotemporal fMRI data analysis using support vector machines. Neuroimage 47, 204–212.
Tax, D. M. J., and Laskov, P. (2003). Online SVM learning: from classification to data description and back. IEEE Neural Netw. Signal Processing 499–508. doi:10.1109/NNSP.2003.1318049
Keywords: machine learning, SVM, one-class, neuroimaging, pattern recognition
Citation: Sato JR, Rondina JM and Mourão-Miranda J (2012) Measuring abnormal brains: building normative rules in neuroimaging using one-class support vector machines. Front. Neurosci. 6:178. doi: 10.3389/fnins.2012.00178
Received: 07 August 2012; Accepted: 24 November 2012;
Published online: 13 December 2012.
Edited by:
Pedro Antonio Valdes-Sosa, Cuban Neuroscience Center, USAReviewed by:
Yaroslav O. Halchenko, Dartmouth College, USACopyright: © 2012 Sato, Rondina and Mourão-Miranda. This is an open-access article distributed under the terms of the Creative Commons Attribution License, which permits use, distribution and reproduction in other forums, provided the original authors and source are credited and subject to any copyright notices concerning any third-party graphics etc.
*Correspondence: João Ricardo Sato, Center of Mathematics, Computation and Cognition, Universidade Federal do ABC, Rua Santa Adélia, 166, Bairro Bangu, Santo André, São Paulo, CEP 09.210-170, Brazil. e-mail:joao.sato@ufabc.edu.br
Disclaimer: All claims expressed in this article are solely those of the authors and do not necessarily represent those of their affiliated organizations, or those of the publisher, the editors and the reviewers. Any product that may be evaluated in this article or claim that may be made by its manufacturer is not guaranteed or endorsed by the publisher.
Research integrity at Frontiers
Learn more about the work of our research integrity team to safeguard the quality of each article we publish.