 Ashley Ansel
 Joshua P. Rosenzweig
 Philip D. Zisman
 Michal Melamed
 Benjamin Gesundheit
- Cell-El Ltd., Jerusalem, Israel
Autism spectrum disorders (ASDs) are a group of complex neurodevelopmental conditions that present in early childhood and have a current estimated prevalence of about 1 in 68 US children, 1 in 42 boys. ASDs are heterogeneous, and arise from epigenetic, genetic and environmental origins, yet, the exact etiology of ASDs still remains unknown. Individuals with ASDs are characterized by having deficits in social interaction, impaired communication and a range of stereotyped and repetitive behaviors. Currently, a diagnosis of ASD is based solely on behavioral assessments and phenotype. Hundreds of diverse ASD susceptibility genes have been identified, yet none of the mutations found account for more than a small subset of autism cases. Therefore, a genetic diagnosis is not yet possible for the majority of the ASD population. The susceptibility genes that have been identified are involved in a wide and varied range of biological functions. Since the genetics of ASDs is so diverse, information on genome function as provided by transcriptomic data is essential to further our understanding. Gene expression studies have been extremely useful in comparing groups of individuals with ASD and control samples in order to measure which genes (or group of genes) are dysregulated in the ASD group. Transcriptomic studies are essential as a key link between measuring protein levels and analyzing genetic information. This review of recent autism gene expression studies highlights genes that are expressed in the brain, immune system, and processes such as cell metabolism and embryology. Various biological processes have been shown to be implicated with ASD individuals as well as differences in gene expression levels between different types of biological tissues. Some studies use gene expression to attempt to separate autism into different subtypes. An updated list of genes shown to be significantly dysregulated in individuals with autism from all recent ASD expression studies will help further research isolate any patterns useful for diagnosis or understanding the mechanisms involved. The functional relevance of transcriptomic studies as a method of classifying and diagnosing ASD cannot be underestimated despite the possible limitations of transcriptomic studies.
Background
Autism spectrum disorders (ASDs) are a group of complex neurodevelopmental conditions that present in early childhood. Individuals with ASDs are characterized by having deficits in social interaction, impaired communication and a range of stereotyped and repetitive behaviors (Lord et al., 1994). In 2012, ASD has a current estimated prevalence of about 1 in 68 US children aged 8 years; estimated prevalence was significantly higher among boys (23.6 per 1000) than among girls (5.3 per 1000) (Christensen et al., 2016). ASDs are heterogeneous, and arise from epigenetic, genetic and environmental origins. The exact etiology of ASDs still remains unknown and ASD cases with a genetic etiology only collectively account for 10–20% at most (Abrahams and Geschwind, 2008). The precise role of genetics in the pathogenesis of ASD remains unclear. On the one hand, there are several hints that genetics play a role (Wang et al., 2009). For example, there are much higher concordance rates of ASDs in monozygotic twins (70–90%) than dizygotic twins (0–10%) (Abrahams and Geschwind, 2008). Similarly, the recurrence risk in families ranges from 12.9% (Sandin and Reichenberg, 2014) to 18.7% (Ozonoff et al., 2011; Yuen et al., 2015). Furthermore, more than 100 ASD-susceptibility genes have already been identified (Yuen et al., 2015). On the other hand, these specific genetic mutations account for less than 8% of cases (Alter et al., 2011). There are a number of explanations for this ambiguity ranging from gene-gene interactions, to the heterogeneity of the disease, to epigenetic factors (Alter et al., 2011). Broad gene expression screening of children diagnosed with ASD is one approach toward mitigating the challenge of the heterogeneity of ASD by separating those diagnosed with ASD into subclasses according to gene expression profiles.
In the most recent comprehensive review of gene expression studies in ASD in 2012, Voineagu et al. surveyed 10 major mRNA studies across two types of samples [lymphoblastic (LBL) and post-mortem brain tissue]. They found that transcriptome analysis was more efficient than DNA studies in identifying differences between ASD and controls. Focusing on human mRNA studies since 2011 in English that monitor up or down regulation of multiple genes in ASD, without comparing to other disorders, we find that 27 major new studies have been published. By considering both single gene studies and more complex studies looking at pathways, researchers will be able to compare their findings to individual lists of genes but also to attempt to place their findings in a broader context by looking at pathway networks implicated in ASD. For example, if a researcher identifies a single specific gene to be upregulated in a specific type of tissue in ASD, that can then be compared to other single gene studies across different tissue types to see if there is consistency in the directionality of regulation and across tissue types. Additionally, by looking at a variety of networks and pathways, researchers can see the interaction between various neurodevelopmental and immune processes. These studies follow similar methodology to the studies previously discussed; though some expand to a third tissue type namely, intestinal biopsy samples.
Gene Expression Studies in ASD by Tissue Type
In reviewing the new gene expression studies since Voineagu's paper (Table 1), the classification according to sample source will prove helpful. Five sample sources were studied: post-mortem brain, peripheral blood, gastrointestinal tissue, adult olfactory stem cells, and scalp hair follicles. Before beginning with the post-mortem brain tissue studies, it is relevant to mention gross pathological and radiological brain findings that might provide context for the brain-related expression findings.
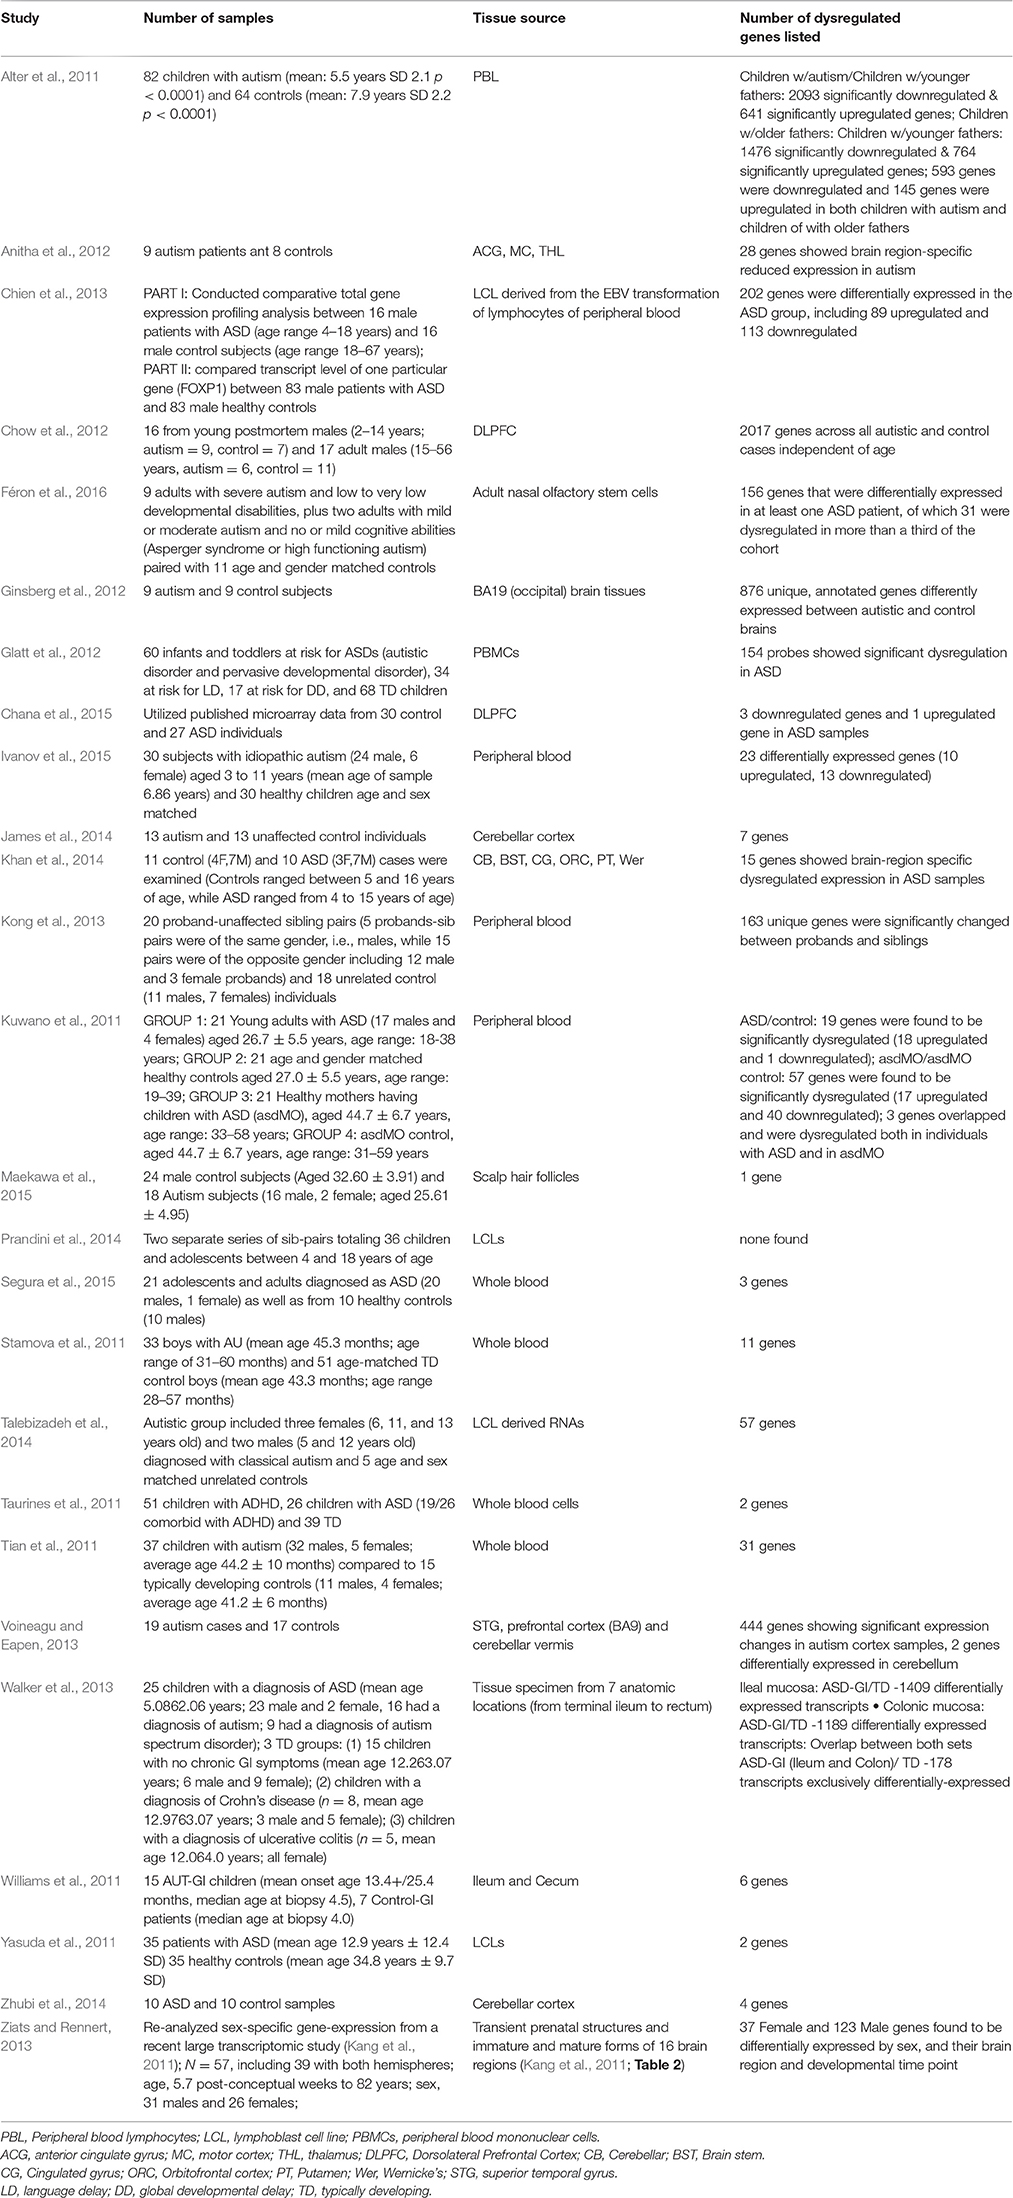
Table 1. Gene Expression Studies of Autism: 2011 onwards (Year chosen since Voineagu et al. review paper is from 2012).
Neurological Background
Evidence for neurological involvement in ASD can be divided into neuroimaging and post-mortem pathology.
Neuroimaging
Neuroimaging studies of children with autism have revealed abnormal brain overgrowth in prefrontal, temporal and amygdala regions and abnormal functional asymmetry and activation in the cortex and cerebellum (Chow et al., 2012). Neuroimaging techniques such as functional MRI has shown altered patterns of functional specialization in autism in several domains of thinking, such as cognitive, linguistic, social, and visuospatial processing in children and adults with ASD (Maximo et al., 2014). Impaired functional connectivity may demonstrate inefficiency in maximizing network connections to execute tasks, yet the findings of over-connectivity have been interpreted to reflect hyper-specialized, rather than more efficient connectivity. Based on the abundance of information, inefficient connectivity may be the hallmark of ASD.
Pathology
Pathology on postmortem brains from subjects diagnosed with ASD have demonstrated abnormalities in neuronal organization of the cerebral cortex and decreased number of Purkinje cells in the cerebellum (Garbett et al., 2008). Children between 2 and 4 years old diagnosed with ASD have been found to have increased total cerebral gray and white matter, excess neurons in the pre-fontal cortex, and an increase in brain weight at autopsy (Courchesne et al., 2011; Hazlett et al., 2011). In some children diagnosed with ASD, the rate of head growth and brain growth is exceptionally rapid during the first few years of life. Additionally, although most children with autism are born normocephalic, during the first years of life, 15–20% will develop macrocephaly (Lainhart et al., 2006). However, by late adolescence and early adulthood, the autistic brain commonly displays neuron loss and cortical thinning and is no longer enlarged (Kates et al., 2004).
Post-Mortem Brain Tissue Gene Expression Studies
With the background provided by the neuroimaging and pathology findings in mind, gene expression studies in brain tissue can now be reviewed. There are nine gene expression studies that look at a variety of brain regions. The studies are all very small but produced large numbers of genes with variable expression between ASD and control. Chow et al. analyzed frozen samples of dorsolateral prefrontal cortex from 16 young postmortem males (9 autism, 7 control) and 17 adult males (6 autism, 11 control) in order to study age-dependent brain gene expression (Chow et al., 2012). They found 102 genes, which contrasted between young children diagnosed with ASD and control groups, and 736 genes, which contrasted between adults diagnosed with ASD and control groups. Ginsberg et al. analyzed cerebellar and BA19 (Brodmann Area 19, occipital) brain tissues from 9 control and 9 autism patients (Ginsberg et al., 2012). After correcting for the region of the brain, they discovered 876 unique, annotated genes expressed differently between autistic and control brains. This was a false discovery rate of five percent. Anitha et al. compared the expression of 84 electron transport chain genes belonging to the 5 complexes in the post-mortem brains of 8 autism patients and 10 controls. They found that 11 genes of Complex I, 5 genes each of Complex III and Complex IV, and 7 genes of Complex V (28 genes in total) showed brain region-specific reduced expression in autism (Anitha et al., 2012). Voineagu et al. profiled post-mortem samples of the superior temporal gyrus, prefrontal cortex, and cerebellar vermis regions from 19 autism and 17 control cases (Voineagu and Eapen, 2013). They identified 444 genes, which showed significant expression changes in autism cortex samples as compared to the controls, while only 2 genes were differentially expressed in the cerebellum. Ziats et al. re-analyzed a large transcriptomic study in the developing brain that was done by (Kang et al., 2011; Ziats and Rennert, 2013). The study performed genome-wide microarray analysis on postmortem human brain tissues from 16 brain regions spanning preconception to adulthood, specifically looking to identify sex-biased gene expression in the developing brain. Thirty-seven female, and 123 male genes were found to be differentially expressed by sex, brain region, and developmental time point. Khan et al. analyzed altered thyroid hormone-dependent brain gene expression by studying various brain regions from 10 ASD and 11 control cases (Khan et al., 2014). They found 14 genes that were differentially expressed based on sex-specific brain area. For example, expression of the DIO2 gene, a gene involved in thyroid hormone activation, was increased in the putamen (p < 0.05) and there was a trend toward increase in cingulated gyrus (p = 0.08) of the female ASD cases, while expression of the Cirbp gene, a gene responsible for stabilizing transcripts of genes involved in cell survival, was decreased (p < 0.05) in the putamen of ASD male cases only. James et al. compared 1 sq cm blocks of cerebellar cortex from 13 individuals with ASD and 13 controls (James et al., 2014). They observed a significant increase in both 5-mC and 5-hmC in the cerebellum of individuals with ASD relative to control samples. DNMT3A, DNMT3B, TET1, TET3, which are all genes related to methylation and 8-oxo-deoxyguanosine (8-oxo-dG) (a major product of DNA oxidation) expression levels were significantly increased in the cerebellum of individuals with ASD relative to control samples. They also found that within the EN-2 promoter sequence there was a statistically significant positive association between 5-hmC (a gene important in epigenetics) and EN-2 gene expression. Additionally an association between 5-hmC and EN-2 gene expression in the 5′ promoter CpG Island was found in people diagnosed with ASD but not in controls. Studies of MeCP2 (a chromosomal protein that binds to methylated DNA) binding in the EN-2 promoter demonstrated a significant decrease in repressive MeCP2 binding to the identical 5′ promoter region that contained increased levels of 5-hmC in individuals with ASD relative to control samples. Zhubi et al. also compared blocks of cerebellar cortex from 10 individuals with ASD and 10 control samples. They found a one and a half to two time increase in binding of MeCP2 to GAD1 and RELN promoters in the cerebellum of individuals diagnosed with autism when contrasted to controls. RELN plays a role in layering of neurons in the cerebral cortex and cerebellum. They detected that levels of 5-hmC were significantly enriched at GAD1 and RELN promoters in individuals with ASD. The methylation changes they found lead to a remarkable increase in the amounts of 5-hmC relative to 5-mC. The 5-hmC/5-mC ratio at the GAD1 promoter is 5.5 in people diagnosed with ASD and only 1.2 in controls. Similar to James et al. (2014), they also found TET1 mRNA levels to be increased in the cerebella of individuals with ASD (Zhubi et al., 2014). Chana et al. (2015) compared data from brain tissue from 30 controls and 27 individuals diagnosed with ASD. They found that expression of mGluR5 was decreased in ASD when compared to controls. This gene has been found to be associated with the forming of synapses, activation of microglia, and other processes.
Immune System
One study demonstrated findings in post-mortem brain tissue that were specific to the immune system. Considering the extensive literature analyzing the relationship between the immune system and ASD (Gesundheit et al., 2013), this demands further attention. Garbett et al. analyzed frozen samples of superior temporal gyrus from 6 subjects with ASD and 6 controls (Garbett et al., 2008). Based on four parameters, they identified 152 differentially expressed gene products, and of these, 130 demonstrated increased expression while 22 showed decreased levels in the brains of individuals with ASD. Seventy-two annotated differentially expressed transcripts were either cytokine responsive transcripts or transcripts related to the immune system. Additionally, they noticed decreased transcript levels for a number of genes involved in outgrowth and neuronal differentiation. They used Gene Set Enrichment Analysis, which marks functional pathways in which gene expression changes are grouped together. This enabled the identification of 31 gene sets that were differentially expressed between individuals with autism and control samples. Of the 31, 19 genes were involved in immune system function.
Peripheral Blood Gene Expression Studies
The second and most common source used in gene expression studies for autism was lymphoblastoid cell lines (LCLs). There is an apparent discrepancy between neuroanatomical and cellular abnormalities observed for autism at younger ages and molecular pathologies at more advanced ages. Hu et al. analyzed LCLs derived from lymphocytes of 3 pairs of monozygotic twins that were discordant with respect to clinical diagnosis of ASD (Hu et al., 2006). Twelve hundred genes were identified as significant with a false discovery rate of 26%, 25 genes were found to be up-regulated at least 1.5-fold in the more severely affected twin relative to the other twin (log2 (ratio) = 0.58) and 19 genes were down-regulated by at least 1.5-fold. Of these, eight of the 26 genes match genes connected to neurological function, development, or disease. In 2009, Hu et al. conducted microarray analysis on 116 LCLs from individuals with idiopathic autism who were separated into three phenotypic subcategories according to severity scores from the ADI-R questionnaire and age-matched, typically developing controls. They identified 530 significantly differentially expressed genes that distinguished controls from all samples with ASD. Hu et al. analyzed gene expression profiling and how it differentiates ASD from controls and phenotypic variants of ASD (Hu et al., 2009). Microarray analyses were conducted on 116 LCLs from individuals with idiopathic ASD who were separated into three phenotypic subgroups according to severity scores from the ADI-R questionnaire and age-matched, non-autistic controls. Five hundred and thirty significantly differentially expressed genes were found that distinguished the samples of ASD from controls. They also identified 123 significant genes from 4-class significance analysis of microarrays (SAM) analysis of data from gene expression from severe, mild, and savant subgroups and the non-autistic control groups. When the pathways of the overlapping genes were analyzed between the severe language and mild autism subgroups, a network of genes that affect common functional targets, such as synaptic transmission, neurogenesis, neurulation, long-term potentiation (learning), protein ubiquitination, and brain function was revealed. Additionally, 15 significant differentially expressed genes that regulate circadian rhythm were found, unique to the most severely affected ASD subgroup. Differential expression of these genes was observed only in the samples from severely language-impaired individuals (L subgroup), with each individual showing altered expression of multiple (but not all 15) genes. Emanuele et al. investigated increased dopamine DRD4 receptor mRNA expression in lymphocytes of individuals diagnosed with autism and musicians in order to explore the music-autism connection. The DRD4 receptor is known to be responsible for neuronal signaling in the mesolimbic system of the brain. They studied 20 ASD patients, 19 professional adult musicians, and 19 gender and age matched control individuals who were not interested in playing or listening to music. Analysis of variance (ANOVA) demonstrated significant differences in DRD4 mRNA expression between the groups (P = 0.008). Post-hoc analysis highlighted significant differences between the control group and both musicians (P < 0.05) and individuals diagnosed with ASD (P < 0.05) (Emanuele et al., 2010). Yasuda et al. measured mRNA expression levels in lymphoblastoid cells from 35 subjects with ASD and 35 controls. They found that in individuals diagnosed with autism, B-actin normalized NLGN3 expression levels or TATA-binding protein were decreased by 35 or 26% respectively. They also found that gene expression levels of the SHANK3 gene, a gene that codes for a major scaffold postsynaptic density protein, regulated by B-actin or TATA binding protein were also decreased in individuals with autism by 39 or 40% respectively (Yasuda et al., 2011).
Stamova et al. looked for correlations between gene expression and mercury level in blood of boys with and without ASD. They collected whole blood from 33 boys with ASD and 51 age-matched typically developed (TD) control boys. There was no significant difference in Hg levels between the ASD and TD groups. They found 11 genes whose expression correlated inversely with mercury levels in boys diagnosed with autism compared to typically developing children. One limitation of this study was that samples collected from children ages 2–5 do not consider the possible direct role of mercury as a causal factor for autism, which likely starts in utero or shortly after birth (Stamova et al., 2011).
Tian et al. looked for correlations of gene expression with blood lead levels in children diagnosed with autism contrasted to typically developed controls. They looked at 37 children with ASD, and 15 TD controls. There was no significant difference in blood lead levels. Forty-eight probe sets represent 31 genes, whose expression correlated with lead levels in each group, and the partial correlation coefficients were statistically different between the groups; most of the genes are negatively correlated with blood lead levels in typically developed children and positively correlated with blood lead levels in children diagnosed with autism. The conclusion of their study, however was that lead most likely does not explain the increasing incidence in ASD (Tian et al., 2011).
Alter et al. looked at ASD and changes related to paternal age in overall levels of gene expression regulation. They performed gene expression microarrays on RNA from peripheral blood lymphocytes of 82 children with ASD and 64 controls where parental age was similar between the 2 groups. They then performed a secondary analysis by analyzing paternal age difference as a risk factor for ASD and whether it was associated with variance. They found that the distribution of gene expression levels on microarrays from individuals with autism had a decreased variance when compared to microarrays from controls (p = 0.006). They also found that in controls, but not in children with ASD, overall variance in gene expression was found to be significantly and negatively associated with the age of the father (p = 0.03), so as predicted, the overall variance was the same in children of fathers who were older and children with ASD with fathers of any age. In the comparison of children with ASD to children with fathers of a younger age, there were 2093 genes that were significantly downregulated by at least 1.1-fold, and only 641 that were upregulated. In the blood of children with fathers who were older compared to the children with younger paternal age, there were 1476 downregulated and 764 upregulated genes. There were 593 genes that were downregulated in both children with ASD and children of with older fathers (p < 0.000001) and 145 genes that were upregulated in both comparisons (Alter et al., 2011).
Chien et al. looked at increased gene expression of FOXP1 by comparing LCL between 16 males diagnosed with ASD and 16 male controls. FOXP1 is a transcriptional repressor. A total of 252 differentially expressed probe sets corresponding to 202 genes were detected between the 2 groups, including 89 up- and 113 down-regulated genes in the group diagnosed with autism. Real-time quantitative polymerase chain reaction (RT-qPCR) verified significant elevation (1.89 ± 2.64, P = 0.005) of the FOXP1 gene transcript of LCL in a sample of 83 male patients, compared with 83 male controls. Using three platforms, they found several immune-related pathways showing significant differences between the ASD patients and controls (Chien et al., 2013).
Prandini et al. analyzed RBFOX1 gene expression in LCL of Italian discordant ASDs sib-pairs totaling 36 children and adolescents. Their data showed however, that RBFOX1 normalized mean values were not significantly different between controls and those diagnosed with ASD, they suggested a possible cause for this might have been due more subtle transcription level differences in RBFOX1 gene expression in LCL than in brain samples (Prandini et al., 2014).
Talebizadeh et al. performed a pilot study and looked at exon-level expression profiling and alternative splicing in ASD using LCL. They found 57 genes that were differentially expressed at the exon level between ASD and control samples. They also found differential splice variants of the gene CYFIP1 (which has 2 protein-coding transcripts in the literature), exon array analysis demonstrated a higher expression for the probe sets which binds to exon 16 in variant 1 (encoding a long form) in subjects with ASD vs. controls. DNA sequencing following RT-PCR for variant 1 also detected a product missing exon 16 inducing a premature stop codon, and qRT-PCR showed a higher expression of variant 1 in ASD compared with control samples. RT-PCR reactions were run for TRAP150 and ZMYM6 and DNA sequencing of the amplified products supported the fact that these exons undergo alternative splicing and enabled the indication of previously unreported alternative splicing isoforms for these two genes. These new variants included one isoform of TRAP150 (missing exon 4 resulting in an in-frame loss of 301 amino acid residues) and five alternatively spliced ZMYM6 variants that are labeled on the basis of the missing exons (isoforms missing exon 2, exon 4, exons 2&4, exons 2&5, and exons 2, 4, &5). ZMYM6 variants missing exon 2, the location of the start codon, most likely do not code for proteins and the exclusion of only exon 4 introduces a premature stop codon (Talebizadeh et al., 2014).
Immune System-Background
The role of the immune system in ASD is an active area of research. Evidence of an immune role in at least a subset of children diagnosed with ASD can be divided into brain antibodies, serum cytokines, family history and immunogenetics (Gesundheit et al., 2013).
Immune System-Gene Expression Studies
Gregg et al. subdivided the children into three groups based on various clinical criteria. Their sample size included 49 children on the autism spectrum and 12 controls. Unpaired t-tests detected a number of genes that were regulated more than 1.5-fold for autism vs. general population (n = 55 genes), for history of early onset vs. general population (n = 140 genes), and for developmental regression vs. general population (n = 20 genes). The three gene lists from the analysis were used to identify a small group of 11 genes that are shared between the three groups. These genes were all expressed in natural killer cells and many belonged to the KEGG natural killer cytotoxicity pathway. Database for Annotation, Visualization and Integrated Discovery (DAVID) and Ingenuity Pathway Analysis were used to analyze pathways, and notable pathway overlaps included natural killer cell signaling in all three comparisons, IL-2 signaling and serotonin receptor and dopamine receptor signaling in autism vs. general population and early onset vs. general population, and retinol and methionine metabolism in the early onset vs. general population analysis (Gregg et al., 2008).
Enstrom et al. analyzed peripheral blood from 35 children with ASD and 11 age and gender matched controls. They discovered that a total of 626 probes showed differential gene expression between the two groups (82 significantly higher and 544 significantly lower in the ASD group). The 82 upregulated probes in ASD correlated to 59 known genes, most of which have been connected to leucocyte function, more specifically the function of natural killer cells. Using microarray analysis, their studies demonstrated that 12 gene probes, corresponding to 11 different genes were differentially expressed in early onset and regressive types of ASD when compared with the control group. Flow cytometric analysis of natural killer cells demonstrated increased production of granzyme B, perforin, and interferon gamma (IFNγ) under resting conditions in children diagnosed with ASD (Enstrom et al., 2009).
Kuwano et al. looked at ASD-associated gene expression in peripheral leucocytes that were often noticed between subjects with ASD, and healthy mothers of children with ASD. They used DNA microarray to perform gene expression profiling in peripheral blood on 21 individuals from 4 groups: young adults with ASD, age and gender matched controls, mothers having children with ASD (asdMO), and age matched controls having healthy children. They found 19 genes that were significantly differentially expressed (18 up and 1 down-regulated) when comparing the ASD to the control group, and 57 genes that were differentially expressed between the asdMO group and the asdMO control group (17 up-regulated and 40 down-regulated genes fold change >2.0). Three genes overlapped and were dysregulated in both individuals diagnosed with ASD and in asdMO. An ASD-associated gene expression pattern was often observed in both asdMO and individuals with ASD even though they had no symptoms above clinical threshold of ASD (expression of the 19 and 57 genes was changed in a parallel direction; Kuwano et al., 2011).
Glatt et al. identified 60 infants and toddlers at risk for ASDs, 34 at risk for language delay, 17 at risk for global developmental delay, and 68 typically developing children. One hundred and fifty four probes showed significant dysregulation in ASD, and a log 2-fold change. The most accurate support vector machine utilized the magnitude of the expression of 48 probes to classify 71% of ASD and control subjects across 10 subsets of discovery sample into their appropriate diagnostic categories. Of 30 individuals diagnosed with ASD, 27 were correctly classified by this support vector machine as having ASD, 23/34 control subjects were correctly classified as controls. The list of 48 probes making up the best support vector machine classifier of ASDs was most significantly enhanced with genes related to immune responses, genes of the hemoglobin complex, and genes with guanine- or guanylate-binding affinity (Glatt et al., 2012).
Kong et al. performed a genome-wide expression profile of the blood from 20 proband-unaffected sibling pairs, and 18 unrelated controls. One hundred and eighty nine probe sets that represented 163 unique genes (including 2 previously reported ASD candidate genes) were significantly changed between probands and siblings—84 probands were up-regulated compared to unaffected siblings (Kong et al., 2013).
Segura et al. looked at neurotrophin blood-based gene expression and social cognition analysis by obtaining whole blood from 21 adults and adolescents diagnosed as ASD, as well as from 10 controls. Social cognition abilities of subjects with ASD and controls were determined according to three Theory of Mind tests (RME, Faux pas test, The Happé stories). They found that NT3 and NT4 mRNA expression in the whole blood was significantly lower in ASD patients compared to healthy controls (P < 0.05). They also found that P75NTR mRNA expression was significantly higher in ASD patients than in controls. The ASD group received lower scores in three Theory of Mind tasks compared to the control group, which indicates that social cognition impairments in association with the ASD phenotype, yet no correlations were observed between neurotrophins and their receptors expressions and measures of Theory of Mind (Segura et al., 2015).
GI and ASD Background
Gastrointestinal (GI) symptoms are common in children with ASD compared with typically developing children and those with other developmental delays. Some controversial studies suggest that as many as 70% of children with ASD exhibit chronic GI-related symptoms (Walker et al., 2013).
Gastrointestinal Tissue Gene Expression Studies
Williams et al. looked at impaired carbohydrate digestion and transport and mucosal dysbiosis in the intestines of children diagnosed with ASD and gastrointestinal disorders. They found that the levels of three brush border disaccharidases (sucrase isomaltase [SI], maltase glucoamylase [MGAM], and lactase [LCT]) were all significantly decreased in children with ASD and GI complaints (ASD-GI). Within the ASD-GI group, 86.7, 80, and 80% of children had lower transcript levels in SI, MGAM, and LCT respectively. Almost all (14/15, or 93.3%) ASD-GI children had deficiencies in at least one disaccharidase enzyme; 80% had deficiencies in 2 or more enzymes; and 73.3% had deficiencies in all three enzymes. Real-time polymerase chain reaction (RT-PCR) revealed a significant decrease in 2 hexose transporters: ileal SGLT1 mRNA and GLUT2 mRNA in ASD-GI children. For SGLT1, 73.3% of ASD-GI children had deficient transcript levels, and 73.3% of ASD-GI children had deficient GLUT2 transcript levels, relative to control-GI children. In total, 93.3% (14/15) of ASD-GI children had mRNA deficiencies in at least one of the five genes involved in carbohydrate digestion or transport; 66.7% (10/15) had mRNA deficiencies in all five genes (Williams et al., 2011).
Similarly, Walker et al. looked at subjects including children with ASD and three typically developing groups including (1) children who underwent diagnostic ileocolonoscopy for chronic GI symptoms in which no histopathology; (2) children with Crohn's disease (3) and children with ulcerative colitis. Pairwise analysis between the ileal mucosa from ASD-GI and non-inflamed control samples resulted in 1409 differentially expressed transcripts unique to the ASD-GI samples. Pairwise analysis between inflamed colonic mucosa from ASD-GI children and non-inflamed control samples resulted in 1189 differentially expressed transcripts unique to ASD-GI samples. The overlap between the 2 sets (ileum and colon) resulted in 178 transcripts that were exclusively differentially expressed in both ileal and colonic tissues form the ASDGI population. When these 178 transcripts were analyzed using Ingenuity Pathway Analysis software, three of the top associated biological functions were inflammatory disease, endocrine system development and function, and digestive system development and function (Walker et al., 2013).
Adult Olfactory Stem Cell Gene Expression Studies
Féron et al. used adult nasal olfactory stem cells from nine adults with severe ASD and low developmental disabilities (DSM-5), plus two adults with mild ASD and no or mild cognitive abilities (Asperger syndrome or high functioning ASD) paired with 11 age and gender matched controls. Gene microarray analysis highlighted 156 genes that were differentially expressed in at least one ASD patient, of which 31 were dysregulated in more than 33% of the cohort (9 out of the 156 genes have been previously associated with ASD). They found that MOCOS, an enzyme involved in purine metabolism, is downregulated in most ASD individuals (8/11), compared to controls (Féron et al., 2016).
Hair Follicle Gene Expression Studies
Maekawa et al. utilized scalp hair follicles as a source of biomarker genes and found that the gene CNTNAP2 showed significantly decreased expression in samples from subjects with ASD compared with control follicles (Maekawa et al., 2015).
Gene Expression Analysis: Comorbidities
A few of the gene expression studies looked at people diagnosed with ASD and comorbidities.
ASD and Fragile X/Dup 15q
Nishimura et al. performed genome-wide expression profiling of LCL in order to distinguish different forms of ASD and to reveal shared pathways. Individuals with ASD both with and without FMR1-FM or dup (15q) were compared to TD male controls. The combination of ANOVA, SAM and RankProd, isolated 120 genes in ASD with FMR1-FM, and 80 genes in ASD dup (15q), 68 genes were found to be dysregulated in both ASD with FMR1-FM and dup (15q) (so 52 genes were selectively dysregulated only in ASD with FMR1-FM, and 12 genes were selectively dysregulated only in ASD with dup (15q). They also found a potential molecular connection between FMR1-FM and dup (15q), the cytoplasmic FMR1 interaction protein 1 (CYFIP1), which was up-regulated in dup (15q) patients. Expression of JAKMIP1 and GPR155 was significantly dysregulated in the 27 males with ASD when compared with their siblings without ASD. JAKMIP1 is a gene known to be related to microtubule transport. Genes related to chaperone and protein folding were enriched in the 52 genes selectively dysregulated in ASD with FMR1-FM; genes related to RNA binding and mRNA metabolism were also enriched in this set (this is consistent with FMRP protein's function as an RNA binding protein important in regulatory translation) (Nishimura et al., 2007).
ASD and ADHD
Taurines et al. looked at altered mRNA expression of monoaminergic specific genes in the blood of children with ADHD and ASD. They found a significant group difference with decreased DRD5- level in ASD patients when compared with controls and to patients diagnosed with ADHD. Post-hoc analyses demonstrated reduced DRD4-levels in the group of both ADHD patients and ASD patients when compared with healthy controls (Taurines et al., 2011).
Gene Expression in ASD-Summary (Table 2)
Sample Source Types
When the gene expression studies are viewed together independent of source type, over 100 genes are found in more than one study. Interestingly, whether the gene is up-regulated or down-regulated is independent of the source of the gene sampled and can even vary within the same source type in different studies. For example, the gene NDUFB5 was found to be upregulated in LCL derived cell line RNA's (Talebizadeh et al., 2014), but downregulated in three different regions of post-mortem brain tissue (Anitha et al., 2012). The gene NEURL3 was up-regulated in peripheral blood in a study conducted by Chien et al. (2013), but down-regulated in peripheral blood in a study conducted by Kong et al. (2013). However, most genes that were up or down-regulated followed the same pattern in different studies across sample source types.
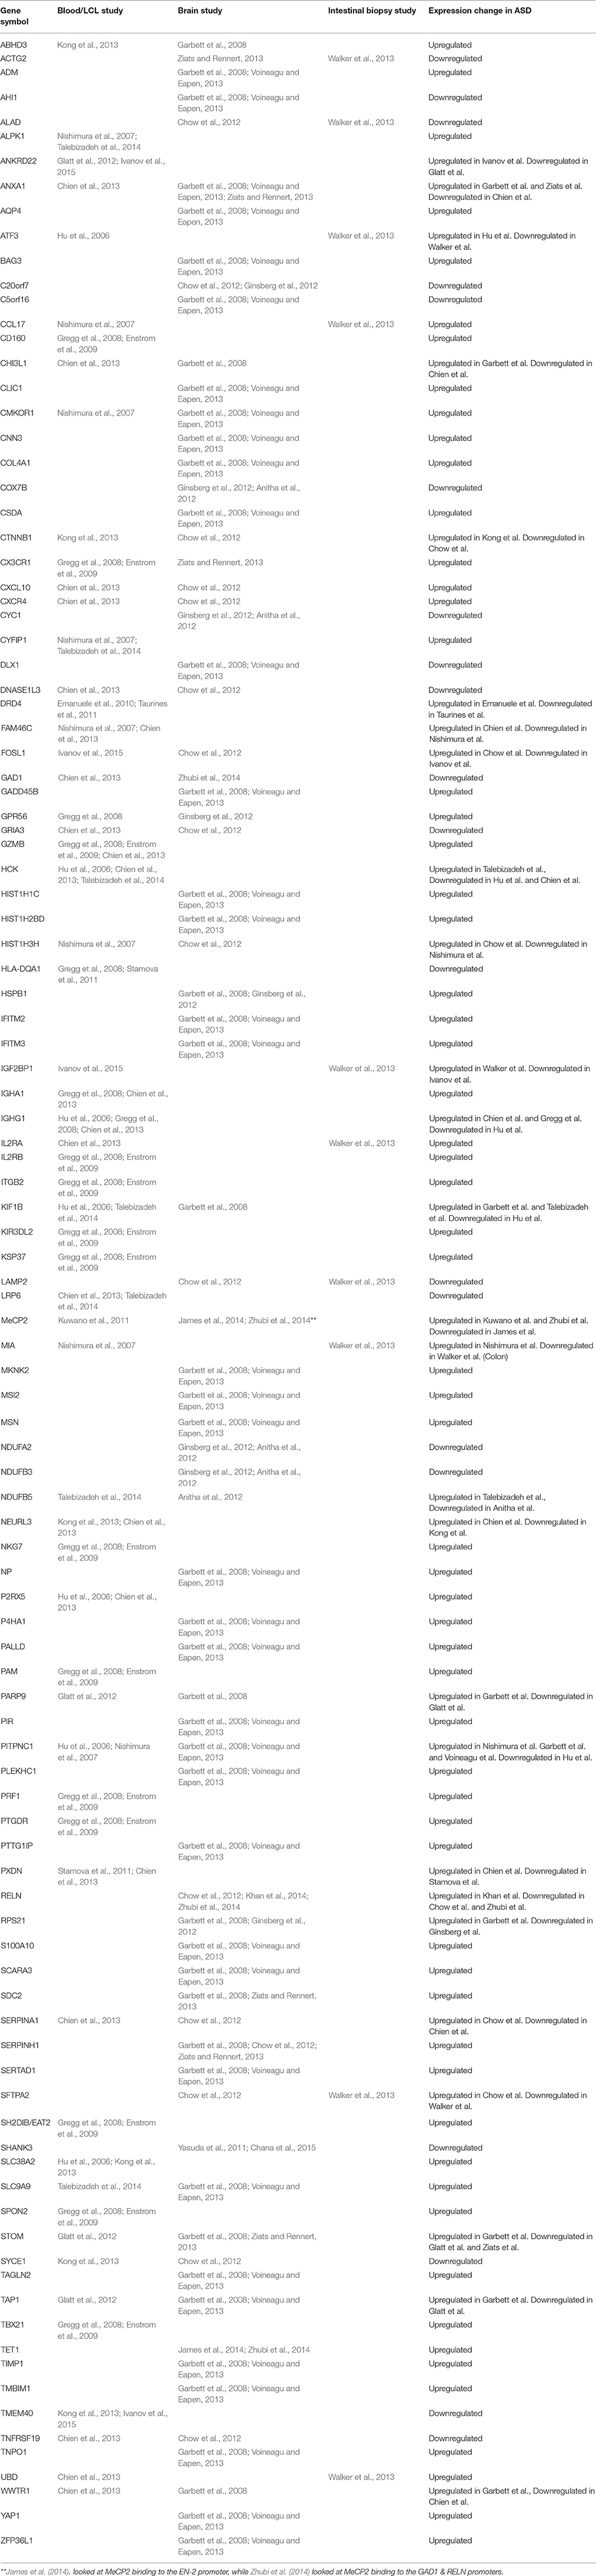
Table 2. Gene expression changes in ASD detected in multiple independent studies in various tissues.
Pathways (Table 3)
One of the aims of gene expression studies is to look for multiple genes in the same pathway. This should provide some clues to the underlying mechanism of the disease. From the studies surveyed, five pathways were found three times across different studies, and eight pathways were found twice. The pathways that were found three times included: cell cycle, cell death, GI disease, immune function, and neurogenesis. All of these areas are already areas of extensive research in ASD and therefore, they are not-surprising. The pathways that were found twice were: alternative splicing, arrhythmogenic right ventricular cardiomyopathy, cellular assembly and organization, cell-to-cell signaling and interaction, gap junction, inflammation, small molecule biochemistry, and ubiquitin mediated proteolysis. While inflammation and cell signaling are already areas of research for ASD, the potential relationship between the other pathways and ASD deserves further consideration. A more recent paper by Ivanov et al. (2015) highlights a number of other pathways and their importance in understanding the function of genes including the Wnt pathway and the calcium pathway, which is involved in the development of the nervous system and deserves further investigation regarding its potential role in ASD. Similarly, Wen et al. (2016) found the calcium signaling pathway to be a very active pathway in ASD. The precise role of calcium signaling in ASD and its potential relationship to other common metabolic disturbances in ASD demands further research.
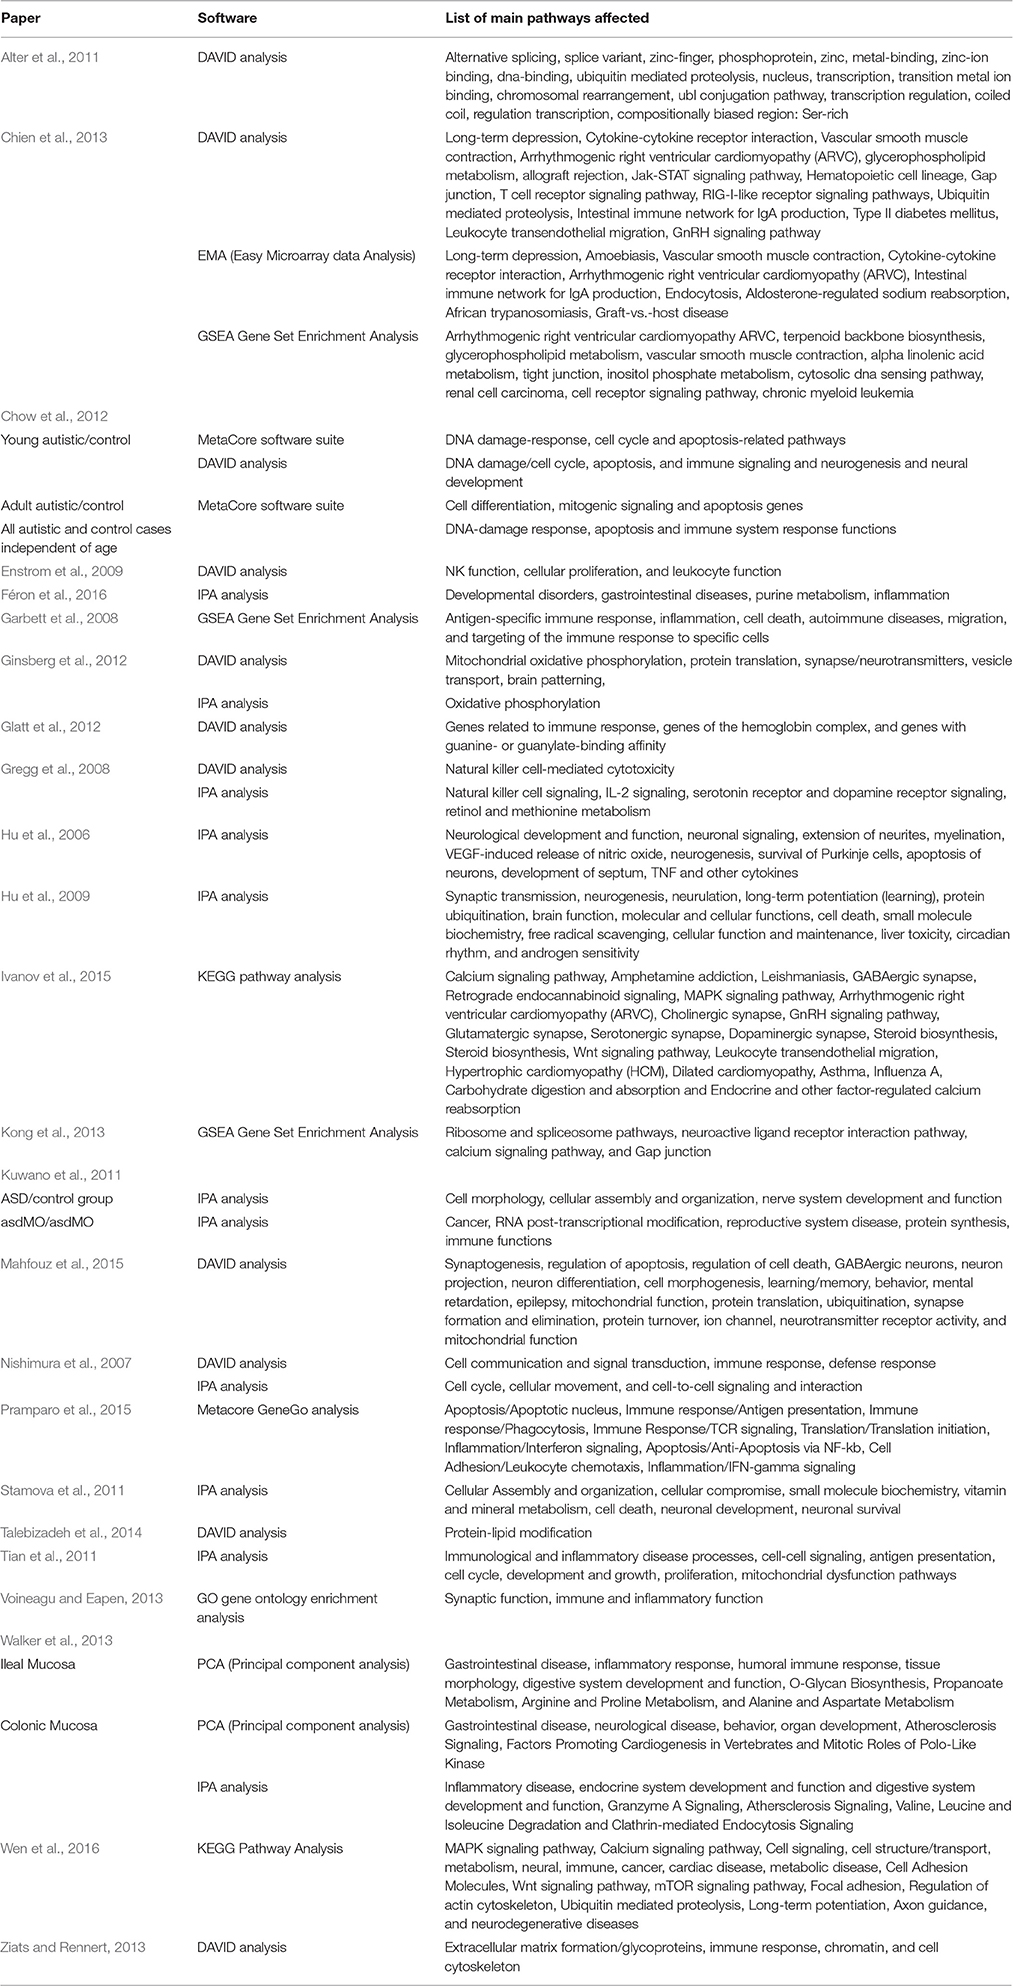
Table 3. List of main pathways affected.
Specific Genes/Pathways Already Implicated in ASD or in Processes Relevant to ASD
There are numerous examples of specific genes that have been shown to be altered between ASD and control samples. All have been shown to be directly related to important processes that when reduced or altered, can be connected to ASD. These genes can be roughly subdivided into genes related to the brain and genes related to the immune system.
Brain Related Genes
Hu et al. found the protein ASS to be upregulated in the autism samples. ASS controls the rate-limiting step involved in nitric oxide (NO) production via regeneration of arginine from citrulline, a by-product of the nitric oxide synthetase (NOS) reaction. Since NO is a important signaling molecule in the brain and has been implicated in several disorders, including ASD, thus the increased expression of ASS may be potentially relevant to the ASD phenotype (Hu et al., 2006).
Based on the findings of Nishimura et al., since CYFIP1, which was shown to be upregulated in dup (15q) patients is known to counteract FMRP, they reason that the induction of CYFIP1 in dup (15q) might elucidate some of the significant overlap between ASD with FMR1-FM and with dup (15q). They also found that JAKMIP1 was significantly induced in ASD with FMR1-FM and had a positive trend in ASD with dup (15q), suggesting that JAKMIP1 could represent a commonly dysregulated pathway. This gene is a particularly biologically important candidate, given its putative role in GABAB receptor expression and microtubule networks (Nishimura et al., 2007).
Since Taurines et al. found reduced expression in ASD probands of DRD5 which is expressed in the hippocampus associated areas and is thought to be important in the induction of long term potentiation related to novel events, it can be suggested that the reduced expression could give insight into the fact that probands have less expression of an important hippocampal gene (Taurines et al., 2011).
Kuwano et al. found that mRNA levels of ITGA2B encoding glycoprotein (GP) αIIβ were upregulated both in individuals with ASD and in asdMO; GPαIIβ forms αIIbβ3 integrin with ITGB3, an ASD-susceptible gene. Since αIIbβ3 integrin has an critical role in cell morphology, including synapse maturation, the increased expression of ITGA2B mRNA might change cellular morphology of peripheral cells in mothers having children with ASD as well as subjects with ASD (Kuwano et al., 2011).
Chow et al. showed that the A2A receptor-signaling pathway was the top dysregulated pathway in the young autistic brain. Adenosine receptors are crucial for both brain development and function including the regulation of neuronal stem cell proliferation, synaptic plasticity, motor function, cognition and emotion-related behaviors (Chow et al., 2012).
Voineagu et al. identified that A2BP1/FOX1, a neural and muscle specific alternative splicing regulator (and the only splicing factor previously implicated in ASD) was down-regulated in several individuals with ASD (Voineagu and Eapen, 2013).
The reports of James et al. showed that elevated 5-hmC in the EN-2 promoter is correlated with a significant decrease in repressive MeCP2 and histone H3K27me3 which appear to override 5-mC hypermethylation. These epigenetic changes are thought to loosen enhancer region chromatin which would facilitate enhancer binding and promote sustained upregulation of EN-2 expression. Since perinatal EN-2 downregulation is crucial for normal Purkinje cell differentiation and cerebellar patterning, the consistent postnatal overexpression of EN-2 suggests that the shutting of this programmed developmental window may have been missed in some individuals with ASD because of epigenetic abnormalities (James et al., 2014).
NT3&NT4, which were down to have lower expression in ASD patients compared to controls by Segura et al. play a crucial role in the development of the climbing fiber system of the cerebellar Purkinje cells (PCs), and NT3 selectively increased their survival. PC's are the primary efferent neurons of the cerebellar cortex, and its potential involvement in ASD has long been proposed. Neuropathological studies have shown significant reductions in the number and size of PCs in ASD post-mortem brain. Therefore, they hypothesize that reduced NT3 levels in the periphery in ASD patients might reflect altered expression in the CNS which may be associated with a loss of PC that result in altered cerebellar cortical efferent signals (Segura et al., 2015).
CNTNAP2, which encodes the contactin associated protein-like 2, which was found have significantly decreased gene expression in Maekawa et al. is one of the most intense ASD susceptibility genes with supporting evidence from several independent studies (Peñagarikano and Geschwind, 2012). CNTNAP2, a neurexin family protein that acts as a neuronal adhesion molecule and receptor. It was found to be a direct neural target of the human FOXP2 protein, and mutations of FOXP2 and CNTNAP2 were linked to language and speech disorders in ASD (Maekawa et al., 2015). The FOXP1 gene, which was found to be elevated in ASD subjects according to Chien et al. functions as a transcription repressor, forms a heterodimer with FOXP2, and is co-expressed with FOXP2 in numerous brain regions, suggesting close functional cooperation between the two proteins. FOXP1 is extensively expressed in the developing and mature brain and has been suggested to be important for brain development and function. Based on their data, it indicates that associations among FOXP1, FOXP2, and CNTNAP2 genes may play an important role underlying the pathogenesis of syndromic and non-syndromic ASD. They inferred that increased FOXP1 gene expression may lead to increased FOXP2 gene expression through a feedback mechanism, which may in turn reduce the gene expression of CNTNAP2 in patients with ASD (Chien et al., 2013).
Feron et al. found MOCOS to be downregulated in most ASD individuals as compared to controls. In vivo and in vitro engineered models indicate that altered expression of MOCOS results in neurotransmission and synaptic defects. MOCOS expression also induces increased oxidative stress sensitivity. Metabolic disorders of purine metabolism have been shown to affect the nervous system and are able to induce autistic features (Féron et al., 2016).
Immune Related Genes
Gregg et al. found that SH2D1B/EAT2, one of the 11 differentially expressed genes they found to overlap in all 3 groups (AU vs. GP, A-E vs. GP, and A-R vs. GP), is mostly expressed in natural killer cells as well as macrophages, B cells, and dendritic cells, and has been theorized to suppress natural killer cell activity through the binding of protein tyrosine phosphatases, inhibitory kinases, or ubiquitin ligases. Abnormalities in RUNX3 (one of the 55 differentially expressed genes in AU vs. GP) function in leukocytes and is associated with sudden development of colitis and gastric mucosal hyperplasia and might be relevant to ASD since a small group of children with ASD appear to have gastrointestinal abnormalities (Gregg et al., 2008).
The findings of Enstrom et al. suggest possible dysfunction of natural killer cells in children with ASD, and the data suggests that circulating natural killer cells in ASD are persistently activated rather than quiescent (Enstrom et al., 2009).
Reduced expression of NLGN3 and SHANK3 genes in lymphoblasts of individuals with ASD is consistent with previous reports indicating that mutations of these genes cause reduced expression or loss of function of the protein. Yasuda et al. found that both these genes were found to be decreased in individuals in ASD (Yasuda et al., 2011).
One of the 48 biomarkers in the optimized support vector machine classifier by Glatt et al. IF116, was previously found to be dysregulated in the postmortem temporal cortex of subjects with ASD (Garbett et al., 2008; Glatt et al., 2012).
General Limitations in RNA-Gene Expression Studies: A Critical Appraisal of the Data
Variance
One limitation of mRNA gene expression studies is variance. While gene specific approaches are helpful, they may ignore changes known as variance occurring at the global level of gene expression regulation. Global levels of gene expression regulation are crucial for understanding the underlying basis of diseases such as ASD where multiple systems are affected. For example, the associated increased risk of ASD in children of older fathers could be mediated by changes in global levels of gene expression regulation, or by paternally transmitted age related factors that are linked to changes in the global regulation of gene expression (Alter et al., 2011). Thus, it is possible that a common mediator, a change at the global level of gene expression regulation, could offer an all-encompassing explanation for multi-systemic effects of the disease.
Tissue Source
According to Chien et al. there are several disadvantages with the use of post-mortem brain tissue in gene expression studies (Chien et al., 2013). They point out that using fresh brain tissue from living patients is not always practical, and as a surrogate for brain tissue, several studies have instead utilized peripheral blood cells and LCL. They also state that there is a moderate correlation of gene expression has been reported between peripheral blood cells and brain tissue in humans which supports the usefulness of peripheral blood cells instead of brain-tissue for gene expression studies. Yet Mahfouz et al. (2015), argue that due to the nature of the pathology of ASD, which affects brain regions and the connection between various brain regions, there are advantages to post-mortem gene studies from brain tissue over peripheral blood studies. Kuwano et al. concluded that gene expression profiling of LCL are well documented because of their homogeneity (Kuwano et al., 2011).
Segura et al. explained that their rationale to use blood as opposed to post-mortem brain tissue was due to the limited access of tissue from the central nervous system (CNS) in humans (Segura et al., 2015). They also brought reports of a potential correlation between neurotrophin expression in CNS and the periphery, which would suggest that taking blood in order to study neurotrophins would be similarly effective to using brain tissue. Similarly, Pramparo et al. (2015) emphasized the advantages of peripheral blood, and were successful in identifying 2765 genes from a peripheral blood source from a variety of pathways including apoptosis, the immune response, and genes involved in translation.
According to Hu et al. while studies that used brain tissue to better understand the mechanistic basis for ASD could be informative; this method of study is not an appropriate target for diagnostic assays. They counter that diagnostic assays should ideally be taken from easily obtainable samples such as the patient's blood (Hu et al., 2006). However, Talebizadeh et al. acknowledge that LCL samples may not be ideal to use in order to investigate brain-related genes, but they may still be helpful for understanding at least a subset of brain-related changes (Talebizadeh et al., 2014).
Limitations Specific to ASD Gene Expression Studies: A Critical Appraisal of the Data
The clinical heterogeneity of ASD presents a challenge any time studies attempt to find patterns across the spectrum. Complicating matters even more, the ASD gene expression studies relied on a variety of diagnostic methods to define ASD (Tables 4A,B). The lack of consistency between the diagnostic criteria and the subjectivity of the behavioral methods of diagnosis limit the ability to extrapolate the data to the broader ASD population.
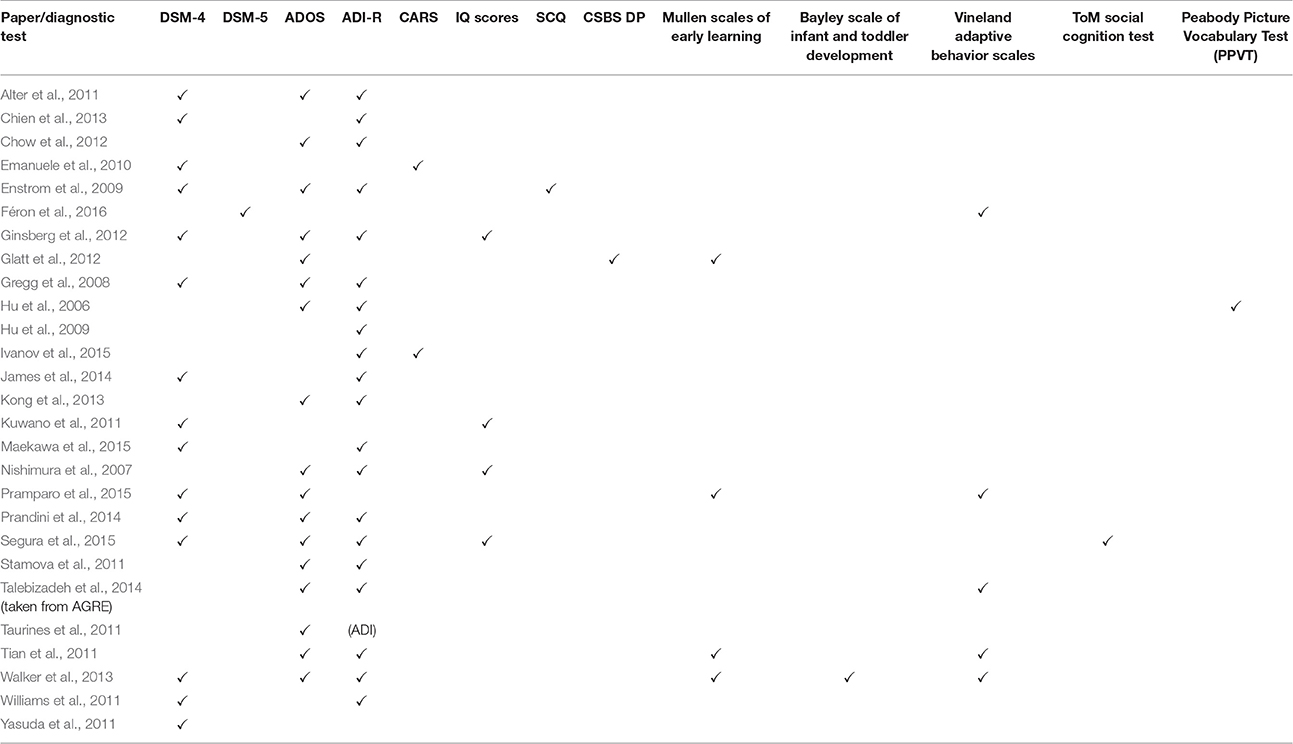
Table 4A. Diagnostic tests part 1.
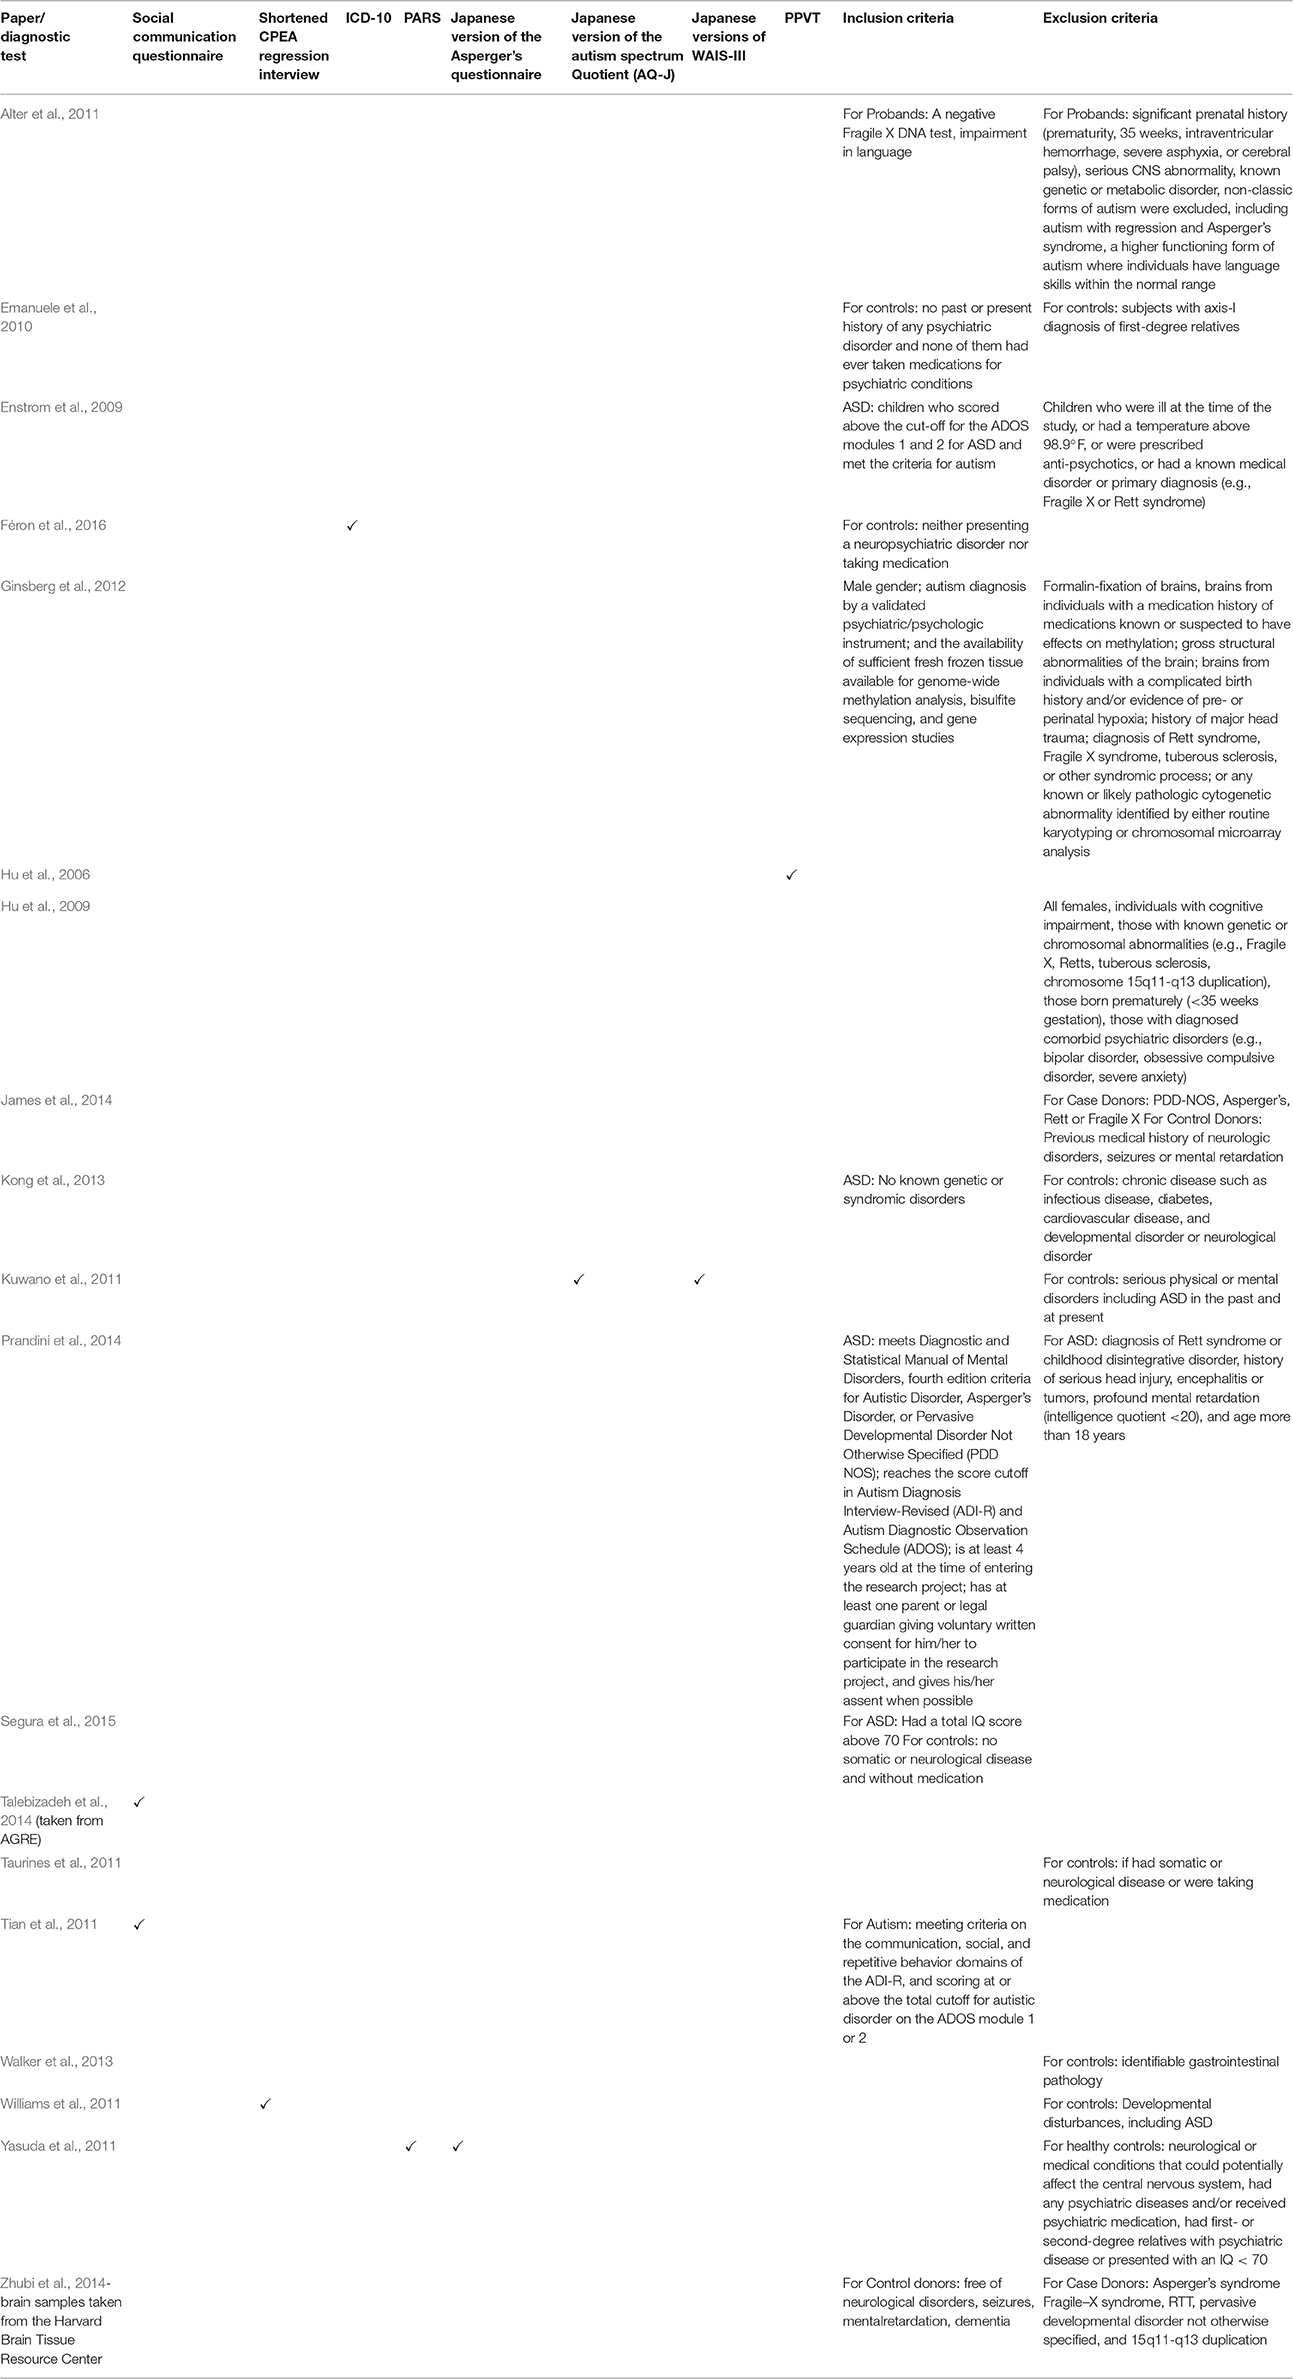
Table 4B. Diagnostic tests part 2.
Additionally, demographic variability between subjects and between subjects and controls complicates analysis. Considering that ASD is 4.5 times more common in males than females, the ratio of subjects in each study is of great importance if it is meant to represent the broader ASD population. While some studies took the disproportionate male incidence into consideration in choosing their subjects, others did not. The clinical presentation of ASD also varies by age. Therefore, significant age differences between ASD subjects and controls such as those in the study by Chien (Chien et al., 2013) deserve further attention.
Conclusion
One of the advantages of gene expression studies over whole genome sequencing studies or Enzyme-Linked Immunosorbent Assay (ELISA) based protein studies for ASD is that it allows for broad screening for unique aspects of the disorder while maintaining a level of specificity that the other modalities cannot provide. In whole genome sequencing studies, millions of base pairs are analyzed and often nothing significant is found, or the few sporadic single nucleotide polymorphisms (SNP's) or copy number variants (CNV's) lack any useful context. While admittedly, more than 100 ASD-susceptibility genes have been found, the utility of this information remains elusive. In gene expression studies, on the other hand, despite analyzing large amounts of genes, the thresholds for differences in expression enable a level of specificity and the ability to group specific genes together in order to identify specific pathways. Approximately 12,000 genes were differentially expressed between ASD compared to controls in gene expression studies since 2011. Most of studies can be subdivided by the source into three categories: brain (~3500 dysregulated genes), LCL (~5600 dysregulated genes), and GI (~2600 dysregulated genes). More specifically, in the gene expression studies of ASD surveyed, cell cycle, GI disease, immune function, and neurogenesis, were found to be the most common implicated pathways.
Most of the genes surveyed were shown to be consistently down or up-regulated across different source types in different studies. This strongly suggests that, in fact, these genes are not coincidentally higher or lower in ASD but might actually be active players in the underlying pathogenesis of the disorder.
Future Directions
Researchers might want to consider testing more than one sample source (peripheral blood, intestine, olfactory stem cell, and hair follicles) for each subject to help determine if up or downregulation is consistent amongst tissue types. In the absence of comparing across sample source types it remains unclear if differences between subjects in gene regulation are due to the different subjects or the different sample source.
Furthermore, researchers might consider including more healthy mothers of children with ASD in the gene expression studies and TD siblings in order to help isolate potential immunogenetic processes. This might help clarify why certain immune mechanisms affect only the child with ASD and not the mother or the siblings. Another idea could be to analyze the blood of daughters of women who have given birth to children with ASD in order to test whether they too have abnormal levels of certain proteins or immune markers that their healthy mothers have. If found, the abnormal levels could suggest that the healthy mother is passing something on to her daughter that would then make her more susceptible to having a child with ASD herself.
Additionally, now that certain pathways have been identified as being associated with ASD, researchers can work backwards and look for other genes involved in those pathways and test whether these specific genes play a role in ASD.
Finally, in order to help identify potential sub-groups of ASD, it might be fruitful to study correlations between subsection scores on ADOS and gene expression studies. This might unravel the heterogeneity of ASD into individual strands whose underlying pathology can be better understood at the genetic and epigenetic levels in order to develop targeted therapeutic approaches.
Author Contributions
AA drafted the article, reviewed the relevant literature, made substantial contributions to conception and design, interpreted the data and approved final version. JR drafted drafted the article, reviewed the relevant literature, made substantial contributions to conception and design, interpreted the data, revised the article critically and approved final version. PZ and MM made substantial contributions to conception and design, participated in revising it critically, interpreted the data, and approved final version. BG participated in revising it critically, interpreted the data, and approved final version.
Funding
This study was supported by Cell-EL LTD.
Conflict of Interest Statement
The authors declare that the research was conducted in the absence of any commercial or financial relationships that could be construed as a potential conflict of interest.
Abbreviations
ADI-R, autism diagnostic interview revised; ANOVA, analysis of variance; ASD, autism spectrum disorders; asdMO, mothers having children with ASD; CNV's-copy number variants; DAVID, Database for Annotation Visualization and Integrated Discovery; DSM-5, Diagnostic and Statistical Manual of Mental Disorders, Fifth Edition; ELISA, Enzyme-Linked Immunosorbent Assay; IFNγ, interferon gamma; IL, interleukin; LCL, lymphoblastoid cell lines; mRNA, messenger ribonucleic acid; MGAM, maltase glucoamylase; NOS, nitric oxide synthetase; PCs, Purkinje cells; RT-qPCR, Real-time quantitative polymerase chain reaction; SAM, significance analysis of microarrays; SNP's, single nucleotide polymorphism; TD, typically developing/developed.
References
Abrahams, B. S., and Geschwind, D. H. (2008). Advances in autism genetics: on the threshold of a new neurobiology. Nat. Rev. Genet. 9, 341–355. doi: 10.1038/nrg2346
Alter, M. D., Kharkar, R., Ramsey, K. E., Craig, D. W., Melmed, R. D., Grebe, T. A., et al. (2011). Autism and increased paternal age related changes in global levels of gene expression regulation. PLoS ONE 6:e16715. doi: 10.1371/journal.pone.0016715
Anitha, A., Nakamura, K., Thanseem, I., Yamada, K., Iwayama, Y., Toyota, T., et al. (2012). Brain region-specific altered expression and association of mitochondria-related genes in autism. Mol. Autism 3:12. doi: 10.1186/2040-2392-3-12
Chana, G., Laskaris, L., Pantelis, C., Gillett, P., Testa, R., Zantomio, D., et al. (2015). Decreased expression of mGluR5 within the dorsolateral prefrontal cortex in autism and increased microglial number in mGluR5 knockout mice: Pathophysiological and neurobehavioral implications. Brain Behav. Immun. 49, 197–205. doi: 10.1016/j.bbi.2015.05.009
Chien, W. H., Gau, S. S., Chen, C. H., Tsai, W. C., Wu, Y. Y., Chen, P. H., et al. (2013). Increased gene expression of FOXP1 in patients with autism spectrum disorders. Mol. Autism 4:23. doi: 10.1186/2040-2392-4-23
Chow, M. L., Pramparo, T., Winn, M. E., Barnes, C. C., Li, H. R., Weiss, L., et al. (2012). Age-dependent brain gene expression and copy number anomalies in autism suggest distinct pathological processes at young versus mature ages. PLoS Genet. 8:e1002592. doi: 10.1371/journal.pgen.1002592
Christensen, D. L., Baio, J., Van Naarden Braun, K., Bilder, D., Charles, J., and Constantino, J. N. (2016). Prevalence and Characteristics of Autism Spectrum Disorder Among Children Aged 8 Years–Autism and Developmental Disabilities Monitoring Network, 11 Sites, United States, 2012. MMWR. Surveill. Summ. 65, 1–23. doi: 10.15585/mmwr.ss6503a1
Courchesne, E., Mouton, P. R., Calhoun, M. E., Semendeferi, K., Ahrens-Barbeau, C., Hallet, M. J., et al. (2011). Neuron number and size in prefrontal cortex of children with autism. JAMA 306, 2001–2010. doi: 10.1001/jama.2011.1638
Emanuele, E., Boso, M., Cassola, F., Broglia, D., Bonoldi, I., Mancini, L., et al. (2010). Increased dopamine DRD4 receptor mRNA expression in lymphocytes of musicians and autistic individuals: bridging the music-autism connection. Neuro Endocrinol. Lett. 31, 122–125.
Enstrom, A. M., Lit, L., Onore, C. E., Gregg, J. P., Hansen, R. L., Pessah, I. N., et al. (2009). Altered gene expression and function of peripheral blood natural killer cells in children with autism. Brain Behav. Immun. 23, 124–133. doi: 10.1016/j.bbi.2008.08.001
Féron, F., Gepner, B., Lacassagne, E., Stephan, D., Mesnage, B., Blanchard, M. P., et al. (2016). Olfactory stem cells reveal MOCOS as a new player in autism spectrum disorders. Mol. Psychiatry 21, 1215–1224. doi: 10.1038/mp.2015.106
Garbett, K., Ebert, P. J., Mitchell, A., Lintas, C., Manzi, B., Mirnics, K., et al. (2008). Immune transcriptome alterations in the temporal cortex of subjects with autism. Neurobiol. Dis. 30, 303–311. doi: 10.1016/j.nbd.2008.01.012
Gesundheit, B., Rosenzweig, J. P., Naor, D., Lerer, B., Zachor, D. A., Prochazka, V., et al. (2013). Immunological and autoimmune considerations of Autism Spectrum Disorders. J. Autoimmun. 44, 1–7. doi: 10.1016/j.jaut.2013.05.005
Ginsberg, M. R., Rubin, R. A., Falcone, T., Ting, A. H., and Natowicz, M. R. (2012). Brain transcriptional and epigenetic associations with autism. PLoS ONE 7:e44736. doi: 10.1371/journal.pone.0044736
Glatt, S. J., Tsuang, M. T., Winn, M., Chandler, S. D., Collins, M., Lopez, L., et al. (2012). Blood-based gene expression signatures of infants and toddlers with autism. J. Am. Acad. Child Adolesc. Psychiatry 51, 934-44 e2. doi: 10.1016/j.jaac.2012.07.007
Gregg, J. P., Lit, L., Baron, C. A., Hertz-Picciotto, I., Walker, W., Davis, R. A., et al. (2008). Gene expression changes in children with autism. Genomics 91, 22–29. doi: 10.1016/j.ygeno.2007.09.003
Hazlett, H. C., Poe, M. D., Gerig, G., Styner, M., Chappell, C., Smith, R. G., et al. (2011). Early brain overgrowth in autism associated with an increase in cortical surface area before age 2 years. Arch. Gen. Psychiatry 68, 467–476. doi: 10.1001/archgenpsychiatry.2011.39
Hu, V. W., Frank, B. C., Heine, S., Lee, N. H., and Quackenbush, J. (2006). Gene expression profiling of lymphoblastoid cell lines from monozygotic twins discordant in severity of autism reveals differential regulation of neurologically relevant genes. BMC Genomics 7:118. doi: 10.1186/1471-2164-7-118
Hu, V. W., Sarachana, T., Kim, K. S., Nguyen, A., Kulkarni, S., Steinberg, M. E., et al. (2009). Gene expression profiling differentiates autism case-controls and phenotypic variants of autism spectrum disorders: evidence for circadian rhythm dysfunction in severe autism. Autism Res. 2, 78–97. doi: 10.1002/aur.73
Ivanov, H. Y., Stoyanova, V. K., Popov, N. T., Bosheva, M., and Vachev, T. I. (2015). Blood-Based Gene Expression in children with Autism spectrum disorder. BioDiscovery 17:2. doi: 10.7750/BioDiscovery.2015.17.2
James, S. J., Shpyleva, S., Melnyk, S., Pavliv, O., and Pogribny, I. P. (2014). Elevated 5-hydroxymethylcytosine in the Engrailed-2 (EN-2) promoter is associated with increased gene expression and decreased MeCP2 binding in autism cerebellum. Transl. Psychiatry 4:e460. doi: 10.1038/tp.2014.87
Kang, H. J., Kawasawa, Y. I., Cheng, F., Zhu, Y., Xu, X., Li, M., et al. (2011). Spatio-temporal transcriptome of the human brain. Nature 478, 483–489. doi: 10.1038/nature10523
Kates, W. R., Burnette, C. P., Eliez, S., Strunge, L. A., Kaplan, D., Landa, R., et al. (2004). Neuroanatomic variation in monozygotic twin pairs discordant for the narrow phenotype for autism. Am. J. Psychiatry 161, 539–546. doi: 10.1176/appi.ajp.161.3.539
Khan, A., Harney, J. W., Zavacki, A. M., and Sajdel-Sulkowska, E. M. (2014). Disrupted brain thyroid hormone homeostasis and altered thyroid hormone-dependent brain gene expression in autism spectrum disorders. J. Physiol. Pharmacol. 65, 257–272.
Kong, S. W., Shimizu-Motohashi, Y., Campbell, M. G., Lee, I. H., Collins, C. D., Brewster, S. J., et al. (2013). Peripheral blood gene expression signature differentiates children with autism from unaffected siblings. Neurogenetics 14, 143–152. doi: 10.1007/s10048-013-0363-z
Kuwano, Y., Kamio, Y., Kawai, T., Katsuura, S., Inada, N., Takaki, A., et al. (2011). Autism-associated gene expression in peripheral leucocytes commonly observed between subjects with autism and healthy women having autistic children. PLoS ONE 6:e24723. doi: 10.1371/journal.pone.0024723
Lainhart, J. E., Bigler, E. D., Bocian, M., Coon, H., Dinh, E., Dawson, G., et al. (2006). Head circumference and height in autism: a study by the Collaborative Program of Excellence in Autism. Am. J. Med. Genet. A 140, 2257–2274. doi: 10.1002/ajmg.a.31465
Lord, C., Rutter, M., and Le Couteur, A. (1994). Autism Diagnostic Interview-Revised: a revised version of a diagnostic interview for caregivers of individuals with possible pervasive developmental disorders. J. Autism Dev. Disord. 24, 659–685. doi: 10.1007/BF02172145
Maekawa, M., Yamada, K., Toyoshima, M., Ohnishi, T., Iwayama, Y., Shimamoto, C., et al. (2015). Utility of Scalp Hair Follicles as a Novel Source of Biomarker Genes for Psychiatric Illnesses. Biol. Psychiatry 78, 116–125. doi: 10.1016/j.biopsych.2014.07.025
Mahfouz, A., Ziats, M. N., Rennert, O. M., Lelieveldt, B. P., and Reinders, M. J. (2015). Shared Pathways Among Autism Candidate Genes Determined by Co-expression Network Analysis of the Developing Human Brain Transcriptome. J. Mol. Neurosci. 57, 580–594. doi: 10.1007/s12031-015-0641-3
Maximo, J. O., Cadena, E. J., and Kana, R. K. (2014). The implications of brain connectivity in the neuropsychology of autism. Neuropsychol. Rev. 24, 16–31. doi: 10.1007/s11065-014-9250-0
Nishimura, Y., Martin, C. L., Vazquez-Lopez, A., Spence, S. J., Alvarez-Retuerto, A. I., Sigman, M., et al. (2007). Genome-wide expression profiling of lymphoblastoid cell lines distinguishes different forms of autism and reveals shared pathways. Hum. Mol. Genet. 16, 1682–1698. doi: 10.1093/hmg/ddm116
Ozonoff, S., Young, G. S., Carter, A., Messinger, D., Yirmiya, N., Zwaigenbaum, L., et al. (2011). Recurrence risk for autism spectrum disorders: a Baby Siblings Research Consortium study. Pediatrics 128, e488–e495. doi: 10.1542/peds.2010-2825
Peñagarikano, O., and Geschwind, D. H. (2012). What does CNTNAP2 reveal about autism spectrum disorder? Trends Mol. Med. 18, 156–163. doi: 10.1016/j.molmed.2012.01.003
Pramparo, T., Pierce, K., Lombardo, M. V., Carter Barnes, C., Marinero, S., Ahrens-Barbeau, C., et al. (2015). Prediction of autism by translation and immune/inflammation coexpressed genes in toddlers from pediatric community practices. JAMA Psychiatry 72, 386–394. doi: 10.1001/jamapsychiatry.2014.3008
Prandini, P., Zusi, C., Malerba, G., Itan Pignatti, P. F., and Trabetti, E. (2014). Analysis of RBFOX1 gene expression in lymphoblastoid cell lines of Italian discordant autism spectrum disorders sib-pairs. Mol. Cell. Probes 28, 242–245. doi: 10.1016/j.mcp.2014.05.001
Sandin, S., and Reichenberg, A. (2014). Recurrence rates in autism spectrum disorders–reply. JAMA 312, 1155. doi: 10.1001/jama.2014.9847
Segura, M., Pedreno, C., Obiols, J., Taurines, R., Pamias, M., Grunblatt, E., et al. (2015). Neurotrophin blood-based gene expression and social cognition analysis in patients with autism spectrum disorder. Neurogenetics 16, 123–131. doi: 10.1007/s10048-014-0434-9
Stamova, B., Green, P. G., Tian, Y., Hertz-Picciotto, I., Pessah, I. N., Hansen, R., et al. (2011). Correlations between gene expression and mercury levels in blood of boys with and without autism. Neurotox. Res. 19, 31–48. doi: 10.1007/s12640-009-9137-7
Talebizadeh, Z., Aldenderfer, R., and Wen Chen, X. (2014). A proof-of-concept study: exon-level expression profiling and alternative splicing in autism using lymphoblastoid cell lines. Psychiatr. Genet. 24, 1–9. doi: 10.1097/YPG.0b013e3283635526
Taurines, R., Grünblatt, E., Schecklmann, M., Schwenck, C., Albantakis, L., Reefschlager, L., et al. (2011). Altered mRNA expression of monoaminergic candidate genes in the blood of children with attention deficit hyperactivity disorder and autism spectrum disorder. World J. Biol. Psychiatry 12 (Suppl. 1), 104–108. doi: 10.3109/15622975.2011.600297
Tian, Y., Green, P. G., Stamova, B., Hertz-Picciotto, I., Pessah, I. N., Hansen, R., et al. (2011). Correlations of gene expression with blood lead levels in children with autism compared to typically developing controls. Neurotox. Res. 19, 1–13. doi: 10.1007/s12640-009-9126-x
Voineagu, I., and Eapen, V. (2013). Converging Pathways in Autism Spectrum Disorders: Interplay between Synaptic Dysfunction and Immune Responses. Front. Hum. Neurosci. 7:738. doi: 10.3389/fnhum.2013.00738
Walker, S. J., Fortunato, J., Gonzalez, L. G., and Krigsman, A. (2013). Identification of unique gene expression profile in children with regressive autism spectrum disorder (ASD) and ileocolitis. PLoS ONE 8:e58058. doi: 10.1371/journal.pone.0058058
Wang, K., Zhang, H., Ma, D., Bucan, M., Glessner, J. T., Abrahams, B. S., et al. (2009). Common genetic variants on 5p14.1 associate with autism spectrum disorders. Nature 459, 528–533. doi: 10.1038/nature07999
Wen, Y., Alshikho, M. J., and Herbert, M. R. (2016). Pathway network analyses for Autism Reveal Multisystem Involvement, major overlaps with other diseases and convergence upon MAPK and Calcium Signaling. PLoS ONE 11:e0153329. doi: 10.1371/journal.pone.0153329
Williams, B. L., Hornig, M., Buie, T., Bauman, M. L., Cho Paik, M., Wick, I., et al. (2011). Impaired carbohydrate digestion and transport and mucosal dysbiosis in the intestines of children with autism and gastrointestinal disturbances. PLoS ONE 6:e24585. doi: 10.1371/journal.pone.0024585
Yasuda, Y., Hashimoto, R., Yamamori, H., Ohi, K., Fukumoto, M., Umeda-Yano, S., et al. (2011). Gene expression analysis in lymphoblasts derived from patients with autism spectrum disorder. Mol. Autism 2:9. doi: 10.1186/2040-2392-2-9
Yuen, R. K., Thiruvahindrapuram, B., Merico, D., Walker, S., Tammimies, K., Hoang, N., et al. (2015). Whole-genome sequencing of quartet families with autism spectrum disorder. Nat. Med. 21, 185–191. doi: 10.1038/nm.3792
Zhubi, A., Chen, Y., Dong, E., Cook, E. H., Guidotti, A., and Grayson, D. R. (2014). Increased binding of MeCP2 to the GAD1 and RELN promoters may be mediated by an enrichment of 5-hmC in autism spectrum disorder (ASD) cerebellum. Transl. Psychiatry 4:e349. doi: 10.1038/tp.2013.123
Keywords: autism spectrum disorders (ASD), gene expression, immune system, lymphoblastoid cell lines, monozygotic twins, Fragile X Syndrome, neurogenesis and inflammation
Citation: Ansel A, Rosenzweig JP, Zisman PD, Melamed M and Gesundheit B (2017) Variation in Gene Expression in Autism Spectrum Disorders: An Extensive Review of Transcriptomic Studies. Front. Neurosci. 10:601. doi: 10.3389/fnins.2016.00601
Received: 23 June 2016; Accepted: 15 December 2016;
Published: 05 January 2017.
Edited by:
John Vijay Sagar Kommu, National Institute of Mental Health and Neurosciences, IndiaCopyright © 2017 Ansel, Rosenzweig, Zisman, Melamed and Gesundheit. This is an open-access article distributed under the terms of the Creative Commons Attribution License (CC BY). The use, distribution or reproduction in other forums is permitted, provided the original author(s) or licensor are credited and that the original publication in this journal is cited, in accordance with accepted academic practice. No use, distribution or reproduction is permitted which does not comply with these terms.
*Correspondence: Benjamin Gesundheit, b.gesund@gmail.com