 Changcheng Wu
 Hong Zeng1
 Aiguo Song
- 1School of Instrument Science and Engineering, Southeast University, Nanjing, China
- 2College of Automation Engineering, Nanjing University of Aeronautics and Astronautics, Nanjing, China
The estimation of the grip force and the 3D push-pull force (push and pull force in the three dimension space) from the electromyogram (EMG) signal is of great importance in the dexterous control of the EMG prosthetic hand. In this paper, an action force estimation method which is based on the eight channels of the surface EMG (sEMG) and the Generalized Regression Neural Network (GRNN) is proposed to meet the requirements of the force control of the intelligent EMG prosthetic hand. Firstly, the experimental platform, the acquisition of the sEMG, the feature extraction of the sEMG and the construction of GRNN are described. Then, the multi-channels of the sEMG when the hand is moving are captured by the EMG sensors attached on eight different positions of the arm skin surface. Meanwhile, a grip force sensor and a three dimension force sensor are adopted to measure the output force of the human's hand. The characteristic matrix of the sEMG and the force signals are used to construct the GRNN. The mean absolute value and the root mean square of the estimation errors, the correlation coefficients between the actual force and the estimated force are employed to assess the accuracy of the estimation. Analysis of variance (ANOVA) is also employed to test the difference of the force estimation. The experiments are implemented to verify the effectiveness of the proposed estimation method and the results show that the output force of the human's hand can be correctly estimated by using sEMG and GRNN method.
Introduction
Prosthetic hand is a kind of human-machine interface. The upper limb amputees can recover some hand function with the help of the prosthetic hand. In recent years, many kinds of prosthetic hands have been investigated to meet the requirements of the amputees (Davidson, 2002; Zaini and Ahmad, 2011; Maat et al., 2017). Among these hands, the prosthetic hand based on the EMG has received lots of attention due to its simple operation and that it is in accordance with the operation habits of the natural hand. Figure 1 shows a typical block diagram of the EMG prosthetic hand. Firstly, the EMG signals are captured from the amputee's remaining arm by the EMG sensors on the skin surface. Then, the motion recognition unit outputs the user's motion intention based on analysis of the captured EMG signals. In the motion recognition unit, the features extracted from EMG signals are used to identify the user's motion intention. The controller sends the control commands to the prosthetic hand according to the user's motion intention which has been recognized in the motion recognition unit. In such manner, the prosthetic hand can be controlled by the amputee's EMG signals. The motion recognition unit plays an important role in this control mode. Whether the prosthetic hand movement is in line with the user's intention is directly decided by the motion recognition unit. As a matter of fact, many scholars have made a lot of investigations in this area (Zhang et al., 2013; Xie et al., 2015; Hofmann et al., 2016; Segil et al., 2016).
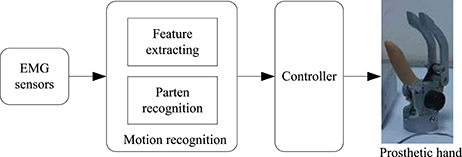
Figure 1. A typical control mode of the EMG prosthetic hand.
The hand movement is described by type, speed, force, and amplitude of the action, and etc. And all these are important in the control of the prosthetic hand, especially type and force. Therefore, the main tasks of the motion recognition are type classification and force estimation of the action.
In the process of type classification of the action, plenty of research work has been done in the past decades (Li et al., 2010; Hioki and Kawasaki, 2012; Ngeo et al., 2013; He et al., 2015; Pan et al., 2015). Nishikawa et al. used two channels of the EMG signals and the real-time learning method to discriminate a maximum 10 forearm motions including 4 wrist motions and 6 hand motions (Nishikawa et al., 1999). Ten different features extracted from four channels of the EMG signals are used to classify the eight hand motions in Al Omari et al. (2014). And the authors reported that an accuracy of 94% was achieved by using LDA (Linear Discriminant Analysis) based on the combination of wavelength, Willson amplitude, and root mean square. Wu proposed an EMG self-learning recognition method to reduce the effects of the individual difference on the EMG motion recognition (Wu et al., 2015). Ju and Liu used multiple sensors to analyze the human hand motions and reported that there exist significant relationships between the muscle signals and the finger trajectories as well as between the muscle signals and the contact force (Ju and Liu, 2014). To improve the performance of the EMG prosthetic hand, some scholars attempted to obtain the continuous motor variables such as the limb positions and force of the action. Ngeo used a multi-output convolved Gaussian Process to estimate the finger joint kinematics from the EMG signals (Ngeo et al., 2014).
The other part of the hand movement intention, force of hand movement (grip force, push force, pull force, etc.), is also important in the control of the prosthetic hand, especially in dexterous manipulation. There are mainly two kinds of force of the action output from the human hand. One is the grip force and the other is the push force and pull force in three dimensional space (we call it 3D force). In the process of grip force estimation, the most common method is detecting the strength of the muscle contraction from the EMG signals and then mapping the measured strength to the expecting grip force. During the bilateral grasping task, Kamavuako et al. investigated the use of the EMG features in order to estimate the grip force on the ipsilateral and contralateral hand (Kamavuako et al., 2012). And the author also reported that one channel of EMG signals measured from the flexor digitorum profundus can be used to represent the grip force within the entire range of force (Kamavuako et al., 2013). Castellini et al. used five channels of the EMG signals and the SVM (Support Vector Machine) to achieve the grip force estimation and their estimation error is <7% (Castellini et al., 2009). In 3D force estimation, Nielsen et al. used the artificial neural network to estimate the isometric force in multiple degrees of freedom from the wrist (Nielsen et al., 2011). Hashemi et al. researched the EMG based on force estimation in dynamic contractions by using the parallel cascade identification modeling (Hashemi et al., 2012, 2015).
Although, force estimation of the action is also important in the control of the prosthetic hand, the amount of the research work in this area is apparently less than the work in type classification of the action. Actually, not only the grip force but also the 3D force plays an important role in the control of the dexterous prosthetic hand. For the prosthetic hand with movable wrist, the 3D push/pull force is important in the process of moving objects. The estimate of 3D push/pull force can be used to control the rotation of the wrist.
In this paper, we present a force estimation method for the purpose of estimating the force of hand movement comprehensively. Firstly, we set up the experimental platform which is used to capture the EMG signals and force of the action. The eight channels of the EMG signals are captured from the eight different positions on the arm skin surface. The grip force and the 3D force are captured by a grip force sensor and a three dimensional force sensor, respectively. Secondly, the time domain feature extraction method is employed to extract the features from the captured EMG signals. Then, the generalized regression neural network (GRNN) is employed to estimate force of the action which includes the grip force and the 3D force, by using the extracted EMG features and the captured force of action. At last, experiments are implemented to verify the effectiveness of the proposed force estimation method of the action.
The rest of the paper is organized as follows. Section “Experimental Platform” introduces the experimental platform in detail. The detailed process of force estimation of the action is described in Section “Force Estimation of Hand Movement.” The experiments are implemented in Section “Experiment and Result,” and the Conclusions are in Section “Conclusion.”
Experimental Platform
An experiment platform as shown in Figure 2 is set up in this section. The experimental platform consists of several EMG sensors, a three dimensional force sensor, a data collector, a computer, and the application software.
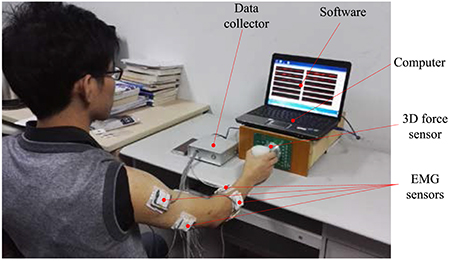
Figure 2. The experimental platform.
The EMG sensors and the 3D force sensor are respectively used to capture the surface EMG signals generated on the arm skin surface and the force signals output by the hand while the hand is moving and grasping. The EMG signals and the force signals are digitalized in the data collector. The data collector has a USB interface via which the data can be transmitted between the data collector and computer.
EMG Sensor
The EMG signal is a kind of weak signal. To meet the requirements of EMG signal measurement, we design a surface EMG sensor shown in Figure 3. The sensor's pass-band is 10–500 Hz and the voltage gain is about 1,000. The disposable moisture Ag/AgCl electrodes are used in the sensor. There are two snap-fasteners in the EMG sensor. The distance between these two snap-fasteners is 2 cm. And the snap-fastener is made of conductive metal. There is also a snap-fastener in the disposable electrode. The snap-fastener in the disposable electrode should be buckled into the snap-fastener in the EMG sensor.
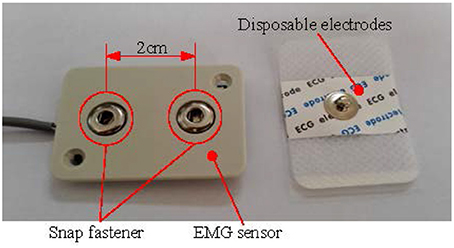
Figure 3. The EMG sensor and disposable electrode.
There is a conditioning circuit in the EMG sensor. The structure diagram of the conditioning circuit is shown in Figure 4. The voltage gains of the two amplifiers, A1 and A2, are set as 15 and 40, respectively. The high-pass filter (cut-off frequency: 10 Hz) is used to remove the direct current component from the signal. The low-pass filter (cut-off frequency: 500 Hz) is used to eliminate the high-frequency noises. The voltage gains of these two filters are all about 1.3. The notch filter is used to reduce the 50 Hz power-line interference. Since the input range of the data collector is from 0 to 3 V, we design the level-rising circuit to make the voltage of the signals >0 V. Figure 5 shows a typical signal measured by the EMG sensor.
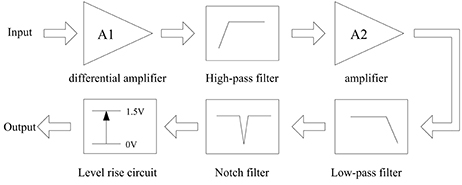
Figure 4. The structure diagram of the conditioning circuit.
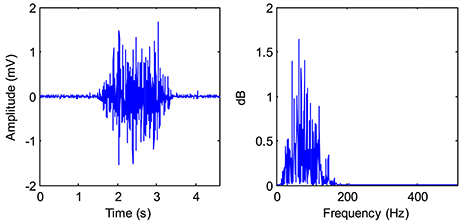
Figure 5. A typical EMG signal and its power spectrum.
Grip Force Sensor
Figure 6 shows the grip force sensor and its manipulation sketch. The grip force sensor mainly contains a grasping mechanism (GM), an elastic beam, a signal conditioning circuit, and a sensor shell. There is a connecting rod between the elastic beam and the grasping mechanism. The elastic beam is fixed in the sensor shell. Grasping the GM with force will lead to the deformation of the elastic beam. There are two strain gauges, sg1 and sg2, attached on the surface of the elastic beam. These two strain gauges are used to measure the deformation of the elastic beam. According to the knowledge of the mechanics of the material, we know that there exists a relationship between the deformation of the beam and the force applied to the beam. Therefore, we can measure the grip force by detecting the deformation of the strain gauges. The widely used measurement circuit, Wheatstone bridge, is employed to measure the deformation of the strain gauges. And the output signals of the Wheatstone bridge are amplified by a differential amplifier.
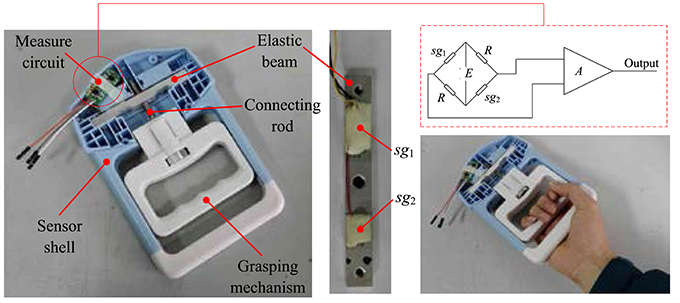
Figure 6. The grip force sensor and its manipulation sketch.
The calibration is necessary for the reason that the relationship between the force applied to the elastic beam and the deformation of the beam is non-linear and there are some other factors which may influence the measurement accuracy. After the calibration experiment, the accuracy of the designed grip force sensor is 0.1N.
3D Force Sensor
A three dimension (3D) force sensor (measurement range: −30N ~30 N, accuracy: 2%FS), which is designed by the Robot Sensor and Control Lab in Southeast University, is introduced to measure the force signal (Ma and Song, 2012; Ma et al., 2013). Figure 7 shows the signals measured by the 3D force sensor while the force is applied to the sensor optionally. The value >0 indicates that the direction of the force is in forward direction, and the value <0 indicates that the direction of force is in reverse direction.
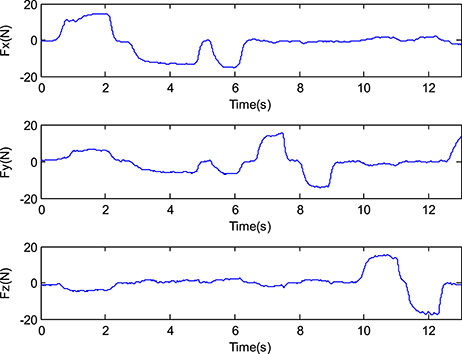
Figure 7. The force signals measured by the 3D force sensor.
As shown in Figure 8, the 3D force sensor is fixed on a vertical placed flat. And a cylindrical handle is installed at the end of the sensor. Holding the handle, human hand can apply force to the sensor in different directions.
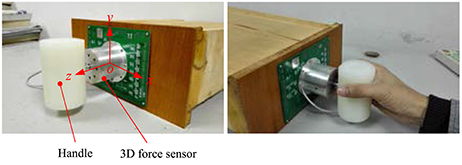
Figure 8. The 3D force sensor and its manipulation sketch.
Data Collector
Analogy signals captured by the sensors can be digitalized by the data collector. The designed data collector can realize analogy signal sampling in 16 channels simultaneously. The AD (analogy to digital) converters in the data collector are 10 bit. The sampling rate of the data collector can be set from 200 to 2000 Hz per channel. The voltage range of the input signals is from 0 to 3 V. The data collector has a USB interface through which data can be exchanged between the data collector and computer.
Application Software
The application software running on the computer is used to display the EMG signal waves and force signal waves in real time. And the data of these signals can be recorded when needed. In addition, the application software has the function of changing the data sampling rate by means of sending commands to the data collector.
Force Estimation of Hand Movement
The relation between force and EMG signal is varied with many factors, such as force value, speed, path, etc. (Orizio et al., 2010; Kamavuako and Rosenvang, 2012). In order to study the relationship between the EMG signals and the force signals output by the hand and to estimate the force based on the EMG signal, we designed the signal processing diagram as shown in Figure 9.
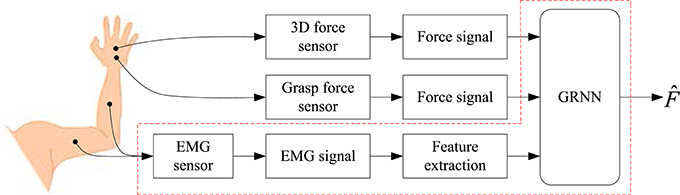
Figure 9. The diagram of the force estimation.
Since the EMG signal is a kind of complex non-linear signal and the hand movement is completed by the cooperation of many muscles, it is difficult to describe the relationship between the EMG signals and the force output by the hand by using the linear model.
Under the assumption that there is a non-linear function, ϕ, which can describe the relationship between the EMG signals and the force output by the hand, the force output by the hand can be estimated by measuring the EMG signals on the arm skin surface.
where, ϕ is the non-linear function, X are the EMG signals measured from the arm skin surface, F is the force output by the hand.
In this paper, the GRNN is employed to describe the non-linear relationship between the EMG signals and the force for its good non-linear mapping capability and high degree of parallel processing information capacity.
EMG Signal Acquisition and Feature Extraction
In this paper, eight different positions on the arm skin surface are selected to acquire the EMG signals. The distribution of the EMG sensors and the serial number of the EMG sensors are shown in Figure 10 and Table 1.
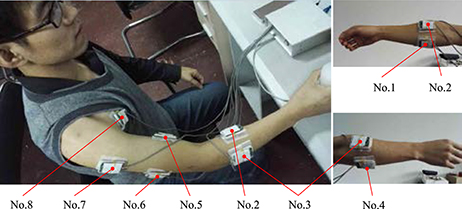
Figure 10. The distribution of the EMG sensors.
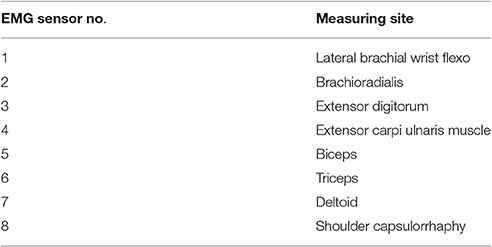
Table 1. The distribution location and the serial number of the EMG sensors.
EMG signal captured by the data collector is a time series signal which can describe the characteristics of the hand movement after necessary preprocessing and feature extraction.
The feature extraction method of EMG signals is usually the time domain method, frequency domain method, and time-frequency domain method. The time domain method has the advantages of less computation comparing with the other two methods. The usual time domain feature extraction methods are mean absolute value (MAV), variance (VAR), zeros crossings (ZC), and Willison Amplitude (WA). Table 2 shows the mathematical equation of each introduced feature. All features are extracted by using Matlab.
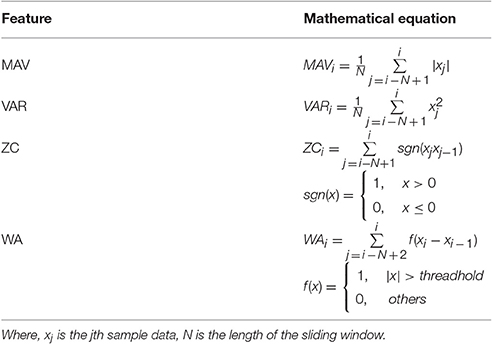
Table 2. The EMG features in time domain and mathematical equation.
Figure 11 shows a typical EMG signal and its time domain feature.
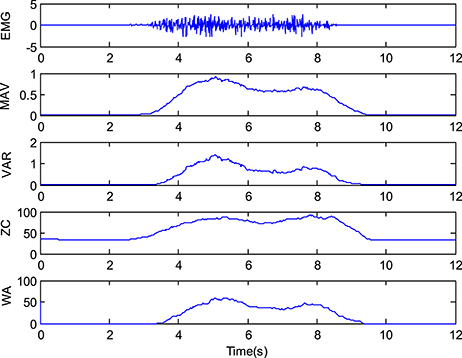
Figure 11. A typical EMG signal and its time domain features.
The Generalized Regression Neural Network
The GRNN was proposed by Donald F. Specht in 1991. It is a kind of RBF (Radial Basis Function) neural network. It has the advantage of non-linear mapping, great robustness, and a high degree of parallel processing information capacity. The performance and the learning speed of the GRNN are better than the general neural network (Altiparmak et al., 2009).
The GRNN has a network structure of 4 layers as shown in Figure 12. These four layers are input layer, pattern layer, sum layer, and output layer, respectively (Altiparmak et al., 2009).
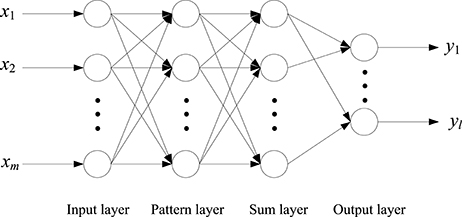
Figure 12. The structure of the GRNN.
X = [x1, x2,…,xm]T is the input vector of the GRNN, and Y = [y1, y2,…,yl]T is the output of the GRNN. The number of the neuron in pattern layer is as the same as the number of the training samples. Each neuron in pattern layer corresponds to a training sample data. The transfer function of the ith neuron in pattern layer is:
where, X is the input of the GRNN, Xi is the learning sample corresponding to ith neuron, σ is the smoothing parameter.
The neuron in sum layer can be divided into two classes. One class corresponds to Equation (3), and the number is only one. The other class corresponds to Equation (4).
where, yij is jth element in Yi, Yi is the ith output sample. L is the dimension of the output vector.
The output of the GRNN is defined as:
To improve the performance of the GRNN in our study, the samples should be distributed as uniformly as possible within a certain range.
Force Estimation of Hand Movement
In this paper, the GRNN is employed to study the relationship between the EMG signals and the force output by the hand. As shown in Figure 9, the force estimation can be divided into two steps. One is offline training of the GRNN, and the other is the online force estimation. In the prosthetic hand based on EMG, the GRNN is offline trained by collecting the EMG signals and the force signals. The trained GRNN is used to estimate force of the action in real time. It is that mapping the extracted EMG features into the force of hand movement by using the trained GRNN.
The software in the computer records the eight channels of the EMG signals (X), the grip force signals (Fg), and the 3D force signals (F3D) in real time.
where, X1 ~ X8 are the eight channels of the EMG signals captured by the eight EMG sensors, respectively, xij is the jth sample data captured by the ith EMG sensor. Fx, Fy, and Fz are the force signal in x, y, and z direction measured by the 3D force sensor, respectively; fxi, fyi, fzi are the ith sample data in x, y, and z direction, respectively; fgi is the ith sample data captured by the grip force sensor and m is the number of the sampling.
Time domain feature extraction methods described in Table 2 are used in the processing of the EMG signals. And we can get the feature matrixes: XFMAV, XFVAR, XFZC, and XFWA.
Combining the feature matrixes and the force signals, we can get a new matrix Sam.
where, XF is one of the XFMAV, XFVAR, XFZC, and XFWA. F is one of the F3D and Fg.
In the offline training step of the GRNN, the k-fold cross validation is introduced to evaluate the performance of the GRNN.
(1) The Sam is split into k equal-size groups of size m/k.
(2) One of the groups is used as validation group in order to test the performance of the GRNN; the rest k–1 groups are used in training process.
(3) The cross validation process is repeated k times with different selected groups with the mean accuracy.
In the k-fold cross validation method, k is set to two in the paper.
The mean absolute value of the estimation error (MAVE), the root mean square (RMS) of the estimation error and the correlation coefficient (ρ) between F and are introduced to evaluate the accuracy of the estimation results. Take the force in direction x for an example:
where, is the estimate of force in direction x; fxi is the force in direction x measured by the 3D force sensor; N is the length of the data.
A greater MAVE indicates that the estimation result is poorer. A greater RMS indicates that the estimation result has a larger fluctuation. And a greater ρ indicates that the estimated result has a higher similarity with the force measured by the force sensor.
In grip force estimation experiments, One-way ANOVA is conducted to compare the performance of different features In One-way ANOVA, the factor is EMG feature (MVA, VAR, ZC, WA). In 3D force estimation experiments, Two-way ANOVA is conducted. The factors of the Two-way ANOVA are force direction (x, y, z) and EMG feature (MVA, VAR, ZC, WA). Tukey comparison is performed when significance is detected. The significance level for all tests is set at 0.05.
Experiment and Result
To verify the effectiveness of the proposed method in this paper, the experiment was implemented.
Six right hand-dominant healthy subjects without any neuromuscular disorders (4 males, 2 females, and aged between 21 and 28) were chosen as the participants the experiment. And the participants were informed consent prior to study participation.
Before the experiment, the locations of the EMG sensors on the arm skin surface were cleaned by medical alcohol. Then, the electrodes were buckled into the EMG sensors and the EMG sensors were attached on the arm skin surface. The locations of the EMG sensors are shown in Table 1 and Figure 10.
During the experiments, the EMG signals and force signals of the action were displayed as waveforms in the computer screen and recorded by the software. The data sampling rate of the data collector was set as 1 kHz per-channel.
In the experiments, the data captured from different individuals are used to train the GRNN, respectively.
The Grip Force Estimation Experiment
Firstly, the grip force estimation experiment is implemented. During the grip force estimation experiment, the subjects are asked to grasp the grip force sensor several times with different grip force. During the grasping, the subjects should not move their arms. The duration of the grasping is about 1–2 s. The maximum grip force is <30N.
In the experiment, four channels of the EMG signals were selected to estimate the grip force. Figure 13 shows the EMG signals and the grip force while the subject 1 was grasping the grip sensor three times continuously with different grip force.
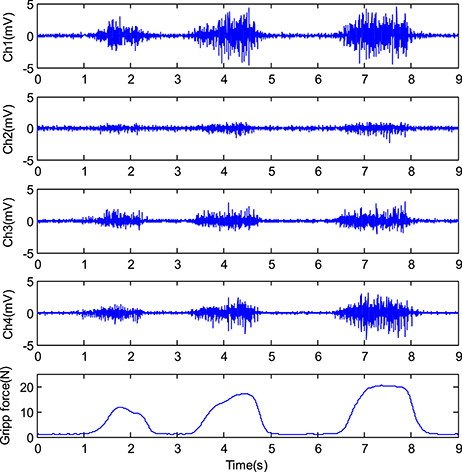
Figure 13. The EMG signals and the corresponding grip force.
Four kinds of EMG time domain features which were extracted from the same raw EMG signals were used to train the GRNN, respectively. And the trained GRNNs were used to estimate the grip force, respectively.
The experiment results of the subject 1 are shown in Figure 14. It shows that the results of the WAV and VAR are better than the results of ZC and WA. When the grip force increases from 0 to 8N, the results of all features show a good estimation effect. When the grip force is larger than 10N, the estimation accuracy of ZC and WA decreases, especially when the force is larger than 15N. In the results of ZC, the fluctuation may appear in the estimation results when the grip force is larger than 15N. And when the grip force is larger than 15N, the estimation accuracy is decline sharply in the result of ZC. When the grip force is larger than 20N, the estimation accuracy is also decline in the result of WA. In general, the estimate of force by using these four features and the actual force have the similar trend.
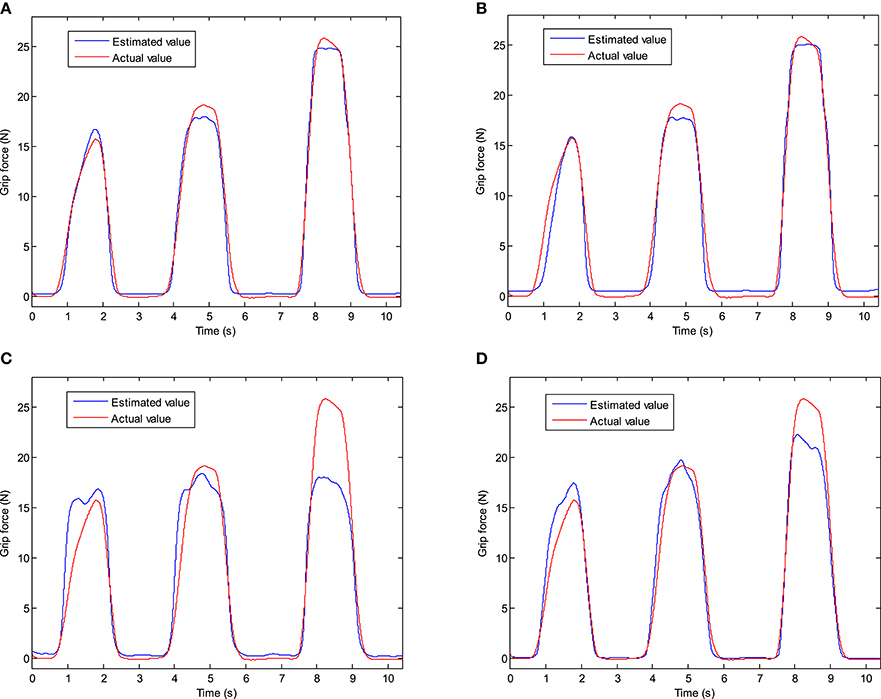
Figure 14. The experiment results of the grip force estimation. (A) Feature = MAV. (B) Feature = VAR. (C) Feature = ZC. (D) Feature = WA.
The results of all six subjects are shown in Table 3. The average values of the six subjects' results are calculated and shown in Table 4 and Figure 15. The variation range of the all subjects' results is also shown in the form of vertical red line, as shown in Figure 15. It shows that the result of MVA is better than the other features'. The result of ZC has a larger fluctuation than that of the other three features.
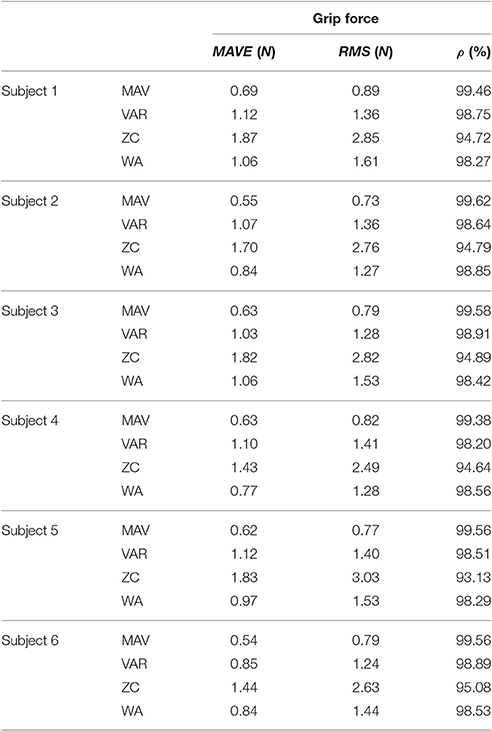
Table 3. The results of the grip force estimation experiments.
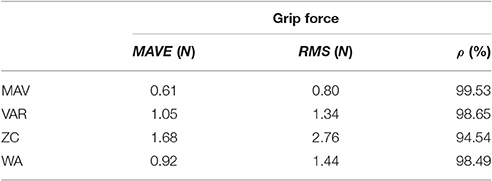
Table 4. The average results of the grip force estimation experiments across all the subjects.
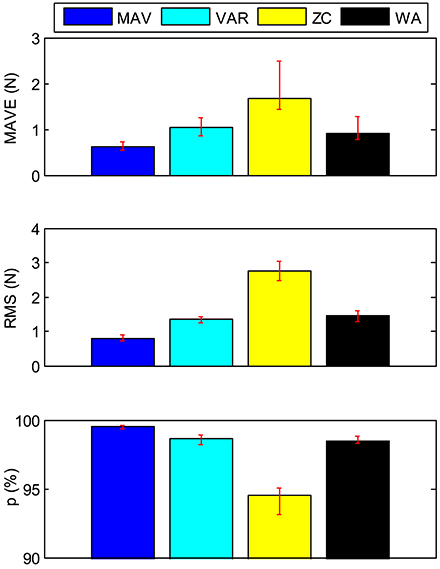
Figure 15. The statistical results of the grip force estimation experiments.
The results of One-way ANOVA and Tukey HSD are shown in Tables 5–8. Results in Table 5 indicate that there are significant differences (p < 0.05) among four features. The results of the Tukey HSD show that there are significant differences between each two features except VAR and WA. Four features can be divided into three subsets.
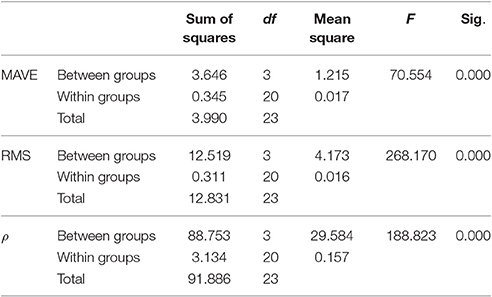
Table 5. The results of the One-way ANOVA.
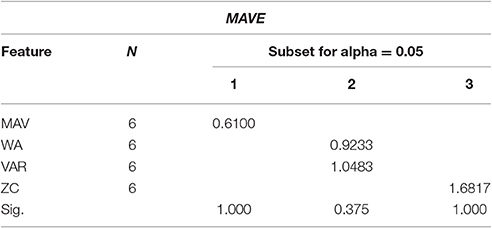
Table 6. The results of the Tukey HSD for MAVE.
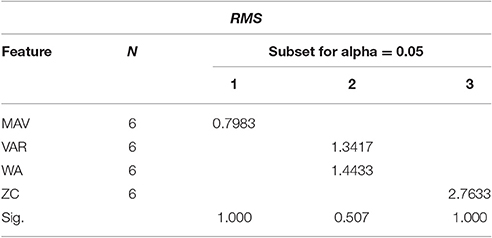
Table 7. The results of the Tukey HSD for RMS.
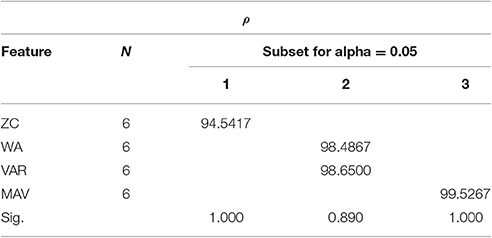
Table 8. The results of the Tukey HSD for ρ.
The above results indicate that the result of the WAV is better than the other three features' results by all three evaluation index. The result of the VAR and the result of the WA are similar. Among all the results, the ZC get the worst one. The results also show that all of these four features can realize the estimation of the grip force in an acceptable performance.
The 3D Force Estimation Experiment
The 3D force is the representative of the force output by the human hand in three-dimensional space, which can be measured by 3D force sensor. During the 3D force estimation experiment, the subjects were asked to grasp the handle which was set at the end of the 3D force sensor, and to apply force to the handle in x, y, and z direction. The duration of the subjects applying force to each direction is about 1 s. The maximum force is <20N.
In this experiment, eight channels of the EMG signals were selected to estimate the grip force. Figure 16 shows the EMG signals and the 3D force while subject 1 applied force to the 3D force sensor.
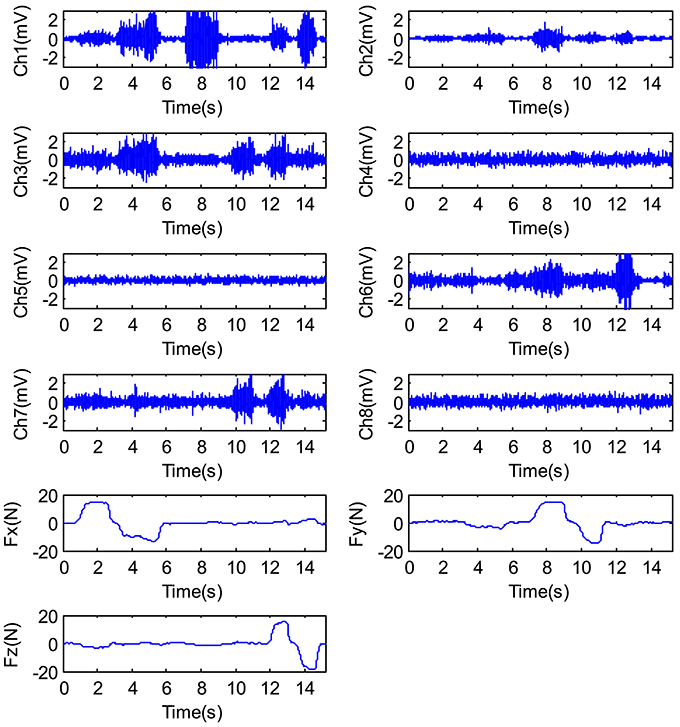
Figure 16. The EMG signals and force signals output by the hand.
The same as the grip force estimation experiment, four kinds of EMG time domain features which were extracted from the same raw EMG signals were used to train the GRNN, respectively. And the trained GRNNs were used to estimate the 3D force, respectively.
The experimental results of the subject 1 are shown in Figure 17. In Figure 17, the red line represents the actual force and the blue line represents the estimated force. The result of WAV has the best performance among the results of all these four features. And the result of ZC is the worst. When applying force to z-direction, which means pushing the 3D force sensor, the estimation results are poor by using the features of VAR and ZC. On the whole, the 3D force estimation results are acceptable.
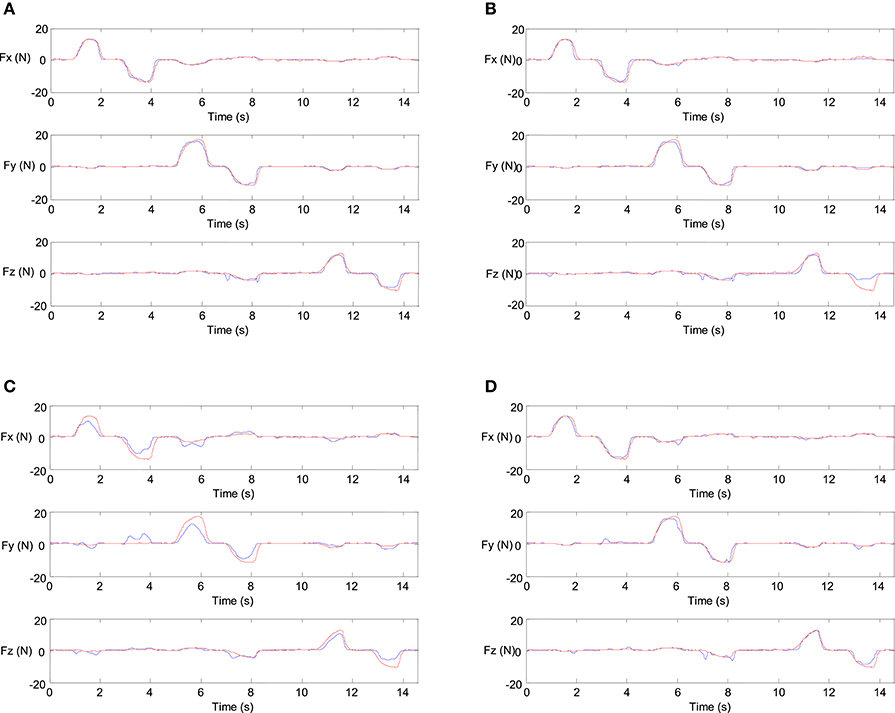
Figure 17. The experimental results of the 3D force estimation. (A) Feature = WAV. (B) Feature = VAR. (C) Feature = ZC. (D) Feature = WA.
The results from all six subjects are shown in Tables 9, 10. The average values and the variation range of the six subjects' results are shown in Figure 18 indicated by bar graph and vertical red line, respectively. It shows that the result of MVA is better than the other features'. The result of ZC has a larger fluctuation than that of the other three features. In the z-direction, the result of VAR also has a lager fluctuation. And in the z-direction, the result of VAR is worst by all three evaluation index.
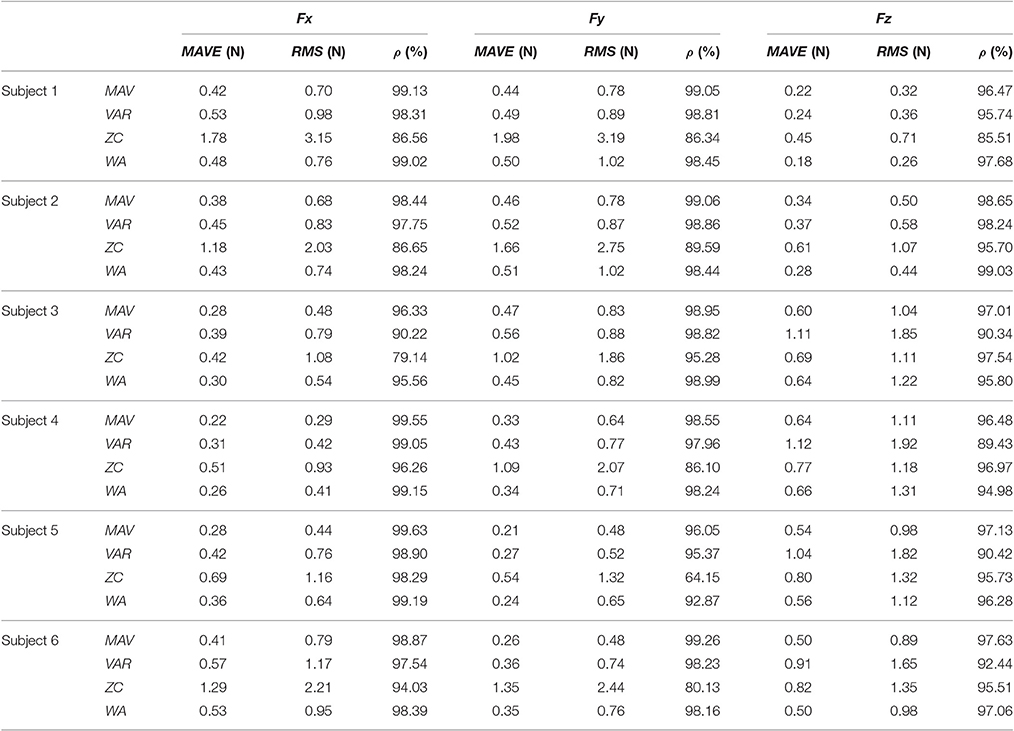
Table 9. The results of the 3D force estimation experiments.
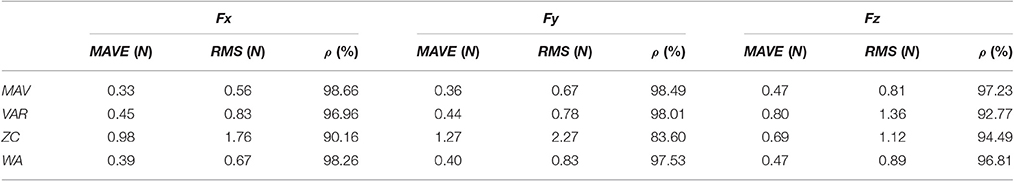
Table 10. The average results of the 3D force estimation experiments across all the subjects.
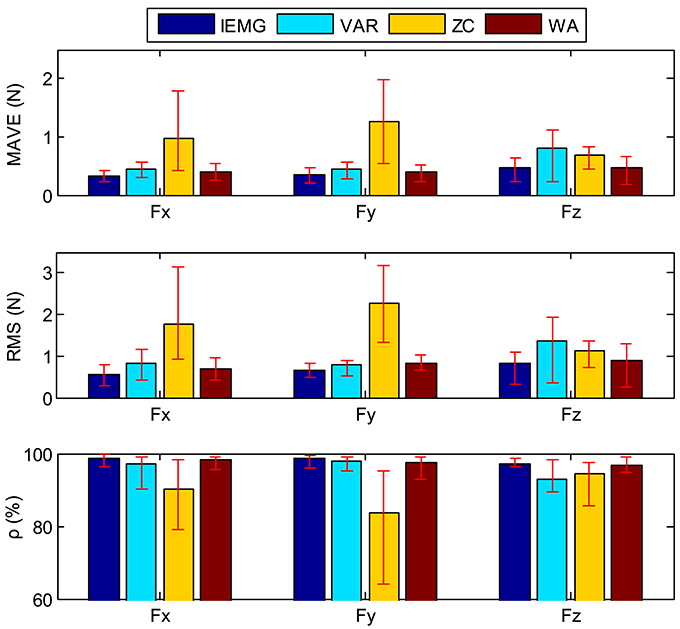
Figure 18. The statistical results of the 3D force estimation experiments.
The results of Two-way ANOVA and Tukey HSD are shown in Tables 11–13. The results of the Tukey HSD are shown in Tables 13–16. The results of Two-way ANOVA indicate that there are significant differences (p < 0.05) among four features. For all three evaluation index, the effects of force direction are not significant (p > 0.456). The results of Tukey HSD show that the effects of MAV, VAR, and WA are similar. Four features can be divided into two subsets.
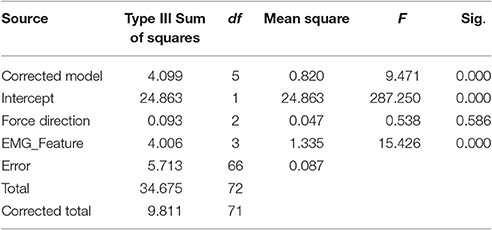
Table 11. The results of the Two-way ANOVA for MAVE.
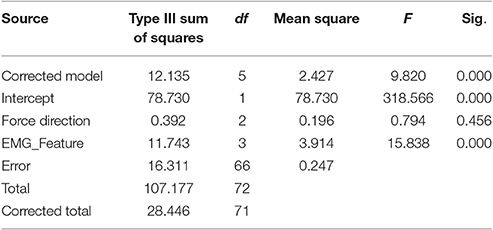
Table 12. The results of the Two-way ANOVA for RMS.
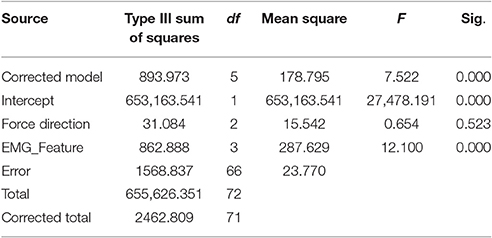
Table 13. The results of the Two-way ANOVA for ρ.
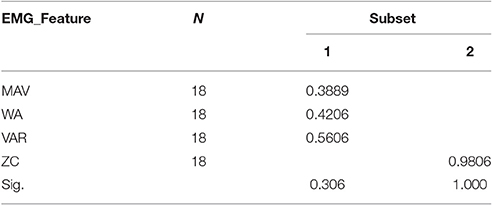
Table 14. The results of the Tukey HSD for MAVE.
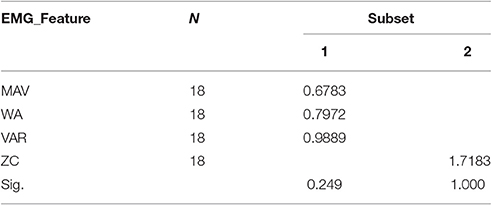
Table 15. The results of the Tukey HSD for RMS.
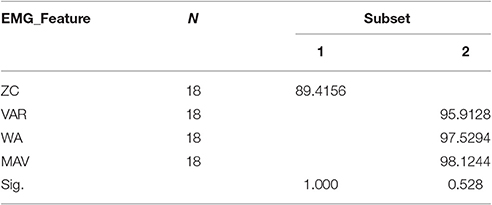
Table 16. The results of the Tukey HSD for ρ.
The above results indicate that all of these four features can achieve the estimation of the 3D force successfully. The result of MAV is best. But compare with VAR and WA, there is no significant difference. The result of ZC is worst.
Conclusion
In order to meet the requirements of the dexterous control of the prosthetic hand, the paper proposes a force estimation method of hand movement based on the sEMG and GRNN. The estimated force of hand movement includes the grip force and the 3D force. An experimental platform is set up to measure the multi-channels of the sEMG signals, the grip force and the 3D push-pull force. Based on this platform, the sEMG on the arm skin surface and force of the action output by the hand can be measured synchronously. The widely used time domain feature extraction methods are employed to pre-process the sEMG signals. Then the extracted EMG features are mapped to force of the hand movement by using GRNN.
The experiments are implemented to verify the effectiveness of the proposed force estimation method of hand movement. And the results show that the proposed method can realize the force estimation of hand movement with an acceptable performance under the condition that grip force is <30N and the 3D push-pull force is <20N. In grip force estimation, the result of MVA is best. In 3D force estimation, the result of MAV is also best, but compare with VAR and WA, there is no significant difference. The performance of ZC is worst both in grip estimation and 3D force estimation.
For the future work, we will research the estimation of the parameters of the kinematics and dynamics based on the sEMG for the purpose of further improving the performance of the dexterous manipulation of the EMG prostheses.
Ethics Statement
The study is exempt from ethics approval. We put up a petition in Chinese for sEMG clinical measurement to the Nanjing Tongren Hospital (http://tongren.ecaihr.com/). The relevant organization of the Nanjing Tongren Hospital consider our clinical measurement without ethical problem. All the subjects were gave written, informed consent. The permission was granted by the subject to reproduce their likeness in Figures 2, 10.
Author Contributions
CW: Project design; Experimental study; Writing paper. HZ: Data analysis. AS: Project design. BX: Data analysis.
Conflict of Interest Statement
The authors declare that the research was conducted in the absence of any commercial or financial relationships that could be construed as a potential conflict of interest.
Acknowledgments
This paper is supported by the National Science Foundation of China under Grant No. 91648206, 61325018, 61403080, 61673105, 61673114. Jiangsu Technology Development Project under Grant No. BE2014132. Jiangsu Natural Science Foundation under Grant No. BK20140641. Young Teacher Startup Foundation of Nanjing University of Aeronautics and Astronautics under Grant No. 56YAH17027.
References
Al Omari, F., Hui, J., Mei, C., and Liu, G. (2014). Pattern recognition of eight hand motions using feature extraction of forearm EMG signal. Proc. Natl. Acad. Sci. India Sect. A Phys. Sci. 84, 473–480. doi: 10.1007/s40010-014-0148-2
Altiparmak, F., Dengiz, B., and Smith, A. E. (2009). A general neural network model for estimating telecommunications network reliability. IEEE Trans. Reliab. 58, 2–9. doi: 10.1109/TR.2008.2011854
Castellini, C., Gruppioni, E., Davalli, A., and Sandini, G. (2009). Fine detection of grasp force and posture by amputees via surface electromyography. J. Physiol. (Lond). 103, 255–262. doi: 10.1016/j.jphysparis.2009.08.008
Davidson, J. (2002). A survey of the satisfaction of upper limb amputees with their prostheses, their lifestyles, and their abilities. J. Hand Ther. 15, 62–70. doi: 10.1053/hanthe.2002.v15.01562
Hashemi, J., Morin, E., Mousavi, P., and Hashtrudi-Zaad, K. (2015). Enhanced dynamic EMG-force estimation through calibration and PCI modeling. IEEE Trans. Neural Syst. Rehab. Eng. 23, 41–50. doi: 10.1109/TNSRE.2014.2325713
Hashemi, J., Morin, E., Mousavi, P., Mountjoy, K., and Hashtrudi-Zaad, K. (2012). EMG–force modeling using parallel cascade identification. J. Electromyogr. Kinesiol. 22, 469–477. doi: 10.1016/j.jelekin.2011.10.012
He, J., Zhang, D., Sheng, X., Li, S., and Zhu, X. (2015). Invariant surface EMG feature against varying contraction level for myoelectric control based on muscle coordination. IEEE J. Biomed. Health Inform. 19, 874–882. doi: 10.1109/JBHI.2014.2330356
Hioki, M., and Kawasaki, H. (2012). Estimation of finger joint angles from sEMG using a neural network including time delay factor and recurrent structure. ISRN Rehab. 2012:604314. doi: 10.5402/2012/604314
Hofmann, D., Jiang, N., Vujaklija, I., and Farina, D. (2016). Bayesian filtering of surface EMG for accurate simultaneous and proportional prosthetic control. IEEE Trans. Neural Syst. Rehab. Eng. 24, 1333–1341. doi: 10.1109/TNSRE.2015.2501979
Ju, Z., and Liu, H. (2014). Human hand motion analysis with multisensory information. IEEE ASME Trans. Mechatr. 19, 456–466. doi: 10.1109/TMECH.2013.2240312
Kamavuako, E. N., Farina, D., Yoshida, K., and Jensen, W. (2012). Estimation of grasping force from features of intramuscular EMG signals with mirrored bilateral training. Ann. Biomed. Eng. 40, 648–656. doi: 10.1007/s10439-011-0438-7
Kamavuako, E. N., and Rosenvang, J. C. (2012). Hysteresis in the electromyography–force relationship: toward an optimal model for the estimation of force. Muscle Nerve 46, 755–758. doi: 10.1002/mus.23393
Kamavuako, E. N., Rosenvang, J. C., Bøg, M. F., Smidstrup, A., Erkocevic, E., Niemeier, M. J., et al. (2013). Influence of the feature space on the estimation of hand grasping force from intramuscular EMG. Biomed. Signal Process. Control 8, 1–5. doi: 10.1016/j.bspc.2012.05.002
Li, G., Schultz, A. E., and Kuiken, T. A. (2010). Quantifying pattern recognition—based myoelectric control of multifunctional transradial prostheses. IEEE Trans. Neural Syst. Rehab. Eng. 18, 185–192. doi: 10.1109/TNSRE.2009.2039619
Ma, J., and Song, A. (2012). Development of a novel two-axis force sensor for Chinese massage robot. Appl. Mech. Mater. 103, 299–304. doi: 10.4028/www.scientific.net/AMM.103.299
Ma, J., Song, A., and Pan, D. (2013). Dynamic compensation for two-axis robot wrist force sensors. J. Sens. 2013:357396. doi: 10.1155/2013/357396
Maat, B., Smit, G., Plettenburg, D., and Breedveld, P. (2017). Passive prosthetic hands and tools: a literature review. Prosthet. Orthot. Int. doi: 10.1177/0309364617691622. [Epub ahead of print].
Ngeo, J., Tamei, T., and Shibata, T. (2014). Estimation of continuous multi-DOF finger joint kinematics from surface EMG using a multi-output gaussian process. IEEE Int. Conf. Eng. Med. Biol. Soc. 2014, 3537–3540. doi: 10.1109/embc.2014.6944386
Ngeo, J., Tamei, T., Shibata, T., Orlando, M. F., Behera, L., Saxena, A., et al. (2013). Control of an optimal finger exoskeleton based on continuous joint angle estimation from EMG signals. Conf. Proc. IEEE Eng. Med. Biol. Soc. 2013, 338–341. doi: 10.1109/embc.2013.6609506
Nielsen, J. L. G., Holmgaard, S., Jiang, N., Englehart, K. B., Farina, D., and Parker, P. A. (2011). Simultaneous and proportional force estimation for multifunction myoelectric prostheses using mirrored bilateral training. IEEE Trans. Biomed. Eng. 58, 681–688. doi: 10.1109/TBME.2010.2068298
Nishikawa, D., Yu, W., Yokoi, H., and Kakazu, Y. (1999). EMG prosthetic hand controller using real-time learning method. IEEE Int. Conf. Syst. Man Cybernet. 1, 153–158. doi: 10.1109/icsmc.1999.814077
Orizio, C., Baruzzi, E., Gaffurini, P., Diemont, B., and Gobbo, M. (2010). Electromyogram and force fluctuation during different linearly varying isometric motor tasks. J. Electromyogr. Kinesiol. 20, 732–741. doi: 10.1016/j.jelekin.2010.03.005
Pan, L., Zhang, D., Sheng, X., and Zhu, X. (2015). Improving myoelectric control for amputees through transcranial direct current stimulation. IEEE Trans. Biomed. Eng. 62, 1927–1936. doi: 10.1109/TBME.2015.2407491
Segil, J. L., Huddle, S. A., and Weir, R. F. F. (2016). Functional assessment of a myoelectric postural controller and multi-functional prosthetic hand by persons with trans-radial limb loss. IEEE Trans. Neural Syst. Rehab. Eng. 25, 618–627. doi: 10.1109/tnsre.2016.2586846
Wu, C., Song, A., Ling, Y., Wang, N., and Tian, L. (2015). A control strategy with tactile perception feedback for EMG prosthetic hand. J. Sens. 2015:869175. doi: 10.1155/2015/869175
Xie, H., Huang, H., Wu, J., and Liu, L. (2015). A comparative study of surface EMG classification by fuzzy relevance vector machine and fuzzy support vector machine. Physiol. Meas. 36, 191–206. doi: 10.1088/0967-3334/36/2/191
Zaini, M. H. M., and Ahmad, S. A. (2011). “Surgical and non-surgical prosthetic hands control: a review,” in IEEE Symposium on Industrial Electronics and Applications (ISIEA) (Langkawi), 634–637.
Keywords: grip force, 3D push-pull force, force estimation, EMG, GRNN
Citation: Wu C, Zeng H, Song A and Xu B (2017) Grip Force and 3D Push-Pull Force Estimation Based on sEMG and GRNN. Front. Neurosci. 11:343. doi: 10.3389/fnins.2017.00343
Received: 31 December 2016; Accepted: 01 June 2017;
Published: 30 June 2017.
Edited by:
Dingguo Zhang, Shanghai Jiao Tong University, ChinaReviewed by:
Tjeerd W. Boonstra, University of New South Wales, AustraliaLizhi Pan, North Carolina State University, United States
Copyright © 2017 Wu, Zeng, Song and Xu. This is an open-access article distributed under the terms of the Creative Commons Attribution License (CC BY). The use, distribution or reproduction in other forums is permitted, provided the original author(s) or licensor are credited and that the original publication in this journal is cited, in accordance with accepted academic practice. No use, distribution or reproduction is permitted which does not comply with these terms.
*Correspondence: Aiguo Song, a.g.song@seu.edu.cn