 Julien Valette
 Clémence Ligneul1,2
 Marco Palombo
- 1Commissariat à l'Energie Atomique et aux Energies Alternatives, MIRCen, Fontenay-aux-Roses, France
- 2Neurodegenerative Diseases Laboratory, Centre National de la Recherche Scientifique, Université Paris-Sud, Université Paris-Saclay, UMR 9199, Fontenay-aux-Roses, France
- 3Department of Computer Science and Centre for Medical Image Computing, University College of London, London, United Kingdom
In vivo diffusion-weighted MR spectroscopy (DW-MRS) allows measuring diffusion properties of brain metabolites. Unlike water, most metabolites are confined within cells. Hence, their diffusion is expected to purely reflect intracellular properties, opening unique possibilities to use metabolites as specific probes to explore cellular organization and structure. However, interpretation and modeling of DW-MRS, and more generally of intracellular diffusion, remains difficult. In this perspective paper, we will focus on the study of the time-dependency of brain metabolite apparent diffusion coefficient (ADC). We will see how measuring ADC over several orders of magnitude of diffusion times, from less than 1 ms to more than 1 s, allows clarifying our understanding of brain metabolite diffusion, by firmly establishing that metabolites are neither massively transported by active mechanisms nor massively confined in subcellular compartments or cell bodies. Metabolites appear to be instead diffusing in long fibers typical of neurons and glial cells such as astrocytes. Furthermore, we will evoke modeling of ADC time-dependency to evaluate the effect of, and possibly quantify, some structural parameters at various spatial scales, departing from a simple model of hollow cylinders and introducing additional complexity, either short-ranged (such as dendritic spines) or long-ranged (such as cellular fibers ramification). Finally, we will discuss the experimental feasibility and expected benefits of extending the range of diffusion times toward even shorter and longer values.
Introduction
While water molecules are ubiquitous in the brain, many metabolites detected by magnetic resonance spectroscopy (MRS) in vivo are primarily intracellular, with typical extracellular concentrations ~1,000–10,000 times lower than intracellular concentrations. Moreover, works on extracts or cell cultures suggested that some metabolites exhibit preferential compartmentation in different cell types, with glutamate (Glu) and N-acetylaspartate (NAA) predominantly found in neurons, and myo-inositol (Ins) and choline compounds (tCho) preferentially found in glial cells (Simmons et al., 1991; Brand et al., 1993; Griffin et al., 2002; Le Belle et al., 2002; Choi et al., 2007) (in particular astrocytes, representing the largest volume fraction of glial cells). Hence, measuring the brain metabolite diffusion may provide specific insight into cellular organization and microstructure.
The intracellular compartmentation of metabolites may a priori seem to simplify interpretation and modeling of metabolite diffusion as compared to water, because extracellular space and membrane permeability may be neglected. However, it is conceivable that metabolites are highly compartmentalized at a subcellular scale, in some subcellular regions or organelles. For example, NAA has been reported to be synthetized in mitochondria (Madhavarao et al., 2003), so that it may be primarily found in mitochondria. In this context, metabolite diffusion would reflect its subcellular metabolic compartmentation rather than diffusion within the whole cytosol and restriction by cell membrane. Here we will see how studying the time-dependency of metabolite apparent diffusion coefficient (ADC) allows clarifying the nature of the compartments where MRS-detected metabolites are diffusing, and may allow probing morphological features at different spatial scales. We will then try to explain some motivations and approaches to push further the limits of achievable diffusion times.
What Does ADC Time-Dependency Tell about Metabolite Diffusion?
To measure metabolite ADC at very short time-scales, experiments were performed in the rat (Marchadour et al., 2012) and mouse brain (Ligneul and Valette, 2017) using oscillating gradients. Measurements frequencies f went up to ~250 Hz, corresponding to diffusion time td down to ~0.5–1 ms, depending on the conversion used between f and td [td = 1/(4f) based on the identification of the effective diffusion time in the b-value expression (Parsons et al., 2006), or using td = 9/(64f) as derived in the Mitra limit when considering the surface-to-volume ratio of the restrictions (Novikov and Kiselev, 2011)]. They showed that ADC increased by ~50% when f increased from ~20 to 250 Hz for NAA, tCho, and tCr (also for Ins and Tau in the mouse brain), approaching ADC ~0.2–0.30 μm2/ms at the highest frequency. Note that, although later measurements in the mouse brain (Ligneul and Valette, 2017) suggested that early measurements in rats (Marchadour et al., 2012) may have been slightly biased by some motion artifact for some frequencies, the overall trend was preserved. The large ADC increase at short time-scales reflects significantly decreased restriction/hindrance and the progressive approach toward free diffusion. It rules out any significant contribution of active transport at these scales, which would result in the opposite trend (as the velocity autocorrelation function would be positive and decrease to 0 for increasing time Does et al., 2003). At ~1 ms, the typical diffusion distance for metabolites is ~1 μm, so the typical distance between obstacles/walls inducing ADC time-dependency must be in this range. More quantitatively, modeling metabolite ADC acquired in the rodent brain with oscillating gradients (Marchadour et al., 2012; Ligneul and Valette, 2017) using Stepisnik's and Callaghan's frequency-domain formalism for diffusion in cylinders or spherical pores (Stepisnik, 1981; Callaghan and Stepisnik, 1995) yields typical radii of ~1 μm. It also allows estimating the free intracellular diffusivities to be Dintra ~0.5–0.6 μm2/ms, i.e., corresponding to a low-viscosity cytosol, less than twice the viscosity of pure water). This is in excellent agreement with fluorescence-based estimates of fluid-phase cytoplasm viscosity being quite similar to bulk water (Fushimi and Verkman, 1991; Luby-Phelps et al., 1993).
Measurements at longer td were achieved using pulsed-field gradients. Most DW-MRS works investigating brain metabolite diffusion were performed at a single td, in the 10–250 ms range, and reported ADC in the 0.1–0.25 μm2/ms range (see for example Merboldt et al., 1993; Wick et al., 1995; Dreher et al., 2001 for measurements performed at td slightly longer than 10 ms, and Posse et al., 1993; Ellegood et al., 2006 for measurements at td > 200 ms). We are not aware of many works investigating td-dependency, except pioneer works where the high b-value attenuation of NAA was studied in the 35–305 ms range in excised rat brains (Assaf and Cohen, 1998a,b) and in the 50–100 ms range in the living rat brain (Kroenke et al., 2004). However, because acquisition and analysis differed between these studies, and some of them may be prone to artifacts (e.g., absence of scan-to-scan phase correction, incorrect b-value calculation ignoring cross-terms, signal contamination by macromolecules…), it is very difficult to see any clear pattern emerge in terms of ADC time-dependency. To specifically study ADC time-dependency at long td, a series of studies were performed in the rodent, primate and Human brain, all based on stimulated echo acquisitions (which are more favorable than spin echo to reach long td, as magnetization relaxes according to T1 during the mixing/diffusion time) and designed to minimize measurement bias (Najac et al., 2014, 2016; Palombo et al., 2016a). These studies all report very stable ADC (around 0.1 μm2/ms, except in Human white matter where it was ~0.15 μm2/ms) for all metabolites as td is increased from a few dozen ms up to ~700 ms in Human brain (Najac et al., 2016), and up to ~2 s in the mouse and macaque brain (Najac et al., 2014; Palombo et al., 2016a). Note however that a slight trend to decrease can be observed (at least in the mouse and primate brain) when considering the whole time-window. The fact that ADC does not drop as td is increased up to 2 s is a very clear indication that metabolites are not confined in closed compartments of size equivalent to the diffusion distance (30–40 μm) or below, such as cell bodies or organelles (e.g., see Figure 3 in Najac et al., 2016). Instead, the fact that ADC remains fairly stable at approximately one third of the ADC value measured at ultra-short time-scales (Figure 1) is very consistent with metabolite diffusing in long fibers (in the ideal situation of infinitely long and straight fibers, and in the case of an isotropic distribution of fiber orientations, ADC would drop from Dintra at td ~ 0 to Dintra/3 once full restriction has been reached in the plane perpendicular to fiber axis, and then stabilize at Dintra/3 at longer td).
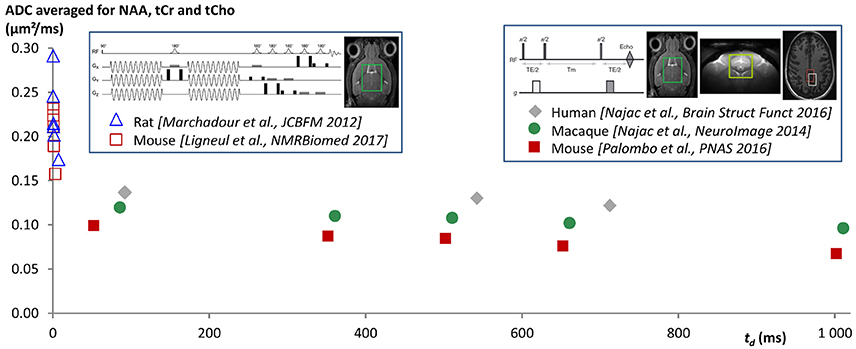
Figure 1. ADC time-dependency as measured in different published works from ultra-short td using oscillating gradients [down to td ~ 0.5 ms when taking td = 9/(64f) (Novikov and Kiselev, 2011), where f is the oscillating gradient frequency], up to very long td ~ 1 s using stimulated echo (data acquired at td ~ 2 s and reported in Palombo et al., 2016a are not shown here for clarity). Data points are ADC averaged for NAA, tCho, and tCr, but the trend is similar for each metabolite. The fact that ADC drops when td is increased at very short td, and then remains fairly stable at approximately one third of the ADC value measured at ultra-short times, is very consistent with metabolite diffusion mainly occurring in long and thin fibers (indeed, in the ideal situation of infinitely long and straight fibers, and in the case of an isotropic distribution of fiber orientations, ADC would drop from Dintra at infinitely short td to Dintra/3 once full restriction has been reached in the plane perpendicular to fiber axis, and then would stabilize at Dintra/3 at longer td, where Dintra is the free intracellular diffusivity). In a situation with metabolites massively confined in subcellular regions such as organelles or cell bodies, the ADC would drop to ~ 0 at long td over the observed time-range. Active transports would rather lead to ADC increasing with td, at least for the time-scales at which these transports become significant compared to diffusion.
This framework of diffusion in long fibers can obviously only be considered as an approximation. First, cells do not consist of hollow tubes with smooth surfaces. The cytosol is filled with cytoskeleton and organelles which might induce tortuous diffusion. Similarly, dendritic spines and astrocytic leaflets, which are small protrusions along the dendrites and astrocytic processes, will slow down metabolites longitudinal diffusion, also resulting in tortuous diffusion along fiber axis. These features will result in decreased ADC plateauing at Dintra/τ along fibers at long td or, in the case of an isotropic distribution of fiber orientations or an isotropic ADC measurement (trace of the tensor), at Dintra/(3τ), where τ is the tortuosity along fibers. Theoretical considerations predict that this asymptotic value should be approached according to a −1/2 power-law in the case of a random distribution of obstacles with short-range disorder, i.e., ADC(td) ~ ADC(td = ∞) + Ktd−1/2, where K depends on the correlation length of the obstacles (Novikov et al., 2014). However, it is not trivial to determine when the tortuosity limit would be reached in practice, i.e., at what td would the ADC approach this asymptotic value within a few percent, which can be considered as a practical threshold due to limited measurement precision. Works based on numerical simulations suggested that tortuosity limit imposed by spines or similar structures with realistic densities (i.e., in the range of 0–5 μm−1) would be reached within ~200 ms (Santamaria et al., 2006; Palombo et al., 2017), corresponding to a typical diffusion distance of ~10 μm along fibers. Hence the ADC value at ~200 ms could be a good estimate of Dintra/(3τ), which would allow extracting the tortuosity induced by short-range structures, provided Dintra is known. Considering the values of Dintra ~0.5–0.6 μm2/ms estimated from modeling of oscillating gradients data in the rodent brain, and ADC ~ 0.1 μm2/ms at td ~ 200 ms in the rodent brain, one gets τ ~ 1.6–2, corresponding for example to 2–4 spines/leaflets per μm (see Table 1 in Palombo et al., 2017). This is however an upper estimate for τ. Indeed, other works based on the analysis of high b-value at a single td, using models of diffusion in cylinders, have reported Dintra to be rather ~0.3–0.45 μm2/ms (Kroenke et al., 2004; Palombo et al., 2016b), which would rather correspond to a very low intracellular tortuosity τ ~ 1–1.3 (corresponding to 0–1 spines or leaflets per μm), but these high-b values experiments were performed at td ~ 50–60 ms, so that Dintra might actually already include some tortuosity. This illustrates how the estimation of τ depends on estimation of Dintra, which remains indirect as it relies on some modeling.
Once the tortuosity limit imposed by short-range structures has been reached (beyond td ~ 200 ms), structural features at larger spatial scales (>~10 μm) are also expected to induce some temporal dependency of ADC, again challenging the approximation of diffusion in long cylinders. These structural features may include fiber undulation, fiber branching, and finite fiber length, which may explain the slight trend of ADC to decrease when increasing td up to ~2 s. The effect of undulations on intracellular diffusion has been investigated using analytical models or numerical simulations (Nilsson et al., 2012), while the effect of branching and finite length has been modeled using numerical simulations (Palombo et al., 2016a). Actually, the later approach was used to analyze experimental data, and suggested that realistic fiber branching and length were indeed quantitatively able to explain observed ADC time-dependency up to 2 s. In particular, diffusion compartments of supposedly astrocytic metabolites were found to be smaller and less complex than those of supposedly neuronal metabolites, and to be also smaller in rodents than in primates, consistently with histology (Palombo et al., 2016a). In this latter work, an intracellular diffusion coefficient including some short-range tortuosity along fibers (equivalent to Dintra/τ) as discussed in the previous paragraph was also let as a free parameter in addition to morphometric parameters, and was found to be ~0.3–0.45 μm2/ms, i.e., lower than those derived from oscillating gradient data, but very close to values derived from high-b values (Kroenke et al., 2004; Ligneul et al., 2017b), suggesting that the latter also already include short-range tortuosity. It is worth mentioning that these long-range structures are of different natures: in theory, undulation and branching would result in “long-range” tortuosity toward a non-zero ADC value, while finite length would result in full restriction with a td−1 approach toward zero. However, these different trends remain hypothetical, as they would become manifest only at very long td (several seconds or even tenths of seconds); at such td other phenomena such as intercellular trafficking, enzyme binding or biochemical transformations may become significant and obscure any long-time power law induced by structure.
Why and How to Get Further?
As discussed above, the determination of Dintra remains indirect and uncertain. However, it is in theory possible to directly measure Dintra provided ADC is measured at sufficiently short time-scales. Simulations in fibers with “realistic” spines/leaflets size and density, as performed in Palombo et al. (2017) but over an extended frequency range, suggest that oscillating gradient frequencies of at least 2,500 Hz are required to approach Dintra within less than 10% (assuming Dintra = 0.5 μm2/ms). Reaching such high frequencies while maintaining sufficiently high b (~1 ms/μm2 or higher) to reliably measure signal attenuation is extremely challenging. We have obtained preliminary metabolites ADC measurements up to f = 665 Hz in the rat brain (Ligneul et al., 2017a), using a gradient coil capable of reaching 1.5 T/m within 250 μs along each axis. This corresponds to td ~ 0.2 ms, when using td = 9/(64f) in the Mitra limit (Novikov and Kiselev, 2011). ADC values of 0.25–0.3 μm2/ms were measured, which actually well extend the trend toward higher ADC at higher frequencies as recently reported in the mouse brain (Ligneul and Valette, 2017), as shown in Figure 2. Although we are presumably far from reaching sufficiently high frequencies to directly get ADC ~ Dintra, it is actually tempting to estimate Dintra (and S/V) in the Mitra limit using the universal formula valid for oscillating gradients (Novikov and Kiselev, 2011), considering the nice linear trend when plotting ADC as a function of f −1/2, which yields Dintra ~ 0.3 μm2/ms for NAA and tCho, and ~0.35 for tCr (and S/V from 2.4 to 2.9 μm−1). This seems relatively low, and compatible with the absence of short-range tortuosity when comparing to ADC values at longer td [ADC(td ~ 200 ms)~Dintra/3] but simulations actually show that the Mitra regime is not strictly reached yet in this frequency range, and that the estimation of Dintra (but not S/V) remains biased toward lower values if spines/leaflets are present (Palombo et al., 2017).
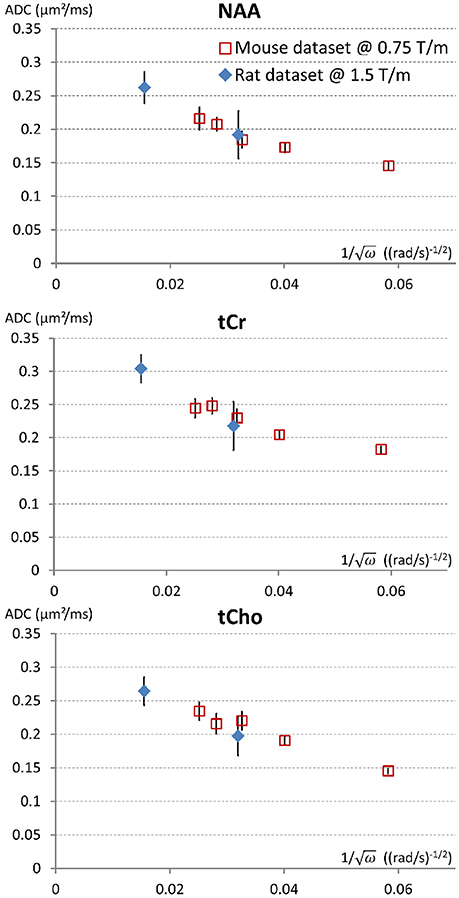
Figure 2. Trying to approach the free intracellular diffusion coefficient of brain metabolites using oscillating gradients. On this figure the ADC measured for NAA, tCr, and tCho, in the mouse brain at 11.7 T using a gradient coil capable of reaching 0.75 T/m along each axis (red open squares) (Ligneul and Valette, 2017) and the rat brain at 7 T using a gradient coil capable of reaching 1.5 T/m along each axis (blue diamonds) (Ligneul et al., 2017a), are displayed as a function of the inverse of square root of the angular frequency [since a linear trend is expected for ADC(ω−1/2) in the Mitra limit]. For better consistency between datasets, the first rat data obtained with oscillating gradients (Marchadour et al., 2012), which were probably slightly biased toward higher values due to some motion artifact, are not displayed here. Data points on the left (smallest ω−1/2) correspond to maximal OG frequency f = 665 Hz. Error bars stand for standard errors of the mean.
Exploring the uncharted territory from ~700 to ~2,500 Hz to reliably determine Dintra and the intracellular tortuosity would require extremely powerful gradients. To reach b = 1 ms/μm2 at f = 2,500 Hz using a trapezoidal cosine waveform (Van et al., 2014) to maximize the weighting, while imposing total gradient waveform duration to be no more than 50 ms to retain some macromolecule signal (which is critical to discard datasets corrupted by motion artifacts; Ligneul and Valette, 2017), one would need a gradient coil capable of reaching ~5.5 T/m within 100 μs along each axis. This appears beyond reach in Humans, and very difficult to achieve in preclinical systems. Hence, the possibility to measure the intracellular viscosity in a “model-free manner” essentially depends upon uncertain technological breakthrough, and may remain elusive.
Although going to td ~ 2 s seems to already yield some sensitivity to long-range structure (in particular fiber length), this sensitivity remains relatively poor. Indeed, the observed ADC time-dependency at long td, or the different time-dependency between neuronal and astrocytic metabolites, is quite close to ADC standard deviation, requiring averaging over many experiments. Further increase of td would allow enhancing the “ADC contrast” (relative decrease of ADC), which would subsequently lead to more reliable modeling and parameter estimation. For example, going to td ~ 10 s would approximately double the ADC contrast, for most situations with reasonable fiber length and complexity (see Figure 2 in Valette, 2014). Furthermore, going to such long td would help assessing the importance of phenomena that could potentially become significant at long time-scales (such as chemical exchange, intercellular exchange, active transport…) and that we have neglected so far, since structural effects alone appeared to satisfactorily explain data in the observed time-window.
Is it possible to reach td ~ 10 s (or longer)? Diffusion time is obviously limited by relaxation, and it is extremely difficult to measure diffusion much beyond metabolite T1. Increasing the magnetic field is a way to increase T1, but this gain becomes modest after 11.7 T (Lopez-Kolkovsky et al., 2016), therefore no significant jump beyond td ~ 2 s can be expected when increasing the magnetic field. However, it might be possible to observe metabolites with longer relaxation times under special conditions. For example, the 13C nuclei of the carboxyl groups of glutamate and glutamine have very long T1 (~10 vs. 1.5 s for 1H at high fields), due to the absence of strong dipole-dipole interaction, as these carboxyl groups share no chemical bond with proton. 13C natural abundance is too low (1.1%) to allow reliable detection in a reasonable time, however glutamate/glutamine can be labeled with 13C at the C5 carboxyl group, by intravenously infusing glucose labeled at position C2 and/or C5 (Sibson et al., 2001). In that context, signal might be detectable by direct 13C MRS. We actually tried to implement such an approach in the rat brain but, although some glutamate C5 signal could be detected, it remained too low for reliable ADC quantification. However, the progresses in radiofrequency coil technologies, and in particular the introduction of 13C cryogenic probes, might make this strategy viable in a near future. Another possibility might reside in the “long-lived states” (Levitt, 2010) where the dipole-dipole coupling is made ineffective (for systems with only two coupled spins-1/2, this corresponds to the antisymmetric “singlet state” with total spin I = 0). Some molecules with a high enough degree of symmetry can be brought to (using dedicated pulse sequences exploiting J-coupling), and then maintained in such states (using spin-locking), during a time significantly exceeding T1, thus allowing diffusion measurements over longer time-scales. This approach was already suggested for slowly diffusing compounds (Cavadini and Vasos, 2008), where the gradient strength can be limiting to induce enough diffusion attenuation, which can instead be increased by increasing td. It is actually possible to bring some endogenous metabolites in such long-lived states. For example, taurine was shown to have long-lived state lifetime ~3 times longer than T1 (~2.7 vs. 1 s at 800 MHz; Ahuja et al., 2009). The extent to which long-lived state metabolite diffusion at ultra-long td may be measured in vivo remains to be explored.
Conclusion
Over the last years, the range of DW-MRS diffusion times has considerably increased, now spanning approximately four orders of magnitude in the rodent brain (from ~0.2 ms to ~2 s). These measurements concurred with the vision that intracellular metabolites are neither massively transported by active mechanisms nor massively restricted in subcellular regions, but are primarily diffusing in long fibers, and that these fibers have some short-range and long-range structures (dendritic spines and astrocytic leaflets, fiber embranchments, finite fiber length…) that may also influence ADC time-dependency. The full elucidation—and accurate quantification—of these deviations from the simple infinite cylinders model requires increasing even further the range of td by at least one order of magnitude (e.g., from 0.1 ms to 10 s), if not more, which appears extremely challenging, yet not absolutely impossible.
Author Contributions
JV: Designed research and wrote the paper; CL, CM, CN: Performed most of the experiments described in this article and proofread the paper; MP: Performed most of the modeling described in this article and proofread the paper.
Conflict of Interest Statement
The authors declare that the research was conducted in the absence of any commercial or financial relationships that could be construed as a potential conflict of interest.
The handling editor is currently editing a Research Topic with one of the authors JV, and confirms the absence of any other collaboration.
Acknowledgments
JV is recipient of grant from the European Research Council about diffusion-weighted MRS (grant agreement No. 336331—INCELL project).
References
Ahuja, P., Sarkar, R., Vasos, P. R., and Bodenhausen, G. (2009). Long-lived states in multiple-spin systems. Chemphyschem 10, 2217–2220. doi: 10.1002/cphc.200900335
Assaf, Y., and Cohen, Y. (1998a). In vivo and in vitro bi-exponential diffusion of N-acetyl aspartate (NAA) in rat brain: a potential structural probe? NMR Biomed. 11, 67–74. doi: 10.1002/(SICI)1099-1492(199804)11:2<67::AID-NBM503>3.0.CO;2-5
Assaf, Y., and Cohen, Y. (1998b). Non-mono-exponential attenuation of water and N-acetyl aspartate signals due to diffusion in brain tissue. J. Magn. Reson. 131, 69–85. doi: 10.1006/jmre.1997.1313
Brand, A., Richter-Landsberg, C., and Leibfritz, D. (1993). Multinuclear NMR studies on the energy metabolism of glial and neuronal cells. Dev. Neurosci. 15, 289–298. doi: 10.1159/000111347
Callaghan, P. T., and Stepisnik, J. (1995). Frequency-domain analysis of spin motion using modulated-gradient NMR. J. Magn. Reson. Ser. A 117, 118–122. doi: 10.1006/jmra.1995.9959
Cavadini, S., and Vasos, P. R. (2008). Singlet states open the way to longer time-scales in the measurement of diffusion by NMR spectroscopy. Concepts Magn. Reson. A 32A, 68–78. doi: 10.1002/cmr.a.20100
Choi, J. K., Dedeoglu, A., and Jenkins, B. G. (2007). Application of MRS to mouse models of neurodegenerative illness. NMR Biomed. 20, 216–237. doi: 10.1002/nbm.1145
Does, M. D., Parsons, E. C., and Gore, J. C. (2003). Oscillating gradient measurements of water diffusion in normal and globally ischemic rat brain. Magn. Reson. Med. 49, 206–215. doi: 10.1002/mrm.10385
Dreher, W., Busch, E., and Leibfritz, D. (2001). Changes in apparent diffusion coefficients of metabolites in rat brain after middle cerebral artery occlusion measured by proton magnetic resonance spectroscopy. Magn. Reson. Med. 45, 383–389. doi: 10.1002/1522-2594(200103)45:3<383::AID-MRM1050>3.0.CO;2-G
Ellegood, J., Hanstock, C. C., and Beaulieu, C. (2006). Diffusion tensor spectroscopy (DTS) of human brain. Magn. Reson. Med. 55, 1–8. doi: 10.1002/mrm.20777
Fushimi, K., and Verkman, A. S. (1991). Low viscosity in the aqueous domain of cell cytoplasm measured by picosecond polarization microfluorimetry. J. Cell Biol. 112, 719–725. doi: 10.1083/jcb.112.4.719
Griffin, J. L., Bollard, M., Nicholson, J. K., and Bhakoo, K. (2002). Spectral profiles of cultured neuronal and glial cells derived from HRMAS (1)H NMR spectroscopy. NMR Biomed. 15, 375–384. doi: 10.1002/nbm.792
Kroenke, C. D., Ackerman, J. J., and Yablonskiy, D. A. (2004). On the nature of the NAA diffusion attenuated MR signal in the central nervous system. Magn. Reson. Med. 52, 1052–1059. doi: 10.1002/mrm.20260
Le Belle, J. E., Harris, N. G., Williams, S. R., and Bhakoo, K. K. (2002). A comparison of cell and tissue extraction techniques using high-resolution 1H-NMR spectroscopy. NMR Biomed. 15, 37–44. doi: 10.1002/nbm.740
Levitt, M. H. (2010). Singlet and other states with extended lifetimes. eMagRes. doi: 10.1002/9780470034590.emrstm1036
Ligneul, C., Palombo, M., Flament, J., and Valette, J. (2017a). Approaching free intracellular diffusion by diffusion-weighted MRS at ultra-short time scales: initial results in the rodent brain using a 1.5 T/m gradient. Proc. Intl. Soc. Mag. Reson. Med. 25:1082.
Ligneul, C., Palombo, M., and Valette, J. (2017b). Metabolite diffusion up to very high b in the mouse brain in vivo: revisiting the potential correlation between relaxation and diffusion properties. Magn. Reson. Med. 77, 1390–1398. doi: 10.1002/mrm.26217
Ligneul, C., and Valette, J. (2017). Probing metabolite diffusion at ultra-short time scales in the mouse brain using optimized oscillating gradients and “short”-echo-time diffusion-weighted MRS. NMR Biomed. 30. doi: 10.1002/nbm.3671
Lopez-Kolkovsky, A. L., Mériaux, S., and Boumezbeur, F. (2016). Metabolite and macromolecule T1 and T2 relaxation times in the rat brain in vivo at 17.2T. Magn. Reson. Med. 75, 503–514. doi: 10.1002/mrm.25602
Luby-Phelps, K., Mujumdar, S., Mujumdar, R. B., Ernst, L. A., Galbraith, W., and Waggoner, A. S. (1993). A novel fluorescence ratiometric method confirms the low solvent viscosity of the cytoplasm. Biophys. J. 65, 236–242. doi: 10.1016/S0006-3495(93)81075-0
Madhavarao, C. N., Chinopoulos, C., Chandrasekaran, K., and Namboodiri, M. A. (2003). Characterization of the N-acetylaspartate biosynthetic enzyme from rat brain. J. Neurochem. 86, 824–835. doi: 10.1046/j.1471-4159.2003.01905.x
Marchadour, C., Brouillet, E., Hantraye, P., Lebon, V., and Valette, J. (2012). Anomalous diffusion of brain metabolites evidenced by diffusion-weighted magnetic resonance spectroscopy in vivo. J. Cereb. Blood Flow Metab. 32, 2153–2160. doi: 10.1038/jcbfm.2012.119
Merboldt, K. D., Hörstermann, D., Hänicke, W., Bruhn, H., and Frahm, J. (1993). Molecular self-diffusion of intracellular metabolites in rat brain in vivo investigated by localized proton NMR diffusion spectroscopy. Magn. Reson. Med. 29, 125–129. doi: 10.1002/mrm.1910290123
Najac, C., Branzoli, F., Ronen, I., and Valette, J. (2016). Brain intracellular metabolites are freely diffusing along cell fibers in grey and white matter, as measured by diffusion-weighted MR spectroscopy in the human brain at 7 T. Brain Struct. Funct. 221, 1245–1254. doi: 10.1007/s00429-014-0968-5
Najac, C., Marchadour, C., Guillermier, M., Houitte, D., Slavov, V., Brouillet, E., et al. (2014). Intracellular metabolites in the primate brain are primarily localized in long fibers rather than in cell bodies, as shown by diffusion-weighted magnetic resonance spectroscopy. Neuroimage 90, 374–380. doi: 10.1016/j.neuroimage.2013.12.045
Nilsson, M., Lätt, J., Ståhlberg, F., van Westen, D., and Hagslätt, H. (2012). The importance of axonal undulation in diffusion MR measurements: a Monte Carlo simulation study. NMR Biomed. 25, 795–805. doi: 10.1002/nbm.1795
Novikov, D. S., Jensen, J. H., Helpern, J. A., and Fieremans, E. (2014). Revealing mesoscopic structural universality with diffusion. Proc. Natl. Acad. Sci. U.S.A. 111, 5088–5093. doi: 10.1073/pnas.1316944111
Novikov, D. S., and Kiselev, V. G. (2011). Surface-to-volume ratio with oscillating gradients. J. Magn. Reson. 210, 141–145. doi: 10.1016/j.jmr.2011.02.011
Palombo, M., Ligneul, C., Hernandez-Garzon, E., and Valette, J. (2017). Can we detect the effect of spines and leaflets on the diffusion of brain intracellular metabolites? Neuroimage. doi: 10.1016/j.neuroimage.2017.05.003. [Epub ahead of print].
Palombo, M., Ligneul, C., Najac, C., Le Douce, J., Flament, J., Escartin, C., et al. (2016a). New paradigm to assess brain cell morphology by diffusion-weighted MR spectroscopy in vivo. Proc. Natl. Acad. Sci. U.S.A. 113, 6671–6676. doi: 10.1073/pnas.1504327113
Palombo, M., Ligneul, C., and Valette, J. (2016b). Modeling diffusion of intracellular metabolites in the mouse brain up to very high diffusion-weighting: diffusion in long fibers (almost) accounts for non-monoexponential attenuation. Magn. Reson. Med. 77, 343–350. doi: 10.1002/mrm.26548
Parsons, E. C., Does, M. D., and Gore, J. C. (2006). Temporal diffusion spectroscopy: theory and implementation in restricted systems using oscillating gradients. Magn. Reson. Med. 55, 75–84. doi: 10.1002/mrm.20732
Posse, S., Cuenod, C. A., and Le Bihan, D. (1993). Human brain: proton diffusion MR spectroscopy. Radiology 188, 719–725. doi: 10.1148/radiology.188.3.8351339
Santamaria, F., Wils, S., De Schutter, E., and Augustine, G. J. (2006). Anomalous diffusion in Purkinje cell dendrites caused by spines. Neuron 52, 635–648. doi: 10.1016/j.neuron.2006.10.025
Sibson, N. R., Mason, G. F., Shen, J., Cline, G. W., Herskovits, A. Z., Wall, J. E. M., et al. (2001). In vivo C-13 NMR measurement of neurotransmitter glutamate cycling, anaplerosis and TCA cycle flux in rat brain during [2-C-13]glucose infusion. J. Neurochem. 76, 975–989. doi: 10.1046/j.1471-4159.2001.00074.x
Simmons, M. L., Frondoza, C. G., and Coyle, J. T. (1991). Immunocytochemical localization of N-acetyl-aspartate with monoclonal antibodies. Neuroscience 45, 37–45. doi: 10.1016/0306-4522(91)90101-S
Stepisnik, J. (1981). Analysis of NMR self-diffusion measurements by a density-matrix calculation. Physica B+C 104, 350–364. doi: 10.1016/0378-4363(81)90182-0
Valette, J. (2014). Diffusion modeling in brain cell geometries parameterized according to morphometric statistics. Proc. Intl. Soc. Mag. Reson. Med. 22:4424.
Van, A. T., Holdsworth, S. J., and Bammer, R. (2014). In vivo investigation of restricted diffusion in the human brain with optimized oscillating diffusion gradient encoding. Magn. Reson. Med. 71, 83–94. doi: 10.1002/mrm.24632
Keywords: intracellular diffusion, brain metabolites, ADC time-dependency, microstructure, diffusion time
Citation: Valette J, Ligneul C, Marchadour C, Najac C and Palombo M (2018) Brain Metabolite Diffusion from Ultra-Short to Ultra-Long Time Scales: What Do We Learn, Where Should We Go? Front. Neurosci. 12:2. doi: 10.3389/fnins.2018.00002
Received: 25 September 2017; Accepted: 03 January 2018;
Published: 19 January 2018.
Edited by:
Sune Nørhøj Jespersen, Aarhus University, DenmarkReviewed by:
Christopher D. Kroenke, Oregon Health & Science University, United StatesBenoit Scherrer, Boston Children's Hospital, Harvard University, United States
Copyright © 2018 Valette, Ligneul, Marchadour, Najac and Palombo. This is an open-access article distributed under the terms of the Creative Commons Attribution License (CC BY). The use, distribution or reproduction in other forums is permitted, provided the original author(s) or licensor are credited and that the original publication in this journal is cited, in accordance with accepted academic practice. No use, distribution or reproduction is permitted which does not comply with these terms.
*Correspondence: Julien Valette, julien.valette@cea.fr