Anatomy of human sensory cortices reflects inter-individual variability in time estimation
- 1 Institute of Cognitive Neuroscience, University College London, London, UK
- 2 Wellcome Trust Centre for Neuroimaging, University College London, London, UK
The ability to estimate duration is essential to human behavior, yet people vary greatly in their ability to estimate time and the brain structures mediating this inter-individual variability remain poorly understood. Here, we showed that inter-individual variability in duration estimation was highly correlated across visual and auditory modalities but depended on the scale of temporal duration. We further examined whether this inter-individual variability in estimating durations of different supra-second time scales (2 or 12 s) was reflected in variability in human brain anatomy. We found that the gray matter volume in both the right posterior lateral sulcus encompassing primary auditory and secondary somatosensory cortex, plus parahippocampal gyrus strongly predicted an individual’s ability to discriminate longer durations of 12 s (but not shorter ones of 2 s) regardless of whether they were presented in auditory or visual modalities. Our findings suggest that these brain areas may play a common role in modality-independent time discrimination. We propose that an individual’s ability to discriminate longer durations is linked to self-initiated rhythm maintenance mechanisms relying on the neural structure of these modality-specific sensory and parahippocampal cortices.
Introduction
The ability to estimate time is fundamental to human behavior. Over a few seconds, judging how long an event lasts appears effortless and easy, whether the duration is just a few seconds or longer and regardless of sensory modality. However, people do vary considerably in their abilities to estimate the duration of an event, and the neural mechanisms underlying such variability in time estimation remain poorly understood. It is unclear whether such individual abilities rely on a single modality-independent mechanism or different modality-specific mechanisms (Treisman et al., 1990; Lewis and Miall, 2003; Mauk and Buonomano, 2004; Ivry and Schlerf, 2008). Moreover, it is also unclear whether judging durations of just a few seconds and judging longer durations are supported by the same neural mechanisms (Poppel, 1997; Morillon et al., 2009).
Most approaches investigating the neural mechanisms underlying time estimation have related perception to neural activity averaged across small groups of individuals (Rao et al., 2001; Coull et al., 2004; Bueti et al., 2008; Cui et al., 2009). This approach necessarily ignores any variability in time perception across individuals, averaging across the data. To examine whether time perception across different durations or sensory modalities is supported by common or distinct mechanisms, we explicitly examined such variability in time estimation. We adopted an experimental design previously used in a study by Brown et al. (1995) who specifically investigated individual differences in time estimation for supra-second durations of 2 and 12 s. Although the original study examined time estimation in the visual modality, alone we now extended the paradigm to the auditory modality to allow comparisons of individual differences across modalities. Systematic individual differences in time estimation correlated across different modalities or for different durations would support the existence of common underlying neural mechanisms across durations or for different modalities (Vogel and Awh, 2008).
To probe the neural structures underlying individual differences in auditory and visual time estimation, we further tested whether these behavioral measures were associated with variability in the anatomical microstructure of the brain measured using structural magnetic resonance imaging (MRI). Because brain structure is relatively invariant to the context in which it is measured, this provided a way to relate multiple different behavioral measures of time estimation to a single neural measure (Kanai and Rees, 2011). Brain structure is reliably associated with individual differences in motor performance or training on tasks such as juggling (May and Gaser, 2006; Ilg et al., 2008) and keyboard playing (Gaser and Schlaug, 2003), and can reflect differences in visual perception (Fleming et al., 2010; Kanai et al., 2010; Schwarzkopf et al., 2011). Here, we hypothesized that variability across participants in time estimation would be reflected in the anatomical neural structure of the human brain.
Materials and Methods
Participants
A group of 31 naive participants [12 males and 19 females, aged 25.2 ± 4.9 (SD)] took part in the main behavioral experiments and structural MRI scans. All had normal or corrected-to-normal vision, and normal hearing. Thirteen healthy participants [seven females, aged 23.8 ± 4.25 (SD), normal or corrected-to-normal vision] participated in the three control experiments. All participants gave written informed consent to participate in the study before participating in the study that had been approved by the local ethics committee.
Main Experiments
Stimuli
Visual. Visual stimuli were presented centrally on an SVGA 19″ monitor set at 1024 × 768 resolution and a refresh rate of 75 Hz, and were viewed from 58 cm distance. Following the design of a previous study of individual differences in time perception (Brown et al., 1995), the visual target (see Figure 1) consisted of a blue central rectangle with a purple inner border and a lavender outer border (Brown et al., 1995) subtending a visual angle of 14.14° × 6.61° (width × height). The fixation cross subtended a visual angle of 0.017° × 0.017°.
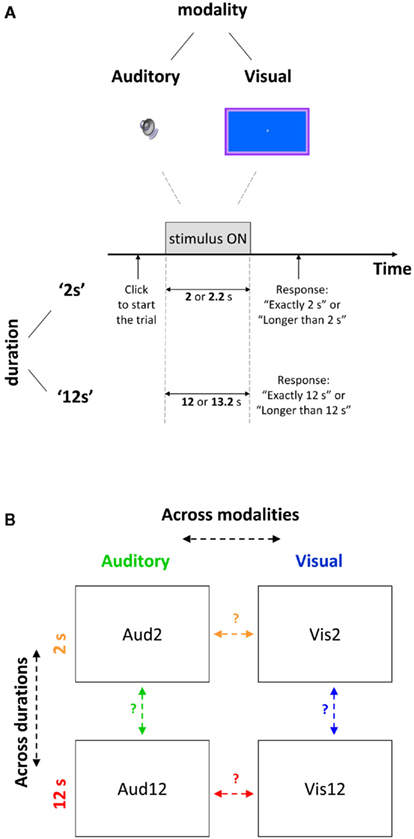
Figure 1. Experimental design (A) Depiction of a duration discrimination trial, presented either visually or aurally for shorter (2 s) or longer (12 s) durations. Trials were blocked by condition and lasted for target duration (2 or 12 s respectively) or 10% longer. To begin each trial participants had to press a key. After stimulus offset participants had to indicate via button press whether target or non-target duration was presented in a 2AFC manner. (B) Predictions for common neural mechanisms across different modalities (orange arrow for shorter duration, red for longer duration) or for different durations (green for auditory, blue for visual) based on correlation strengths of the variability in time estimation.
Auditory. The auditory stimulus was a sine wave at a frequency of 600 Hz and was conveyed via headphones. At the beginning of each experimental session (see below) the loudness level was subjectively adjusted for each participant to ensure that the participant heard the stimulus and the sound level was comfortable (not too loud).
Experimental setup
Participants were given detailed instructions before the beginning of the first experimental session. Each participant undertook short training of 4–5 trials before the experiment began. Participants were instructed to keep their eyes still on the fixation cross that appeared on the screen throughout all the experimental trials (visual and auditory). Headphones were worn throughout all the experiment in all blocks and trials (visual and auditory). The monitor and a chin rest were mounted on a height-adjustable table, so that the distance between the head and the monitor was constant for all participants. The head position was fixed using the chin rest at a comfortable height for each participant, to minimize head and body motion. The experiment took place in a darkened testing room.
Duration discrimination
Our behavioral experimental paradigm followed closely Brown’s study (Brown et al., 1995) that examined individual differences in time perception for durations of 2 and 12 s in the visual modality, which we here also extended to audition. The experiment comprised four conditions in a factorial design: Vis2 (visual target of 2 s, non-target 2.2 s), Aud2 (auditory target of 2 s, non-target 2.2 s), Vis12 (visual target of 12 s, non-target 13.2 s), and Aud12 (auditory target of 12 s, non-target 13.2 s). The experiment was run in 12 blocks: 3 blocks for each of the 4 conditions (Vis2, Aud2, Vis12, and Aud12). In order to complete all the blocks participants attended three sessions (one session for the 2 s blocks and two sessions for the 12 s blocks), typically on two different days within the same week. Each session lasted 1–1.5 h.
Participants started either with the ‘2 s’ or with the ‘12 s’ blocks and completed all the 6 blocks of that specific duration before starting with the blocks of the other duration. Half of the participants started with the ‘2 s’ blocks and half with the ‘12 s’ blocks. Within a specific duration half of the participants started either with an auditory block and half with a visual block. Visual and auditory blocks of the same duration were interleaved and their order was controlled for within each participant (to control for potential learning effects) and between participants. A participant that started the ‘2 s’ condition with a visual block started the ‘12 s’ condition with an auditory block and vice versa.
Each block included 70 trials of the same modality and the same duration discrimination (either 2 s discrimination or 12 s discrimination), so that for each condition there were 210 trials (in the 3 blocks). Participants were notified before each block which modality they would be tested on next.
The 70 grouped trials in each block included 35 target trials (2 or 12 s depending on the block) and 35 longer-than-target trials (2.2 or 13.2 s accordingly, 10% longer-than-target). The order of trials within a block was random, and the participants were notified about this before the experiment began.
Participants were prompted by an instruction on the screen to press a key in order to start each trial (see Figure 1). Two-hundred milliseconds after they pressed a key, the stimulus appeared for target or non-target duration.
Participants were instructed to estimate covertly the duration of the stimulus and to respond promptly after stimulus offset whether the stimulus was present for “exactly a certain duration” (e.g., “exactly 2 s”) or for “more than a certain duration” (e.g., “more than 2 s”) in a two-alternative forced choice manner (see Figure 1) via key presses. No feedback was given. An inter-trial interval of 1500 ms displaying the fixation cross followed the participant response before the prompt for the next trial appeared. Participants were allowed to take breaks between trials within a block, although this rarely happened.
Behavioral analysis
Participant responses to each block were classified as hits, misses, correct rejections, or false alarms with the 12 s trials being targets for this signal detection based analysis. For each participant response accuracy of each block was determined as (hits + correct rejections)/(all responses). Individual’s accuracies on each of the three blocks of each condition (Vis2, Aud2, Vis12, Aud12) were averaged to yield four individual condition-based performance measures. D prime (d″) was calculated as the discrimination sensitivity for each condition [i.e., the distance between the distributions of the targets (12 s) and the non-targets (13.2 s)] according to the formula d″ = Z(hit rate) − Z(false alarm rate), where Z(p) is the inverse of the cumulative Gaussian distribution for p [0,1]. Since sensitivity measures (d″) were highly consistent with accuracy performance [accuracy to d″ correlations were R2 ≥ 0.9, t(29) ≥ 17, p < 10−15, for all the conditions] we report here the accuracy results.
Individual accuracy performances on each of the three blocks were taken as independent measures for the test–retest analysis. Test–retest results presented include correlation between the first and second blocks, or between the first and third blocks (to avoid dependent measures).
Correlation analyses between conditions (across durations or across modalities, see Figure 2A) were performed by correlating accuracy (or d″) measures of all participants (participant order fixed) between two conditions and assessing these for statistical significance in a conventional fashion.
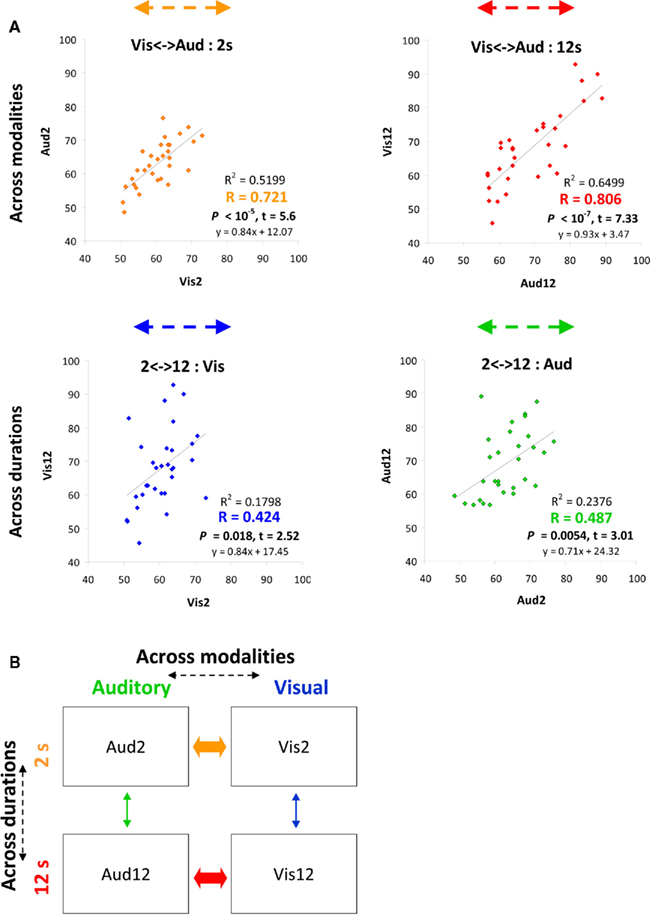
Figure 2. Behavioral performance strongly correlated across different modalities of temporal judgments. (A) Plots convey temporal estimation correlations between conditions either across modalities (top) or across durations (bottom). Colored arrows at the top of each plot correspond to the correlation arrows in Figure 1A. x and y axes indicate accuracy level (% correct) of specific conditions (condition name indicated on axis title). Each point depicts data from one participant (n = 31). Correlation strength and significance are indicated at the bottom right of each plot. See also Figures 6A–C. (B) Inter-individual variability in time estimation is strongly correlated across modalities (A) as depicted by thick arrows (orange for shorter durations, red for longer), indicating common neural mechanisms for time estimation across different modalities. Thin arrows (across durations) indicate weaker correlations.
Control Experiment 1
Estimating individual temporal discrimination ability for 12 s with original task and with finer adaptive method
We conducted an additional experiment to yield a finer psychometric measure of individuals’ ability to discriminate intervals around 12 s. This was done by applying a Bayesian paradigm that efficiently estimates perceptual thresholds (QUEST; Watson and Pelli, 1983) to long duration discrimination sensitivity. We varied the duration increment applied to a 12 s pedestal and estimated the minimum increment that could be successfully discriminated at a level of 75% accuracy. In each trial, an interval of either 12 s or longer was presented. In trials of duration longer than 12 s, the duration increment (from the 12 s pedestal) was adaptively estimated by QUEST based on the participant’s previous responses until that trial. Participants were informed that they had to judge whether a trial [consisting of the appearance of a rectangle (Brown et al., 1995), as in the main experiment; see Materials and Methods] lasted for 12 s or longer, and that trials longer than 12 s could vary in duration. Trials of 12 s (6) were interspersed randomly among longer duration (14) trials. The temporal perceptual threshold was defined as the estimated duration increment that allowed each participant to discriminate 12 s and 12+ increment seconds at the predetermined accuracy level, as described above. All other procedures were as in the original main experiments 12 s discrimination task. Temporal discrimination ability according to the original task (discriminating 12 from 13.2 s) was also estimated. Each participant performed 10 trials of 12 or 13.2 s randomly ordered, following the original task experimental procedures.
Control Experiment 2
Estimating individual temporal discrimination ability for 2 s with finer adaptive method
The ability of temporal discrimination for 2 s intervals was also estimated using the finer adaptive QUEST procedure described above (Watson and Pelli, 1983). The procedure was as described above for 12 s durations, but now for shorter 2 s durations.
Control Experiment 3
Possible non-specific confounds
To examine whether the time discrimination ability measured for longer durations (12 s) was time-specific or reflected potentially confounding processes such as sustained attention or motivational factors we constructed a paradigm inspired by Coull et al. (2004). In this new experimental paradigm, our participants performed either a temporal discrimination task (discriminating between 12 and 13.2 s durations) or a color discrimination task. In both tasks, the physical stimuli and presentation paradigm were identical and only the task that participants performed varied. The temporal discrimination task was identical to our main experimental task, to discriminate between 12 and 13.2 s durations while ignoring the colored flashing circles that appeared. In the color discrimination task participants had to attend the color of the circles that appeared and judge whether the color of the last appearing circle in a trial was identical to or different than the color of the preceding circle.
Stimuli
Visual stimuli were presented centrally on a black background. A small white fixation empty circle (visual angle of 0.286°) appeared in the beginning of the trial at the center of the screen to indicate that the trial has started and remained present until the trial ended. During the trial a number of flickering colored circles appeared at the center of the screen. Each circle was presented for 250 ms, and had a diameter of 7.44° of visual angle when viewed from a distance of 50 cm. The circle colors were similar to the color shades reported by (Coull et al., 2004) and were reddish [(R, G, B) = (139, 0, 65)], pinkish (139, 7, 108), purple (116, 0, 213), another shade of purple (100, 19, 111), and blue (60, 20,168). The number of flickering circles in a trial varied across trials (between three and nine circles per trial, average of 6.25). The color order and the number of colors used varied across trials. The flickering circles appeared in an asynchronous manner within each trial (SOA between 400 and 7300 ms, mean 1831 ms), and the onsets of circle appearances varied across trials. The stimuli were presented at 1024 × 768 resolution and a refresh rate of 60 Hz via Cogent MATLAB toolbox (http://www.vislab.ucl.ac.uk/cogent_2000.php).
Procedure
Prior to each condition (temporal or color discrimination) participants were instructed about the task and then underwent a four trial practice to check that they understood the instructions (see task descriptions above). Each participant then performed 36 main trials of that condition that were administered in 3 blocks (12 trials in each block). All 13 participants performed 36 trials of the time discrimination condition. Ten participants performed 36 trials of the color condition, and three participants performed only 24 trials of the color condition due to time constraints. In order to reduce expectancy of the upcoming stimuli, we created two ordering versions that differed only in the color flashing order and in the trial order within a block. The order of 12 and 13.2 s trials was counterbalanced within and across versions. Trials ending in different colored circles (expected response “different” in the color task) were also counter balanced, and we also ensured that half of the “different” colored trials were 12 s long and half were 13.2 s long, and the same for “same” colored circles. Factors such as number of circle appearances in a trial and distribution of the SOA between trials were also controlled for in the design of the experiment. Responses were provided via key presses.
Analysis
Participant responses to each block were classified as correct or incorrect. Individual accuracy measures for the time task or the color task were averaged over all responses from the three blocks of that condition.
MRI Data Acquisition
MR images were acquired on a 1.5-T Siemens Sonata MRI scanner (Siemens Medical, Erlangen, Germany) at The Wellcome Trust Centre for Neuroimaging, UCL. High-resolution anatomical images were acquired using a T1-weighted 3-D modified driven equilibrium Fourier transform (MDEFT) sequence (TR = 12.24 ms; TE = 3.56 ms; field of view = 256 mm × 256 mm; voxel size = 1 mm × 1 mm × 1 mm). During scanning, head motion was restrained by padding inserted between the participant’s head and the head RF coil.
Structural MRI Voxel-Based Morphometry Analyses
For each participant the T1-weighted MR images were first segmented to gray matter (GM) and white matter (WM) using the segmentation tools in SPM8 (http://www.fil.ion.ucl.ac.uk/spm). Subsequently, we performed diffeomorphic anatomical registration through exponentiated lie algebra (DARTEL; Ashburner, 2007) in SPM8 for inter-participant registration of the GM images. The registered images were smoothed with a Gaussian kernel (FWHM = 8 mm) and were then transformed to MNI stereotactic space using affine and non-linear spatial normalization implemented in SPM8 for multiple regression analysis. The gender and age of the participants were included in the design matrix as covariates of no interest, and were thus regressed out. Multiple regression analysis was performed separately for each of the four conditions of the main experiment (Vis2, Aud2, Vis12, Aud12), each time with gender and age as the covariates of no interest. The global GM volume was also entered into the regression as an additional covariate following ANCOVA normalization. All analyses were applied with p < 0.001 uncorrected as the criterion to detect voxels with a significant correlation with individual’s temporal discrimination for each duration and modality. Following this we applied non-stationary whole-brain cluster-level correction to correct for non-uniform smoothness in the VBM data-set that affects cluster size inference (http://fmri.wfubmc.edu/cms/NS-General) (Worsley et al., 1999; Hayasaka et al., 2004) using SPM5. We report here only results that survived non-stationary correction for multiple comparisons across the whole-brain at a threshold of p < 0.05 (see Figure 3).
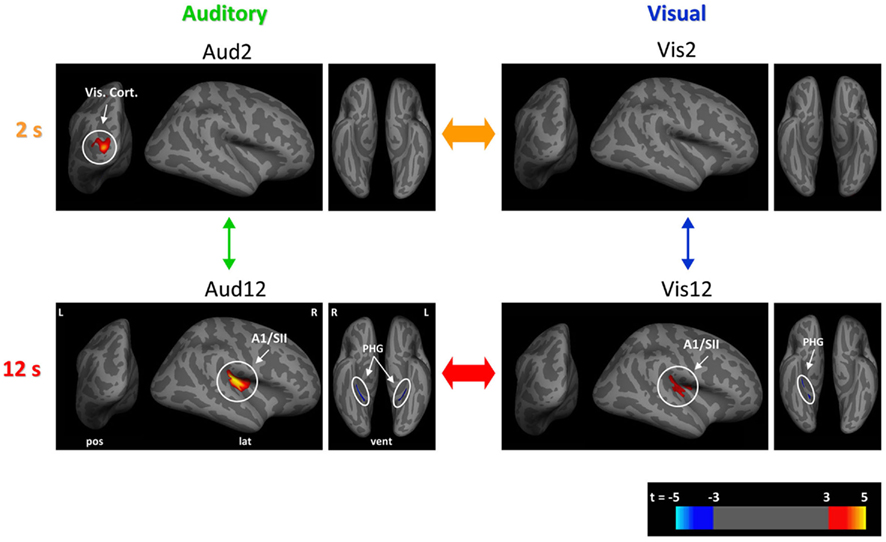
Figure 3. Neural structural correlates of duration discrimination. For each of the experimental conditions, shown in red to yellow (blue) are those cortical loci where our analyses of cortical thickness revealed a significant positive (negative) correlation between cortical thickness and duration discrimination (p < 0.05, corrected) across the group of participants (n = 31). Aud2 (top left), Vis2 (top right), Aud12 (bottom left), Vis12 (bottom right). Data are shown overlaid onto an inflated template brain in a standard stereotactic space where sulci are represented in dark gray and gyri in light gray. Significant clusters are shown at t-values according to scale bar (bottom right) for visualization purposes (see Table 1 for further details). Note the common structural correlates for estimation of longer durations in right A1/PAC (primary auditory) and SII (secondary somatosensory) cortices for both longer visual and longer auditory durations. R, right; L, left; PHG, parahippocampal gyrus; Vis. Cort, visual cortex; lat, lateral; pos, posterior; vent, ventral.
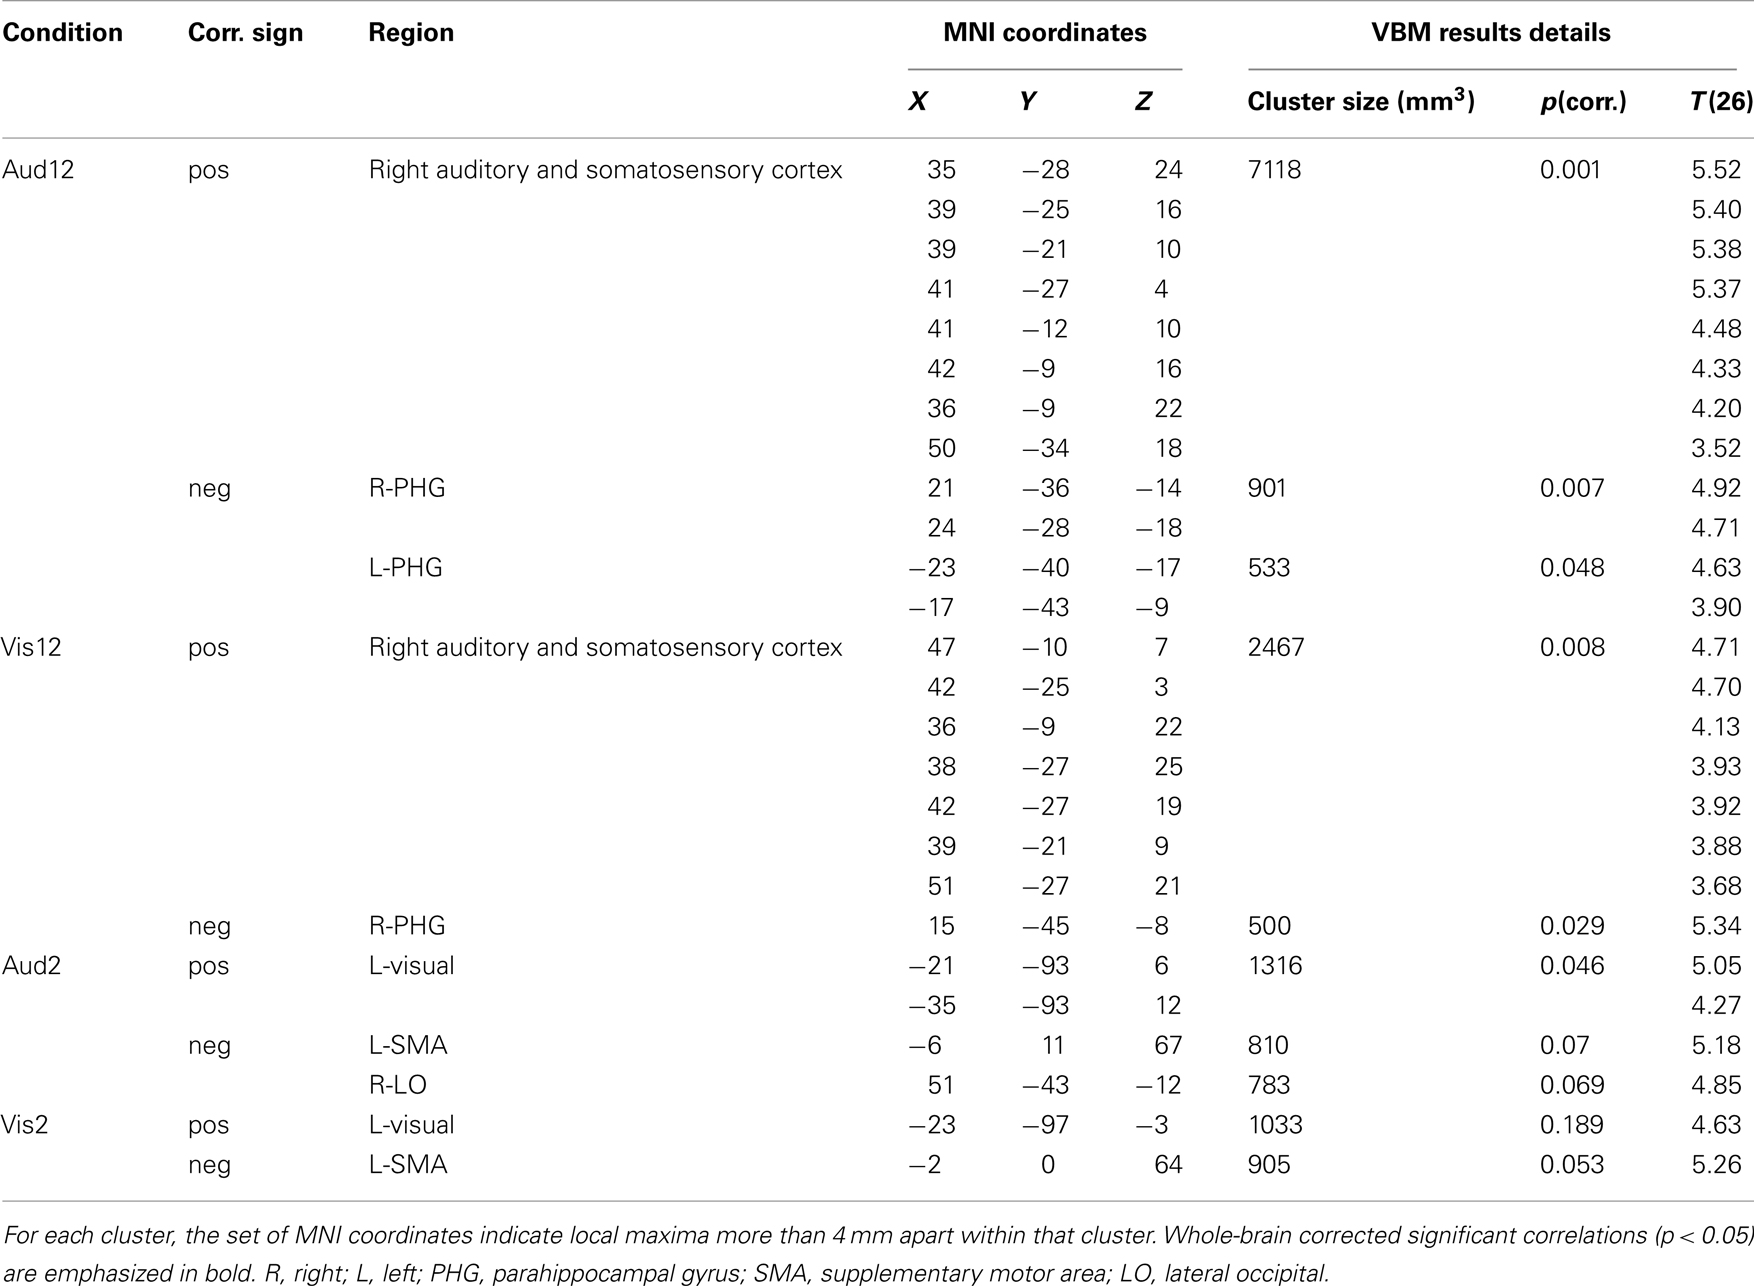
Table 1. Anatomical and statistical details of the brain regions where gray matter volume correlated significantly with inter-individual variability in duration discrimination ability.
Overlaying VBM Results on Probabilistic Atlas
To localize more precisely the specific brain structures revealed in the different conditions with respect to the auditory and secondary somatosensory cortices’ cyto-anatomical parcellations, we overlaid our statistical VBM maps on probabilistic histological-based atlases (Morosan et al., 2001; Rademacher et al., 2001; Eickhoff et al., 2006a,b; see Figure 4). These probabilistic atlases are based on cytoarchitectural postmortem analyses of human brains and provide a veridical estimate for the likelihood that a specific location within MNI stereotactic space (as used here) is within a specific brain structure. The regions delineated here were the A1/PAC structures (TE1.0, TE1.1, and TE1.2) and SII structures (OP1–OP4). For each of these brain structures the borders in Figure 4 indicate a probability >0.4 to be in that structure (i.e., each brain voxel with p > 0.4 to be in that region is within the delineated borders).
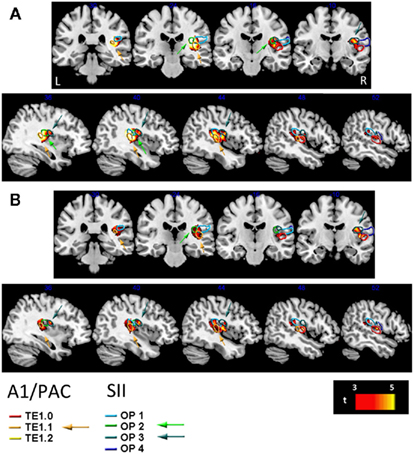
Figure 4. Overlay of longer duration structural correlates on right A1/PAC (primary auditory) and SII (secondary somatosensory) cortices. Cortical loci where our analyses of cortical thickness revealed a significant positive correlation between cortical thickness and longer auditory [Aud12, (A)] or longer visual [Vis12, (B)] duration discrimination shown in red to bright yellow (t-values indicated on scale bar) superimposed on structures of A1/PAC and SII. A1/PAC and SII structures are denoted by colored contours according to the legend at the bottom (see Materials and Methods). Coronal (top) and sagittal (bottom) views. Arrows point to substantial portions of these structures that are correlated with longer duration discrimination ability, which are TE1.1 (PAC/A1, see orange arrows) and OP2–3 (SII, see blue and turquoise arrows). See also Figures 5A–C. R, right; L, left.
Figures 5A–C provides further quantitative statistical estimates to the data presented in Figure 4 (average statistics of longer duration discrimination structural correlates for each of the sensory structures).
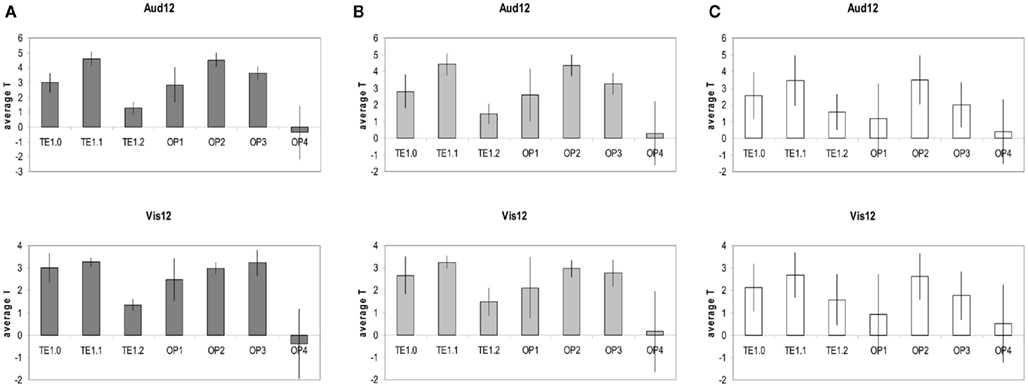
Figure 5. (A) Top: average T statistics of the Aud12 structural correlates t-map (as seen in Figure 3 bottom left and in Figure 4A). For each structure of A1/PAC (i.e., TE1.0, TE1.1, TE1.2) and for each structure of SII (i.e., OP1–OP4) the average is done over all the MNI coordinates that are highly likely (probability of 60–100%) to be in that structure according to the Juelich atlas (http://www.fz-juelich.de/inm/and SPM toolbox http://www.fz-juelich.de/ime/spm_anatomy_toolbox). Bottom: same analysis for the Vis12 structural correlates. The data show that the structural correlates of Aud12 and Vis12 are robust within TE1.1, OP2, and OP3 and are highly consistent and stable within these regions. Error bars, SD. (B) Same as (A) but over all the MNI coordinates that have a medium likelihood (probability of 40–60%) to be in the structures of A1/PAC and SII according to the Juelich atlas (see above). (C) Same as (A) but over all the MNI coordinates that have some likelihood (probability of 10–40%) of being in the structures of A1/PAC and SII according to the Juelich atlas (see above).
Results
Temporal Discrimination Performance
A group of 31 healthy adult human participants made two alternative forced choice temporal increment discriminations on either shorter (~2 s) or longer (~12 s) supra-second duration stimuli presented in either visual or auditory modalities (see Materials and Methods for full details and Figure 1). The experimental design thus represented a 2 × 2 factorial design where input modality and overall duration of the discriminated stimuli varied independently. This gave rise to four conditions, which we will refer to as Vis2, Aud2, Vis12, and Aud12.
We found large inter-individual variability in temporal discrimination ability in all four conditions [Figure 2, Vis2: 50.7–72.9%, mean 60.4 ± 5.8% (SD); Aud2: 48.8–76.7%, mean 63.1 ± 6.8%; Vis12: 45.7–92.9%, mean 67.9 ± 11.4%; Aud12: 56.7–89%, mean 68.9 ± 9.9%].
Across individuals, variability in behavior was strongly and significantly correlated across sensory modalities, both for the longer duration discriminations [Vis12 to Aud12: R2 = 0.6499, p < 10−7, t(29) = 7.33, see Figure 2A in red] and for the shorter durations [Vis2 to Aud2: R2 = 0.5199, p < 10−5, t(29) = 5.6, see Figure 2A in orange).
Inter-individual correlations in temporal discrimination ability within a particular modality for different durations were considerably weaker than those between modalities described above, although reaching significance [Aud2 to Aud12: R2 = 0.2376, p = 0.0054, t(29) = 3.01, see Figure 2A in green; Vis2 to Vis12: R2 = 0.1798, p = 0.018, t(29) = 2.52, Figure 2A in blue]. We further confirmed this in our control experiments (see below).
We further verified the reliability of our behavioral temporal measures in additional experiments. Those included verifying that the temporal discrimination ability we measured for the longer durations was an accurate and valid way to characterize individual differences in temporal judgments, that the temporal discrimination measure was not too crude a measure for longer duration discrimination ability, that individual temporal ability was not influenced by non-temporal factors such as attention and motivational factors, and that inter-individual correlations in temporal discrimination ability for short and long durations were weak (see details below and Figure 6).
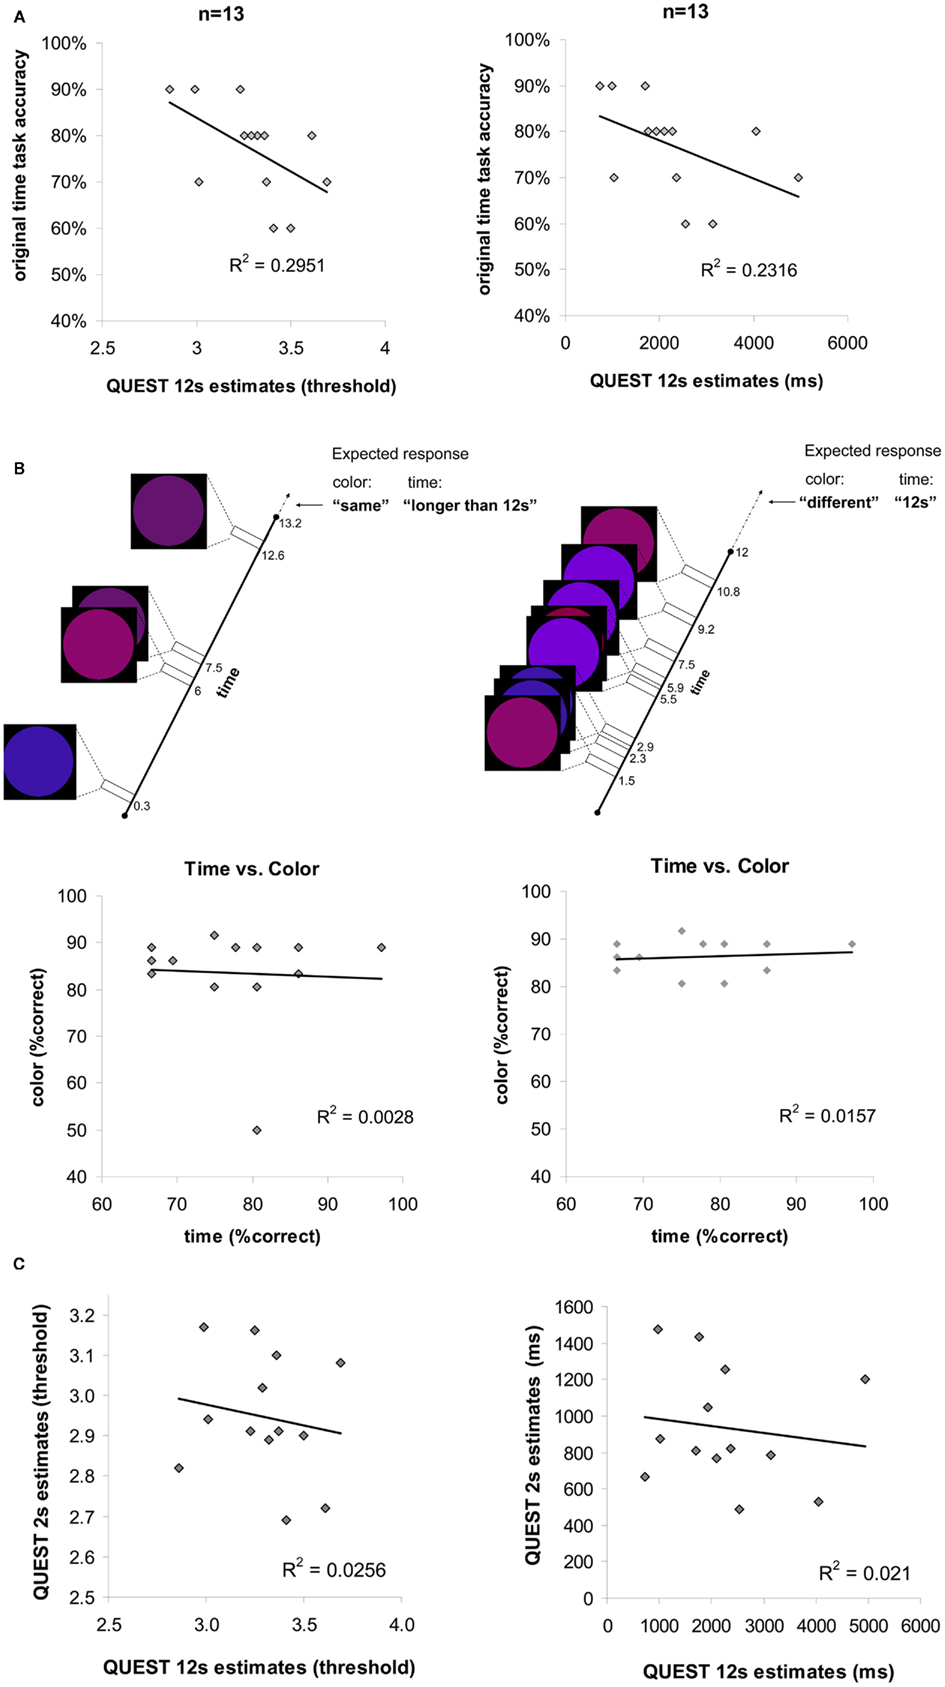
Figure 6. (A) Individual temporal discrimination ability for 12 s durations, as estimated by the original main experimental task and by a finer adaptive method (QUEST, see Materials and Methods). Each point in the scatter plots (left plot in threshold values, right plot same data in ms units) represents data from one participant (n = 13). The number of ms (right plot x axis) represents the duration difference needed for that individual to discriminate longer 12 s durations at a fixed accuracy level of 75%. Discrimination accuracy when the duration difference is fixed (discrimination of 12 from 13.2 s) is indicated on the y axis. The significant correlations found between these two measurements indicate on the reliability of the original main experimental task for estimating individual longer temporal discriminations ability. (B) Time discrimination performance vs. color discrimination performance: experimental design and results. Top: timeline and stimuli from two experimental trials in the experiment. Same paradigm was used for time discrimination task or color discrimination task (see Materials and Methods). The temporal task required discriminating between 12 and 13.2 s durations while ignoring the colored circles, the color task required discriminating between the colors of the last circle in the trial with the one preceding it (“same” or “different”). Expected responses according to the task are indicated on the top right corner. Both color and time task required attention and motivation throughout the task since the number of flashing circles and their appearances were unexpected [number of circles per trial varied across trials and stimulus appearances were asynchronous (different SOA)]. Bottom: correlation between individuals’ longer temporal duration discrimination performance and color discrimination performance is not significant. Each point in the scatter plots (left plot n = 13, right plot n = 12 without the outlier) represents one individual. (C) Correlation between shorter duration and longer duration discrimination abilities across all participants based on a finer adaptive QUEST procedure (see Materials and Methods). Each point in the scatter plots (left plot in threshold values, right plot same data in ms units) represents data from one participant. For shorter 2 s on y axis, and for longer 12 s on x axis, the number of ms (right plot) represents the duration difference needed for that individual to discriminate durations of that length at a fixed accuracy level of 75%. Thus, the duration difference for shorter durations does not correlate with the duration difference for longer durations, consistent with the results presented in Figure 2A bottom panels.
Structural Correlates of Temporal Discrimination Performance
We next examined whether the differences in temporal discrimination ability across individuals were reflected in the GM volume of any cortical regions. To address this question we used voxel-based morphometry analyses (Ashburner and Friston, 2000) of structural MRI images using individual performance on each of the four temporal discrimination conditions as regressors (see Materials and Methods for full details). We then used statistical contrasts (see Materials and Methods) to determine for each condition whether individual differences in behavior correlated with GM volume throughout the brain. Due to the exploratory nature of the analyses, we used a conservative statistical threshold corrected for multiple comparisons throughout the whole-brain.
Longer auditory duration discrimination (Aud12)
We found one large cluster (7118 mm3) in the posterior part of lateral sulcus where GM volume exhibited significant correlation [t(26) = 5.52, p(corr.) < 0.001, R = 0.74) with inter-individual variability in temporal discrimination performance (see Figure 3 bottom left, Table 1 for full loci details). Anatomically, this cluster stretched from the posterior segment of the lateral sulcus on its most medial (inner) aspect extending anteriorly onto both the inferior and superior banks of the lateral sulcus, into the circular insular sulcus on the inferior and superior segments. On the inferior bank of the lateral sulcus this cluster extended to and included the short insular gyrus and Heschl’s (transverse temporal) gyri, and on the superior bank it extended to and included the parietal and central/rolandic operculum (see Figure 4A). This cluster comprised primary auditory cortex (PAC/A1) structure TE1.1 (Morosan et al., 2001; Rademacher et al., 2001), and secondary somatosensory structures OP2–OP3 (Eickhoff et al., 2006a,b; see Figures 4A and 5A–C for more details). In addition the GM volumes of bilateral parahippocampal gyri were significantly negatively correlated [t(26) = 4.92, p(corr.) = 0.007, R = −0.70, t(26) = 4.63, p(corr.) = 0.048, R = −0.68 for right and left respectively, see Table 1 for full details] with individual differences in Aud12 performance. No other brain regions exhibited positive or negative correlation with inter-individual variability in performance in this condition (p > 0.05, whole-brain corrected).
Longer visual duration discrimination (Vis12)
We identified one large cluster (2467 mm3) in the posterior part of lateral sulcus anatomically extending into the right auditory and somatosensory cortices where GM volume positively and significantly correlated [t(26) = 4.71, p(corr.) = 0.008, R = 0.68] with inter-individual variability in temporal discrimination performance in the Vis12 condition. This region exhibited extensive overlap with the areas that correlated with individuals’ performance in the Aud12 condition [cf. Figure 3 bottom right and left (Aud12), and Figure 4B with Figure 4A (Aud12), see also Table 1]. It stretched from the posterior segment of the lateral sulcus on its most medial (inner) aspect extending anterior wise on both the inferior and superior banks of the lateral sulcus, into the posterior aspects of the circular insular sulcus (inferior and superior segments). On the inferior bank of the lateral sulcus this cluster extended to and included the short insular gyrus and Heschl’s (transverse temporal) gyri, and on the superior bank it included the parietal operculum, the posterior part of the circular insular sulcus, and then the anterior part of the circular insular sulcus without the middle part of it (see Figure 4B). This cluster comprised PAC/A1 structure TE1.1 (Morosan et al., 2001; Rademacher et al., 2001), and secondary somatosensory structures OP2–OP3 (Eickhoff et al., 2006a,b; see Figures 5A–C for more details), similar to the sensory structures revealed in Aud12 analysis. In addition, GM volume in the right parahippocampal region was significantly and negatively correlated [t(26) = 5.34, p(corr.) = 0.029, R = −0.72] with individuals’ ability to discriminate visually presented longer durations. Again, this overlapped with the areas identified as showing similar negative correlations with the longer auditory duration discrimination (cf. Figure 3 Vis12 and Aud12 ventral views, and see Table 1).
Shorter auditory duration discrimination (Aud2)
We found that only one region, in left extrastriate visual cortex (Figure 3; Table 1), where GM volume showed a significant positive correlation with individuals’ performance in the shorter auditory duration discrimination task [t(26) = 5.05, p(corr.) = 0.046, R = 0.71]. No other regions showed a positive or negative correlation between GM volume and duration discrimination performance of shorter auditory durations at the whole-brain corrected level of statistical significance (p < 0.05 corrected). For completeness, we examined the data at a more lenient threshold (p < 0.001 uncorrected) but this did not reveal any significant correlation between auditory or somatosensory cortex GM volume and shorter duration auditory temporal discrimination performance.
Shorter visual duration discrimination (Vis2)
At our conservative whole-brain corrected threshold, we did not identify any brain region that showed a positive (or negative) correlation between GM volume and individuals’ performance on shorter visual duration discriminations. For completeness, we also examined the data at a more lenient threshold (p < 0.001 uncorrected). This revealed a region in left extrastriate visual cortex (Figure 3; Table 1) where GM volume was positively correlated with performance [t(26) = 4.63, p(corr.) = 0.189, R = 0.68]. This area partially overlapped the left extrastriate locus whose GM volume correlated with shorter duration auditory discrimination performance (cf. Figure 3 Vis2 and Aud2, and see Table 1).
Reliability of Performance Measurements
To verify that the temporal discrimination ability we measured for the longer durations (discriminating between two fixed durations of 12 and 13.2 s) was an accurate and valid way to characterize individual differences in temporal judgments, we assessed test–retest reliability for individual performance. Test–retest reliability on a block to block basis was highly significant [blocks 1–2 and 1–3 correlations: Vis12: R2 > 0.397, t(29) > 4.37, p < 10−3; Aud12: R2 > 0.357, t(29) > 4.01, p < 10−3; Vis2: R2 > 0.201, t(29) > 2.7, p < 0.02; Aud2: R2 > 0.239, t > 3, p < 0.01].
In order to validate that the temporal discrimination measure was not too crude a measure for longer duration discrimination ability, we performed additional measurements to compare inter-individual variability in the original temporal discrimination estimates (12 vs. 13.2 s) to that for finer temporal estimates (see control experiments and Figure 6). Using an adaptive staircase method (QUEST, see Materials and Methods) we estimated the minimum duration difference enabling an individual to discriminate a 12 s stimulus presentation. We found that inter-individual variability in accuracy levels on the 12 vs. 13.2 s discrimination task (our original measurement) were significantly correlated with this duration difference measure [R2 = 0.2951, p = 0.028, t(11) = −2.15, see Figure 6A and Materials and Methods]. Thus, accuracy levels in our original task reliably predicted individual time increment discrimination ability for 12 s intervals.
To control for non-temporal factors that could underlie longer duration discrimination performance such as sustained attention ability or motivational factors, we further measured in a third behavioral experiment whether temporal estimation ability correlated with non-temporal color discrimination ability for the same physical stimuli while systematically manipulating task requirements (paradigm inspired by Coull et al., 2004; see Figure 6B and Materials and Methods for details). We deliberately ensured both temporal and non-temporal (color) tasks were of comparable difficulty and both required sustained attention during task performance. Consequently lack of association between individuals’ performance on temporal and color discrimination tasks would indicate that an individual’s longer duration discrimination performance was related to temporal estimation ability and not to other non-temporal factors. Consistent with this hypothesis, we found that there was no significant correlation between longer duration discrimination and color discrimination [R2 = 0.0028, p > 0.86, t(11) = −0.174, see Figure 6B and Materials and Methods). Thus, our behavioral results (Figure 2B, red and orange connections) suggest a common neural mechanism across sensory modalities underlying variability in temporal discrimination ability that does not reflect sustained attention or other non-temporal factors.
We further assessed whether the weaker correlations between the longer and shorter duration discrimination performance might have originated from factors such as the poorer performance or smaller variability in performance on shorter durations, from task differences, or since shorter and longer duration discriminations were not necessarily measured on the same session. To do this, we used the same adaptive staircase method (QUEST, see Materials and Methods) to estimate temporal difference discrimination for shorter intervals (2 s). Since the method was adaptive, it estimated an individual’s sensitivity for shorter (or longer, see above) durations without imposing fixed durations (as in our original task) that might have led to floor performance or enhanced task difficulty in the shorter duration conditions. We then examined the relationship between these finer estimations of individual sensitivities for longer and shorter durations. Consistent with our original analyses, individual sensitivities for longer and shorter durations were not significantly correlated [R2 = 0.021, p = 0.318, t(11) = −0.485, see Figure 6C and Materials and Methods]. Thus, it seems that individual temporal estimation ability is consistent across modalities, yet estimation of shorter durations of 2 s and longer durations of 12 s may rely on different underlying mechanisms (Fortin and Couture, 2002; Ulbrich et al., 2007).
Discussion
We examined whether the ability to estimate time for different supra-second durations or in different sensory modalities was associated with common mechanisms (Treisman, 1963; Treisman et al., 1990; Buonomano and Merzenich, 1995; Poppel, 1997; Rammsayer, 1999; Lewis and Miall, 2003; Mauk and Buonomano, 2004; Buhusi and Meck, 2005; Karmarkar and Buonomano, 2007; Bueti et al., 2008; Ivry and Schlerf, 2008; Vogel and Awh, 2008; Cui et al., 2009). Rather than discarding the differences that exist among individuals in their ability to estimate time, we used these individual differences to probe the underlying brain structure, reasoning that variability in time estimation would exhibit correlations with the GM volume of structures involved in such a process.
We found that the ability to estimate temporal durations was significantly correlated across input modalities (for either longer or shorter durations) suggesting a common neural mechanism associated with variability in time estimation across sensory modalities. For longer durations of 12 s we found that the structure (GM volume) of right auditory and somatosensory cortices, as well as parahippocampal gyri, predicted an individual’s ability to discriminate longer durations in both auditory and visual modalities.
For shorter duration discriminations, results were less consistent. The GM volume in left extrastriate cortex predicted inter-individual variability in the shorter auditory duration discriminations. As with longer duration discriminations, there was overlap of cortical structures showing an association with inter-individual variation in temporal discrimination in different modalities. However, the GM volume of extrastriate cortex was only associated with shorter duration visual discriminations at a lower (uncorrected) statistical threshold and did not reach our stringent (whole-brain corrected) levels of significance set for our exploratory study. This shortcoming could be due to lower performance levels in the shorter duration conditions and the smaller variability in performance compared to the longer duration conditions. Thus, we cannot conclude at this point whether inter-individual variability in short duration estimation is reflected in extrastriate cortex structure in a modality-specific manner or not. Further research should therefore seek to replicate these findings before advancing particular theoretical interpretations.
Our principal findings that the GM density of primary auditory and secondary somatosensory cortices reflected both auditory and visual longer duration discrimination performance are interesting because neither of these cortices typically responds to visual stimulation per se. This suggests that these regions are involved in timing-related functions independent of sensory modality beyond unimodal sensory processing. Such a notion is consistent with a growing body of evidence that early sensory areas, which are previously thought to be purely unimodal, play roles in multi-modal sensory processing. For example, although there is an evident tonotopic organization in PAC/A1, many multisensory factors influence processing in PAC/A1 (Ghazanfar and Schroeder, 2006). Moreover, in addition to a coarse somatotopic organization of secondary somatosensory cortex evident in OP1 and OP4 structures and to a minor extent in OP3 (Disbrow et al., 2000; Eickhoff et al., 2007), association and multi-modal integration functions have been proposed for human secondary somatosensory cortex (Robinson and Burton, 1980; Eickhoff et al., 2006a). The OP2 structure may participate in the vestibular cortical network (Eickhoff et al., 2006c), and a recent study shows that the accuracy of temporal perception over seconds correlates with the ability to estimate bodily interoceptive (heartbeat) perception. Interoceptive perception is associated with activity in lateral sulcus/insular cortex (Meissner and Wittmann, 2011). Here, we showed that temporal ability for longer durations was related to the GM volume of different sensory cortices, conceivably to provide a more precise sense of time from multiple sources. The modality-independent roles of these structures in temporal processing shed a new light on the functionality of these regions and support the idea that these cortices are not as modality-specific as previously considered.
Our finding that GM structure of parahippocampal gyrus was negatively correlated with temporal discrimination ability for longer durations is intriguing. Several studies show that hippocampal regions are associated with temporal processing. For example, lesions to hippocampal regions in rats lead to underestimation of time intervals, while lesions to frontal regions produce opposite effects (Meck, 1996). Lesions to rat hippocampus (but not frontal cortex), produces “temporal amnesia” to the working memory of a prolonged interval (Meck et al., 1984, 1987; Olton et al., 1987). A recent study shows that rat hippocampal firing patterns can predict elapsed time in the order of seconds with very high precision (Itskov et al., 2011). In humans, several lesion studies point to the involvement of temporal and middle temporal lesions in timing of supra-second durations (Vidalaki et al., 1999; Melgire et al., 2005). This suggests that hippocampal regions may be a source of activity that supports estimations of longer durations – a process that might conceivably be contributing to successful performance in our study in the longer duration discrimination tasks. Yet the negative correlations we find suggest that smaller GM volume in the parahippocampal gyri was associated with improved temporal ability for longer durations. Several studies suggest that the process of pruning (Goldin et al., 2001; Kantor and Kolodkin, 2003; Watts et al., 2003; Low and Cheng, 2006), where excessive neural connections are “diluted” in a regulated manner to achieve more efficient neural networks, occurs in the hippocampus (Gao et al., 1999; Bagri et al., 2003; Gogtay et al., 2004, 2006; Faulkner et al., 2007). These effects are attributed to the plasticity of the hippocampus following dynamic functions it serves such as memory and navigation. Thus, pruning processes to hippocampal structures that are related to temporal processing (Itskov et al., 2011) may underlie enhanced abilities for longer duration estimation.
Our findings also demonstrate that estimation of time is associated with local changes in brain structure. Several studies suggest that neural activity in the regions where we observed a correlation between brain structure and ability to discriminate time is related to time processing. fMRI signals in adjacent regions of cortex at coordinates overlapping with the areas of somatosensory and auditory cortices where we observed correlations between brain structure and discrimination ability selectively increase during the encoding of long duration intervals (~9–18 s), but not during either short interval encoding or reproduction of time intervals (Wittmann et al., 2010). Moreover, MEG signals in right auditory cortex and also in parahippocampal regions very similar to the regions where we found an association between structure and temporal discrimination performance, are associated with the encoding of temporal intervals. The activity of these regions is modulated according to the temporal metrics of the sequence (Fujioka et al., 2010). Furthermore, auditory cortex plays a causal role in time related processing as transcranial magnetic stimulation (TMS) applied to right auditory cortex impairs time related processing (Bueti et al., 2008; Bolognini et al., 2010) independent of input modality (Kanai et al., 2011). Taken together, our anatomical study goes beyond these purely functional studies to provide converging evidence for the involvement of primary auditory, secondary somatosensory and parahippocampal cortices in temporal aspects of sensory discrimination. It remains an open question whether the structural variability we found across participants is also associated with variability in activation of these regions.
Could these local changes in brain structure associated with individual time estimation ability for longer durations be attributed to a genetic origin? Recent studies show that individual’s veridical supra-second duration representation is influenced by genetic factors such as serotonin-related genes (Wackermann and Ehm, 2006; Sysoeva et al., 2010). Other studies provide evidence for genetic influence on brain structure (Baare et al., 2001; Thompson et al., 2001; Wright et al., 2002). Hence individual’s time estimation ability for supra-second duration could be driven by genetic factors, however this has to be tested directly in future studies.
One possible cognitive mechanism to account for our findings is that individual ability to successfully discriminate longer durations relies on one’s ability to maintain a consistent and stable rhythm over time, whether through counting, rehearsing a musical piece, or some other mental process. The right auditory and secondary somatosensory cortices and perhaps adjacent amodal association cortices as well as the parahippocampal regions could be orchestrating such rhythmic activity at various time scales (Ahissar and Vaadia, 1990; E. Ahissar, personal communication). Thus, we speculate the differences in the structure of the right auditory and secondary somatosensory cortices that exist between individuals may result in differences in the ability to maintain such internal rhythms.
Conclusion
Our study revealed a significant variability in individuals’ ability to discriminate supra-second durations, whether shorter or longer durations, and through different modalities. This variability was very consistent across modalities, suggesting a common neural mechanism for temporal discrimination across modalities. The neural structure of right sensory cortices including A1 and SII sub-structures was significantly and positively correlated with individual ability to discriminate longer durations regardless of whether provided through vision or audition. Our findings show that the amodal sense of time is reflected in brain structure, and interestingly in the brain structure of sensory cortices, suggesting that the roles of these sensory cortices extend beyond modality-specific processing into the temporal perception domain.
Conflict of Interest Statement
The authors declare that the research was conducted in the absence of any commercial or financial relationships that could be construed as a potential conflict of interest.
Acknowledgments
We thank Bahador Bahrami and Marieke Scholvinck for their comments. This work was supported by the Wellcome Trust (Geraint Rees), by a European Commission Marie-Curie fellowship FP7-236021 (Sharon Gilaie-Dotan), and the JSPS (Ryota Kanai). The Wellcome Trust Centre for Neuroimaging is supported by core funding from the Wellcome Trust 091593/Z/10/Z.
References
Ahissar, E., and Vaadia, E. (1990). Oscillatory activity of single units in a somatosensory cortex of an awake monkey and their possible role in texture analysis. Proc. Natl. Acad. Sci. U.S.A. 87, 8935–8939.
Ashburner, J., and Friston, K. J. (2000). Voxel-based morphometry – the methods. Neuroimage 11, 805–821.
Baare, W. F., Hulshoff Pol, H. E., Boomsma, D. I., Posthuma, D., de Geus, E. J., Schnack, H. G., van Haren, N. E., van Oel, C. J., and Kahn, R. S. (2001). Quantitative genetic modeling of variation in human brain morphology. Cereb. Cortex 11, 816–824.
Bagri, A., Cheng, H. J., Yaron, A., Pleasure, S. J., and Tessier-Lavigne, M. (2003). Stereotyped pruning of long hippocampal axon branches triggered by retraction inducers of the semaphorin family. Cell 113, 285–299.
Bolognini, N., Papagno, C., Moroni, D., and Maravita, A. (2010). Tactile temporal processing in the auditory cortex. J. Cogn. Neurosci. 22, 1201–1211.
Brown, S. W., Newcomb, D. C., and Kahrl, K. G. (1995). Temporal-signal detection and individual differences in timing. Perception 24, 525–538.
Bueti, D., van Dongen, E. V., and Walsh, V. (2008). The role of superior temporal cortex in auditory timing. PLoS ONE 3, e2481. doi: 10.1371/journal.pone.0002481
Buhusi, C. V., and Meck, W. H. (2005). What makes us tick? Functional and neural mechanisms of interval timing. Nat. Rev. Neurosci. 6, 755–765.
Buonomano, D. V., and Merzenich, M. M. (1995). Temporal information transformed into a spatial code by a neural network with realistic properties. Science 267, 1028–1030.
Coull, J. T., Vidal, F., Nazarian, B., and Macar, F. (2004). Functional anatomy of the attentional modulation of time estimation. Science 303, 1506–1508.
Cui, X., Stetson, C., Montague, P. R., and Eagleman, D. M. (2009). Ready…go: amplitude of the FMRI signal encodes expectation of cue arrival time. PLoS Biol. 7, e1000167. doi: 10.1371/journal.pbio.1000167
Disbrow, E., Roberts, T., and Krubitzer, L. (2000). Somatotopic organization of cortical fields in the lateral sulcus of Homo sapiens: evidence for SII and PV. J. Comp. Neurol. 418, 1–21.
Eickhoff, S. B., Amunts, K., Mohlberg, H., and Zilles, K. (2006a). The human parietal operculum. II. Stereotaxic maps and correlation with functional imaging results. Cereb. Cortex 16, 268–279.
Eickhoff, S. B., Schleicher, A., Zilles, K., and Amunts, K. (2006b). The human parietal operculum. I. Cytoarchitectonic mapping of subdivisions. Cereb. Cortex 16, 254–267.
Eickhoff, S. B., Weiss, P. H., Amunts, K., Fink, G. R., and Zilles, K. (2006c). Identifying human parieto-insular vestibular cortex using fMRI and cytoarchitectonic mapping. Hum. Brain Mapp. 27, 611–621.
Eickhoff, S. B., Grefkes, C., Zilles, K., and Fink, G. R. (2007). The somatotopic organization of cytoarchitectonic areas on the human parietal operculum. Cereb. Cortex 17, 1800–1811.
Faulkner, R. L., Low, L. K., and Cheng, H. J. (2007). Axon pruning in the developing vertebrate hippocampus. Dev. Neurosci. 29, 6–13.
Fleming, S. M., Weil, R. S., Nagy, Z., Dolan, R. J., and Rees, G. (2010). Relating introspective accuracy to individual differences in brain structure. Science 329, 1541–1543.
Fortin, C., and Couture, E. (2002). Short-term memory and time estimation: beyond the 2-second “critical” value. Can. J. Exp. Psychol. 56, 120–127.
Fujioka, T., Zendel, B. R., and Ross, B. (2010). Endogenous neuromagnetic activity for mental hierarchy of timing. J. Neurosci. 30, 3458–3466.
Gao, P. P., Yue, Y., Cerretti, D. P., Dreyfus, C., and Zhou, R. (1999). Ephrin-dependent growth and pruning of hippocampal axons. Proc. Natl. Acad. Sci. U.S.A. 96, 4073–4077.
Gaser, C., and Schlaug, G. (2003). Brain structures differ between musicians and non-musicians. J. Neurosci. 23, 9240–9245.
Ghazanfar, A. A., and Schroeder, C. E. (2006). Is neocortex essentially multisensory? Trends Cogn. Sci. (Regul. Ed.) 10, 278–285.
Gogtay, N., Giedd, J. N., Lusk, L., Hayashi, K. M., Greenstein, D., Vaituzis, A. C., Nugent, T. F. III, Herman, D. H., Clasen, L. S., Toga, A. W., Rapoport, J. L., and Thompson, P. M. (2004). Dynamic mapping of human cortical development during childhood through early adulthood. Proc. Natl. Acad. Sci. U.S.A. 101, 8174–8179.
Gogtay, N., Nugent, T. F. III, Herman, D. H., Ordonez, A., Greenstein, D., Hayashi, K. M., Clasen, L., Toga, A. W., Giedd, J. N., Rapoport, J. L., and Thompson, P. M. (2006). Dynamic mapping of normal human hippocampal development. Hippocampus 16, 664–672.
Goldin, M., Segal, M., and Avignone, E. (2001). Functional plasticity triggers formation and pruning of dendritic spines in cultured hippocampal networks. J. Neurosci. 21, 186–193.
Hayasaka, S., Phan, K. L., Liberzon, I., Worsley, K. J., and Nichols, T. E. (2004). Nonstationary cluster-size inference with random field and permutation methods. Neuroimage 22, 676–687.
Ilg, R., Wohlschlager, A. M., Gaser, C., Liebau, Y., Dauner, R., Woller, A., Zimmer, C., Zihl, J., and Muhlau, M. (2008). Gray matter increase induced by practice correlates with task-specific activation: a combined functional and morphometric magnetic resonance imaging study. J. Neurosci. 28, 4210–4215.
Itskov, V., Curto, C., Pastalkova, E., and Buzsaki, G. (2011). Cell assembly sequences arising from spike threshold adaptation keep track of time in the hippocampus. J. Neurosci. 31, 2828–2834.
Ivry, R. B., and Schlerf, J. E. (2008). Dedicated and intrinsic models of time perception. Trends Cogn. Sci. (Regul. Ed.) 12, 273–280.
Kanai, R., Bahrami, B., and Rees, G. (2010). Human parietal cortex structure predicts individual differences in perceptual rivalry. Curr. Biol. 20, 1626–1630.
Kanai, R., Lloyd, H., Bueti, D., and Walsh, V. (2011). Modality-independent role of the primary auditory cortex in time estimation. Exp. Brain Res. 209, 465–471.
Kanai, R., and Rees, G. (2011). The structural basis of inter-individual differences in human behaviour and cognition. Nat. Rev. Neurosci. 12, 231–242.
Kantor, D. B., and Kolodkin, A. L. (2003). Curbing the excesses of youth: molecular insights into axonal pruning. Neuron 38, 849–852.
Karmarkar, U. R., and Buonomano, D. V. (2007). Timing in the absence of clocks: encoding time in neural network states. Neuron 53, 427–438.
Lewis, P. A., and Miall, R. C. (2003). Distinct systems for automatic and cognitively controlled time measurement: evidence from neuroimaging. Curr. Opin. Neurobiol. 13, 250–255.
Low, L. K., and Cheng, H. J. (2006). Axon pruning: an essential step underlying the developmental plasticity of neuronal connections. Philos. Trans. R. Soc. Lond. B Biol. Sci. 361, 1531–1544.
Mauk, M. D., and Buonomano, D. V. (2004). The neural basis of temporal processing. Annu. Rev. Neurosci. 27, 307–340.
May, A., and Gaser, C. (2006). Magnetic resonance-based morphometry: a window into structural plasticity of the brain. Curr. Opin. Neurol. 19, 407–411.
Meck, W. H. (1996). Neuropharmacology of timing and time perception. Brain Res. Cogn. Brain Res. 3, 227–242.
Meck, W. H., Church, R. M., and Olton, D. S. (1984). Hippocampus, time, and memory. Behav. Neurosci. 98, 3–22.
Meck, W. H., Church, R. M., Wenk, G. L., and Olton, D. S. (1987). Nucleus basalis magnocellularis and medial septal area lesions differentially impair temporal memory. J. Neurosci. 7, 3505–3511.
Meissner, K., and Wittmann, M. (2011). Body signals, cardiac awareness, and the perception of time. Biol. Psychol. 86, 289–297.
Melgire, M., Ragot, R., Samson, S., Penney, T. B., Meck, W. H., and Pouthas, V. (2005). Auditory/visual duration bisection in patients with left or right medial-temporal lobe resection. Brain Cogn. 58, 119–124.
Morillon, B., Kell, C. A., and Giraud, A. L. (2009). Three stages and four neural systems in time estimation. J. Neurosci. 29, 14803–14811.
Morosan, P., Rademacher, J., Schleicher, A., Amunts, K., Schormann, T., and Zilles, K. (2001). Human primary auditory cortex: cytoarchitectonic subdivisions and mapping into a spatial reference system. Neuroimage 13, 684–701.
Olton, D. S., Meck, W. H., and Church, R. M. (1987). Separation of hippocampal and amygdaloid involvement in temporal memory dysfunctions. Brain Res. 404, 180–188.
Poppel, E. (1997). A hierarchical model of temporal perception. Trends Cogn. Sci. (Regul. Ed.) 1, 56–61.
Rademacher, J., Morosan, P., Schormann, T., Schleicher, A., Werner, C., Freund, H., and Zilles, K. (2001). Probabilistic mapping and volume measurement of human primary auditory cortex. Neuroimage 13, 669–683.
Rammsayer, T. H. (1999). Neuropharmacological evidence for different timing mechanisms in humans. Q. J. Exp. Psychol. B 52, 273–286.
Rao, S. M., Mayer, A. R., and Harrington, D. L. (2001). The evolution of brain activation during temporal processing. Nat. Neurosci. 4, 317–323.
Robinson, C. J., and Burton, H. (1980). Somatic submodality distribution within the second somatosensory (SII), 7b, retroinsular, postauditory, and granular insular cortical areas of M. fascicularis. J. Comp. Neurol. 192, 93–108.
Schwarzkopf, D. S., Song, C., and Rees, G. (2011). The surface area of human V1 predicts the subjective experience of object size. Nat. Neurosci. 14, 28–30.
Sysoeva, O. V., Tonevitsky, A. G., and Wackermann, J. (2010). Genetic determinants of time perception mediated by the serotonergic system. PLoS ONE 5, e12650. doi: 10.1371/journal.pone.0012650
Thompson, P. M., Cannon, T. D., Narr, K. L., van Erp, T., Poutanen, V. P., Huttunen, M., Lonnqvist, J., Standertskjold-Nordenstam, C. G., Kaprio, J., Khaledy, M., Dail, R., Zoumalan, C. I., and Toga, A. W. (2001). Genetic influences on brain structure. Nat. Neurosci. 4, 1253–1258.
Treisman, M. (1963). Temporal discrimination and the indifference interval. Implications for a model of the “internal clock.” Psychol. Monogr. 77, 1–31.
Treisman, M., Faulkner, A., Naish, P. L., and Brogan, D. (1990). The internal clock: evidence for a temporal oscillator underlying time perception with some estimates of its characteristic frequency. Perception 19, 705–743.
Ulbrich, P., Churan, J., Fink, M., and Wittmann, M. (2007). Temporal reproduction further evidence for two processes. Acta Psychol. 125, 51–65.
Vidalaki, V. N., Ho, M. Y., Bradshaw, C. M., and Szabadi, E. (1999). Interval timing performance in temporal lobe epilepsy: differences between patients with left and right hemisphere foci. Neuropsychologia 37, 1061–1070.
Vogel, E. K., and Awh, E. (2008). How to exploit diversity for scientific gain: using individual differences to constrain cognitive theory. Curr. Dir. Psychol. Sci. 17, 171–176.
Wackermann, J., and Ehm, W. (2006). The dual klepsydra model of internal time representation and time reproduction. J. Theor. Biol. 239, 482–493.
Watson, A. B., and Pelli, D. G. (1983). QUEST: a Bayesian adaptive psychometric method. Percept. Psychophys. 33, 113–120.
Watts, R. J., Hoopfer, E. D., and Luo, L. (2003). Axon pruning during Drosophila metamorphosis: evidence for local degeneration and requirement of the ubiquitin-proteasome system. Neuron 38, 871–885.
Wittmann, M., Simmons, A. N., Aron, J. L., and Paulus, M. P. (2010). Accumulation of neural activity in the posterior insula encodes the passage of time. Neuropsychologia 48, 3110–3120.
Worsley, K. J., Andermann, M., Koulis, T., MacDonald, D., and Evans, A. C. (1999). Detecting changes in nonisotropic images. Hum. Brain Mapp. 8, 98–101.
Keywords: individual differences, modality-independent, neural structure, supra-seconds time perception, VBM
Citation: Gilaie-Dotan S, Kanai R and Rees G (2011) Anatomy of human sensory cortices reflects inter-individual variability in time estimation. Front. Integr. Neurosci. 5:76. doi: 10.3389/fnint.2011.00076
Received: 23 October 2011; Accepted: 02 November 2011;
Published online: 21 November 2011.
Edited by:
Warren H. Meck, Duke University, USACopyright: © 2011 Gilaie-Dotan, Kanai and Rees. This is an open-access article subject to a non-exclusive license between the authors and Frontiers Media SA, which permits use, distribution and reproduction in other forums, provided the original authors and source are credited and other Frontiers conditions are complied with.
*Correspondence: Sharon Gilaie-Dotan, Institute of Cognitive Neuroscience and Wellcome Trust Centre for Neuroimaging, Alexandra House, 17 Queen Square, London WC1N 3AR, UK. e-mail: shagido@gmail.com; s.gilaie-dotan@ucl.ac.uk