Comparison of Sirtuin 3 Levels in ALS and Huntington’s Disease—Differential Effects in Human Tissue Samples vs. Transgenic Mouse Models
 Eva Buck1
  Hanna Bayer1 Katrin S. Lindenberg1 Johannes Hanselmann1 Noemi Pasquarelli1 Albert C. Ludolph1
  Patrick Weydt1,2* Anke Witting1
- 1Department of Neurology, Ulm University, Ulm, Germany
- 2Department of Neurodegenerative Disorders and Gerontopsychiatry, Bonn University, Bonn, Germany
Neurodegenerative diseases are characterized by distinct patterns of neuronal loss. In amyotrophic lateral sclerosis (ALS) upper and lower motoneurons degenerate whereas in Huntington’s disease (HD) medium spiny neurons in the striatum are preferentially affected. Despite these differences the pathophysiological mechanisms and risk factors are remarkably similar. In addition, non-neuronal features, such as weight loss implicate a dysregulation in energy metabolism. Mammalian sirtuins, especially the mitochondrial NAD+ dependent sirtuin 3 (SIRT3), regulate mitochondrial function and aging processes. SIRT3 expression depends on the activity of the metabolic master regulator peroxisome proliferator-activated receptor gamma coactivator 1-alpha (PGC-1α), a modifier of ALS and HD in patients and model organisms. This prompted us to systematically probe Sirt3 mRNA and protein levels in mouse models of ALS and HD and to correlate these with patient tissue levels. We found a selective reduction of Sirt3 mRNA levels and function in the cervical spinal cord of end-stage ALS mice (superoxide dismutase 1, SOD1G93A). In sharp contrast, a tendency to increased Sirt3 mRNA levels was found in the striatum in HD mice (R6/2). Cultured primary neurons express the highest levels of Sirt3 mRNA. In primary cells from PGC-1α knock-out (KO) mice the Sirt3 mRNA levels were highest in astrocytes. In human post mortem tissue increased mRNA and protein levels of Sirt3 were found in the spinal cord in ALS, while Sirt3 levels were unchanged in the human HD striatum. Based on these findings we conclude that SIRT3 mediates the different effects of PGC-1α during the course of transgenic (tg) ALS and HD and in the human conditions only partial aspects Sirt3 dysregulation manifest.
Introduction
Neurodegenerative diseases, including amyotrophic lateral sclerosis (ALS) and Huntington’s disease (HD) show distinct patterns of progressive neuronal cell loss. In ALS upper and lower motoneurons are lost, while in HD medium spiny neurons of the striatum are most prominently affected (Przedborski et al., 2003). Despite the differences in the vulnerable neuron populations, both diseases show similar cellular and molecular mechanisms including inflammation (Heneka et al., 2014), mitochondrial dysfunction (Carri et al., 2017; Polyzos and McMurray, 2017) and oxidative stress (Lin and Beal, 2006).
ALS and HD patients also show hypermetabolic features (Dupuis et al., 2004, 2011; Aziz et al., 2010; Tefera and Borges, 2017). These include loss of body weight, in spite of increased food intake (Djousse et al., 2002; Dupuis et al., 2011), and suggest an increase in energy expenditure (Dupuis et al., 2004, 2011; Aziz et al., 2008). The mitochondrial changes in ALS and HD are reminiscent of mitochondrial alterations during aging including the decreased capacity to cope with oxidative stress (Mecocci et al., 1993) and an increased rate of mitochondrial DNA (mtDNA) mutations (Lin and Beal, 2006).
Peroxisome proliferator-activated receptor gamma coactivator 1-alpha (PGC-1α) links mitochondrial and transcriptional dysfunction in aging and neurodegeneration (Rona-Voros and Weydt, 2010). PGC-1α is a disease modifier in human ALS and HD, and this effect is in part sex-dependent (Eschbach et al., 2013; Weydt et al., 2014). The underlying mechanisms are only beginning to be understood. Multiple promoters and alternative splicing of the Ppargc1a gene allow for a versatile regulation of the system (Martínez-Redondo et al., 2015). In ALS the situation is particularly complex, as different isoforms are affected differently in different tissues (Bayer et al., 2017). In ALS the canonical and central nervous system (CNS)-specific PGC-1α system is downregulated in disease relevant tissues of the SOD1(G93A) mouse model (Thau et al., 2012; Bayer et al., 2017). In HD both the canonical and CNS-specific PGC-1α signaling is inhibited (Cui et al., 2006; Weydt et al., 2006; Kim et al., 2010). In addition, PGC-1α knock-out (KO) mice show neurodegenerative changes in the striatum resembling HD pathology (Lin et al., 2004; Rona-Voros and Weydt, 2010). PGC-1α dysfunction also mediates pathological aging (Sahin and DePinho, 2012). In the brain PGC-1α counteracts oxidative stress and protein aggregation (Tsunemi et al., 2012; Bayer et al., 2017). At the transcriptional level PGC-1α regulates the expression of sirtuin 3 (SIRT3), itself an important mitochondrial regulatory protein, via the estrogen related receptor alpha (ERRα; Zhang et al., 2016).
Mitochondrial sirtuins, especially SIRT3, link aging and mitochondrial function. The deacetylase SIRT3 is one of the seven mammalian sirtuins, localized to the mitochondria (Michishita et al., 2005). SIRT3 regulates mitochondrial reactive oxygen species (ROS) levels by deacetylating and activating the superoxide dismutase 2 (SOD2; Qiu et al., 2010; Tao et al., 2010; Chen et al., 2011). SIRT3 is also emerging as a regulator of key mitochondrial pathways (Lombard et al., 2007; Bause and Haigis, 2013) such as fatty acid oxidation (Hirschey et al., 2010), mitochondrial dynamics (Samant et al., 2014) and glucose utilization (Huynh et al., 2015).
Inflammatory processes in human macrophages are also mediated by SIRT3 (Traba et al., 2015) and inflammation is another shared feature of neurodegenerative diseases, including ALS and HD (Heneka et al., 2014). Inflammation is sensitive to metabolic changes, for example in macrophages, when aerobic glycolysis enables the secretory and respiratory bursts (Newsholme et al., 1986; Chawla et al., 2011). Furthermore, dysfunctional mitochondria result in an inhibition of the anti-inflammatory M2 response of microglia (Ferger et al., 2010).
The aim of this study was to investigate SIRT3 expression in ALS and HD. In both diseases SIRT3 expression and function was investigated in the CNS of mouse models of ALS (SOD1(G93A)) and HD (R6/2) and in human post mortem CNS tissue.
Materials and Methods
Human Biomaterial
Human biomaterial was handled according to appropriate approval and procedures. Autopsy material was obtained from the New York Brain Bank (Dr. Vonsattel) and the local brain bank with informed written consent and approved by the national medical ethical review boards in accordance with the world medical association Declaration of Helsinki. Clinical data of ALS and HD autopsy material is provided, showing the age, post mortem time and gender (Supplementary Table S1). Tissues of ALS patients derived from end-stage patients. One sample carried a SOD1 mutation but single nucleotide polymorphisms (SNPs) in the PGC-1α locus were not analyzed. The neuropathological stage of the HD autopsy samples included stage 1–4 cases with a mean of 2.9 (SD ± 0.9).
Mouse Models
The SOD1 transgenic (tg) B6SJL-Tg(SOD1*G93A)1Gur/J mouse model for ALS, the PGC-1α KO B6.129-Ppargc1atm1Brsp/J mouse model, the R6/2 HD mouse model B6CBATg(HDexon1)62Gpb/1J and the C57BL/6J mouse were used in this study. All mice were purchased from The Jackson Laboratory (USA). Only male mice were used for the experiments. Mice were bred under approved conditions of the animal facility of Ulm University and the Regierungspräsidium Tübingen (Reg. C. 0177). After 60 days (pre-onset), 100 days (onset) and about 130 days (end-stage) SOD1(G93A) tg and wild type (wt) littermates were sacrificed. End-stage was determined as either the inability to rise immediately after being placed on the side or as a weight loss of more than 20% (in respect to the highest body weight before onset of symptoms), defined by the Animal Ethics committee of the Regional Steering Committee Tübingen. PGC-1α KO mice were sacrificed at 90 days of age. R6/2 mice were used for experiments at the age of 30 days, 60 days and 90 days. Natively frozen tissue of male SIRT3 KO mice (129-Sirt3tm1.1Fwa/J) with the age of 30–60 days was obtained from the Jackson Laboratory (Bar Harbor, ME, USA).
Genotyping of the SOD1(G93A) and PGC-1α KO mice was performed according to the Jackson Laboratory standard PCR protocol1. R6/2 mice were genotyped as described previously (Mangiarini et al., 1996).
Primary Cell Culture
Primary cells were prepared from C57BL/6J mice, B6SJL-Tg(SOD1*G93A)1Gur/J mice and B6.129-Ppargc1atm1Brsp/J mice. Primary cultures of oligodendrocyte precursor cells (P0–2 mice) were prepared according to a protocol published previously (O’Meara et al., 2011). Neurons (E15), microglia (P0–5) and astrocytes (P0–5) were prepared as previously described (Wiesner et al., 2013). Substances and solutions were from Gibco™ or Sigma-Aldrich. In brief for neurons, astrocytes and microglia, forebrains were digested and dissociated. All cells were seeded in supplemented dulbecco’s modified eagle medium (DMEM; #31966). Neurons grew on 6-well plates with 6 × 10⁵ cells per well. Media was exchanged to supplemented Neurobasal (#21103) at day 1.5 at day 7. Neurons were stimulated after 14 days in vitro. After 7–10 days in culture, microglia were seeded on 6-well plates with 6 × 10⁵ cells per well for stimulation. Astrocytes were seeded on 6-well plates with 1 × 10⁵ cells per well for stimulation.
Cell Lines
The murine neuroblastoma cell line Neuro-2a (DSMZ, #ACC148) grew in DMEM (#31966) supplemented with 10% heat-inactivated feta bovine serum (FBS), 100 U/ml penicillin and 100 μg/ml streptomycin.
Luciferase Assay
For luciferase reporter assays Neuro-2a cells were seeded at a density of 10,000 cells per well of a poly-L-ornithine coated 96-well plate (#655098 Greiner, Frickenhausen, Germany) 24 h prior to lipofectamine transfection in DMEM (#31966) supplemented with 10% heat-inactivated FBS, 100 U/ml penicillin and 100 μg/ml streptomycin. The plasmid containing a firefly luciferase gene under the control of the SIRT3 promoter was generously provided by Marcia Haigis (Harvard Medical School, Boston, MA, USA; Satterstrom and Haigis, 2014). Cells were transfected with the renilla containing plasmid for normalization of transfection efficiency and the SIRT3-firefly construct. In addition, different isoforms of PGC-1α on a pCI backbone were added including canonical wt PGC-1α, the brain specific B4-PGC-1α or the brain specific B5-PGC-1α plasmid as described previously (Bayer et al., 2017). The PGC-1α constructs were generously provided by Wolfang Patsch. The Dual Glo luciferase assay (E2940, Promega, Madison, WI, USA) was performed 48 h after transfection in accordance with the manufacturer’s instruction. All luciferase experiments were measured in triplicates (#2030 VICTOR™ X3, Perkin Elmer, Waltham, MA, USA). The relative light units (RLU) measured of the firefly activity were normalized to the RLU of the renilla and shown in percent of the canonical PGC-1α.
qPCR
RNA was isolated according to the manufacturer’s protocol from tissue samples (RNeasy Plus Universal Mini Kit, Qiagen, Venlo, Netherlands) and cell pellets (RNeasy Plus Mini kit, Qiagen, Venlo, Netherlands), whereas a the RNeasy Plus Micro kit (#73404, Qiagen, Venlo, Netherlands) was used for cell numbers below 5 × 10⁵, including stimulated microglia and neurons. One microgram of RNA was transcribed to cDNA using the iScript cDNA synthesis kit (Bio-Rad, Hercules, CA, USA). The quantitative real-time PCR (qPCR) was performed in duplicates on a CFX348 Touch Real-Time Detection System with iQ™SYBR® Green Supermix (Bio-Rad, Hercules, CA, USA). A standard curve was determined for every target to analyze the primer efficiency. The program consisted of the following steps: 95°C for 3 min, 40 cycles at 95°C for 15 s and a primer specific annealing temperature for 15 s, finally a 60°C to 95°C melting curve at increments with steps of 0.5°C every 5 s was determined. Data was analyzed by the Bio-Rad CFX manager (Bio-Rad, Hercules, CA, USA) software. At least two reference genes with a stable expression (mean CV <0.25, mean M value <0.5) were necessary for data analysis. Primer sequences of the targets examined and the reference genes used are indicated in Supplementary Table S2 for murine targets and in Supplementary Table S3 for human targets.
Mitochondrial DNA Copy Number
Genomic and mtDNA were isolated from cell pellets with the Puregene Core Kit B (1042608, Qiagen, Venlo, Netherlands) according to the manufacturer’s instructions. The levels of the nuclear encoded single copy gene beta-2 microglobulin (B2M) and the stable region of the mitochondrial genome, the displacement loop (Dloop) were determined in triplicates by qPCR. 8 ng DNA were used per sample in a reaction mix, including iQ™SYBR® Green Supermix (Bio-Rad, Hercules, CA, USA), the respective primers (Supplementary Table S4) and water. The program run for 10 min at 95°C, 40 cycles of 10 s at 95°C, 15 s at 61°C, 20 s at 72°C, finally a 60–95°C melting curve was determined by increments of 1°C every 5 s (Hering et al., 2015). The ratio of the mitochondrial to half of the nuclear DNA copy number represents the relative mtDNA abundance.
Western Blot
Lysates for western blot were prepared in RIPA (150 mM NaCl, 50 mM tris pH 7–8, 2% NP-40, 1% Na-Deoxycholat, 0.2% SDS) and protein concentration was determined using the bicinchoninic acid (BCA) Protein Assay Kit (BCA1, B9643). The appropriate amount of protein was boiled for 10 min at 95°C in Laemmli buffer (62.5 mM tris pH 6.8, 2% SDS, 10% glycerol, 0.002% bromphenol blue, 5% β-mercaptoethanol). Samples were separated on a 13% acrylamide gel and wet blotted on a polyvinylidene fluoride (PVDF) membrane. After protein transfer all proteins were stained by MemCode (24585, Thermo Fisher Scientific, Waltham, MA, USA) as loading control and reference for analysis. Primary antibodies against SIRT3 (#5490, Cell signaling, Danvers, MA, USA), SOD2 (ab13533, abcam, Cambridge, UK), SOD2 Ac-K122 (generously provided by David R. Gius, Robert H Lurie Medical Research Center, Chicago, IL, USA) and citrate synthase (CS; ab129095, abcam, Cambridge, UK) were applied to the membrane in 3% bovine serum albumin. Respective horseradish peroxidase (HRP) conjugated secondary antibodies (goat anti mouse HRP conjugated, 172–1011; goat anti rabbit HRP conjugated, 172–1019; Bio-Rad, Hercules, CA, USA) were used and the chemiluminescent signal was detected with Luminata Forte Western HRP substrate (WBLUF0500, Merck Millipore, Billerica, MA, USA) using the LAS (GE Healthcare, Chicago, IL, USA).
Statistical Analysis
Statistical analysis of the data was performed using GraphPad prism 6. Two samples were compared for statistical significance by the unpaired student’s t-test for normally distributed data, which was tested by the Kolmogorov-Smirnow test. For small sample sizes and non Gaussian distributed data the nonparametric Mann-Whitney test was applied to compare two samples. For comparison of a group of samples the one-way ANOVA test was chosen with the Tukey’s multiple comparison test as parametric test and the Kruskal-Wallis test followed by Dunn’s correction as posttest was chosen for nonparametric data. To compare several groups the two-way ANOVA test with Tukey’s posttest for multiple comparison was chosen for the comparison of different genotypes and ages. To compare either differences between the genotypes or ages, the two-way ANOVA analysis was followed by Sidak’s multiple comparison test. Significance is indicated by ns = P > 0.05, *P ≤ 0.05, **P ≤ 0.01, ***P ≤ 0.001, ****P ≤ 0.0001. Data are shown as mean ± SEM.
Results
Sirt3 Levels Decrease Specifically in Affected Brain Regions of the ALS SOD1(G93A) Mouse Model
First we measured Sirt3 mRNA and protein levels, in informative brain regions of wt mice. These were particularly high in the brain stem and spinal cord, two regions prominently affected in ALS (Figures 1A,D, Supplementary Figure 5). In contrast, sirtuin 4 (Sirt4) mRNA levels were equally expressed across the different brain regions (Figure 1B), while sirtuin 5 (Sirt5) mRNA expression showed a region specific distribution similar to Sirt3 (Figure 1C).
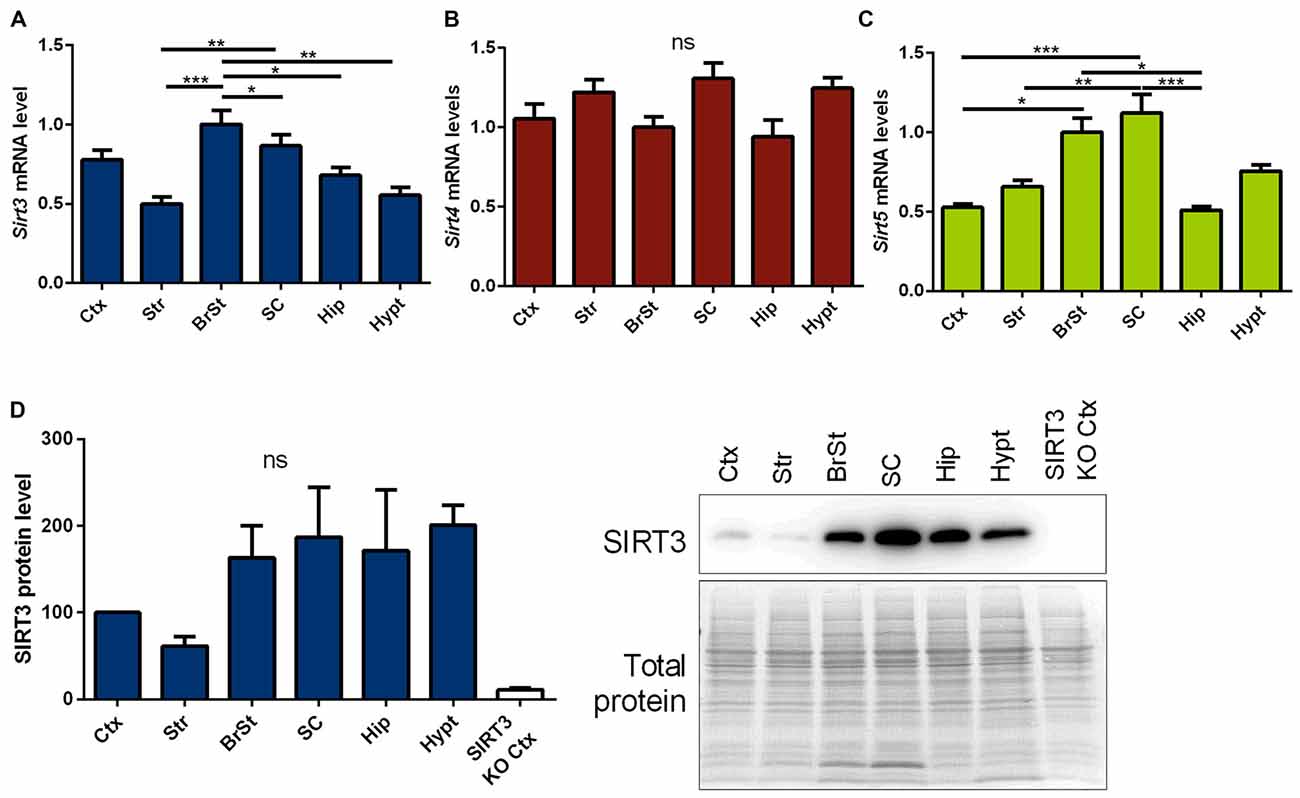
Figure 1. Distribution of mitochondrial sirtuins in different regions of the murine central nervous system (CNS). Cortex (Ctx), striatum (Str), brain stem (BrSt), spinal cord (SC), hippocampus (Hip) and hypothalamus (hypt) of 60 day old B6SJL mice were compared according to their sirtuin 3 (Sirt3) (A), sirtuin 4 (Sirt4) (B) and sirtuin 5 (Sirt5) (C) mRNA levels. mRNA levels were quantified by quantitative real-time PCR (qPCR) and normalized to TATA box binding protein (Tbp) and RNA polymerase 2 (Polr2a). Data are shown relative to BrSt levels (n = 5–6). One-way ANOVA was used for statistical analysis followed by Tukey’s multiple comparison test. (D) The tissue comparison was performed on SIRT3 protein level as well using 100 day old B6SJL mice, including cortex of SIRT3 knock-out (KO; 129-Sirt3tm1.1Fwa/J) mice (n = 3–6). Protein levels were normalized to total protein amount determined by MemCode staining. The nonparametric Kruskal-Wallis test was used followed by Dunn’s correction. Data are presented as mean ± SEM.ns = P > 0.05, *P ≤ 0.05, **P ≤ 0.01, ***P ≤ 0.001.
In a next step, mRNA levels of mitochondrial sirtuins in the spinal cord and brain stem were investigated during the disease progression in SOD1(G93A) mice. In end-stage mice Sirt3 mRNA levels were significantly decreased in the spinal cord (Figure 2A) and brain stem (Figure 2B) compared to wt mice. In unaffected tissues of the CNS such as the hippocampus Sirt3 mRNA levels did not change (Figure 2C). The decrease in Sirt3 mRNA levels in the affected tissue was specific as the expression of the other mitochondrial sirtuins did not change during the disease progression, except for Sirt5 mRNA levels in the brain stem (Supplementary Table S5).
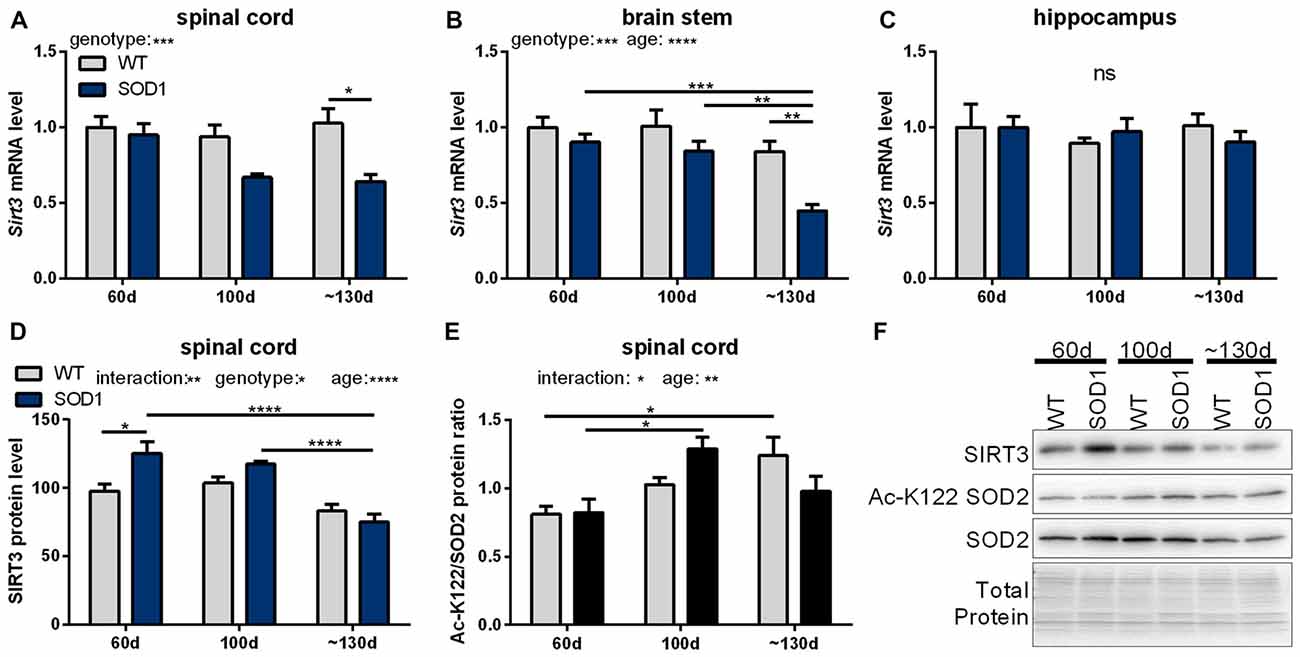
Figure 2. Sirtuin 3 (SIRT3) levels and function in SOD1(G93A) mice decrease in affected tissues during the course of disease. Sirt3 mRNA levels were determined in B6SJL-Tg(SOD1*G93A)1Gur/J (SOD1(G93A)) mice during the course of disease at 60 days (preonset), 100 days (onset) and at about 130 days (endstage) in the disease affected brain regions spinal cord (A), the brain stem (B) and the control region hippocampus (C), n = 5–8. mRNA levels were quantified by qPCR and normalized to TATA box binding protein (Tbp) and RNA polymerase 2 (Polr2a) in (A), to β-actin (Actb) and ribosomal protein large P0 (Rplp0) in (B) and to Tbp, Polr2a and Actb in (C), relative to mean of wild type (wt) 60 old mice. Protein levels of SIRT3 decreased in SOD1(G93A) mice with age in the spinal cord (D). SIRT3 function was determined by the acetylation status of lysine 122 (K122) of the superoxide dismutase 2 (SOD2), which is deacetylated by SIRT3. A high ratio of the acetylated SOD2 levels to the total SOD2 amount indicates decreased SIRT3 activity (E), n = 6. Protein levels were measured by western blot and normalized to total protein amount determined by MemCode staining. Representative bands are shown in (F). The grouped data was analyzed using the two-way ANOVA test followed by Tukey’s multiple comparison test. Data are presented as mean ± SEM. ns = P > 0.05, *P ≤ 0.05, **P ≤ 0.01, ***P ≤ 0.001, ****P ≤ 0.0001.
Protein levels of SIRT3 were determined in tissue homogenates of the spinal cord of SOD1(G93A) animals. In 60 days old mice SIRT3 protein levels were higher in SOD1(G93A) tg animals compared to wt littermates (Figure 2D). SIRT3 protein levels decreased in the spinal cord of SOD1(G93A) tg animals in an age-dependent manner, dropping to wt levels at endstage (Figure 2D). One of the targets of SIRT3 is the ROS detoxifying enzyme SOD2, which is deacetylated by SIRT3 on lysine residue 122 and thereby activated (Tao et al., 2010). To investigate the function of SIRT3, we quantified the acetylation status of SOD2 by an acetylation specific antibody against acetylated lysine 122 (K122) of SOD2. The ratio of the acetylated to total SOD2 in the spinal cord of SOD1(G93A) tg mice and in littermate controls increased with time indicating a general age dependent decline of SIRT3 activity (Figure 2E). In SOD1(G93A) mice this age dependent decline in SIRT3 function was accelerated. Of note, we detected decreased protein levels of SOD2 in the spinal cord of diseased SOD1(G93A) tg animals (Figure 2F, Supplementary Figure 6).
Sirt3 Levels Are Highest in Neurons Independent of the SOD1(G93A) Mutation Status
Next we addressed whether the reduced SIRT3 expression is due to the loss of neurons. To answer this question we characterized the mitochondrial sirtuins in primary neurons and glia cells. All mitochondrial sirtuin mRNA levels were highest in neurons, and second highest in astrocytes (Figures 3A–C). The lowest levels of mitochondrial sirtuins were found in microglia and oligodendrocytes (Figures 3A–C). This result was confirmed on protein level for SIRT3 (Figure 3D, Supplementary Figure 7). These results were obtained by analyzing the SIRT3 band at a height of 28 kDa, which is represented by the lower band on the membranes. For astrocytes an additional band was obtained at about 36 kDa. The high levels of mitochondrial sirtuins in neurons could be either due to an elevated mitochondrial mass or due to an increased number of mitochondrial sirtuins per mitochondrial mass. We analyzed the expression of SIRT3 in relation to the mitochondrial mass by quantifying the mitochondrial matrix protein CS and the relative mtDNA abundance. CS protein levels were highest in neurons compared to other cell types (Supplementary Figure S1A), arguing for an increased mitochondrial mass in neurons. The relative mtDNA abundance also indicated high levels of mitochondrial mass in neurons, but the levels were also elevated in astrocytes (Supplementary Figure S1B). The ratio of SIRT3 protein levels per CS protein level showed a significantly increased ratio for neurons (Supplementary Figure S1C), indicating that neurons show both, increased mitochondrial mass and increased levels of mitochondrial sirtuins per mitochondrial mass. The ratio of SIRT3 protein levels per relative mtDNA abundance supported highest levels for SIRT3 per mitochondrion in neurons, but significance was reached only compared to astrocytes (Supplementary Figure S1D). We next investigated whether the SOD1 mutation has a direct effect on the Sirt3 mRNA expression. Examination of different primary cultured cell types derived from SOD1(G93A) tg and wt animals did not show any differences according to the genotypes (Supplementary Figures S2A–D).
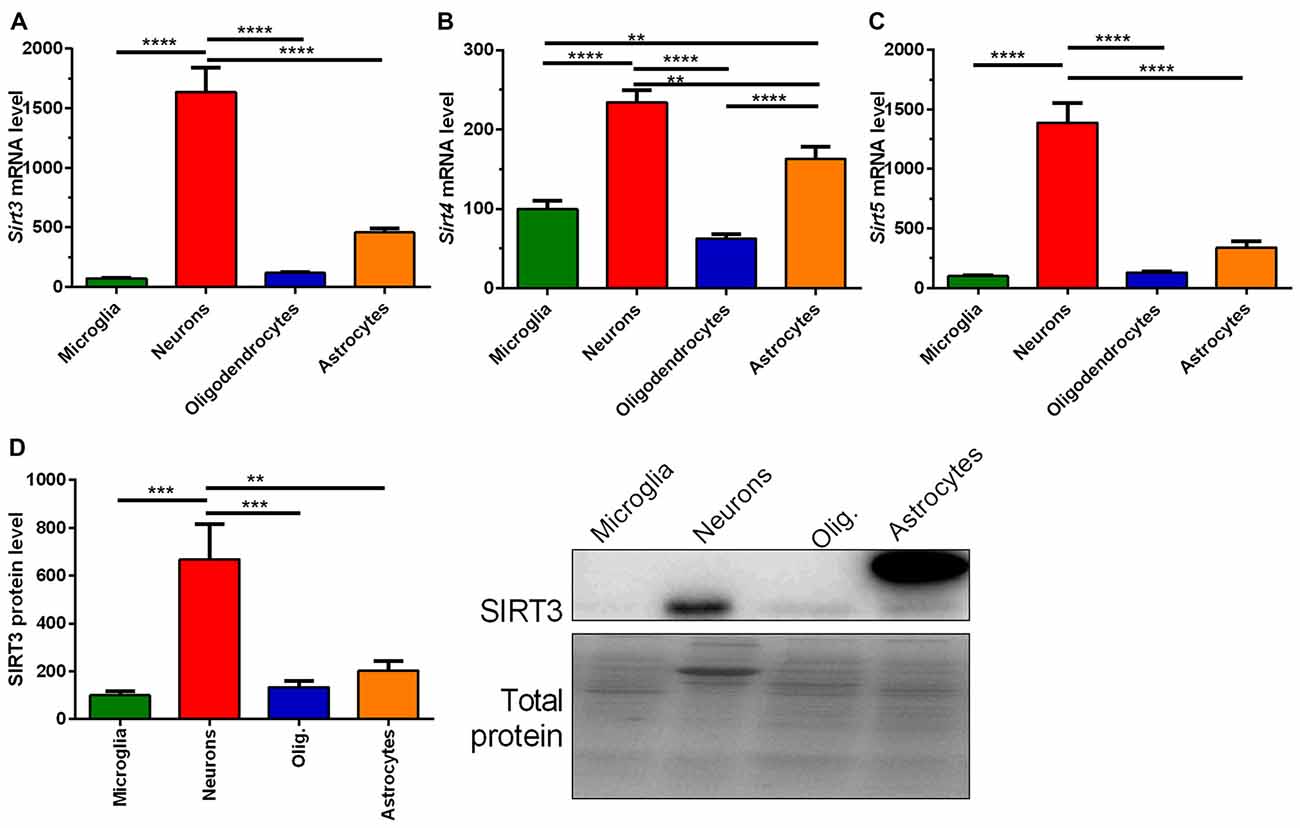
Figure 3. Mitochondrial sirtuin levels are highest in primary cultured neurons compared to microglia, astrocytes and oligodendrocytes. mRNA levels of Sirt3 (A), Sirt4 (B) and Sirt5 (C) were determined in primary cultured microglia, neurons, oligodendrocytes and astrocytes of C57BL/6J mice using qPCR. Data was normalized to TATA box binding protein (Tbp) and RNA polymerase 2 (Polr2a). Protein levels of SIRT3 were determined by western blot (D). Protein data was normalized to the total protein amount determined by MemCode staining. Data were analyzed by the one-way ANOVA followed by Tukey’s multiple comparison test, n = 5–8. Data are shown as mean ± SEM. ns = P > 0.05, **P ≤ 0.01, ***P ≤ 0.001, ****P ≤ 0.0001.
Inflammatory Stimulation with LPS Reduces Mitochondrial Sirtuin Levels in Glia Cells
Inflammatory stimuli affect SIRT3 expression in macrophages (Liu et al., 2015; Traba et al., 2015). As inflammatory responses are an integral part of neurodegenerative diseases, we investigated their effect on mitochondrial sirtuin expression in microglia cells and astrocytes. In primary microglia lipopolysaccharide (LPS) stimulation decreased the mRNA expression of all investigated mitochondrial sirtuins (Figures 4A,C,E). The same treatment on astrocytes did not have any effect on the sirtuin expression (Figures 4B,D,F). The protein levels in both cell types were overall more variable and showed trend towards an increase in microglia cells, but did not formally reach statistical significance (Figures 4G,H, Supplementary Figures 8, 9). The SOD1(G93A) mutation had no effect on the LPS induced reduction of mitochondrial sirtuin levels in primary microglia cells (Supplementary Figures S3A–C).
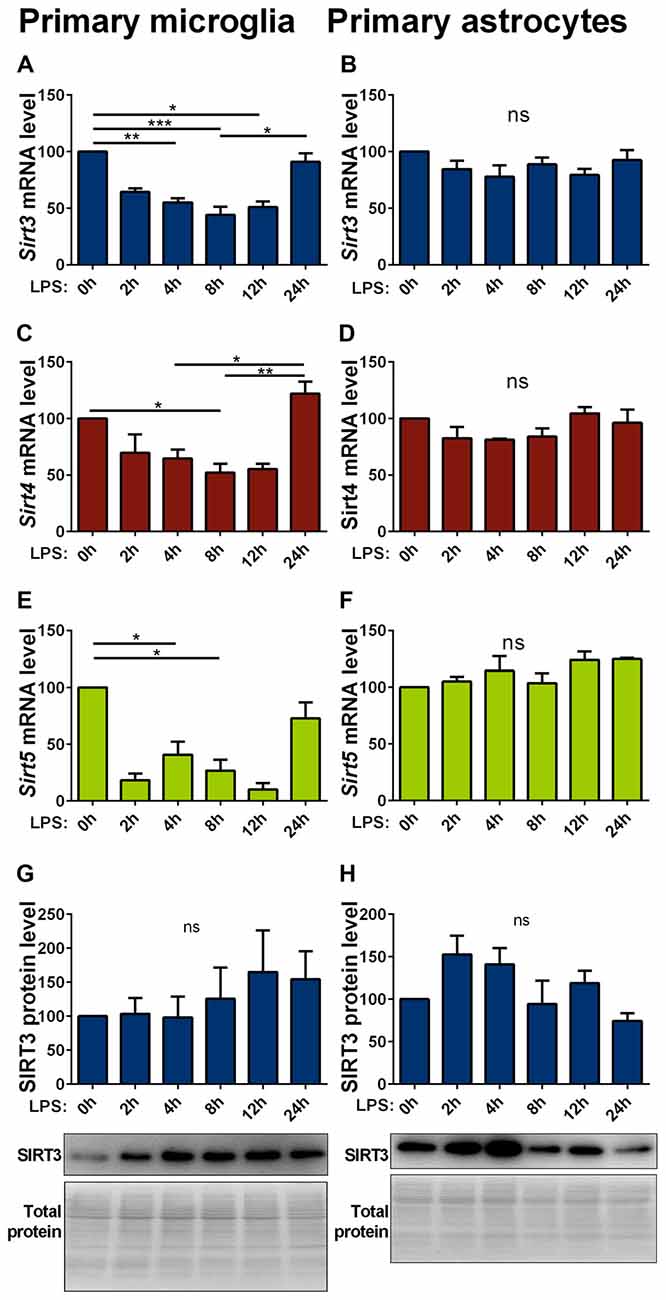
Figure 4. Lipopolysaccharide (LPS) stimulation decreases Sirt3 mRNA levels in primary cultured microglia but not in astrocytes. Cultured primary microglia (A,C,E,G) and astrocytes (B,D,F,H) were treated with 1 μg/ml LPS for 0, 2, 4, 8, 12 and 24 h. Sirt3 (A, B), Sirt4 (C,D) and Sirt5 (E,F) mRNA levels were determined by qPCR and normalized to TATA box binding protein (Tbp), RNA polymerase 2 (Polr2a) for microglia and additionally to β-actin (Actb) for astrocytes. SIRT3 protein levels were determined by western blot and normalized to the total protein amount determined by MemCode staining (G,H). Data were normalized to the untreated control and analyzed by the nonparametric Kruskal-Wallis test, followed by Dunn’s multiple comparison test with n = 2–8 for microglia and n = 3–4 for astorcytes. Data are shown as mean ± SEM. ns = P > 0.05, *P ≤ 0.05, **P ≤ 0.01, ***P ≤ 0.001.
PGC-1α Changes the Cellular Expression Pattern of Sirt3
The PGC-1α system is closely linked to the sirtuin system (Canto and Auwerx, 2009; Kong et al., 2010). We therefore quantified the mRNA and protein levels of mitochondrial sirtuins in CNS tissue of PGC-1α wt and KO mice. We found a trend towards decreased levels of Sirt3, 4 and 5 mRNA and SIRT3 protein in the spinal cord of PGC-1α KO mice compared to wt littermates (Figures 5A,C and Supplementary Figures S4A,C). In the cortex of PGC-1α KO mice Sirt3 (Supplementary Figures 4A,C, 10) mRNA and SIRT3 protein levels also showed a decreasing trend, without reaching statistical significance (Figures 5B,D, Supplementary Figure 11), whereas Sirt4 and Sirt5 mRNA levels were evenly distributed (Supplementary Figures S4B,D).
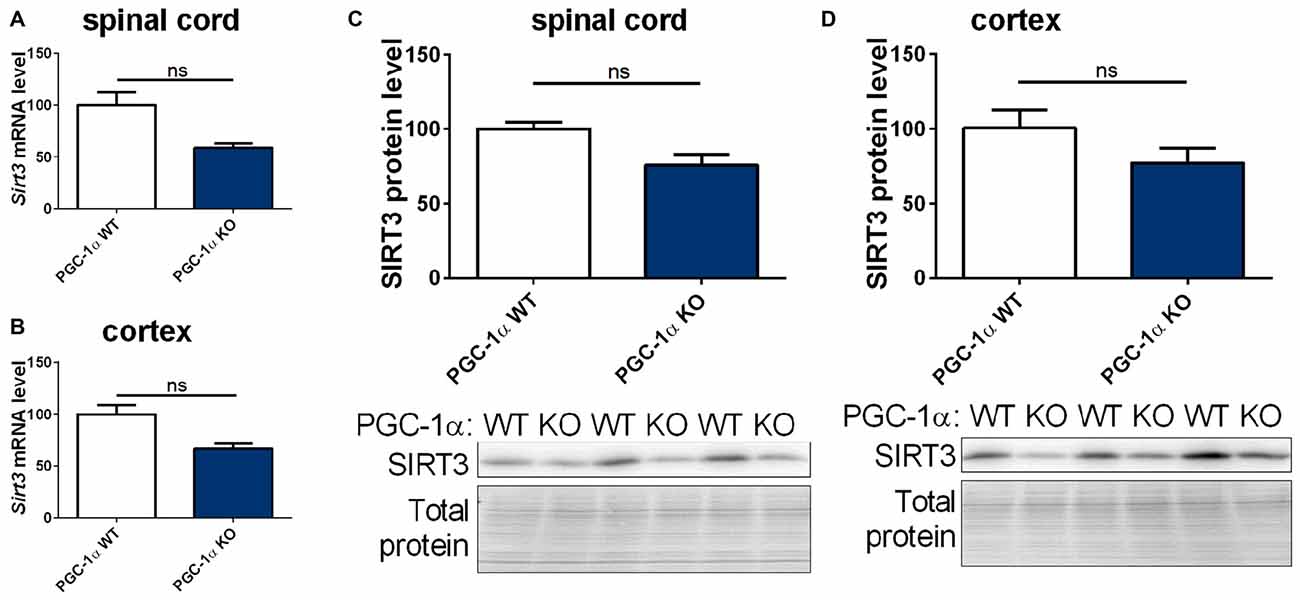
Figure 5. Sirt3 levels show a decreasing tendency in the spinal cord and cortex of peroxisome proliferative-activated receptor gamma coactivator 1 alpha (PGC-1α) KO mice. Sirt3 (A,B) mRNA levels were determined by qPCR in the spinal cord (A) and cortex (B) of 90 day old B6.129-Ppargc1atm1Brsp/J (PGC-1α KO) mice and respective controls. mRNA levels were normalized to TATA box binding protein (Tbp), RNA polymerase 2 (Polr2a) and β-actin (Actb). Levels are shown in percent of the wt control. Protein levels of SIRT3 were determined in the spinal cord (C) and cotex (D) by western blot and data were normalized to total protein amount determined by MemCode staining. The nonparametric Mann-Whitney test was used for analysis with n = 3. Data are shown as mean ± SEM.
To assess these differences at the cell-type level, we investigated the expression levels of mitochondrial sirtuins in primary neurons and different glial types isolated from PGC-1α KO mice. The distribution of Sirt3 mRNA levels in the different cell types of PGC-1α KO mice differed significantly from wt cells. In PGC-1α KO cells the Sirt3 mRNA levels were now highest in astrocytes, while at the same time the Sirt3 level in neurons of PGC-1α KO mice were lower compared to wt (Figure 6A). Sirt4 mRNA levels were higher in PGC-1α KO cells of microglia and astrocytes (Figure 6B). Examination of Sirt5 mRNA levels showed significantly lower levels in PGC-1α KO compared to wt neurons (Figure 6C).
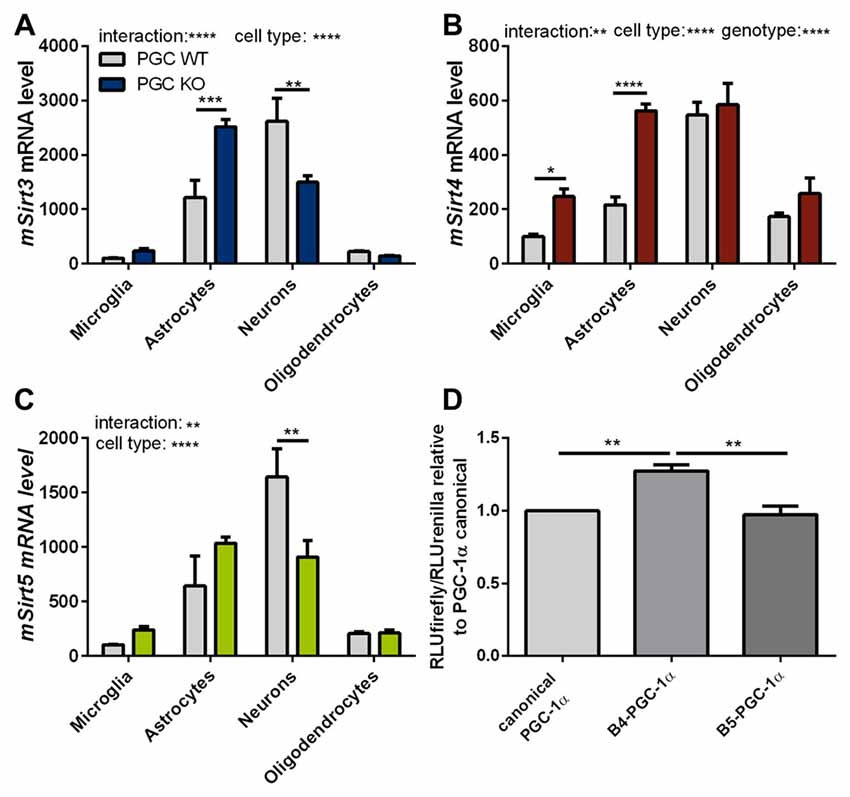
Figure 6. PGC-1α isoforms influence Sirt3 mRNA levels cell type specifically. Primary microglia, astrocytes, neurons and oligodendrocytes were cultured from B6.129-Ppargc1atm1Brsp/J (PGC-1α KO) mice. Sirt3 (A), Sirt4 (B) and Sirt5 (C) mRNA levels were determined by qPCR and normalized to TATA box binding protein (Tbp), RNA polymerase 2 (Polr2a). The mRNA levels are shown relative to wt microglia cells. Data was analyzed by two-way ANOVA, followed by Sidak’s multiple comparison test with n = 4–6. The DualGlo luciferase assay (Promega) was used to determine the PGC-1α mediated activation of the Sirt3 promoter (D), measured by the expression of the firefly luciferase. Neuro2a cells were co-transfected with PGC-1α isoforms (canonical PGC-1α, CNS-specific B4-PGC-1α and B5-PGC-1α; exon B4 or B5 are added at the N-terminus of canonical PGC-1α, respectively) and the renilla luciferase. Forty-eight hours after transfection the luciferase assay was performed. The activity of the firefly luciferase was normalized to the renilla luciferase activity and relative light units (RLU) are shown relative to the canonical PGC-1α levels. Data were analyzed using the Kruskal-Wallis test, followed by Dunn’s multiple comparison test with n = 8. Data are shown as mean ± SEM. ns = P > 0.05, *P ≤ 0.05, **P ≤ 0.01, ***P ≤ 0.001, ****P ≤ 0.0001.
To investigate whether the different PGC-1α isoforms have specific effects on the transcription of Sirt3, we performed a luciferase reporter assay for the promoter region of Sirt3. Canoncial PGC-1α or representative CNS-specific PGC-1α isoforms (B4- or B5-) were overexpressed with plasmids. The luciferase reporter assays in neuro-2a cells showed a significantly higher firefly to renilla signal of the Sirt3 promoter region in cells transfected with the CNS-specific B4-PGC-1α isoform compared to the canonical or B5-PGC-1α isoform (Figure 6D).
Our experiments showed a trend towards reduced Sirt3 mRNA levels in PGC-1α KO mice compared to wt littermate controls. Subsequently performed luciferase activity assays pointed towards an important role for the CNS-specific B4-PGC-1α isoform in the transcriptional regulation of Sirt3 in neurons.
Sirt3 and Ppargc1a Expression Levels in the R6/2 Mouse Model of HD
In ALS and HD PGC-1α signaling is changed (Eschbach et al., 2013; Weydt et al., 2014). Therefore, we investigated the mitochondrial sirtuins and PGC-1α expression during the disease course of R6/2 mice (Mangiarini et al., 1996). Changes in mRNA levels of canonical and CNS-specific Ppargc1a were examined in striatum, cortex and cerebellum of R6/2 mice compared to wt controls at three strategic time points of the disease course (30, 60 and 90 days; Figures 7A–F). In the cortex both PGC-1α isoforms were significantly decreased in R6/2 mice compared to controls for all time points tested (Figures 7B,E). The two Ppargc1a isoforms were unchanged in the striatum and cerebellum despite of a significant reduction in the striatum of 30 days old R6/2 mice (Figures 7A,C,D,F). Sirt3 mRNA levels decreased over the disease course in cortex tissue (Figure 7H) while in the striatum Sirt3 mRNA levels increased (Figure 7G). In the cerebellum Sirt3 mRNA levels remained unchanged (Figure 7I). Protein levels of SIRT3 did not change significantly over the course of disease in any of the brain regions (Figures 7J,K,L, Supplementary Figures 12–14). Sirt4 mRNA levels were decreased in the cortex, increased in the striatum and unchanged in the cerebellum of R6/2 mice (Supplementary Table S6). Sirt5 mRNA levels did not change in cortex and striatum and in the cerebellum the levels decreased in 90 days old mice compared to wt mice (Supplementary Table S6).
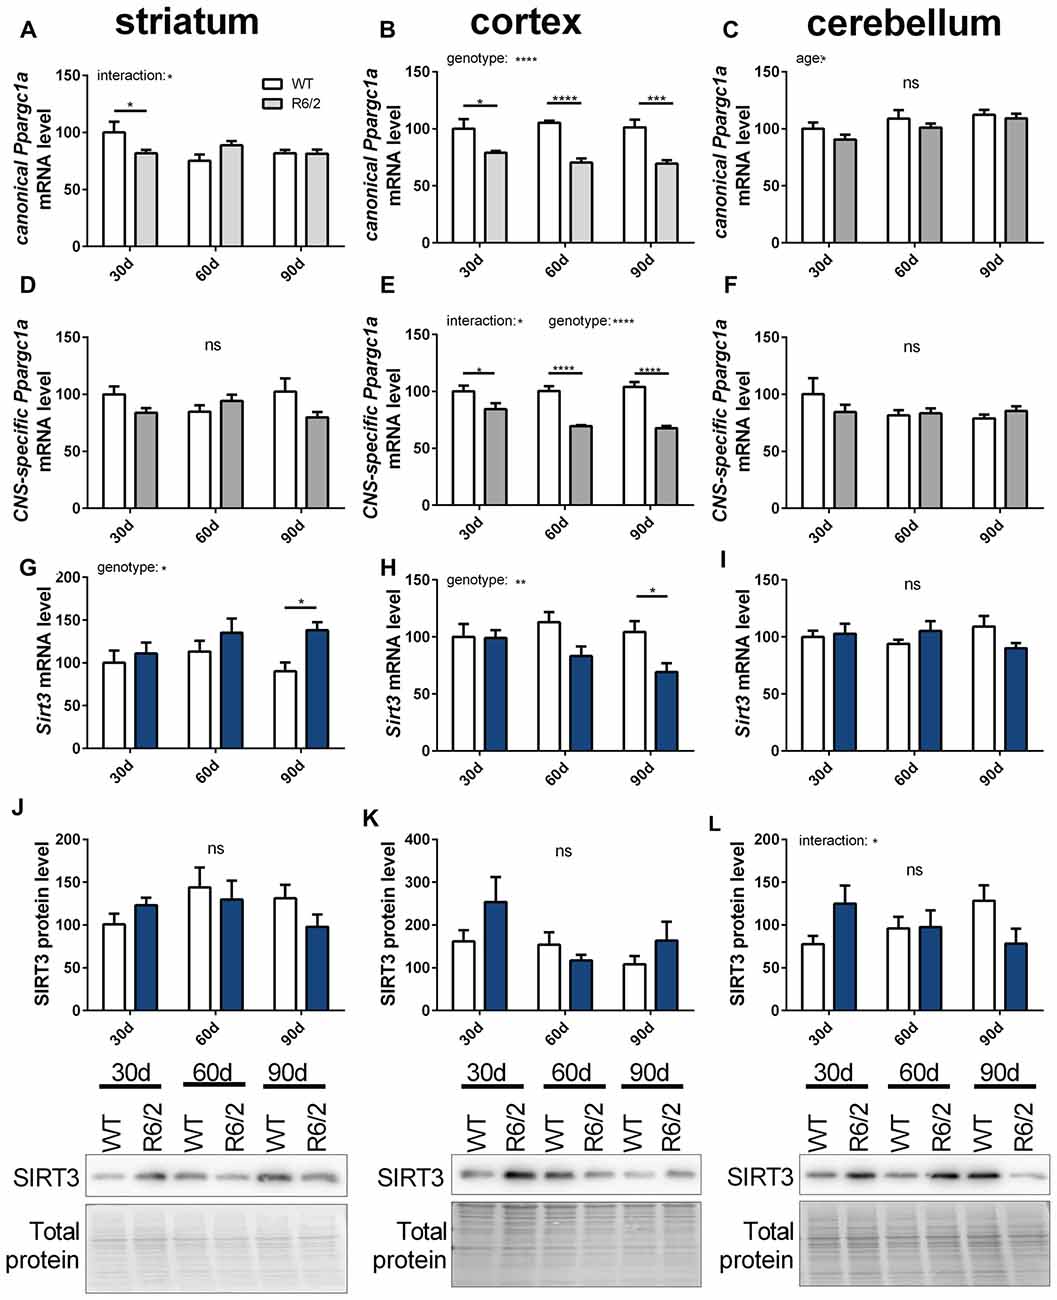
Figure 7. Sirt3 mRNA levels decrease in the cortex of R6/2 mice and increase in the striatum. mRNA levels of canonical Ppargc1a (A–C), CNS-specific Ppargc1a (D–F) and Sirt3 (G–I) were determined in the striatum (A,D,G), cortex (B,E,H) and cerebellum (C,F,I) of R6/2 Huntington’s disease (HD) mice. mRNA levels were measured using qPCR and data was normalized to TATA box binding protein (Tbp), RNA polymerase 2 (Polr2a) and β-actin (Actb) for striatum and cortex and to Tbp, Actb and methionylaminopeptidase 1 (Metap1) for the cerebellum, n = 6–9. SIRT3 protein levels were determined for striatum (J), cortex (K) and cerebellum (L) using western blot. Protein levels were normalized to total protein amount determined by MemCode staining. Data are shown relative to wt mice at 30 days of age. Data analysis was performed by two-way ANOVA followed by Sidak’s multiple comparison test with n = 5–6. Data are shown as mean ± SEM. ns = P > 0.05, *P ≤ 0.05, **P ≤ 0.01, ***P ≤ 0.001, ****P ≤ 0.0001.
SIRT3 Expression Is Altered in Affected Tissue of ALS and HD Patients
To determine to what extent our findings in animal models of neurodegenerative diseases are representative to the human conditions, we investigated the mRNA expression of SIRT3, canonical PPARGC1A and CNS-specific PPARGC1A in spinal cord and cortex of ALS patients and in the striatum and cerebellum of HD patients. All mRNA levels were unchanged in the cortex of ALS patients (Figures 8A,C,E), including mRNA levels of SIRT4 and SIRT5 (Figures 8G,I). For SIRT3 this was confirmed at protein level (Figure 8K). In contrast to the ALS mouse model, SIRT3 mRNA levels were significantly increased in the spinal cord of ALS patients (Figure 8F), and this was confirmed at the protein level (Figure 8L, Supplementary Figure 16). Protein levels were also higher in the cortex of ALS patients compared to controls (Figure 8K, Supplementary Figure 15). mRNA levels of canonical PPARGC1A also increased in the spinal cord of ALS patients (Figure 8B). CNS-specific PPARGC1A, SIRT4 and SIRT5 mRNA levels were unchanged in the spinal cord of ALS patients (Figures 8D,H,J).
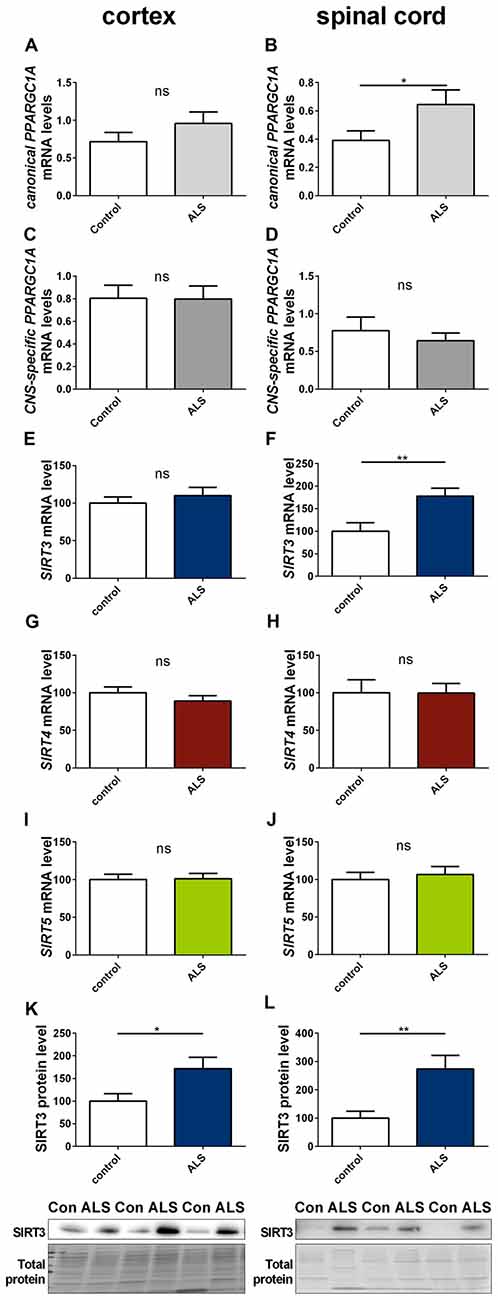
Figure 8. Sirt3 levels increase in human spinal cord of amyotrophic lateral sclerosis (ALS) patients. Human cortex (A,C,E,G,I,K) and spinal cord (B,D,F,H,J,L) were analyzed according to the canonical PPARGC1A (A,B), CNS-specific PPARGC1A (C,D), SIRT3 (E,F), SIRT4 (G,H) and SIRT5 (I,J) mRNA levels. mRNA levels were determined by qPCR and data was normalized to TBP and POLR2A, n = 10–12. SIRT3 protein levels were also determined in the human cortex (K) and spinal cord (L). Data was normalized to total protein amount determined by MemCode staining, n = 12–15. Analysis was performed by the nonparametric Mann-Whitney test. Data are shown as mean ± SEM. ns = P > 0.05, *P ≤ 0.05, **P ≤ 0.01.
We determined SIRT3 mRNA and SIRT3 protein levels in post mortem striatum (Figures 9E,K, Supplementary Figure 17) and cerebellum (Figures 9F,L, Supplementary Figure 18) tissue of HD patients, revealing no significant differences. Levels of canonical PPARGC1A (Figures 9A,B) and CNS-specific PPARGC1A (Figures 9C,D) mRNA also did not yield any discemable patterns. The cerebella of HD patients showed increased levels of canonical PPARGC1A levels (Figure 9B). SIRT4 mRNA levels were unchanged in the striatum (Figure 9G) and significantly increased in the cerebellum (Figure 9H). SIRT5 levels were unchanged in the striatum (Figure 9I) and cerebellum (Figure 9J).
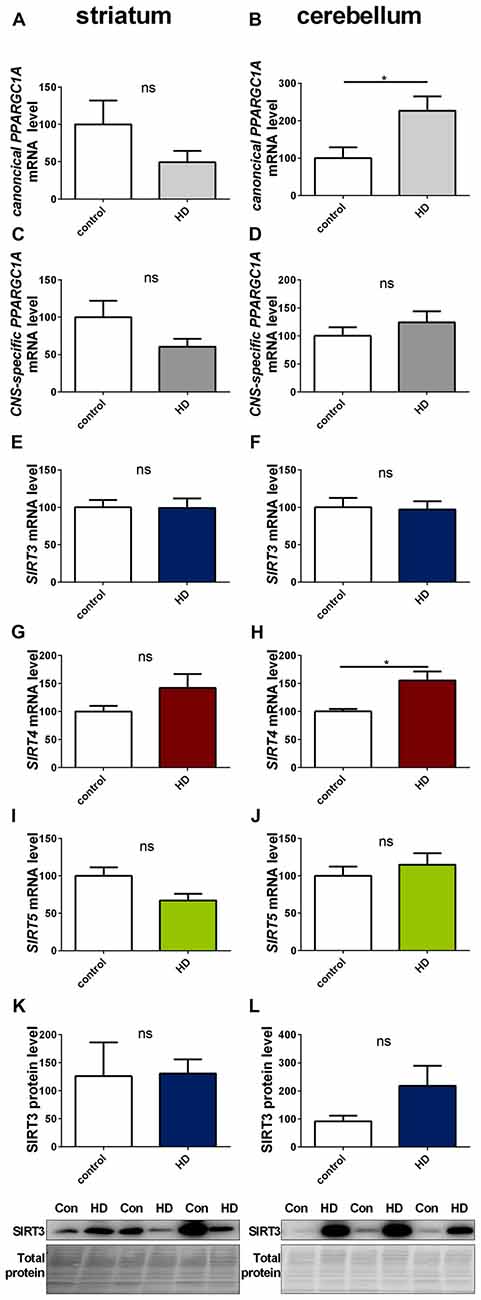
Figure 9. Sirt3 levels are unchanged in human striatum and cerebellum of HD patients. Human striatum (A,C,E,G,I,K) and cerebellum (B,D,F,H,J,L) were analyzed according to the canonical PPARGC1A (A,B), CNS-specific PPARGC1A (C,D), SIRT3 (E,F), SIRT4 (G,H) and SIRT5 (I,J) mRNA levels. mRNA levels were determined by qPCR and data was normalized to TBP and POLR2A, n = 7–10. SIRT3 protein levels were also determined in the human striatum (K) and cerebellum (L). Data was normalized to total protein amount determined by MemCode staining, n = 7–9. Analysis was performed by the nonparametric Mann-Whitney test. Data are shown as mean ± SEM. ns = P > 0.05, *P ≤ 0.05.
Discussion
In this study we compared tissue specific expression levels of sirtuins in ALS and HD. We demonstrated the disease stage dependent decline of Sirt3 mRNA expression levels and biological activity in the spinal cord of the SOD1(G93A) mouse model of ALS and in the cortex of R6/2 mice. Based on our experiments neither the neuronal cell loss in the spinal cord of the ALS mouse model nor inflammatory stimuli can fully explain the decreasing Sirt3 mRNA levels. We suggest modulating influences of the known disease modifier PGC-1α (Eschbach et al., 2013; Weydt et al., 2014), which also co-activates the transcription of Sirt3. Findings on PGC-1α KO cells support a PGC-1α dependent cellular distribution of Sirt3 mRNA levels, which possibly reflects the cell type-specific distribution of different PGC-1α isoforms. In human post mortem HD tissue and controls these findings could not be confirmed. In contrast to the mouse data of the SOD1(G93A) model SIRT3 mRNA and protein levels increased in the spinal cord of ALS patients and remained unchanged for HD patients.
Research on tg animals is limited by the model-specific constraints and the translation of the results to humans needs to be done with caution. Despite these limitations tg animals allow for the investigation of time points and tissues that cannot be studied in human patients. We therefore put an emphasis on validating our animal findings in human tissues wherever possible.
Sirt3 Signals In Vitro vs. In Vivo
Highest levels of Sirt3 mRNA were expressed in the spinal cord and brain stem, two CNS regions affected in ALS (Kaur et al., 2016). Specifically decreased Sirt3 mRNA levels were measured in spinal cord and brain stem of the ALS SOD1(G93A) mouse model during the course of disease, indicating a disease specific reduction. The stability of Sirt4 and Sirt5 mRNA levels, two residual mitochondrial sirtuins, combined with the unchanged sirtuin levels in the control region hippocampus further supported the selective decline of Sirt3 in spinal cord and brain stem.
The decline of Sirt3 levels in SOD1(G93A) mice during the course of disease corresponded to the canonical and CNS-specific levels of Ppargc1a, which were published previously (Bayer et al., 2017). This is not surprising considering the fact that PGC-1α regulates Sirt3 at the transcriptional level (Kong et al., 2010; Giralt et al., 2011).
SIRT3 protein levels showed a disease stage dependent decline in the spinal cord of SOD1(G93A) tg mice, reaching the same levels as wt mice at 130 days of age. SIRT3 levels in the wt animals did not change. A decline in Sirt3 mRNA and protein levels as well as in SIRT3 function is in line with findings described in aging rats (Zeng et al., 2014), suggesting features of accelerated aging regarding SIRT3 in the SOD1(G93A) model. It remains to be determined why SIRT3 levels are higher in SOD1(G93A) tg mice at the age of 60 days compared to wt littermate controls. It is well established that cellular and molecular precede the onset of overt symptoms in this model (Dal Canto and Gurney, 1995). Furthermore, the analysis of the acetylation status of the mitochondrial SIRT3 target SOD2 (Tao et al., 2010), showed increasing acetylation levels over the course of disease, when normalized to the total amount of SOD2. This argues for a decreased activity of SIRT3, which is in line with the work of Song et al. (2013), showing a decline in the sirtuin activity of spinal cord tissue lysates.
Narrowing our findings down from the tissue level to the cellular level, we detected highest mRNA and protein levels of mitochondrial sirtuins in primary neuron cultures, followed by astrocytes. Given the high SIRT3 levels in neurons, this cell type appears to determine the overall brain tissue levels. But this scenario would also predict decreasing levels of Sirt4 and Sirt5, which however show a stable distribution in the spinal cord during the course of disease. As all mitochondrial sirtuins are highly expressed in neurons, the selective decrease in SIRT3 is likely not a simple reflection of neuronal loss. Our results did not correlate well with the mRNA expression levels in the Stanford Brain RNAseq database2 (Zhang et al., 2014). In this database mRNA levels of all mitochondrial sirtuins are quite homogenous among neurons, astrocytes and oligodendrocytes (in the database referred to as “OPC”). Discrepancies between our data and the published database might reflect procedural differences, e.g., in cell selection or the culturing process.
A further methodological limitation of both approaches is that they rely on neonatal or embryonic tissue respectively, which are obtained well before disease onset in our disease models. Therefore, developmental differences likely limit the applicability of these data to adult in vivo results. When comparing cell culture data, one has to additionally take into account that the prevalence of the different cell types changes during tissue inflammation (Lull and Block, 2010). These changes in the cell type composition inevitably confound tissue levels of mitochondrial sirtuins in ALS.
Focusing on inflammation in the affected tissues of ALS (Philips and Robberecht, 2011), the involvement of SIRT3 in immune cell activation in the CNS was probed. The role of SIRT3 in inflammatory processes had been shown previously in peripheral blood monocytes (Liu et al., 2015; Traba et al., 2015). In LPS-stimulated primary microglia Sirt3, Sirt4 and Sirt5 mRNA levels decreased initially, but recovered after 24 h. In primary astrocytes sirtuin mRNA levels were unchanged after LPS stimulation.
The decreasing levels of Sirt3 in primary microglia cells upon LPS stimulation could explain the declining Sirt3 mRNA levels in the spinal cord of SOD1(G93A) animals over the disease course. It is unlikely that this LPS induced reduction explains the total Sirt3 tissue levels in the spinal cord of the SOD1(G93A) mice because Sirt4 and Sirt5 mRNA levels were decreased in the LPS-stimulated primary microglia cells but not in the tissue samples. We therefore conclude that either the contribution in the changes in mitochondrial sirtuin levels of microglia cells is negligible in the evaluation of tissue levels or the method of primary microglia cells derived from newborn pups is not appropriate to model adult onset changes.
PGC-1α in ALS and HD
Based on the similarities in hypermetabolism (Djousse et al., 2002; Dupuis et al., 2011) and mitochondrial dysfunction (Lin and Beal, 2006) between ALS and HD patients, we aimed to compare both diseases with regard to PGC-1α and SIRT3 expression. The metabolic master regulator PGC-1α is a disease modifier in ALS and HD (Eschbach et al., 2013; Weydt et al., 2014) and also controls the expression of Sirt3.
To probe their mutual relationship, we determined whether the absence of PGC-1α influences the expression levels of Sirt3. The functional PGC-1α KO mouse model, which lacks exons 3–5 of the PGC-1 α gene (Lin et al., 2004) indeed showed a tendency towards decreased levels of Sirt3 mRNA levels and SIRT3 protein levels in the spinal cord and cortex. The deleted region is highly conserved across species and includes a motif mediating the interaction with many nuclear receptors (Lin et al., 2004). A reduction in Sirt3 mRNA levels in PGC-1α KO mice was shown previously (Kong et al., 2010; Giralt et al., 2011). The changes we detected did not reach significance, and larger group sizes are needed to reach conclusive results.
Our experiments on primary cultured cells demonstrated a cell type specific redistribution of mitochondrial sirtuins in PGC-1α KO cells, with highest Sirt3 mRNA levels in astrocytes instead of neurons. The cell type specific expression of canonical and CNS-specific PGC-1α isoforms provides a possible explanation for the discrepant Sirt3 mRNA levels in different brain derived cell types of PGC-1α KO cells.
PGC-1α regulates different mitochondrial pathways in diverse tissues and cell types via a cell type and tissue specific expression of splice variants and isoforms (Martínez-Redondo et al., 2015). Several PGC-1α isoforms are expressed under a brain-specific promoter, restricting the expression to the CNS (Soyal et al., 2012). Experiments in our lab showed restricted expression of CNS-specific isoforms (exon B1–B4) in neurons, while the canonical isoform is also expressed in glia cells (Bayer et al., 2017). Of note, these different isoforms have different transcriptional co-activator activities (Bayer et al., 2017).
The roles of PGC-1α are very diverse and its functions are numerous. In the present study the experiments were focused on CNS tissues. We used a luciferase reporter assay to test whether different PGC-1α isoforms regulate Sirt3 transcription differentially. The B4-PGC-1α construct activated the Sirt3 promoter stronger than the B5-PGC-1α or the canonical PGC-1α constructs. These findings suggest that the higher neuronal Sirt3 mRNA levels reflect a neuron-specific expression of the CNS-specific PGC-1α isoforms. Further experiments are necessary to characterize the cell type specific PGC-1α isoform, which is mainly responsible for Sirt3 transcription. While our experiments speak to the cell type specific distribution of Sirt3 mRNA levels in wt cells, they do not fully explain why Sirt3 mRNA levels increase drastically in astrocytes upon the lack of exons 3–5 in PGC-1α. One limitation of the luciferase reporter assay is the use of neuro-2a cells instead of primary cultured neurons, which mimick the murine brain more closely. But primary cultured neurons are profoundly influenced by confounding factors such as harvesting and culturing, developmental differences and the absence of interactions with other cell types. Thus these results need to be interpreted with caution.
Differences between ALS and HD
PGC-1α and SIRT3 levels were compared in the R6/2 model of HD and the SOD1(G93A) model of ALS. Canonical and CNS-specific Ppargc1a mRNA levels were lower in the cortex of R6/2 mice compared to wt littermate controls. These results confirmed previous publications reporting reduced levels of the canonical Ppargc1a isoform on mRNA level in the cortex (Hering et al., 2015). Reduced levels were also reported for the striatum of HD mice (Cui et al., 2006; Weydt et al., 2006; Hering et al., 2015). In our hands unchanged levels of the different Ppargc1a isoforms were detected in the striatum of R6/2 mice. In the NLS-N171-82Q tg HD mouse model reduced mRNA and protein levels were reported (Chaturvedi et al., 2010). Lower Sirt3 mRNA levels were detected in the cortex of 90 days old R6/2 HD mice, paralleling the changes in Ppargc1a mRNA levels. Sirt3 mRNA levels were higher in the striatum of 90 days old R6/2 mice. The cerebellum was examined as a relatively spared brain area in HD and no significant changes were found, demonstrating brain region specific changes in Ppargc1a and Sirt3 mRNA levels. Protein levels of SIRT3 did not result in any significant changes in the brain regions examined.
In contrast to the cortex, the striatum of 90 days old R6/2 mice showed higher levels of Sirt3 mRNA. This differs from the decreased levels of Sirt3 in the spinal cord and brain stem of ALS SOD1 (G93A) mice. Although PGC-1α is involved in the pathogenesis of both diseases, intriguing remain. For instance the effect of a SNP, localized close to the CNS-specific Ppargc1a promoter, is protective in HD (Soyal et al., 2012) while in ALS it is clearly detrimental (Eschbach et al., 2013). Different PGC-1α involving pathomechanisms could dysregulate Sirt3 in a different manner in ALS and HD. Also, in HD transcriptional defects manifest much earlier in the disease course than in ALS. More than 200 mRNAs were described to be dysregulated in HD brains (Hodges et al., 2006; Anderson et al., 2008; Becanovic et al., 2010). Mutant huntingtin interacts with transcription factors, co-transcriptional activating factors such as PGC-1α and histone acetyl transferases (Li and Li, 2004; Anderson et al., 2008; Johri et al., 2013). While in SOD1 related ALS mRNA metabolism is not prominently affected, other ALS causing mutations do involve compromised transcription (Walsh et al., 2015).
Translational Aspects
Analysis of human cortical tissue of ALS patients did not show any changes in mitochondrial sirtuin levels. Canonical PPARGC1A and SIRT3 mRNA levels as well as SIRT3 protein levels were higher in human post mortem ALS spinal cord tissue, while CNS-specific PPARGC1A mRNA levels were unaltered. This constellation argues against the simplistic hypothesis that CNS-specific PPARGC1A mRNA levels alone determine SIRT3 mRNA levels. Furthermore, these findings are not in line with the decreased Sirt3 levels in the SOD1(G93A) spinal cords.
We examined SIRT3, 4, 5, canonical and CNS-specific PPARGC1A mRNA and SIRT3 protein levels in post mortem striatum and cerebellum from HD patients. Mainly the results revealed no differences between patient and control tissues, despite higher levels of canonical PPARCG1A and SIRT4 mRNA. SIRT3 protein levels showed a trend towards an increase compared to controls. The unchanged levels or CNS-specific Ppargc1a and Sirt3 in human HD patient tissue indicates the lack of significance of this pathway for HD pathogenesis. The R6/2 HD mouse model showed significantly higher Sirt3 mRNA levels and unchanged SIRT3 protein levels in the striatum. There are many non-mutually exclusive explanations for these discrepancies. They could be due to the species-specific degree of neuronal cell loss in the striatum. Also tg models have much larger repeat expansions compared to patients. In advanced human HD stages a striatal neuron loss of up to 90% is found (Vonsattel et al., 1985) compared to 12% in 90 days old R6/2 mice (Dodds et al., 2014). Brains from R6/2 mice show a 19% reduction in size (Mangiarini et al., 1996). R6/2 mice do not show the specific progressive atrophy of the caudate, putamen and globus pallidus associated with astrogliosis (Mangiarini et al., 1996), which is striking for human brains of higher HD grade (Vonsattel et al., 1985; Myers et al., 1991).
To overcome the limitations of exon-1 fragment models such as the R6/2 line, we turned to a genetically more accurate model, the knock-in HD mouse model, which expresses the full length huntingtin gene with a normal (Q20) or an expanded (Q175) CAG repeat tract (Langfelder et al., 2016). The transcriptomic RNAseq analysis of the knock-in mouse model showed a significant increase of Sirt3 mRNA levels and a significant decrease of Ppargc1a levels in the striatum of 6 and 10 months old Q175 mice compared to Q20 control mice (Langfelder et al., 2016). mRNA levels in the cortex did not change in this mouse model. The knock-in mouse is considered to be genetically more accurate than R6/2. The significant decrease in Ppargc1a mRNA levels of the knock-in mouse model in the striatum is reminiscent of the trend towards a decrease that we observed in the human tissue.
In summary, we provided evidence that Sirt3 levels and function decrease during the course of disease in affected tissues of the SOD1(G93A) ALS mouse model, whereas Sirt3 mRNA levels increased in the striatum of the R6/2 mouse model. Furthermore, inflammatory processes and neuronal loss possibly contribute to the decrease of Sirt3 mRNA levels during the course of disease in ALS SOD(G93A) animals. However, additional mechanisms have to be involved, as the other mitochondrial sirtuins remain stable. Moreover, we could show the cell type-specific expression pattern of Sirt3, which is highest in neurons, is probably predominantly regulated by CNS-specific Ppargc1a isoforms. Sirt3 levels in affected tissues of HD mice differed from ALS mice, confirming PGC-1α as a common modulator of disease specific signaling pathways. Further studies are necessary to fully elucidate the involvement of SIRT3 and PGC-1α in the pathology of ALS and HD.
Ethics Statement
In our study we used human post mortem brain tissue. This study was carried out in accordance with the recommendations of the local brain bank at Ulm University with written informed consent from all subjects. All subjects gave written informed consent in accordance with the Declaration of Helsinki. This study was carried out in accordance with the recommendations of the Animal Ethics committee of the Regional Steering Committee Tübingen. The protocol was approved by the Regional Steering Committee Tübingen and the local animal facility.
Author Contributions
EB and AW were responsible for the concept and design of the work. Data acquisition was performed by EB, HB, JH and NP. Data analysis and interpretation was performed by EB and HB. ACL provided clinical data of the ALS autopsy cases. KSL, PW and AW critically revised the manuscript. All authors reviewed and approved the manuscript.
Funding
This work was supported by the Deutsche Forschungsgemeinschaft (GRK1789 (CEMMA)) and the Virtual Helmholtz Institute “RNA dysmetabolism in ALS and FTD” (VH-VI-510).
Conflict of Interest Statement
The authors declare that the research was conducted in the absence of any commercial or financial relationships that could be construed as a potential conflict of interest.
Acknowledgments
We thank Prof. Dietmar R. Thal for providing human post mortem CNS tissue of ALS cases and controls. We thank Prof. Bernhard Lanwehrmeyer for access to the human post mortem CNS tissue of HD cases and controls. We thank Prof. Albert La Spada, Prof. Wolgang Patsch and Prof. Marcia Haigis for providing plasmids and Prof. David R. Gius for providing an antibody. We acknowledge the excellent technical work of Irma Merdian and Jasmin Sprissler.
Abbreviations
ALS, amyotrophic lateral sclerosis; B2M, beta-2 microglobulin; BCA, bicinchoninic acid; CNS, central nervous system; CS, citrate synthase; Dloop, displacement loop; DMEM, dulbecco’s modified eagle medium; FBS, fetal bovine serum; FUS, FUS RNA binding protein; HD, Huntington’s disease; HRP, horseradish peroxidase; KO, knock-out; LPS, lipopolysaccharide; mtDNA, mitochondrial DNA; PGC-1α, peroxisome proliferative-activated receptor gamma coactivator 1 alpha; PVDF, polyvinylidene fluoride; qPCR, quantitative real-time PCR; ROS, reactive oxygen species; RLU, relative light units; Sirt3, sirtuin 3; Sirt4, sirtuin 4; Sirt5, sirtuin 5; SNP, single nucleotide polymorphism; SOD1, superoxide dismutase 1; SOD2, superoxide dismutase 2; tg, transgenic; wt, wild type.
Footnotes
- ^ https://www.jax.org/strain/002726 and https://www.jax.org/strain/008597
- ^ http://web.stanford.edu/group/barres_lab/cgi-bin/igv_cgi_2.py?lname=sirt3
Supplementary Material
The Supplementary Material for this article can be found online at: https://www.frontiersin.org/article/10.3389/fnmol.2017.00156/full#supplementary-material
References
Anderson, A. N., Roncaroli, F., Hodges, A., Deprez, M., and Turkheimer, F. E. (2008). Chromosomal profiles of gene expression in Huntington’s disease. Brain 131, 381–388. doi: 10.1093/brain/awm312
Aziz, N. A., Pijl, H., Frölich, M., Snel, M., Streefland, T. C., Roelfsema, F., et al. (2010). Systemic energy homeostasis in Huntington’s disease patients. J. Neurol. Neurosurg. Psychiatry 81, 1233–1237. doi: 10.1136/jnnp.2009.191833
Aziz, N. A., van der Burg, J. M., Landwehrmeyer, G. B., Brundin, P., Stijnen, T., and Roos, R. A. (2008). Weight loss in Huntington disease increases with higher CAG repeat number. Neurology 71, 1506–1513. doi: 10.1212/01.wnl.0000334276.09729.0e
Bause, A. S., and Haigis, M. C. (2013). SIRT3 regulation of mitochondrial oxidative stress. Exp. Gerontol. 48, 634–639. doi: 10.1016/j.exger.2012.08.007
Bayer, H., Lang, K., Buck, E., Higelin, J., Barteczko, L., Pasquarelli, N., et al. (2017). ALS-causing mutations differentially affect PGC-1α expression and function in the brain vs. Neurobiol. Dis. 97, 36–45. doi: 10.1016/j.nbd.2016.11.001
Becanovic, K., Pouladi, M. A., Lim, R. S., Kuhn, A., Pavlidis, P., Luthi-Carter, R., et al. (2010). Transcriptional changes in Huntington disease identified using genome-wide expression profiling and cross-platform analysis. Hum. Mol. Genet. 19, 1438–1452. doi: 10.1093/hmg/ddq018
Canto, C., and Auwerx, J. (2009). PGC-1α, SIRT1 and AMPK, an energy sensing network that controls energy expenditure. Curr. Opin. Lipidol. 20, 98–105. doi: 10.1097/MOL.0b013e328328d0a4
Carri, M. T., D’Ambrosi, N., and Cozzolino, M. (2017). Pathways to mitochondrial dysfunction in ALS pathogenesis. Biochem. Biophys. Res. Commun. 483, 1187–1193. doi: 10.1016/j.bbrc.2016.07.055
Chaturvedi, R. K., Calingasan, N. Y., Yang, L., Hennessey, T., Johri, A., and Beal, M. F. (2010). Impairment of PGC-1α expression, neuropathology and hepatic steatosis in a transgenic mouse model of Huntington’s disease following chronic energy deprivation. Hum. Mol. Genet. 19, 3190–3205. doi: 10.1093/hmg/ddq229
Chawla, A., Nguyen, K. D., and Goh, Y. P. (2011). Macrophage-mediated inflammation in metabolic disease. Nat. Rev. Immunol. 11, 738–749. doi: 10.1038/nri3071
Chen, Y., Zhang, J., Lin, Y., Lei, Q., Guan, K. L., Zhao, S., et al. (2011). Tumour suppressor SIRT3 deacetylates and activates manganese superoxide dismutase to scavenge ROS. EMBO Rep. 12, 534–541. doi: 10.1038/embor.2011.65
Cui, L., Jeong, H., Borovecki, F., Parkhurst, C. N., Tanese, N., and Krainc, D. (2006). Transcriptional repression of PGC-1α by mutant huntingtin leads to mitochondrial dysfunction and neurodegeneration. Cell 127, 59–69. doi: 10.1016/j.cell.2006.09.015
Dal Canto, M. C., and Gurney, M. E. (1995). Neuropathological changes in two lines of mice carrying a transgene for mutant human Cu,Zn SOD, and in mice overexpressing wild type human SOD: a model of familial amyotrophic lateral sclerosis (FALS). Brain Res. 676, 25–40. doi: 10.1016/0006-8993(95)00063-v
Djousse, L., Knowlton, B., Cupples, L. A., Marder, K., Shoulson, I., and Myers, R. H. (2002). Weight loss in early stage of Huntington’s disease. Neurology 59, 1325–1330. doi: 10.1212/01.WNL.0000031791.10922.cf
Dodds, L., Chen, J., Berggren, K., and Fox, J. (2014). Characterization of striatal neuronal loss and atrophy in the R6/2 mouse model of Huntington’s disease. PLoS Curr. 6. doi: 10.1371/currents.hd.48727b68b39b82d5fe350f753984bcf9
Dupuis, L., Oudart, H., René, F., Gonzalez de Aguilar, J. L., and Loeffler, J. P. (2004). Evidence for defective energy homeostasis in amyotrophic lateral sclerosis: benefit of a high-energy diet in a transgenic mouse model. Proc. Natl. Acad. Sci. U S A 101, 11159–11164. doi: 10.1073/pnas.0402026101
Dupuis, L., Pradat, P. F., Ludolph, A. C., and Loeffler, J. P. (2011). Energy metabolism in amyotrophic lateral sclerosis. Lancet Neurol. 10, 75–82. doi: 10.1016/S1474-4422(10)70224-6
Eschbach, J., Schwalenstocker, B., Soyal, S. M., Bayer, H., Wiesner, D., Akimoto, C., et al. (2013). PGC-1α is a male-specific disease modifier of human and experimental amyotrophic lateral sclerosis. Hum. Mol. Genet. 22, 3477–3484. doi: 10.1093/hmg/ddt202
Ferger, A. I., Campanelli, L., Reimer, V., Muth, K. N., Merdian, I., Ludolph, A. C., et al. (2010). Effects of mitochondrial dysfunction on the immunological properties of microglia. J. Neuroinflammation 7:45. doi: 10.1186/1742-2094-7-45
Giralt, A., Hondares, E., Villena, J. A., Ribas, F., Diaz-Delfin, J., Giralt, M., et al. (2011). Peroxisome proliferator-activated receptor-γ coactivator-1α controls transcription of the Sirt3 gene, an essential component of the thermogenic brown adipocyte phenotype. J. Biol. Chem. 286, 16958–16966. doi: 10.1074/jbc.M110.202390
Heneka, M. T., Kummer, M. P., and Latz, E. (2014). Innate immune activation in neurodegenerative disease. Nat. Rev. Immunol. 14, 463–477. doi: 10.1038/nri3705
Hering, T., Birth, N., Taanman, J. W., and Orth, M. (2015). Selective striatal mtDNA depletion in end-stage Huntington’s disease R6/2 mice. Exp. Neurol. 266, 22–29. doi: 10.1016/j.expneurol.2015.02.004
Hirschey, M. D., Shimazu, T., Goetzman, E., Jing, E., Schwer, B., Lombard, D. B., et al. (2010). SIRT3 regulates mitochondrial fatty-acid oxidation by reversible enzyme deacetylation. Nature 464, 121–125. doi: 10.1038/nature08778
Hodges, A., Strand, A. D., Aragaki, A. K., Kuhn, A., Sengstag, T., Hughes, G., et al. (2006). Regional and cellular gene expression changes in human Huntington’s disease brain. Hum. Mol. Genet. 15, 965–977. doi: 10.1093/hmg/ddl013
Huynh, F. K., Muoio, D. M., and Hirschey, M. D. (2015). SIRT3 directs carbon traffic in muscle to promote glucose control. Diabetes 64, 3058–3060. doi: 10.2337/db15-0709
Johri, A., Chandra, A., and Beal, M. F. (2013). PGC-1α, mitochondrial dysfunction and Huntington’s disease. Free Radic. Biol. Med. 62, 37–46. doi: 10.1016/j.freeradbiomed.2013.04.016
Kaur, S. J., McKeown, S. R., and Rashid, S. (2016). Mutant SOD1 mediated pathogenesis of amyotrophic lateral sclerosis. Gene 577, 109–118. doi: 10.1016/j.gene.2015.11.049
Kim, J., Moody, J. P., Edgerly, C. K., Bordiuk, O. L., Cormier, K., Smith, K., et al. (2010). Mitochondrial loss, dysfunction and altered dynamics in Huntington’s disease. Hum. Mol. Genet. 19, 3919–3935. doi: 10.1093/hmg/ddq306
Kong, X., Wang, R., Xue, Y., Liu, X., Zhang, H., Chen, Y., et al. (2010). Sirtuin 3, a new target of PGC-1α, plays an important role in the suppression of ROS and mitochondrial biogenesis. PLoS One 5:e11707. doi: 10.1371/journal.pone.0011707
Langfelder, P., Cantle, J. P., Chatzopoulou, D., Wang, N., Gao, F., Al-Ramahi, I., et al. (2016). Integrated genomics and proteomics define huntingtin CAG length-dependent networks in mice. Nat. Neurosci. 19, 623–633. doi: 10.1038/nn.4256
Li, S. H., and Li, X. J. (2004). Huntingtin-protein interactions and the pathogenesis of Huntington’s disease. Trends Genet. 20, 146–154. doi: 10.1016/j.tig.2004.01.008
Lin, M. T., and Beal, M. F. (2006). Mitochondrial dysfunction and oxidative stress in neurodegenerative diseases. Nature 443, 787–795. doi: 10.1038/nature05292
Lin, J., Wu, P. H., Tarr, P. T., Lindenberg, K. S., St-Pierre, J., Zhang, C. Y., et al. (2004). Defects in adaptive energy metabolism with CNS-linked hyperactivity in PGC-1α null mice. Cell 119, 121–135. doi: 10.1016/j.cell.2004.09.013
Liu, T. F., Vachharajani, V., Millet, P., Bharadwaj, M. S., Molina, A. J., and McCall, C. E. (2015). Sequential actions of SIRT1-RELB-SIRT3 coordinate nuclear-mitochondrial communication during immunometabolic adaptation to acute inflammation and sepsis. J. Biol. Chem. 290, 396–408. doi: 10.1074/jbc.M114.566349
Lombard, D. B., Alt, F. W., Cheng, H. L., Bunkenborg, J., Streeper, R. S., Mostoslavsky, R., et al. (2007). Mammalian Sir2 homolog SIRT3 regulates global mitochondrial lysine acetylation. Mol. Cell. Biol. 27, 8807–8814. doi: 10.1128/mcb.01636-07
Lull, M. E., and Block, M. L. (2010). Microglial activation and chronic neurodegeneration. Neurotherapeutics 7, 354–365. doi: 10.1016/j.nurt.2010.05.014
Mangiarini, L., Sathasivam, K., Seller, M., Cozens, B., Harper, A., Hetherington, C., et al. (1996). Exon 1 of the HD gene with an expanded CAG repeat is sufficient to cause a progressive neurological phenotype in transgenic mice. Cell 87, 493–506. doi: 10.1016/s0092-8674(00)81369-0
Martínez-Redondo, V., Pettersson, A. T., and Ruas, J. L. (2015). The hitchhiker’s guide to PGC-1α isoform structure and biological functions. Diabetologia 58, 1969–1977. doi: 10.1007/s00125-015-3671-z
Mecocci, P., MacGarvey, U., Kaufman, A. E., Koontz, D., Shoffner, J. M., Wallace, D. C., et al. (1993). Oxidative damage to mitochondrial DNA shows marked age-dependent increases in human brain. Ann. Neurol. 34, 609–616. doi: 10.1002/ana.410340416
Michishita, E., Park, J. Y., Burneskis, J. M., Barrett, J. C., and Horikawa, I. (2005). Evolutionarily conserved and nonconserved cellular localizations and functions of human SIRT proteins. Mol. Biol. Cell 16, 4623–4635. doi: 10.1091/mbc.e05-01-0033
Myers, R. H., Vonsattel, J. P., Paskevich, P. A., Kiely, D. K., Stevens, T. J., Cupples, L. A., et al. (1991). Decreased neuronal and increased oligodendroglial densities in Huntington’s disease caudate nucleus. J. Neuropathol. Exp. Neurol. 50, 729–742. doi: 10.1097/00005072-199111000-00005
Newsholme, P., Curi, R., Gordon, S., and Newsholme, E. A. (1986). Metabolism of glucose, glutamine, long-chain fatty acids and ketone bodies by murine macrophages. Biochem. J. 239, 121–125. doi: 10.1042/bj2390121
O’Meara, R. W., Ryan, S. D., Colognato, H., and Kothary, R. (2011). Derivation of enriched oligodendrocyte cultures and oligodendrocyte/neuron myelinating co-cultures from post-natal murine tissues. J. Vis. Exp. e3324. doi: 10.3791/3324
Philips, T., and Robberecht, W. (2011). Neuroinflammation in amyotrophic lateral sclerosis: role of glial activation in motor neuron disease. Lancet Neurol. 10, 253–263. doi: 10.1016/s1474-4422(11)70015-1
Polyzos, A. A., and McMurray, C. T. (2017). The chicken or the egg: mitochondrial dysfunction as a cause or consequence of toxicity in Huntington’s disease. Mech. Ageing Dev. 161, 181–197. doi: 10.1016/j.mad.2016.09.003
Przedborski, S., Vila, M., and Jackson-Lewis, V. (2003). Neurodegeneration: what is it and where are we? J. Clin. Invest. 111, 3–10. doi: 10.1172/jci17522
Qiu, X., Brown, K., Hirschey, M. D., Verdin, E., and Chen, D. (2010). Calorie restriction reduces oxidative stress by SIRT3-mediated SOD2 activation. Cell Metab. 12, 662–667. doi: 10.1016/j.cmet.2010.11.015
Rona-Voros, K., and Weydt, P. (2010). The role of PGC-1α in the pathogenesis of neurodegenerative disorders. Curr. Drug Targets 11, 1262–1269. doi: 10.2174/1389450111007011262
Sahin, E., and DePinho, R. A. (2012). Axis of ageing: telomeres, p53 and mitochondria. Nat. Rev. Mol. Cell Biol. 13, 397–404. doi: 10.1038/nrm3352
Samant, S. A., Zhang, H. J., Hong, Z., Pillai, V. B., Sundaresan, N. R., Wolfgeher, D., et al. (2014). SIRT3 deacetylates and activates OPA1 to regulate mitochondrial dynamics during stress. Mol. Cell. Biol. 34, 807–819. doi: 10.1128/MCB.01483-13
Satterstrom, F. K., and Haigis, M. C. (2014). Luciferase-based reporter to monitor the transcriptional activity of the SIRT3 promoter. Methods Enzymol. 543, 141–163. doi: 10.1016/B978-0-12-801329-8.00007-6
Song, W., Song, Y., Kincaid, B., Bossy, B., and Bossy-Wetzel, E. (2013). Mutant SOD1G93A triggers mitochondrial fragmentation in spinal cord motor neurons: neuroprotection by SIRT3 and PGC-1α. Neurobiol. Dis. 51, 72–81. doi: 10.1016/j.nbd.2012.07.004
Soyal, S. M., Felder, T. K., Auer, S., Hahne, P., Oberkofler, H., Witting, A., et al. (2012). A greatly extended PPARGC1A genomic locus encodes several new brain-specific isoforms and influences Huntington disease age of onset. Hum. Mol. Genet. 21, 3461–3473. doi: 10.1093/hmg/dds177
Tao, R., Coleman, M. C., Pennington, J. D., Ozden, O., Park, S. H., Jiang, H., et al. (2010). Sirt3-mediated deacetylation of evolutionarily conserved lysine 122 regulates MnSOD activity in response to stress. Mol. Cell 40, 893–904. doi: 10.1016/j.molcel.2010.12.013
Tefera, T. W., and Borges, K. (2017). Metabolic dysfunctions in amyotrophic lateral sclerosis pathogenesis and potential metabolic treatments. Front. Neurosci. 10:611. doi: 10.3389/fnins.2016.00611
Thau, N., Knippenberg, S., Körner, S., Rath, K. J., Dengler, R., and Petri, S. (2012). Decreased mRNA expression of PGC-1α and PGC-1α-regulated factors in the SOD1G93A ALS mouse model and in human sporadic ALS. J. Neuropathol. Exp. Neurol. 71, 1064–1074. doi: 10.1097/NEN.0b013e318275df4b
Traba, J., Kwarteng-Siaw, M., Okoli, T. C., Li, J., Huffstutler, R. D., Bray, A., et al. (2015). Fasting and refeeding differentially regulate NLRP3 inflammasome activation in human subjects. J. Clin. Invest. 125, 4592–4600. doi: 10.1172/JCI83260
Tsunemi, T., Ashe, T. D., Morrison, B. E., Soriano, K. R., Au, J., Roque, R. A., et al. (2012). PGC-1α rescues Huntington’s disease proteotoxicity by preventing oxidative stress and promoting TFEB function. Sci. Transl. Med. 4:142ra197. doi: 10.1126/scitranslmed.3003799
Vonsattel, J. P., Myers, R. H., Stevens, T. J., Ferrante, R. J., Bird, E. D., and Richardson, E. P. Jr. (1985). Neuropathological classification of Huntington’s disease. J. Neuropathol. Exp. Neurol. 44, 559–577. doi: 10.1097/00005072-198511000-00003
Walsh, M. J., Cooper-Knock, J., Dodd, J. E., Stopford, M. J., Mihaylov, S. R., Kirby, J., et al. (2015). Invited review: decoding the pathophysiological mechanisms that underlie RNA dysregulation in neurodegenerative disorders: a review of the current state of the art. Neuropathol. Appl. Neurobiol. 41, 109–134. doi: 10.1111/nan.12187
Weydt, P., Pineda, V. V., Torrence, A. E., Libby, R. T., Satterfield, T. F., Lazarowski, E. R., et al. (2006). Thermoregulatory and metabolic defects in Huntington’s disease transgenic mice implicate PGC-1a in Huntington’s disease neurodegeneration. Cell Metab. 4, 349–362. doi: 10.1016/j.cmet.2006.10.004
Weydt, P., Soyal, S. M., Landwehrmeyer, G. B., and Patsch, W. (2014). A single nucleotide polymorphism in the coding region of PGC-1α is a male-specific modifier of Huntington disease age-at-onset in a large European cohort. BMC Neurol. 14:1. doi: 10.1186/1471-2377-14-1
Wiesner, D., Merdian, I., Lewerenz, J., Ludolph, A. C., Dupuis, L., and Witting, A. (2013). Fumaric acid esters stimulate astrocytic VEGF expression through HIF-1α and Nrf2. PLoS One 8:e76670. doi: 10.1371/journal.pone.0076670
Zeng, L., Yang, Y., Hu, Y., Sun, Y., Du, Z., Xie, Z., et al. (2014). Age-related decrease in the mitochondrial sirtuin deacetylase Sirt3 expression associated with ROS accumulation in the auditory cortex of the mimetic aging rat model. PLoS One 9:e88019. doi: 10.1371/journal.pone.0088019
Zhang, Y., Chen, K., Sloan, S. A., Bennett, M. L., Scholze, A. R., O’Keeffe, S., et al. (2014). An RNA-sequencing transcriptome and splicing database of glia, neurons, and vascular cells of the cerebral cortex. J. Neurosci. 34, 11929–11947. doi: 10.1523/JNEUROSCI.1860-14.2014
Keywords: amyotrophic lateral sclerosis, Huntington’s disease, Sirt3, PGC-1α, mitochondria, SOD(G93A), R6/2, human tissue
Citation: Buck E, Bayer H, Lindenberg KS, Hanselmann J, Pasquarelli N, Ludolph AC, Weydt P and Witting A (2017) Comparison of Sirtuin 3 Levels in ALS and Huntington’s Disease—Differential Effects in Human Tissue Samples vs. Transgenic Mouse Models. Front. Mol. Neurosci. 10:156. doi: 10.3389/fnmol.2017.00156
Received: 06 February 2017; Accepted: 08 May 2017;
Published: 26 May 2017.
Edited by:
Nicola Maggio, The Chaim Sheba Medical Center, IsraelReviewed by:
Emmanuel Brouillet, Commissariat à l’Energy Atomic (CEA) and Centre National de la Recherche Scientifique (CNRS), FranceGiovanni Manfredi, Weill Cornell Medical College, United States
Copyright © 2017 Buck, Bayer, Lindenberg, Hanselmann, Pasquarelli, Ludolph, Weydt and Witting. This is an open-access article distributed under the terms of the Creative Commons Attribution License (CC BY). The use, distribution or reproduction in other forums is permitted, provided the original author(s) or licensor are credited and that the original publication in this journal is cited, in accordance with accepted academic practice. No use, distribution or reproduction is permitted which does not comply with these terms.
*Correspondence: Patrick Weydt, patrick.weydt@ukbonn.de