Correlative Light Electron Microscopy: Connecting Synaptic Structure and Function
 Isabell Begemann1,2
  Milos Galic1,2*
- 1DFG Cluster of Excellence ‘Cells in Motion’, (EXC 1003), University of Muenster, Muenster, Germany
- 2Institute of Medical Physics and Biophysics, University Hospital Münster, University of Muenster, Muenster, Germany
Many core paradigms of contemporary neuroscience are based on information obtained by electron or light microscopy. Intriguingly, these two imaging techniques are often viewed as complementary, yet separate entities. Recent technological advancements in microscopy techniques, labeling tools, and fixation or preparation procedures have fueled the development of a series of hybrid approaches that allow correlating functional fluorescence microscopy data and ultrastructural information from electron micrographs from a singular biological event. As correlative light electron microscopy (CLEM) approaches become increasingly accessible, long-standing neurobiological questions regarding structure-function relation are being revisited. In this review, we will survey what developments in electron and light microscopy have spurred the advent of correlative approaches, highlight the most relevant CLEM techniques that are currently available, and discuss its potential and limitations with respect to neuronal and synapse-specific applications.
Introduction
Neurons transmit the majority of trans-cellular signals via synaptic contacts. To correctly and reliably respond to various stimuli (e.g., different input frequencies), each synapse hosts an elaborate machinery to regulate signal transmission in a context-dependent manner. On the molecular level, synaptic transmission in its most simple form relies on fusion of ~40 nm large vesicles at the presynaptic site, diffusion of released neuro-transmitters across the 30 nm wide synaptic cleft, and subsequent ligand-specific activation of receptors at the postsynaptic site. Considering the small size of this signaling unit, it is not surprising that major advancements in understanding synaptic function have been closely correlated with progress in imaging technology. For instance, the notion that communication across synaptic clefts relies on chemical signals would not have been possible without detailed information from electron micrographs on synapse ultrastructure (Derobertis and Bennett, 1955; Pappas and Bennett, 1966) and vesicle dynamics (Heuser and Reese, 1973). Likewise, our understanding about the function of individual synaptic proteins has substantially advanced with the introduction of ion and protein markers (Shimomura et al., 1962; Tsien, 1981; Heim et al., 1994) for fluorescence light microscopy. Intriguingly, and despite the fact that today’s neuroscience is building up on information obtained with electron and light microscopy, strategies to combine these two approaches only recently have started gaining traction.
The emergence of such dual approaches, termed correlative light electron microscopy (CLEM), from a sparsely known branch of imaging to center stage can be linked to a series of landmark papers from the nineties (Deerinck et al., 1994; Svitkina et al., 1995). Since then, fueled by advances in imaging and labeling techniques, publications using CLEM approaches have steadily been rising. In this review, we will revisit what developments have incited the advent of correlative imaging approaches, and highlight the most relevant dual microscopy techniques that are currently available. We begin by giving an overview of electron and light-based imaging methods that can be used for CLEM, followed by a section describing how individual approaches can be successfully combined to create correlative approaches. Next, we will reflect on technical concerns that need to be taken care of when designing dual imaging experiments, before closing with a discussion on current limitations and future challenges associated with CLEM.
Electron and Light-Based Techniques Used For CLEM
CLEM describes a continuously growing number of procedures that allow merging electron and light-based images from the same object. Thus, at least in theory, each existing electron and light microscopy technique where ultrastructure remains intact could be paired to generate a CLEM image. To illustrate this combinatorial potential, and to expound existing limitations, we begin this section by discussing electron and light microscopy techniques suitable for correlative approaches, before proceeding to examples where CLEM was successful applied to study neuronal and synaptic function.
Electron Microscopy–Visualizing the Ultrastructure
Electron micrographs in CLEM rely to a large extent on transmission electron microscopy (TEM) and scanning electron microscopy (SEM). TEM, which enables visualization of 50–100 nm thick cross-sections of samples with a resolution of down to a few Angstrom (Pierce and Buseck, 1974; Ruska, 1987; Erni et al., 2009), was critically involved in the detailed characterization of synaptic structures (Gray, 1959; Pappas and Bennett, 1966; Fifkova and Delay, 1982; Landis and Reese, 1983; Watanabe et al., 2013, 2014), and has helped to advance our understanding on age and disease-dependent changes in synaptic properties (DeKosky and Scheff, 1990; Navlakha et al., 2013).
Contrary to TEM, where electron shadows are used to create the image, SEM-based strategies utilizes the interaction of electrons with molecules in the sample to recreate the image. One commonly applied SEM strategy, where secondary electrons are used to determine the surface topography of objects with a precision of ~1 nm (Vernon-Parry, 2000), was central for investigating surface features such as the morphology of neuromuscular junctions (Desaki and Uehara, 1981) as well as structural reorganization during exploratory dendritic filopodia formation in hippocampal neurons (Galic et al., 2014). In addition, back-scattered electrons created by interaction with heavy elements (i.e., high atomic number) in the uncoated sample can also be used to render images comparable to transmission electron micrographs of ultrathin sections, an approach that is of particular relevance for embedded sections on an electron-opaque surface or samples that are investigated ‘en block’ (Briggman et al., 2011).
A single cross-section, or the surface of the sample, is lacking information on the three-dimensional organization within the biological specimen. Here, cryo-fracture, where frozen samples are broken to expose cell structures along the fracture line (Castejon and Caraballo, 1980; Castejon, 1996), or unroofing, where intracellular structures are uncovered by brief bursts of ultrasound (Lang, 2003), can be used together with deep-etching (Heuser and Salpeter, 1979) to gain insights into subcellular organization. While useful, these strategies lack the capability for systematic three-dimensional sample reconstruction that can be achieved with serial sectioning, where successive ultrathin slices are imaged. Early attempts of serial sectioning reach back to the late 60s (De Rosier and Klug, 1968), and have since then continuously been used to investigate neuronal networks (White et al., 1986) and synaptic connection (Mishchenko et al., 2010). In modern serial section TEM (ssTEM), sections of 60 ± 20 nm are cut with an ultra-microtome and placed manually on a metal support grid (Harris et al., 2006). More recently, automated tape-collecting ultra-microtome SEM (ATUM-SEM) has emerged as a powerful alternative (Hayworth et al., 2006; Kasthuri et al., 2007, 2015; Terasaki et al., 2013; Morgan et al., 2016). Here, sections of 30 nm are cut by an ultra-microtome and collected from the water bath using a conveyor-belt like support tape. As the support tape is electron-opaque, a finely focused SEM beam is applied to raster the surface of the sample and backscattered electrons are used to reconstruct the image. Thus, compared to ssTEM, ATUM-based strategies not only allow thinner sectioning and rapid imaging of larger areas but also substantially reduce errors associated with manual sample handling (Hayworth et al., 2014). Alternatively, an embedded tissue block can also be sectioned directly within the SEM vacuum chamber, either using a diamond knife (serial block-face SEM, SBEM; Leighton, 1981; Denk and Horstmann, 2004) or by milling with a focused ion-beam (FIB-SEM; Watkins et al., 1986; Knott et al., 2008). In the latter, a scanning electron microscope is used to image the surface of the embedded sample, while a high current focused ion beam continuously slices off sections perpendicular to the SEM axis, thus allowing 3D reconstruction of the sample. Compared to diamond-based sectioning, FIB-SEM is thus not only faster but also permits sectioning samples with a step size in the single nm range (Knott et al., 2008; Merchan-Perez et al., 2009; Lehmann et al., 2014).
Another strategy for detailed three-dimensional reconstructions relies on electron tomography (ET). In this approach, a tilt series (usually ranging from -60° to +60°) of two-dimensional images is generated to reconstruct the three-dimensional shape of an object within the single slice (Crowther et al., 1970; Hoppe et al., 1974; Penczek, 2010; Ercius et al., 2015). ET was successfully used to resolve ultrastructural features of the presynapse (Perkins et al., 2015) and synaptic vesicle populations in saccular hair cells (Lenzi et al., 1999). Yet, while ET is suitable for atomic-resolution, radiation damage, and limitations in interpretability for thicker sections need to be considered when preparing the sample (Tocheva et al., 2010).
Finally, we would like to note that further electron-based imaging strategies exist (e.g., STEM (Crewe et al., 1970; Engel, 1978), tSEM (Kuwajima et al., 2013)). While not commonly used in CLEM studies, it is plausible to envision that some of these additional types of electron microscopy may be beneficial for a particular question. For readers interested in learning more on electron microscopy techniques, we recommend reading one of the many excellent reviews available on this exciting topic (Briggman and Bock, 2012; Knott and Genoud, 2013; Miranda et al., 2015; Perkins et al., 2015).
Light Microscopy–Monitoring and Manipulating Cell Function
While the electron microscopy techniques described above are well suited to investigate ultrastructural features with high axial resolution, they lack spatio-temporal information available with light microscopy. To increase penetration depth and reduce background compared to whole field illumination (Epi), CLEM studies frequently rely on confocal microscopy, where a pinhole is used to reduce out-of-focus light (Minsky, 1988), light sheet microscopy, where a light beam perpendicular to the objective illuminates only the focal plane (Engelbrecht and Stelzer, 2006; Keller et al., 2008), or two-photon microscopy, where simultaneous absorption of two photons is used for spatially controlled illumination (Denk et al., 1990). Resolution in light and electron microscopy is based on numerical aperture and wavelength. However, unlike in electron microscopy, where resolution is limited by the spot size (SEM) or the grain of the detector (TEM), the limiting factors in light microscopy is the wavelength (Rayleigh, 1879; Abbe, 1883). To reach beyond the diffraction limit, several approaches have been introduced over the last decade. Among the most prominent super-resolution microscopy techniques used in CLEM studies are stimulated emission depletion microscopy (STED), where a depletion laser limits the width of the emitting light source (Hell and Wichmann, 1994; Klar et al., 2001), and stochastic techniques, such as fluorescent photo-activation localization microscopy (PALM; Betzig and Chichester, 1993; Betzig et al., 2006) or stochastic optical reconstruction microscopy (STORM; Rust et al., 2006), where light emitted from sequentially activated fluorophores is fitted to determine its precise localization. As before, we would like to note that additional light-based approaches [e.g., total internal reflection fluorescence microscopy (Axelrod, 1981) or structured illumination microscopy (Neil et al., 1997)] can be used in CLEM approaches. Readers interested to learn more about fluorescence microscopy techniques, we refer to one of the many excellent reviews focused on these topics (Lichtman and Conchello, 2005; Combs, 2010; Huang et al., 2010).
Fluorescence light microscopy not only allows to visualize cells within neuronal circuits (Livet et al., 2007), but a continuously growing number of molecular probes and genetically encoded markers also provide tools to study a variety of neuronal and synaptic properties. Parameters that can be analyzed include among others subcellular protein localization (Chalfie et al., 1994; Heim et al., 1994; Kilgore et al., 2013), protein activity (Adams et al., 1991), ion dynamics (Tsien, 1980, 1981; Tsien et al., 1982; Minta and Tsien, 1989; Nakai et al., 2001), pH (Tanasugarn et al., 1984; Miesenbock et al., 1998), membrane potential or voltage (Davila et al., 1973; Siegel and Isacoff, 1997; Zochowski et al., 2000), or lipid species (Stauffer et al., 1998). Intriguingly, light is also suitable to actively manipulate the biological sample in a precise spatio-temporal manner. One commonly used approach relies on light-activation of caged substrates. Relevant for neurobiology, strategies for uncaging calcium (Ellisdavies and Kaplan, 1994), IP3 (Wang and Augustine, 1995), and various neurotransmitters (Ellis-Davies, 2011) have been realized. More recently, light has also been used to regulate protein function (Cao et al., 2008; Tischer and Weiner, 2014). This approach, coined optogenetics, has provided among others tools for controlling neuronal and synaptic activity with unprecedented spatio-temporal precision (Boyden et al., 2005; Fenno et al., 2011; Rost et al., 2015). Finally, it is worth mentioning that even physical cell parameters, such as shape or membrane tension, can be altered by light in living samples, using for instance optical tweezers (Ashkin, 1970; Zhang and Liu, 2008). In summary, when combined with electron microscopy, these light-based approaches allow precisely altering a specific parameter while monitoring the cellular responses followed by analysis of the corresponding ultrastructural features.
Correlative Light and Electron Microscopy in Neuroscience
Although the potential of combining ultrastructural information with functional studies was early noticed, first attempts to combine these microscopy techniques were limited to depicting separately prepared and imaged biological samples (Porter et al., 1945). Experiments where fluorescence and EM images of subcellular structures from the same cell were aligned started appearing in the 1970s (Hollander, 1970; Nakai and Iwashita, 1976), and have since then been applied to investigate a variety of neurobiological questions.
To fully understand neuronal or synaptic function, the cellular context needs to be considered. It is thus not surprising, that large efforts have been put into elucidating ultrastructural information within the intact tissue. In situ CLEM, where data from life-cell fluorescence imaging is combined with EM micrographs, has advanced our understanding of neuronal circuits (Bock et al., 2011; Briggman et al., 2011; Lee et al., 2016), and has also shed light on subcellular behaviors such as axosome shedding (Figure 1A) (Bishop et al., 2004). An alternative strategy, frequently applied to gain information of individual neurons in situ, relies on array tomography (AT), where plastic-embedded tissue samples are sliced with an ultra-microtome, bonded array-wise onto a glass coverslip, stained, and finally imaged by fluorescence and electron microscopy (Figure 1B) (Micheva and Smith, 2007; Rah et al., 2013; Collman et al., 2015). By combining super-resolution techniques and serial sectioning, it was even possible to detect presynaptic dense projection proteins at a lateral resolution of 35–65 nm (Watanabe et al., 2011). While serial sectioning-based CLEM approaches allow studying biological samples with high axial and lateral resolution, sample preparation, and 3D image alignment can be challenging (Micheva and Smith, 2007; Collman et al., 2015). Here, SBEM and FIB-SEM based approaches, where en-block EM imaging and fluorescence approaches are merged to obtain CLEM images, have helped to streamline in situ studies focused on the complexity of the nervous system (Briggman et al., 2011; Blazquez-Llorca et al., 2015), or to reconstruct whole cortical neurons (Maco et al., 2013) and single synapses (Bosch et al., 2015).
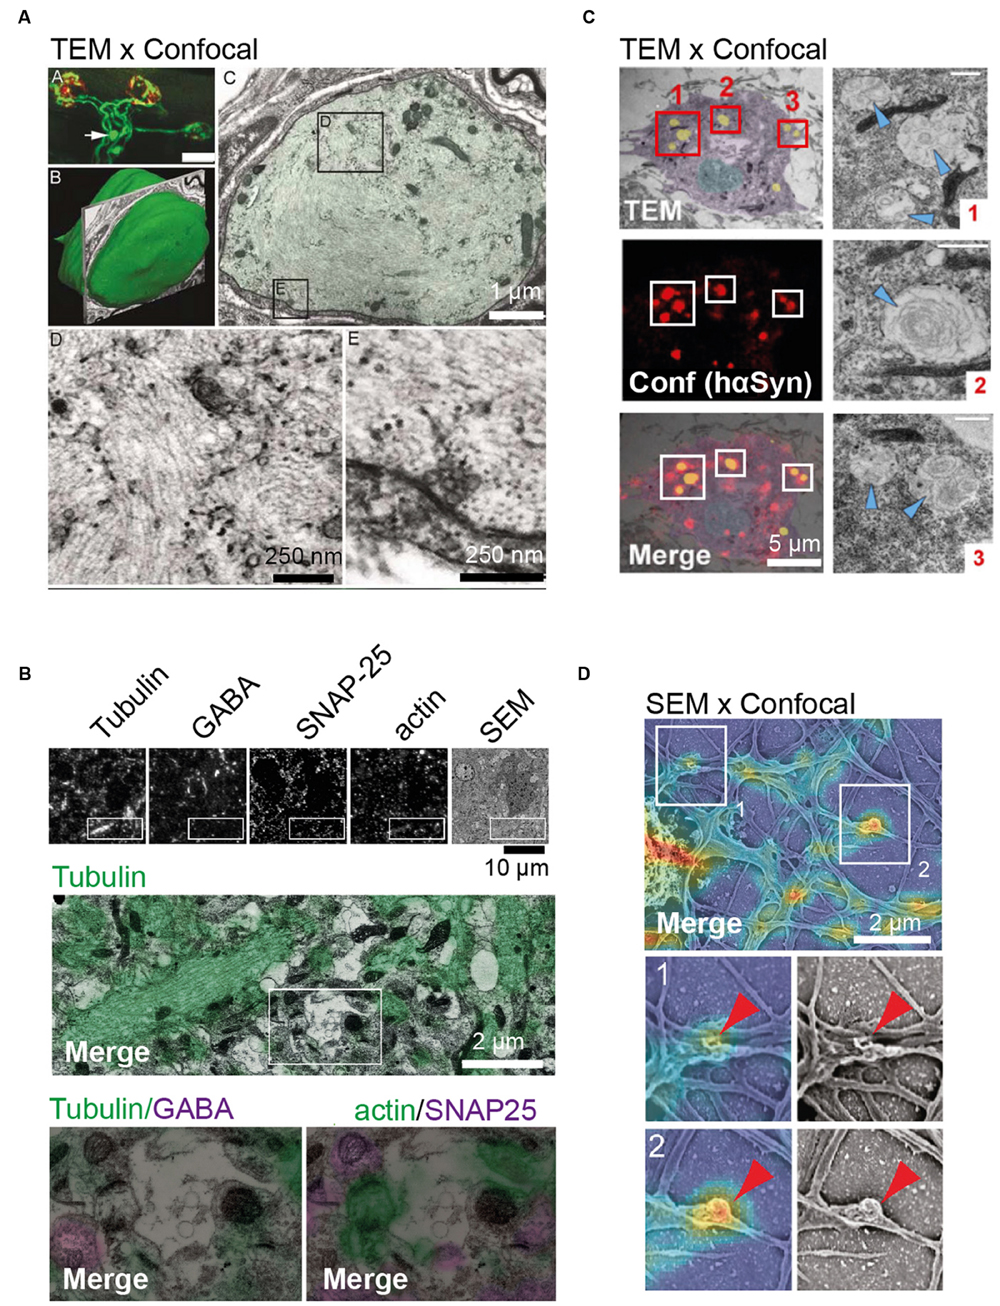
FIGURE 1. Examples of in situ and in vitro correlative light electron microscopy (CLEM) approaches. (A) In situ CLEM of confocal and transmission electron microscopy (TEM) images showing axonal retreat from neuromuscular junctions. Top left image shows confocal image depicting axonal bulb (arrow) present 25 um from the neuromuscular junction site (in red). Middle left image illustrating surface rendering of the bulb indicated above. Top right image shows TEM, shows that the bulb is sheathed by Schwann cells. TEM images at the bottom depict neurofilament disorganization in axonal bulb. (B) In situ CLEM of confocal and scanning electron microscopy (SEM) images of 70 nm section from the mouse cerebral cortex. From left to right: immunostaining of ultrathin sections for tubulin, GABA, SNAP-25, β-actin, and SEM image. Below, the boxed region is shown at a higher magnification. (C) In vitro CLEM of confocal and TEM images of hippocampal neurons. Ultrastructure of hα-Syn inclusions in cultured neurons from SNCA+/- mice shown in TEM (top), confocal image (middle), and as merged CLEM image (bottom). For illustration, the nucleus is rendered in blue, the cytosol in purple, and inclusions in yellow. To the right, high-resolution images of inclusions (red boxes 1–3), with arrowheads indicating filamentous structures, are shown. (D) In vitro CLEM of confocal and SEM images of cultured hippocampal neurons. Alignment of SEM and fluorescence signal for actin in cultured hippocampal neurons (top) and magnified sections of actin-rich convoluted nodes that form along dendritic arbors (bottom) are shown. Scale bars: (A) 25 μm at the top left, 1 μm at the top right, 0.25 μm at the bottom; (B) 10 μm at the top and 2 μm at the bottom; (C) 5 μm; (D) 2 μm. Pictures reprinted with permission from: (A) (Bishop et al., 2004); (B) (Micheva and Smith, 2007); (C) (Fares et al., 2016); (D) (Galic et al., 2014).
Orthogonal to in situ approaches described above, CLEM can also be applied to neurons isolated from brain tissues and cultured in vitro (Banker and Cowan, 1977). As such, cultured neurons are compatible with each CLEM technique described above (Figure 1C) (Al Jord et al., 2014; Paez-Segala et al., 2015; Fares et al., 2016). Although these cells lack the physiological context usually encountered by neurons within a tissue, cultured neurons may still yield advantages compared to in situ samples depending on the biological question. One such example, and complementing the section-based CLEM assays described so far, is the analysis of processes at the cellular surface, such as curvature-dependent protein recruitment to deforming plasma membranes (Figure 1D) (Galic et al., 2014).
Technical Considerations
In this section, we will focus on technical possibilities and limitations that need to be taken into consideration when designing a CLEM experiment. We start by discussing challenges arising from sample preparation. Next, we will survey what markers are suitable for which technique, and discuss strategies for alignment of corresponding fluorescence images and electron micrographs with respect to their potential and drawbacks.
Sample Preparation for CLEM Images
The quality of correlative image alignment critically relies on the ability to maintain the native organization of the cell during fixation and subsequent sample preparation. Thus, CLEM techniques not only need to be optimized for signal strength, but also for shape preservation. Formaldehyde, glutaraldehyde, and osmium tetroxide (OsO4), have been the standard fixatives for decades, including for brain tissues that are due to their softness easily damaged during fixation and subsequent processing. Classical fixation protocols include whole animal perfusion via the vascular system for larger specimens (e.g., whole brain) as well as immersion of tissue slice and cultured cells. Once the biological sample is fixed, the actual preparation for the respective EM technique is rendered. For slice-based assays, two different approaches exist: the pre-embedding method and the post-embedding method. For both methods, correlative approaches have been reported (Watanabe et al., 2011; Kopek et al., 2012). In the pre-embedding method, the antigen–antibody reaction is performed before (i.e., pre) plastic embedding and subsequent ultrathin sectioning. While better for preserving ultra-structures, this approach is often hindered by poor penetration of the antibody. In the post-embedding method, the antigen–antibody reaction is performed after (i.e., post) plastic embedding. As labeling takes place on thin tissue slices, antigens are more easily accessible. However, OsO4, which is often used as fixative and stain for membrane structures, can quench the fluorescence signal, and epoxy-based resins used due to its good preservation and ultra-sectioning properties partially inhibit photo-switching of fluorophores (Kim et al., 2015). Here, a number of modifications, such as using acrylic resins as embedding material or replacing OsO4 with uranyl acetate, tannic acid or p-phenylenediamine, have helped to enhance compatibility and immunoreactivity (Phend et al., 1995; Osamura et al., 2000; Akagi et al., 2006; Kim et al., 2015). Complementing these slice-based assays, cells can also be prepared for analysis of surface features. As before, samples are fixed. However, rather than embedding the sample, a platinum replica of the surface is generated (Heuser et al., 1976), or the sample is subjected to critical point drying and surface staining, prior to image acquisition via SEM. Finally, one last concern is that chemical fixation is not instantaneous (Szczesny et al., 1996). To circumvent this issue, quick-freezing, where samples are ‘slammed’ on a super-cold block of metal sprayed with liquid helium (Heuser et al., 1976) or high-pressure freezing, where samples are frozen in milli seconds while pressure is increased to avoid water crystallization (Hunziker et al., 1984; Dahl and Staehelin, 1989), have improved preservation quality.
Picking the Right Markers for CLEM
Unfortunately, not all markers are equally well suited for individual CLEM approaches. To account for these limitations, a series of labeling techniques has emerged. Considering its widespread availability, the most commonly used markers for CLEM are genetically encoded fluorescence tags, such as GFP, that can be detected in electron micrographs via immuno-gold labeling (Figure 2A) (Kukulski et al., 2011; Galic et al., 2012). In order to distinguish several proteins in the same sample, immuno-gold particles of variable sizes directed against different fluorescence tags can be used. However, since sample fixation may interfere with genetically encoded fluorescence markers (Muller-Reichert and Verkade, 2014) and gold particles may quench the fluorophore in parallel fluorescence/electron imaging (Kandela and Albrecht, 2007), additional markers are desirable. One such alternative relies on quantum dots (QDs; Figure 2B), which were shown to have a 10 times higher labeling efficiency than immuno-gold (Giepmans et al., 2005; Kuipers et al., 2015). These semiconductor nanocrystals consist of a cadmium selenide core surrounded by a zinc sulfide shell coated with affinity ligands (e.g., antibodies) for targeting the desired biomolecules (Alivisatos, 1996). Intriguingly, as the fluorescence wavelength of these photo-stable nanocrystals depends on their core size, it is possible to label samples with fluorescently different QDs, and then to distinguish individual QDs in electron micrographs by size (Giepmans et al., 2005; Kuipers et al., 2015). A minor disadvantage of QDs, however, lies in the difficulty to precisely measure sizes of small QDs due to its low contrast in EM (Brown and Verkade, 2010). While widely used, both methods are hampered by a localization error due to spatial separation between the protein epitope and the electro-dense particle that is visualized in light and electron micrographs (Kandela et al., 2007; van Donselaar et al., 2007). To bypass this imprecision, Aptamers directed against the fluorescence tag (Shui et al., 2012) linked to gold (Javier et al., 2008; Chang et al., 2013), or nano-bodies directed against fluorescent proteins that can be conjugated to gold nanoparticles (Van de Broek et al., 2011; Ries et al., 2012) may provide promising alternatives.
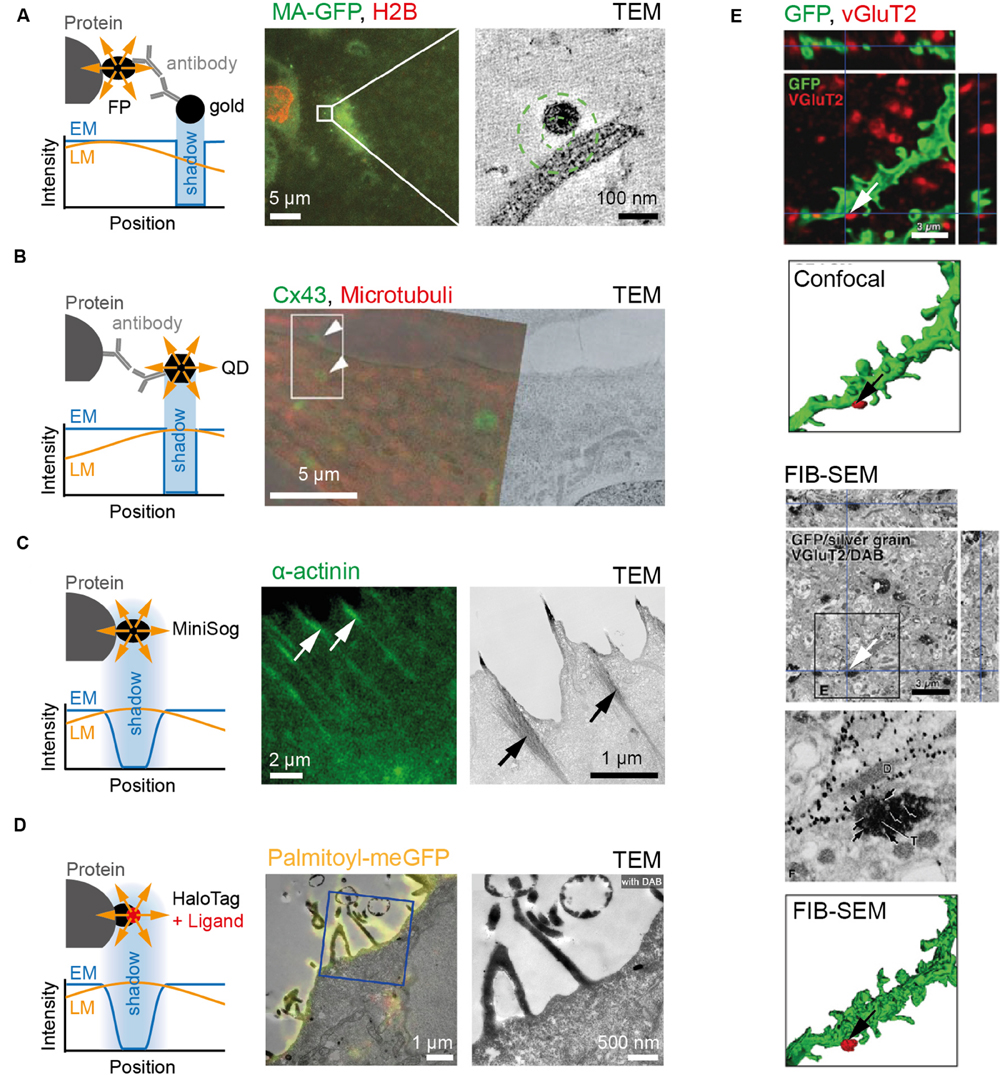
FIGURE 2. Examples of markers commonly used for CLEM. (A) To the left, cartoon depicting immune-gold labeling of genetically encoded fluorescent protein. Note difference between the relative position of signal in fluorescence (yellow) and electron microscope (blue) images caused by antibodies. To the right, an example showing fluorescence and electron micrographs of HIV particle labeled with MA-EGFP on MDCK cells expressing RFP-tagged Histone 2B. (B) To the left, cartoon depicting protein and signal from QD in fluorescence (yellow) and electron microscope (blue) images. Note difference between protein epitope recognized by antibody and QD signal position. To the right, example depicting RFL6 fibroblasts fixed and stained with primary antibodies followed by secondary antibodies linked to QDs. QDs identify Cx43 at gap junctions and trafficking intermediates (green) and α-tubulin in microtubules (red). (C) To the left, cartoon depicting genetically encoded MiniSOG, as well as the relative position and signal shape for fluorescence (yellow) and electron microscope (blue) images. To the right, an example showing fluorescence and electron micrographs of HeLa cells expressing miniSOG labeled α-actinin. (D) To the left, cartoon depicting HaloTag labeling of protein as well as position and signal shape for fluorescence (yellow) and electron microscope (blue) images. To the right, an example showing fluorescence and electron micrographs of Hela cell transfected with Palmitoyl-HaloTag-meGFP. (E) Dendrites of medium-size spiny neurons in the rat neostriatum labeled with membrane-targeted GFP and immunolabeled with Cy5 against vesicular glutamate transporter2 (VGluT2; top). After detection by fluorescence microscopy, GFP and VGluT2 immunoreactivities were further developed for focused ion-beam SEM (FIB-SEM) via immunogold/silver enhancement and immunoperoxidase/DAB methods, respectively (bottom). Scale bars: (A) 5 μm to the left and 100 nm to the right; (B) 5 μm; (C) 2 μm to the left and 1 μm to the right; (D) 1 μm to the left and 500 nm to the right; (E) 3 μm. Pictures reprinted with permission from: (A) (Kukulski et al., 2011); (B) (Giepmans et al., 2005); (C) (Shu et al., 2011); (D) (Liss et al., 2015); (E) (Sonomura et al., 2013).
Orthogonal to these approaches, several strategies have emerged that take advantage of singlet oxygen generators. Genetically encoded singlet oxygen generators are of particular relevance for samples that are investigated ‘en block’ (i.e., SBEM and FIB-SEM) and thus preclude post-staining of individual sections. One such example is the genetically encoded miniSOG (Figure 2C), which not only fluoresces when illuminated by blue light, but also yields an osmophilic reaction product by catalyzing the polymerization of 3,3′-Diaminobenzidine (DAB) into electron-dense polymers that are detectable in electron micrographs (Shu et al., 2011). The same strategy is also applicable using the Halo-Tag system, where a modified haloalkene dehalogenase (Los et al., 2008) is used to covalently bind to specific ligands such as tetramethylrhodamine (TMR; Figure 2D). Like miniSOG, TMR fluoresces upon illumination and is visible in EM due to DAB oxidation (Liss et al., 2015). Other self-labeling systems are provided by SNAP/CLIP-tags, in which the enzyme domain is bound to the protein of interest and labeled with a cell–permeable fluorescent ligand (Liss et al., 2015). Finally, cells can also be transfected with APEX, a non-fluorescent peroxidase that withstands strong fixation to yield light-independently EM contrast (Martell et al., 2012). However, considering that the reaction product can diffuse, these approaches may yield best results when staining enclosed structures. Notably, multiple procedures can be combined within a sample for visualization (Figure 2E).
Strategies of Aligning Fluorescence Image and Electron Micrograph in CLEM
Correlation of fluorescence images and electron micrographs can be challenging for a number of reasons. For one, the region of interest can cover less than 0.0004% of the total sample area (Begemann et al., 2015), thus offering only on a limited number of reference points for navigation. And even after the region of interest acquired at the light microscope is found again on the electron microscope, rotation, magnification, and tilting angle still need to be adjusted for image alignment. This is of particular relevance in pre-embedding approaches, where, unlike to post-embedding strategies, the angle of the respective acquisition planes may differ. To tackle these obstacles, several strategies for navigation and image alignment have emerged for in situ and in vitro approaches.
For in situ CLEM, various fiduciary markers have been described that are equally suitable for pre-embedding and post-embedding strategies. In both approaches, the region of interest in the embedded sample is identified using a previously determined set of reference points. Here both, biological (e.g., blood vessels and dirt) and artificial (e.g., silica beads and gold markers) landmarks have proven to be useful for navigation. Once identified, individual EM sections are made and, if desired, 3D reconstruction of individual slices can be prepared by manual or automatic alignment using fiduciary landmarks present in adjacent sections (Bishop et al., 2004; Bock et al., 2011; Lee et al., 2016). Finally, electron micrographs (2D or 3D) are merged with the corresponding fluorescence images either manually or automatically using large features visible in both images (e.g., blood vessels and silica beads) for coarse alignment. For subsequent fine-adjustment, subcellular structures (e.g., gold fiduciary markers, nucleus, and filopodia) can be used. To estimate how accurate the alignment is, cross-correlation analysis between light and electron micrographs can be performed.
In vitro CLEM approaches permit the generation of additional reference systems for image alignment on the plating substrate (i.e., glass and plastic). For example, a unique reference point can be created at the position where the fluorescence image is acquired, using for instance laser etching (Colombelli et al., 2008; Bishop et al., 2011; Urwyler et al., 2015) or a scratching device such as diamond objective markers (Sochacki et al., 2014). Upon processing, this reference point can then be used for navigation on the electron microscope and for subsequent image alignment. Another popular reference system relies on pre-formed structured (Svitkina, 2009; Benedetti et al., 2014) and stochastic (Begemann et al., 2015) micro-patterns or fiducial landmarks (Kukulski et al., 2011) for re-finding the region of interest on the EM as well as subsequent image alignment. Intriguingly, such reference points are not only suitable for manual alignment, but also for software-assisted solutions (Begemann et al., 2015), rendering these approaches an attractive entry point compared to more sophisticated CLEM strategies.
Finally, simultaneous fluorescence and electron imaging may provide an alternative strategy. Here, a number of custom-made (Liv et al., 2013; Nishiyama et al., 2014; Peddie et al., 2014; de Boer et al., 2015) and commercial (e.g., from Fei and Zeiss) instruments have been presented. These instruments, which are equally suitable for in situ and in vitro samples, integrate light- and electron imaging in one apparatus (iCLEM), thus ensuring dual imaging of the region of interest without need of later image alignment. However, as sample preparation for iCLEM is restricted to techniques suitable for parallel LM and EM (Agronskaia et al., 2008), and due to the limited availability of such instruments, iCLEM has not yet reached the optional users.
CLEM–Potential and Limitations
In this review, we have discussed possible combinations for correlating optical and electron microscopy approaches. We mentioned how improvements in imaging techniques, sample preparation, markers, and image alignment have facilitated development of novel CLEM approaches, and showed examples where these strategies were successfully used for structure-function analysis in neurons and synapses. In order to visualize the combinatorial potential, we provide a chart summarizing published CLEM pairings (Figure 3).
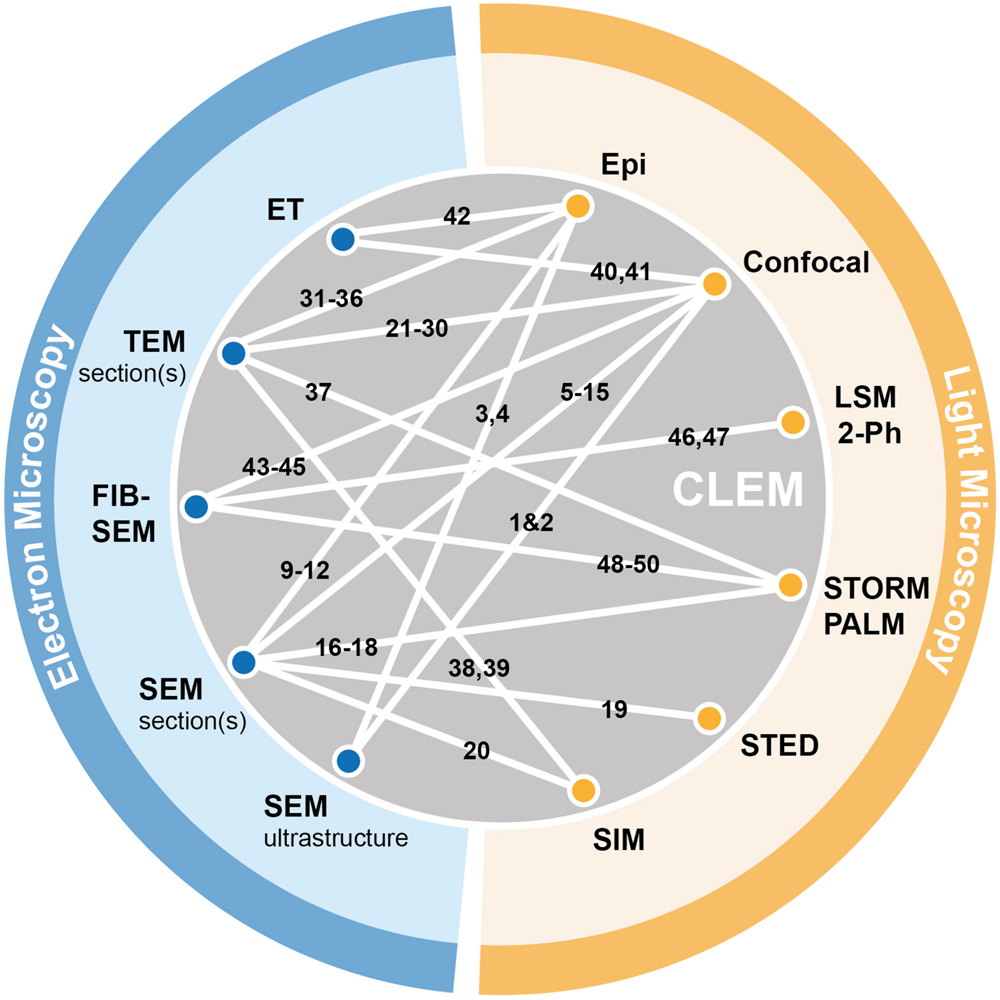
FIGURE 3. Graphical summary of existing CLEM approaches. Electron microscopy (blue) and light-based techniques (yellow) that were successfully combined in correlative approaches are depicted by white lines connecting the respective methods. References corresponding to individual publications using specific CLEM approaches (numbered 1–50) can be found in the Supplementary Materials (Supplementary Table S1).
While correlative approaches have revealed aspects of neuronal and synaptic function that would not have been possible without it, challenges still remain due to the limited temporal and spatial resolution of CLEM. From this perspective, recent work on liquid cell electron microscopy (Ross, 2015), where electron-permeable membranes are used to host aqueous solutions under atmospheric pressure conditions for TEM and SEM imaging (Danilatos et al., 2011; Ominami et al., 2015), cryo-ET to study the supramolecular architecture of cellular structures (Medalia et al., 2002; Beck et al., 2007), and the continuous increase in sophistication and computational power used for image analysis have captured the imagination of people. While it remains elusive whether these and other emerging techniques will merge or replace CLEM-based studies, they are exemplary for an ongoing push toward visualization and comprehensive analysis of biological function on the structural level.
Taken together, the possibilities of applying correlative approaches to study neuronal and synapse function are growing thanks to the continuous progress in techniques, tools and protocols for combining these two types of microscopy. Alas, while correlative approaches in neurobiology have substantially increased in quality and availability, truly artifact-free preparation techniques for precise molecule-localization are yet to be achieved.
Author Contributions
IB and MG conceived the idea, prepared illustrations for publication and wrote the manuscript.
Funding
The authors acknowledge funding from the Cluster of Excellence ‘Cells in Motion’ (DFG, EXC-1003) to IB (PP-2014-04) and MG (FF-2016-03).
Conflict of Interest Statement
The authors declare that the research was conducted in the absence of any commercial or financial relationships that could be construed as a potential conflict of interest.
Acknowledgment
The authors thank members of the Galic and Matis labs for critical reading of the manuscript.
Supplementary Material
The Supplementary Material for this article can be found online at: https://www.frontiersin.org/article/10.3389/fnsyn.2016.00028
References
Abbe (1883). The relation of aperture and power in the microscope. J. R. Microsc. Soc. 3, 790–812. doi: 10.1111/j.1365-2818.1883.tb05956.x
Adams, S. R., Harootunian, A. T., Buechler, Y. J., Taylor, S. S., and Tsien, R. Y. (1991). Fluorescence ratio imaging of cyclic AMP in single cells. Nature 349, 694–697. doi: 10.1038/349694a0
Agronskaia, A. V., Valentijn, J. A., van Driel, L. F., Schneijdenberg, C. T., Humbel, B. M., van Bergen en Henegouwen, P. M., et al. (2008). Integrated fluorescence and transmission electron microscopy. J. Struct. Biol. 164, 183–189. doi: 10.1016/j.jsb.2008.07.003
Akagi, T., Ishida, K., Hanasaka, T., Hayashi, S., Watanabe, M., Hashikawa, T., et al. (2006). Improved methods for ultracryotomy of CNS tissue for ultrastructural and immunogold analyses. J. Neurosci. Methods 153, 276–282. doi: 10.1016/j.jneumeth.2005.11.007
Al Jord, A., Lemaitre, A. I., Delgehyr, N., Faucourt, M., Spassky, N., and Meunier, A. (2014). Centriole amplification by mother and daughter centrioles differs in multiciliated cells. Nature 516, 104–107. doi: 10.1038/nature13770
Alivisatos, A. P. (1996). Semiconductor clusters, nanocrystals, and quantum dots. Science 271, 933–937. doi: 10.1126/science.271.5251.933
Ashkin, A. (1970). Acceleration and trapping of particles by radiation pressure. Phys. Rev. Lett. 24, 156–159. doi: 10.1103/PhysRevLett.24.156
Axelrod, D. (1981). Cell-substrate contacts illuminated by total internal reflection fluorescence. J. Cell Biol. 89, 141–145. doi: 10.1083/jcb.89.1.141
Banker, G. A., and Cowan, W. M. (1977). Rat hippocampal neurons in dispersed cell culture. Brain Res. 126, 297–342. doi: 10.1016/0006-8993(77)90594-7
Beck, M., Lucic, V., Forster, F., Baumeister, W., and Medalia, O. (2007). Snapshots of nuclear pore complexes in action captured by cryo-electron tomography. Nature 449, 611–615. doi: 10.1038/nature06170
Begemann, I., Viplav, A., Rasch, C., and Galic, M. (2015). Stochastic micro-pattern for automated correlative fluorescence – scanning electron microscopy. Sci. Rep. 5, 17973. doi: 10.1038/srep17973
Benedetti, L., Sogne, E., Rodighiero, S., Marchesi, D., Milani, P., and Francolini, M. (2014). Customized patterned substrates for highly versatile correlative light-scanning electron microscopy. Sci. Rep. 4, 7033. doi: 10.1038/srep07033
Betzig, E., and Chichester, R. J. (1993). Single molecules observed by near-field scanning optical microscopy. Science 262, 1422–1425. doi: 10.1126/science.262.5138.1422
Betzig, E., Patterson, G. H., Sougrat, R., Lindwasser, O. W., Olenych, S., Bonifacino, J. S., et al. (2006). Imaging intracellular fluorescent proteins at nanometer resolution. Science 313, 1642–1645. doi: 10.1126/science.1127344
Bishop, D., Nikic, I., Brinkoetter, M., Knecht, S., Potz, S., Kerschensteiner, M., et al. (2011). Near-infrared branding efficiently correlates light and electron microscopy. Nat. Methods 8, 568–570. doi: 10.1038/nmeth.1622
Bishop, D. L., Misgeld, T., Walsh, M. K., Gan, W. B., and Lichtman, J. W. (2004). Axon branch removal at developing synapses by axosome shedding. Neuron 44, 651–661. doi: 10.1016/j.neuron.2004.10.026
Blazquez-Llorca, L., Hummel, E., Zimmerman, H., Zou, C., Burgold, S., Rietdorf, J., et al. (2015). Correlation of two-photon in vivo imaging and FIB/SEM microscopy. J. Microsc. 259, 129–136. doi: 10.1111/jmi.12231
Bock, D. D., Lee, W. C., Kerlin, A. M., Andermann, M. L., Hood, G., Wetzel, A. W., et al. (2011). Network anatomy and in vivo physiology of visual cortical neurons. Nature 471, 177–182. doi: 10.1038/nature09802
Bosch, C., Martinez, A., Masachs, N., Teixeira, C. M., Fernaud, I., Ulloa, F., et al. (2015). FIB/SEM technology and high-throughput 3D reconstruction of dendritic spines and synapses in GFP-labeled adult-generated neurons. Front. Neuroanat. 9:60. doi: 10.3389/fnana.2015.00060
Boyden, E. S., Zhang, F., Bamberg, E., Nagel, G., and Deisseroth, K. (2005). Millisecond-timescale, genetically targeted optical control of neural activity. Nat. Neurosci. 8, 1263–1268. doi: 10.1038/nn1525
Briggman, K. L., and Bock, D. D. (2012). Volume electron microscopy for neuronal circuit reconstruction. Curr. Opin. Neurobiol. 22, 154–161. doi: 10.1016/j.conb.2011.10.022
Briggman, K. L., Helmstaedter, M., and Denk, W. (2011). Wiring specificity in the direction-selectivity circuit of the retina. Nature 471, 183–188. doi: 10.1038/nature09818
Brown, E., and Verkade, P. (2010). The use of markers for correlative light electron microscopy. Protoplasma 244, 91–97. doi: 10.1007/s00709-010-0165-1
Cao, C., Lu, S., Kivlin, R., Wallin, B., Card, E., Bagdasarian, A., et al. (2008). AMP-activated protein kinase contributes to UV- and H2O2-induced apoptosis in human skin keratinocytes. J. Biol. Chem. 283, 28897–28908. doi: 10.1074/jbc.M804144200
Castejon, O. J. (1996). Contribution of conventional and high resolution scanning electron microscopy and cryofracture technique to the study of cerebellar synaptic junctions. Scanning Microsc. 10, 177–186.
Castejon, O. J., and Caraballo, A. J. (1980). Application of cryofracture and SEM to the study of human cerebellar cortex. Scan. Electron Microsc. 4, 197–207.
Chalfie, M., Tu, Y., Euskirchen, G., Ward, W. W., and Prasher, D. C. (1994). Green fluorescent protein as a marker for gene expression. Science 263, 802–805. doi: 10.1126/science.8303295
Chang, Y. C., Yang, C. Y., Sun, R. L., Cheng, Y. F., Kao, W. C., and Yang, P. C. (2013). Rapid single cell detection of Staphylococcus aureus by aptamer-conjugated gold nanoparticles. Sci. Rep. 3, 1863. doi: 10.1038/srep01863
Collman, F., Buchanan, J., Phend, K. D., Micheva, K. D., Weinberg, R. J., and Smith, S. J. (2015). Mapping synapses by conjugate light-electron array tomography. J. Neurosci. 35, 5792–5807. doi: 10.1523/JNEUROSCI.4274-14.2015
Colombelli, J., Tangemo, C., Haselman, U., Antony, C., Stelzer, E. H., Pepperkok, R., et al. (2008). A correlative light and electron microscopy method based on laser micropatterning and etching. Methods Mol. Biol. 457, 203–213. doi: 10.1007/978-1-59745-261-8_15
Combs, C. A. (2010). Fluorescence microscopy: a concise guide to current imaging methods. Curr. Protoc. Neurosci. Chapter 2, Unit2.1. doi: 10.1002/0471142301.ns0201s50
Crewe, A. V., Wall, J., and Langmore, J. (1970). Visibility of single atoms. Science 168, 1338–1340. doi: 10.1126/science.168.3937.1338
Crowther, R. A., Derosier, D. J., and Klug, A. (1970). Reconstruction of 3 dimensional structure from projections and its application to electron microscopy. Proc. R. Soc. Lond. A 317, 319–340. doi: 10.1098/rspa.1970.0119
Dahl, R., and Staehelin, L. A. (1989). High-pressure freezing for the preservation of biological structure – theory and practice. J. Electron Microsc. Tech. 13, 165–174. doi: 10.1002/jemt.1060130305
Danilatos, G., Rattenberger, J., and Dracopoulos, V. (2011). Beam transfer characteristics of a commercial environmental SEM and a low vacuum SEM. J. Microsc. 242, 166–180. doi: 10.1111/j.1365-2818.2010.03455.x
Davila, H. V., Salzberg, B. M., Cohen, L. B., and Waggoner, A. S. (1973). A large change in axon fluorescence that provides a promising method for measuring membrane potential. Nat. New Biol. 241, 159–160. doi: 10.1038/newbio241159a0
de Boer, P., Hoogenboom, J. P., and Giepmans, B. N. (2015). Correlated light and electron microscopy: ultrastructure lights up! Nat. Methods 12, 503–513. doi: 10.1038/nmeth.3400
De Rosier, D. J., and Klug, A. (1968). Reconstruction of three dimensional structures from electron micrographs. Nature 217, 130–134. doi: 10.1038/217130a0
Deerinck, T. J., Martone, M. E., Lev-Ram, V., Green, D. P., Tsien, R. Y., Spector, D. L., et al. (1994). Fluorescence photooxidation with eosin: a method for high resolution immunolocalization and in situ hybridization detection for light and electron microscopy. J. Cell Biol. 126, 901–910. doi: 10.1083/jcb.126.4.901
DeKosky, S. T., and Scheff, S. W. (1990). Synapse loss in frontal cortex biopsies in Alzheimer’s disease: correlation with cognitive severity. Ann. Neurol. 27, 457–464. doi: 10.1002/ana.410270502
Denk, W., and Horstmann, H. (2004). Serial block-face scanning electron microscopy to reconstruct three-dimensional tissue nanostructure. PLoS Biol. 2:e329. doi: 10.1371/journal.pbio.0020329
Denk, W., Strickler, J. H., and Webb, W. W. (1990). Two-photon laser scanning fluorescence microscopy. Science 248, 73–76. doi: 10.1126/science.2321027
Derobertis, E. D. P., and Bennett, H. S. (1955). Some features of the submicroscopic morphology of synapses in frog and earthworm. J. Biophys. Biochem. Cytol. 1, 47–58. doi: 10.1083/jcb.1.1.47
Desaki, J., and Uehara, Y. (1981). The overall morphology of neuromuscular junctions as revealed by scanning electron microscopy. J. Neurocytol. 10, 101–110. doi: 10.1007/BF01181747
Ellis-Davies, G. C. (2011). A practical guide to the synthesis of dinitroindolinyl-caged neurotransmitters. Nat. Protoc. 6, 314–326. doi: 10.1038/nprot.2010.193
Ellisdavies, G. C. R., and Kaplan, J. H. (1994). Nitrophenyl-Egta, a photolabile chelator that selectively binds Ca2+ with high-affinity and releases it rapidly upon photolysis. Proc. Natl. Acad. Sci. U.S.A. 91, 187–191. doi: 10.1073/pnas.91.1.187
Engel, A. (1978). The STEM: an attractive tool for the biologist. Ultramicroscopy 3, 355–357. doi: 10.1016/S0304-3991(78)80052-7
Engelbrecht, C. J., and Stelzer, E. H. (2006). Resolution enhancement in a light-sheet-based microscope (SPIM). Opt. Lett. 31, 1477–1479. doi: 10.1364/OL.31.001477
Ercius, P., Alaidi, O., Rames, M. J., and Ren, G. (2015). Electron tomography: a three-dimensional analytic tool for hard and soft materials research. Adv. Mater. 27, 5638–5663. doi: 10.1002/adma.201501015
Erni, R., Rossell, M. D., Kisielowski, C., and Dahmen, U. (2009). Atomic-resolution imaging with a sub-50-pm electron probe. Phys. Rev. Lett. 102, 096101. doi: 10.1103/PhysRevLett.102.096101
Fares, M. B., Maco, B., Oueslati, A., Rockenstein, E., Ninkina, N., Buchman, V. L., et al. (2016). Induction of de novo alpha-synuclein fibrillization in a neuronal model for Parkinson’s disease. Proc. Natl. Acad. Sci. U.S.A. 113, E912–E921. doi: 10.1073/pnas.1512876113
Fenno, L., Yizhar, O., and Deisseroth, K. (2011). The development and application of optogenetics. Annu. Rev. Neurosci. 34, 389–412. doi: 10.1146/annurev-neuro-061010-113817
Fifkova, E., and Delay, R. J. (1982). Cytoplasmic actin in neuronal processes as a possible mediator of synaptic plasticity. J. Cell Biol. 95, 345–350. doi: 10.1083/jcb.95.1.345
Galic, M., Jeong, S., Tsai, F. C., Joubert, L. M., Wu, Y. I., Hahn, K. M., et al. (2012). External push and internal pull forces recruit curvature-sensing N-BAR domain proteins to the plasma membrane. Nat. Cell Biol. 14, 874–881. doi: 10.1038/ncb2533
Galic, M., Tsai, F. C., Collins, S. R., Matis, M., Bandara, S., and Meyer, T. (2014). Dynamic recruitment of the curvature-sensitive protein ArhGAP44 to nanoscale membrane deformations limits exploratory filopodia initiation in neurons. Elife 3, e03116. doi: 10.7554/eLife.03116
Giepmans, B. N., Deerinck, T. J., Smarr, B. L., Jones, Y. Z., and Ellisman, M. H. (2005). Correlated light and electron microscopic imaging of multiple endogenous proteins using Quantum dots. Nat. Methods 2, 743–749. doi: 10.1038/nmeth791
Gray, E. G. (1959). Axo-somatic and axo-dendritic synapses of the cerebral cortex: an electron microscope study. J. Anat. 93, 420–433.
Harris, K. M., Perry, E., Bourne, J., Feinberg, M., Ostroff, L., and Hurlburt, J. (2006). Uniform serial sectioning for transmission electron microscopy. J. Neurosci. 26, 12101–12103. doi: 10.1523/JNEUROSCI.3994-06.2006
Hayworth, K. J., Kasthuri, N., Schalek, R., and Lichtman, J. (2006). Automating the collection of ultrathin serial sections for large volume TEM reconstructions. Microsc. Microanal. 12, 86–87. doi: 10.1017/S1431927606066268
Hayworth, K. J., Morgan, J. L., Schalek, R., Berger, D. R., Hildebrand, D. G., and Lichtman, J. W. (2014). Imaging ATUM ultrathin section libraries with WaferMapper: a multi-scale approach to EM reconstruction of neural circuits. Front. Neural Circuits 8:68. doi: 10.3389/fncir.2014.00068
Heim, R., Prasher, D. C., and Tsien, R. Y. (1994). Wavelength mutations and posttranslational autoxidation of green fluorescent protein. Proc. Natl. Acad. Sci. U.S.A. 91, 12501–12504. doi: 10.1073/pnas.91.26.12501
Hell, S. W., and Wichmann, J. (1994). Breaking the diffraction resolution limit by stimulated emission: stimulated-emission-depletion fluorescence microscopy. Opt. Lett. 19, 780–782. doi: 10.1364/OL.19.000780
Heuser, J. E., and Reese, T. S. (1973). Evidence for recycling of synaptic vesicle membrane during transmitter release at the frog neuromuscular junction. J. Cell Biol. 57, 315–344. doi: 10.1083/jcb.57.2.315
Heuser, J. E., Reese, T. S., and Landis, D. M. (1976). Preservation of synaptic structure by rapid freezing. Cold Spring Harb. Symp. Quant. Biol. 40, 17–24. doi: 10.1101/SQB.1976.040.01.004
Heuser, J. E., and Salpeter, S. R. (1979). Organization of acetylcholine receptors in quick-frozen, deep-etched, and rotary-replicated Torpedo postsynaptic membrane. J. Cell Biol. 82, 150–173. doi: 10.1083/jcb.82.1.150
Hollander, H. (1970). The section embedding (SE) technique. A new method for the combined light microscopic and electron microscopic examination of central nervous tissue. Brain Res. 20, 39–47.
Hoppe, W., Gassmann, J., Hunsmann, N., Schramm, H. J., and Sturm, M. (1974). 3-dimensional reconstruction of individual negatively stained yeast fatty-acid synthetase molecules from tilt series in electron-microscope. Hoppe Seylers Z. Physiol. Chem. 355, 1483–1487.
Huang, B., Babcock, H., and Zhuang, X. (2010). Breaking the diffraction barrier: super-resolution imaging of cells. Cell 143, 1047–1058. doi: 10.1016/j.cell.2010.12.002
Hunziker, E. B., Herrmann, W., Schenk, R. K., Mueller, M., and Moor, H. (1984). Cartilage ultrastructure after high pressure freezing, freeze substitution, and low temperature embedding. I. Chondrocyte ultrastructure–implications for the theories of mineralization and vascular invasion. J. Cell Biol. 98, 267–276.
Javier, D. J., Nitin, N., Levy, M., Ellington, A., and Richards-Kortum, R. (2008). Aptamer-targeted gold nanoparticles as molecular-specific contrast agents for reflectance imaging. Bioconjug. Chem. 19, 1309–1312. doi: 10.1021/bc8001248
Kandela, I. K., and Albrecht, R. M. (2007). Fluorescence quenching by colloidal heavy metals nanoparticles: implications for correlative fluorescence and electron microscopy studies. Scanning 29, 152–161. doi: 10.1002/sca.20055
Kandela, I. K., Bleher, R., and Albrecht, R. M. (2007). Multiple correlative immunolabeling for light and electron microscopy using fluorophores and colloidal metal particles. J. Histochem. Cytochem. 55, 983–990. doi: 10.1369/jhc.6A7124.2007
Kasthuri, N., Hayworth, K., Lichtman, J., Erdman, N., and Ackerley, C. A. (2007). New technique for ultra-thin serial brain section imaging using scanning electron microscopy. Microsc. Microanal. 13, 26–27. doi: 10.1017/S1431927607078002
Kasthuri, N., Hayworth, K. J., Berger, D. R., Schalek, R. L., Conchello, J. A., Knowles-Barley, S., et al. (2015). Saturated reconstruction of a volume of neocortex. Cell 162, 648–661. doi: 10.1016/j.cell.2015.06.054
Keller, P. J., Schmidt, A. D., Wittbrodt, J., and Stelzer, E. H. (2008). Reconstruction of zebrafish early embryonic development by scanned light sheet microscopy. Science 322, 1065–1069. doi: 10.1126/science.1162493
Kilgore, J. A., Dolman, N. J., and Davidson, M. W. (2013). A review of reagents for fluorescence microscopy of cellular compartments and structures, Part II: reagents for non-vesicular organelles. Curr. Protoc. Cytom. 66, Unit 12.31. doi: 10.1002/0471142956.cy1231s66
Kim, D., Deerinck, T. J., Sigal, Y. M., Babcock, H. P., Ellisman, M. H., and Zhuang, X. (2015). Correlative stochastic optical reconstruction microscopy and electron microscopy. PLoS ONE 10:e0124581. doi: 10.1371/journal.pone.0124581
Klar, T. A., Engel, E., and Hell, S. W. (2001). Breaking Abbe’s diffraction resolution limit in fluorescence microscopy with stimulated emission depletion beams of various shapes. Phys. Rev. E Stat. Nonlin. Soft. Matter. Phys. 64, 066613. doi: 10.1103/PhysRevE.64.066613
Knott, G., Marchman, H., Wall, D., and Lich, B. (2008). Serial section scanning electron microscopy of adult brain tissue using focused ion beam milling. J. Neurosci. 28(Pt. 20), 2959–2964. doi: 10.1523/JNEUROSCI.3189-07.2008
Kopek, B. G., Shtengel, G., Xu, C. S., Clayton, D. A., and Hess, H. F. (2012). Correlative 3D superresolution fluorescence and electron microscopy reveal the relationship of mitochondrial nucleoids to membranes. Proc. Natl. Acad. Sci. U.S.A. 109, 6136–6141. doi: 10.1073/pnas.1121558109
Kuipers, J., de Boer, P., and Giepmans, B. N. (2015). Scanning EM of non-heavy metal stained biosamples: large-field of view, high contrast and highly efficient immunolabeling. Exp. Cell Res. 337, 202–207. doi: 10.1016/j.yexcr.2015.07.012
Kukulski, W., Schorb, M., Welsch, S., Picco, A., Kaksonen, M., and Briggs, J. A. (2011). Correlated fluorescence and 3D electron microscopy with high sensitivity and spatial precision. J. Cell Biol. 192, 111–119. doi: 10.1083/jcb.201009037
Kuwajima, M., Mendenhall, J. M., Lindsey, L. F., and Harris, K. M. (2013). Automated transmission-mode scanning electron microscopy (tSEM) for large volume analysis at nanoscale resolution. PLoS ONE 8:e59573. doi: 10.1371/journal.pone.0059573
Landis, D. M. D., and Reese, T. S. (1983). Cytoplasmic organization in cerebellar dendritic spines. J. Cell Biol. 97, 1169–1178. doi: 10.1083/jcb.97.4.1169
Lang, T. (2003). Imaging SNAREs at work in ‘unroofed’ cells–approaches that may be of general interest for functional studies on membrane proteins. Biochem. Soc. Trans. 31, 861–864. doi: 10.1042/bst0310861
Lee, W. C., Bonin, V., Reed, M., Graham, B. J., Hood, G., Glattfelder, K., et al. (2016). Anatomy and function of an excitatory network in the visual cortex. Nature 532, 370–374. doi: 10.1038/nature17192
Lehmann, T., Hess, M., Wanner, G., and Melzer, R. R. (2014). Dissecting a neuron network: FIB-SEM-based 3D-reconstruction of the visual neuropils in the sea spider Achelia langi (Dohrn, 1881) (Pycnogonida). BMC Biol. 12:59. doi: 10.1186/s12915-014-0059-3
Leighton, S. B. (1981). SEM images of block faces, cut by a miniature microtome within the SEM – a technical note. Scan. Electron Microsc. 233, 73–76.
Lenzi, D., Runyeon, J. W., Crum, J., Ellisman, M. H., and Roberts, W. M. (1999). Synaptic vesicle populations in saccular hair cells reconstructed by electron tomography. J. Neurosci. 19, 119–132.
Lichtman, J. W., and Conchello, J. A. (2005). Fluorescence microscopy. Nat. Methods 2, 910–919. doi: 10.1038/nmeth817
Liss, V., Barlag, B., Nietschke, M., and Hensel, M. (2015). Self-labelling enzymes as universal tags for fluorescence microscopy, super-resolution microscopy and electron microscopy. Sci. Rep. 5, 17740. doi: 10.1038/srep17740
Liv, N., Zonnevylle, A. C., Narvaez, A. C., Effting, A. P., Voorneveld, P. W., Lucas, M. S., et al. (2013). Simultaneous correlative scanning electron and high-NA fluorescence microscopy. PLoS ONE 8:e55707. doi: 10.1371/journal.pone.0055707
Livet, J., Weissman, T. A., Kang, H., Draft, R. W., Lu, J., Bennis, R. A., et al. (2007). Transgenic strategies for combinatorial expression of fluorescent proteins in the nervous system. Nature 450, 56–62. doi: 10.1038/nature06293
Los, G. V., Encell, L. P., McDougall, M. G., Hartzell, D. D., Karassina, N., Zimprich, C., et al. (2008). HaloTag: a novel protein labeling technology for cell imaging and protein analysis. ACS Chem. Biol. 3, 373–382. doi: 10.1021/cb800025k
Maco, B., Holtmaat, A., Cantoni, M., Kreshuk, A., Straehle, C. N., Hamprecht, F. A., et al. (2013). Correlative in vivo 2 photon and focused ion beam scanning electron microscopy of cortical neurons. PLoS ONE 8:e57405. doi: 10.1371/journal.pone.0057405
Martell, J. D., Deerinck, T. J., Sancak, Y., Poulos, T. L., Mootha, V. K., Sosinsky, G. E., et al. (2012). Engineered ascorbate peroxidase as a genetically encoded reporter for electron microscopy. Nat. Biotechnol. 30, 1143–1148. doi: 10.1038/nbt.2375
Medalia, O., Weber, I., Frangakis, A. S., Nicastro, D., Gerisch, G., and Baumeister, W. (2002). Macromolecular architecture in eukaryotic cells visualized by cryoelectron tomography. Science 298, 1209–1213. doi: 10.1126/science.1076184
Merchan-Perez, A., Rodriguez, J. R., Alonso-Nanclares, L., Schertel, A., and Defelipe, J. (2009). Counting Synapses Using FIB/SEM microscopy: a true revolution for ultrastructural volume reconstruction. Front. Neuroanat. 3:18. doi: 10.3389/neuro.05.018.2009
Micheva, K. D., and Smith, S. J. (2007). Array tomography: a new tool for imaging the molecular architecture and ultrastructure of neural circuits. Neuron 55, 25–36. doi: 10.1016/j.neuron.2007.06.014
Miesenbock, G., De Angelis, D. A., and Rothman, J. E. (1998). Visualizing secretion and synaptic transmission with pH-sensitive green fluorescent proteins. Nature 394, 192–195. doi: 10.1038/28190
Minsky, M. (1988). Memoir on inventing the confocal scanning microscope. Scanning 10, 128–138. doi: 10.1002/sca.4950100403
Minta, A., and Tsien, R. Y. (1989). Fluorescent indicators for cytosolic sodium. J. Biol. Chem. 264, 19449–19457.
Miranda, K., Girard-Dias, W., Attias, M., de Souza, W., and Ramos, I. (2015). Three dimensional reconstruction by electron microscopy in the life sciences: an introduction for cell and tissue biologists. Mol. Reprod. Dev. 82, 530–547. doi: 10.1002/mrd.22455
Mishchenko, Y., Hu, T., Spacek, J., Mendenhall, J., Harris, K. M., and Chklovskii, D. B. (2010). Ultrastructural analysis of hippocampal neuropil from the connectomics perspective. Neuron 67, 1009–1020. doi: 10.1016/j.neuron.2010.08.014
Morgan, J. L., Berger, D. R., Wetzel, A. W., and Lichtman, J. W. (2016). The fuzzy logic of network connectivity in mouse visual Thalamus. Cell 165, 192–206. doi: 10.1016/j.cell.2016.02.033
Muller-Reichert, T., and Verkade, P. (2014). Preface. Correlative light and electron microscopy II. Methods Cell Biol. 124, xvii–xviii. doi: 10.1016/B978-0-12-801075-4.09983-3
Nakai, J., Ohkura, M., and Imoto, K. (2001). A high signal-to-noise Ca(2+) probe composed of a single green fluorescent protein. Nat. Biotechnol. 19, 137–141. doi: 10.1038/84397
Nakai, Y., and Iwashita, T. (1976). Correlative light and electron microscopy of the frog adrenal gland cells using adjacent epon-embedded sections. Arch. Histol. Jpn. 39, 183–191. doi: 10.1679/aohc1950.39.183
Navlakha, S., Suhan, J., Barth, A. L., and Bar-Joseph, Z. (2013). A high-throughput framework to detect synapses in electron microscopy images. Bioinformatics 29, i9–i17. doi: 10.1093/bioinformatics/btt222
Neil, M. A., Juskaitis, R., and Wilson, T. (1997). Method of obtaining optical sectioning by using structured light in a conventional microscope. Opt. Lett. 22, 1905–1907. doi: 10.1364/OL.22.001905
Nishiyama, H., Koizumi, M., Ogawa, K., Kitamura, S., Konyuba, Y., Watanabe, Y., et al. (2014). Atmospheric scanning electron microscope system with an open sample chamber: configuration and applications. Ultramicroscopy 147, 86–97. doi: 10.1016/j.ultramic.2014.06.001
Ominami, Y., Kawanishi, S., Ushiki, T., and Ito, S. (2015). A novel approach to scanning electron microscopy at ambient atmospheric pressure. Microscopy 64, 97–104. doi: 10.1093/jmicro/dfu107
Osamura, R. Y., Itoh, Y., and Matsuno, A. (2000). Applications of plastic embedding to electron microscopic immunocytochemistry and in situ hybridization in observations of production and secretion of peptide hormones. J. Histochem. Cytochem. 48, 885–891. doi: 10.1177/002215540004800701
Paez-Segala, M. G., Sun, M. G., Shtengel, G., Viswanathan, S., Baird, M. A., Macklin, J. J., et al. (2015). Fixation-resistant photoactivatable fluorescent proteins for CLEM. Nat. Methods 12, 215–218. doi: 10.1038/nmeth.3225
Pappas, G. D., and Bennett, M. V. L. (1966). Specialized junctions involved in electrical transmission between neurons. Ann. N. Y. Acad. Sci. 137, 495–508. doi: 10.1111/j.1749-6632.1966.tb50177.x
Peddie, C. J., Blight, K., Wilson, E., Melia, C., Marrison, J., Carzaniga, R., et al. (2014). Correlative and integrated light and electron microscopy of in-resin GFP fluorescence, used to localise diacylglycerol in mammalian cells. Ultramicroscopy 143, 3–14. doi: 10.1016/j.ultramic.2014.02.001
Penczek, P. A. (2010). Fundamentals of three-dimensional reconstruction from projections. Methods Enzymol. 482, 1–33. doi: 10.1016/S0076-6879(10)82001-4
Perkins, G. A., Jackson, D. R., and Spirou, G. A. (2015). Resolving presynaptic structure by electron tomography. Synapse 69, 268–282. doi: 10.1002/syn.21813
Phend, K. D., Rustioni, A., and Weinberg, R. J. (1995). An osmium-free method of epon embedment that preserves both ultrastructure and antigenicity for post-embedding immunocytochemistry. J. Histochem. Cytochem. 43, 283–292. doi: 10.1177/43.3.7532656
Pierce, L., and Buseck, P. R. (1974). Electron imaging of pyrrhotite superstructures. Science 186, 1209–1212. doi: 10.1126/science.186.4170.1209
Porter, K. R., Claude, A., and Fullam, E. F. (1945). A study of tissue culture cells by electron microscopy: methods and preliminary observations. J. Exp. Med. 81, 233–246. doi: 10.1084/jem.81.3.233
Rah, J. C., Bas, E., Colonell, J., Mishchenko, Y., Karsh, B., Fetter, R. D., et al. (2013). Thalamocortical input onto layer 5 pyramidal neurons measured using quantitative large-scale array tomography. Front. Neural Circuits 7:177. doi: 10.3389/fncir.2013.00177
Rayleigh (1879). Investigations in optics, with special reference to the spectroscope. Phil. Mag. 8, 261–274. doi: 10.1080/14786447908639715
Ries, J., Kaplan, C., Platonova, E., Eghlidi, H., and Ewers, H. (2012). A simple, versatile method for GFP-based super-resolution microscopy via nanobodies. Nat. Methods 9, 582–584. doi: 10.1038/nmeth.1991
Ross, F. M. (2015). Opportunities and challenges in liquid cell electron microscopy. Science 350, aaa9886. doi: 10.1126/science.aaa9886
Rost, B. R., Schneider, F., Grauel, M. K., Wozny, C., Bentz, C. G., Blessing, A., et al. (2015). Optogenetic acidification of synaptic vesicles and lysosomes. Nat. Neurosci. 18, 1845–1852. doi: 10.1038/nn.4161
Ruska, E. (1987). Nobel lecture. The development of the electron microscope and of electron microscopy. Biosci. Rep. 7, 607–629.
Rust, M. J., Bates, M., and Zhuang, X. W. (2006). Sub-diffraction-limit imaging by stochastic optical reconstruction microscopy (STORM). Nat. Methods 3, 793–795. doi: 10.1038/nmeth929
Shimomura, O., Johnson, F. H., and Saiga, Y. (1962). Extraction, purification and properties of aequorin, a bioluminescent protein from the luminous hydromedusan, Aequorea. J. Cell Comp. Physiol. 59, 223–239. doi: 10.1002/jcp.1030590302
Shu, X., Lev-Ram, V., Deerinck, T. J., Qi, Y., Ramko, E. B., Davidson, M. W., et al. (2011). A genetically encoded tag for correlated light and electron microscopy of intact cells, tissues, and organisms. PLoS Biol. 9:e1001041. doi: 10.1371/journal.pbio.1001041
Shui, B., Ozer, A., Zipfel, W., Sahu, N., Singh, A., Lis, J. T., et al. (2012). RNA aptamers that functionally interact with green fluorescent protein and its derivatives. Nucleic Acids Res. 40, e39. doi: 10.1093/nar/gkr1264
Siegel, M. S., and Isacoff, E. Y. (1997). A genetically encoded optical probe of membrane voltage. Neuron 19, 735–741. doi: 10.1016/S0896-6273(00)80955-1
Sochacki, K. A., Shtengel, G., van Engelenburg, S. B., Hess, H. F., and Taraska, J. W. (2014). Correlative super-resolution fluorescence and metal-replica transmission electron microscopy. Nat. Methods 11, 305–308. doi: 10.1038/nmeth.2816
Sonomura, T., Furuta, T., Nakatani, I., Yamamoto, Y., Unzai, T., Matsuda, W., et al. (2013). Correlative analysis of immunoreactivity in confocal laser-scanning microscopy and scanning electron microscopy with focused ion beam milling. Front. Neural Circuits 7:26. doi: 10.3389/fncir.2013.00026
Stauffer, T. P., Ahn, S., and Meyer, T. (1998). Receptor-induced transient reduction in plasma membrane PtdIns(4,5)P2 concentration monitored in living cells. Curr. Biol. 8, 343–346. doi: 10.1016/S0960-9822(98)70135-6
Svitkina, T. (2009). Imaging cytoskeleton components by electron microscopy. Methods Mol. Biol. 586, 187–206. doi: 10.1007/978-1-60761-376-3_10
Svitkina, T. M., Verkhovsky, A. B., and Borisy, G. G. (1995). Improved procedures for electron microscopic visualization of the cytoskeleton of cultured cells. J. Struct. Biol. 115, 290–303. doi: 10.1006/jsbi.1995.1054
Szczesny, P. J., Walther, P., and Muller, M. (1996). Light damage in rod outer segments: the effects of fixation on ultrastructural alterations. Curr. Eye. Res. 15, 807–814. doi: 10.3109/02713689609017621
Tanasugarn, L., McNeil, P., Reynolds, G. T., and Taylor, D. L. (1984). Microspectrofluorometry by digital image processing: measurement of cytoplasmic pH. J. Cell Biol. 98, 717–724. doi: 10.1083/jcb.98.2.717
Terasaki, M., Shemesh, T., Kasthuri, N., Klemm, R. W., Schalek, R., Hayworth, K. J., et al. (2013). Stacked endoplasmic reticulum sheets are connected by helicoidal membrane motifs. Cell 154, 285–296. doi: 10.1016/j.cell.2013.06.031
Tischer, D., and Weiner, O. D. (2014). Illuminating cell signalling with optogenetic tools. Nat. Rev. Mol. Cell Biol. 15, 551–558. doi: 10.1038/nrm3837
Tocheva, E. I., Li, Z., and Jensen, G. J. (2010). Electron cryotomography. Cold Spring Harb. Perspect. Biol. 2, a003442. doi: 10.1101/cshperspect.a003442
Tsien, R. Y. (1980). New calcium indicators and buffers with high selectivity against magnesium and protons: design, synthesis, and properties of prototype structures. Biochemistry 19, 2396–2404. doi: 10.1021/bi00552a018
Tsien, R. Y. (1981). A non-disruptive technique for loading calcium buffers and indicators into cells. Nature 290, 527–528. doi: 10.1038/290527a0
Tsien, R. Y., Pozzan, T., and Rink, T. J. (1982). Calcium homeostasis in intact lymphocytes: cytoplasmic free calcium monitored with a new, intracellularly trapped fluorescent indicator. J. Cell Biol. 94, 325–334. doi: 10.1083/jcb.94.2.325
Urwyler, O., Izadifar, A., Dascenco, D., Petrovic, M., He, H. H., Ayaz, D., et al. (2015). Investigating CNS synaptogenesis at single-synapse resolution by combining reverse genetics with correlative light and electron microscopy. Development 142, 394–405. doi: 10.1242/dev.115071
Van de Broek, B., Devoogdt, N., D’Hollander, A., Gijs, H. L., Jans, K., Lagae, L., et al. (2011). Specific cell targeting with nanobody conjugated branched gold nanoparticles for photothermal therapy. ACS Nano 5, 4319–4328. doi: 10.1021/nn1023363
van Donselaar, E., Posthuma, G., Zeuschner, D., Humbel, B. M., and Slot, J. W. (2007). Immunogold labeling of cryosections from high-pressure frozen cells. Traffic 8, 471–485. doi: 10.1111/j.1600-0854.2007.00552.x
Vernon-Parry, K. D. (2000). Scanning electron microscopy: an Introduction. III-Vs Rev. 13, 40–44. doi: 10.1016/S0961-1290(00)80006-X
Wang, S. S. H., and Augustine, G. J. (1995). Confocal imaging and local photolysis of caged compounds – dual probes of synaptic function. Neuron 15, 755–760. doi: 10.1016/0896-6273(95)90167-1
Watanabe, S., Liu, Q., Davis, M. W., Hollopeter, G., Thomas, N., Jorgensen, N. B., et al. (2013). Ultrafast endocytosis at Caenorhabditis elegans neuromuscular junctions. Elife 2, e00723. doi: 10.7554/eLife.00723
Watanabe, S., Punge, A., Hollopeter, G., Willig, K. I., Hobson, R. J., Davis, M. W., et al. (2011). Protein localization in electron micrographs using fluorescence nanoscopy. Nat. Methods 8, 80–84. doi: 10.1038/nmeth.1537
Watanabe, S., Trimbuch, T., Camacho-Perez, M., Rost, B. R., Brokowski, B., Sohl-Kielczynski, B., et al. (2014). Clathrin regenerates synaptic vesicles from endosomes. Nature 515, 228–233. doi: 10.1038/nature13846
Watkins, R. E. J., Rockett, P., Thoms, S., Clampitt, R., and Syms, R. (1986). Focused ion-beam milling. Vacuum 36, 961–967. doi: 10.1016/0042-207x(86)90148-X
White, J. G., Southgate, E., Thomson, J. N., and Brenner, S. (1986). The structure of the nervous system of the nematode Caenorhabditis elegans. Philos. Trans. R. Soc. Lond. B Biol. Sci. 314, 1–340. doi: 10.1098/rstb.1986.0056
Zhang, H., and Liu, K. K. (2008). Optical tweezers for single cells. J. R. Soc. Interface 5, 671–690. doi: 10.1098/rsif.2008.0052
Keywords: correlative light electron microscopy, CLEM, synapse, neuron, fluorescence microscopy, electron microscopy, TEM, SEM
Citation: Begemann I and Galic M (2016) Correlative Light Electron Microscopy: Connecting Synaptic Structure and Function. Front. Synaptic Neurosci. 8:28. doi: 10.3389/fnsyn.2016.00028
Received: 23 March 2016; Accepted: 12 August 2016;
Published: 23 August 2016.
Edited by:
Marc Fivaz, Duke NUS Graduate Medical School, SingaporeCopyright © 2016 Begemann and Galic. This is an open-access article distributed under the terms of the Creative Commons Attribution License (CC BY). The use, distribution or reproduction in other forums is permitted, provided the original author(s) or licensor are credited and that the original publication in this journal is cited, in accordance with accepted academic practice. No use, distribution or reproduction is permitted which does not comply with these terms.
*Correspondence: Milos Galic, galic@uni-muenster.de