Six principles of visual cortical dynamics
- Department of Neuroscience, Division of Brain Research, Karolinska Institutet, Stockholm, Sweden
A fundamental goal in vision science is to determine how many neurons in how many areas are required to compute a coherent interpretation of the visual scene. Here I propose six principles of cortical dynamics of visual processing in the first 150 ms following the appearance of a visual stimulus. Fast synaptic communication between neurons depends on the driving neurons and the biophysical history and driving forces of the target neurons. Under these constraints, the retina communicates changes in the field of view driving large populations of neurons in visual areas into a dynamic sequence of feed-forward communication and integration of the inward current of the change signal into the dendrites of higher order area neurons (30–70 ms). Simultaneously an even larger number of neurons within each area receiving feed-forward input are pre-excited to sub-threshold levels. The higher order area neurons communicate the results of their computations as feedback adding inward current to the excited and pre-excited neurons in lower areas. This feedback reconciles computational differences between higher and lower areas (75–120 ms). This brings the lower area neurons into a new dynamic regime characterized by reduced driving forces and sparse firing reflecting the visual areas interpretation of the current scene (140 ms). The population membrane potentials and net-inward/outward currents and firing are well behaved at the mesoscopic scale, such that the decoding in retinotopic cortical space shows the visual areas’ interpretation of the current scene. These dynamics have plausible biophysical explanations. The principles are theoretical, predictive, supported by recent experiments and easily lend themselves to experimental tests or computational modeling.
The reasons that visual scientists so far have failed to give a coherent view of cortical functions and visual perception may be both conceptual and methodological. According to the traditional view, visual information reaches the primary visual cortex in parallel pathways from the retina carrying information about fine contrast, color opponency, and motion. From the primary visual cortex segregated parallel pathways convey luminance contrast, color opponent and motion signals to different higher order visual areas in the occipital-temporal lobes and occipital–parietal lobes respectively (Zeki, 1980a ,b ; Ungerleider and Mishkin, 1982 ; DeYoe and Van Essen, 1988 ; Livingstone and Hubel, 1988 ; Felleman and Van Essen, 1991 ; Singer, 2004 ). The visual information is processed according to the accepted scheme for cortical connectivity by a set of areas arranged in a parallel and hierarchical system. Primary sensory areas send information in parallel to different sets of higher order cortical areas that are specialized to compute particular aspects of the sensory information (color, motion, etc.). As the information travels feed-forward simultaneously along parallel cortico–cortical connections, the neurons in subsequent cortical areas react to more and more complex combinations of visual attributes (Movshon et al., 1985 ; Tanaka et al., 1991 ; Wang et al., 1996 ; Carandini et al., 1997 ). But since neurons in different areas represent different aspects of the visual scene (shape, color, motion, optic flow, etc.) there is a binding problem: how are these aspects put together to a unified percept, say of somebody driving a blue Volvo down main street? One proposal is that neurons representing different aspects of the visual scene fire synchronously in assemblies across areas. One set of assemblies will fire synchronously representing the object (the blue Volvo) and other assemblies across areas fire synchronously representing the background (Milner, 1974 ; von der Malsburg and Schneider, 1986 ; Gray and Singer, 1989 ; Singer, 2004 ). These synchronous firings are frequently in the γ-range (30–80 Hz), appearing in the visual areas as γ-oscillations after stimulation (Singer, 2004 ; Berens et al., 2008 ).
Even if one assumes that the binding problem has found its solution, there are other major unresolved issues with multiple areas engaged in perception, such as delays. When an object appears in the visual field of view, it is mapped with different latencies in the six layers of cortex (Maunsell and Gibson, 1992 ). Furthermore, the visual signals reach these different visual areas with different delays (Raiguel et al., 1989 ; Maunsell and Gibson, 1992 ; Dinse and Kruger, 1994 ; Katsuyama et al., 1996 ; Schroeder et al., 1998 ; Bullier et al., 2001 ; Tanaka et al., 2002 ; Vajda et al., 2004 ; Chen et al., 2007 ). The diversity of delays are particularly troublesome for the perception of moving objects as a moving object will continue to move while the motion signals are distributed to the multiple visual areas.
A problem of yet larger dimensions is how can all these neurons engaged with diverse delays and performing different computations work together to produce a coherent interpretation of the physical surround? The suggestion about synchronous firing is rather a proposed solution to the binding problem, but it does not explain the mechanisms by which the perceptions are created. The perceptual mechanisms are not explained by the notion that neurons in different visual areas by their firing of action potentials (APs) represent different aspects of the visual scene (Sejnowski, 2003 ). Neither are the perceptual mechanisms explained by the notion that the APs are the encodings of aspects of objects in the physical surround. In fact, the amount of information about objects and aspects of objects in the physical surround in any spike train from any visual area is small (Richmond and Optican, 1990 ; Heller et al., 1995 ; Eriksson and Roland, 2006 ; Eriksson et al., 2010 ). Furthermore, the spiking of single neurons is unreliable. Repetitions of an identical change in the physical scene evoke large trial-by-trial variations in the timing and rate of the spiking of single neurons in the primary visual cortex. This variance is so big that usually no neuron in a single trial can encode any aspect of the physical scene (Heggelund and Albus, 1978; Burns and Webb, 1976 ; ). Finally, the ideas of neurons representing physical objects or aspects of objects in the visual field of view, ignores that visual information about the physical surrounding is underdetermined (Helmholtz, 1867 ). The problem of how billions of neurons in mammalian brains compute and communicate their computations is a general and fundamental problem that is not solved yet. To paraphrase Helmholtz (1867) , one may say that the task of the visual cortical areas rather is to compute a perceptual solution that matches the physical surrounding reasonably well. The neurons in the visual areas do this surprisingly fast; most changes in the visual scene are recognized in less than 150 ms (Thorpe et al., 1996 ). How can the visual cortical areas be so fast? The answer to this is not known, which further illustrates that our current view of the neurobiology of vision is perhaps wrong, but definitely incomplete (e.g., Sejnowski, 2003 ; Olshausen and Field, 2006 ).
The Biophysical Mechanics of Communications and Computations
To understand visual perception one must discover the dynamic mechanisms of neuron communications and neuron computations that drive neurons in many visual areas towards an interpretation of the physical surrounding. Neurons send AP’s and release neurotransmitter as a biophysical necessity to drive their target neurons into excitation or inhibition. By doing so they change the computations of the target neurons. Eventually these changes will lead to that the neurons in the visual areas collectively compute an interpretation of the visual scene. It is not necessary for this dynamics to work, that the single spike train is labelled as representing or encoding particular aspects of the physical surround. To describe how the dynamics evolve, the concepts of neural communication and neural computation will be used, because these two concepts have clear biophysical definitions (see Box for definitions and illustrations of concepts).
The two most important variables for understanding rapid cortical dynamics are the membrane potential, Vm, its temporal derivative, dVm(t)/dt, and the APs (Box ). The neurons emit APs to communicate with other neurons. The APs are the results of the computations of a neuron. When a neuron communicates, it sends APs to the 2000–5000 neurons it communicates to. The communication with the target neurons becomes possible, because the neuron through its transmitter release can drive the target neurons. For the many target neurons, the probability of them being driven to excitation and fire depends on many factors: the type of target neuron and its dendritic tree (Contreras and Palmer, 2003 ; Elston, 2003 ; Shinomoto et al., 2009 ), the instantaneous rate of the afferent APs, whether the target neurons are in up-state or down-state, the recent history of the membrane currents (Truccolo et al., 2009 ), the rate with which the inward current increases (Eq. 2 in Box ), and the membrane potential Vm. In general, the firing probability increases with increases in the dVm/dt (Azouz and Gray, 2000 ). The prerequisite for an excitatory neuron to drive is that the excitatory driving force Vm−EE in the target neurons is sufficiently large (Eq. 2 in Box ). With the exception of the APs, the Vm excitation rarely exceeds 25 mV over baseline in vivo (baseline approximately −70 to −65 mV) (Contreras and Palmer, 2003 ; Petersen et al., 2003a ,b ; Crochet and Petersen, 2006 ; Haider et al., 2006 ; Ferezou et al., 2007 ; Rudolph et al., 2007 ; Monier et al., 2008 ). As it is possible in vitro to drive the Vm into more excitation, it is thought that there is a considerable simultaneous outward current (inhibitory shunting inhibition from Cl− conductance) in vivo preventing the Vm to go into more excitation (Borg-Graham et al., 1998 ; Haider et al., 2006 ; Rudolph et al., 2007 ; Monier et al., 2008 ). Of importance for the following is that, if the target population Vm is high (increased by 12–20 mV), the excitatory drive decreases and the inhibitory drive increases. Thus adding excitation to an already high Vm will often bring the neurons over their firing threshold, but most likely result in sparse or moderate firing. Conversely, if the Vm is low the excitatory driving force increases and the inhibitory driving force decreases in the target neurons (Box Figure ). So the conditions for driving a target population in which inhibition was just released are good. A good example of this is the ON response in the retino-geniculate and geniculate-cortical spike trains. Also, if a population of neurons are just having an increase of the inward current, an excitatory communication to these neurons from another source will add to the inward current and readily fire especially the excitatory pyramidal neurons.
Box 1 Communication, computation, drive, decoding and definitions
Neurons communicate by APs, and transmitter releases. The distinction between computation and communication may not be entirely sharp, as some transformation of spike trains could take place in axons. Furthermore, at the axon terminal, the presynaptic part indeed performs non-linear operations when the transmitter is released. The effect of communications is either excitatory postsynaptic currents or inhibitory postsynaptic currents. By measuring the membrane potential or current changes of the target neurons one can study the effects of communications (decoding) (Box Figure ).
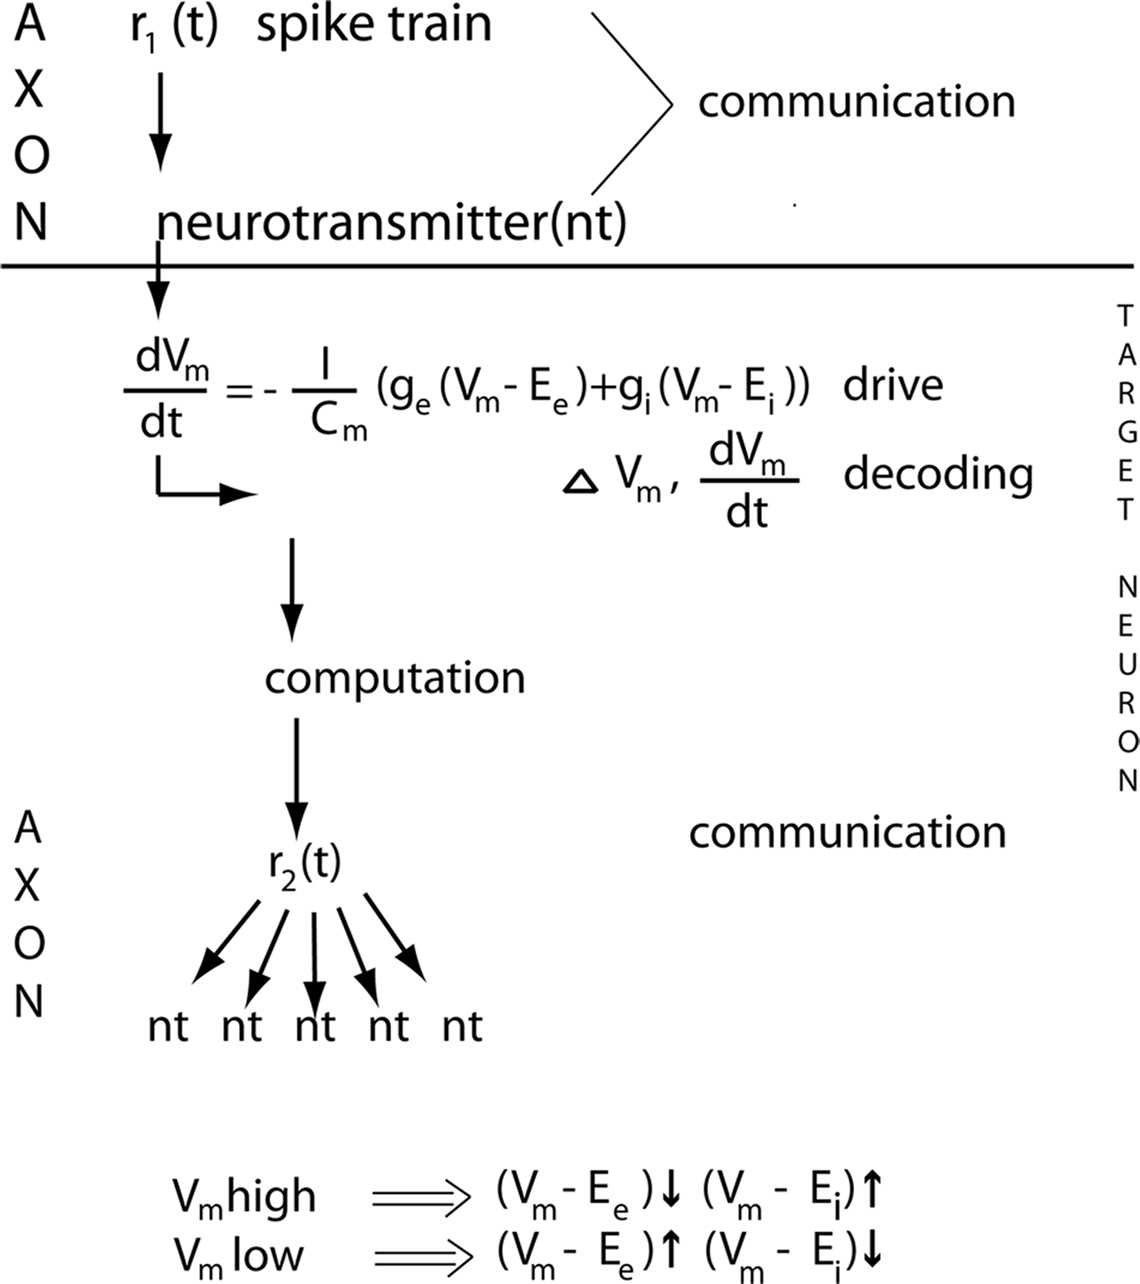
The neuron computations start by afferent inputs to the synapses, the synaptic currents propagate into the dendrites, which perform non-linear operations, and end by producing electrical spike activity, APs in the form of a spike train r(t), or no APs (Roland, 2002 ). Note that neurons thus compute even if they do not (immediately) send out APs. Any change in their (local) membrane potential Vm will affect also future inputs and outputs. Note that the APs do not show the computations. The APs are the results of the computations.
One can describe all important communications and computations within and between cortical areas by two variables, APs and the membrane potential Vm, at least for a few hundreds of ms. The neurons communicate and compute within the cortical space consisting of the mesh of axons, dendrites and the somata of the cortical neurons (Figure 1 ). Communication is possible because neurons can drive their 2000–3000 target neurons. The driving neurons communicate APs to their axon terminals, which drive their target neurons by releasing (many) vesicles of neurotransmitter (Box Figure ). In the target neuron dendrite, the induced rate of change in membrane potential, Vm, is proportional to the inward current

in which Cm is the membrane capacitance that is almost constant (1 μF cm−2) for all neurons and Q is the intracellular charge. The intracellular charge can be described as the sum of the excitatory, inhibitory and leak currents:

by convention the current that enters the neuron, the inward current, is positive (hence the minus on the right side); EE is the excitatory reversal potential, EI is the inhibitory reversal potential, gE is the excitatory conductance, gI the inhibitory conductance, gL is what is termed the leak conductance and EL the leak conductance reversal potential. The leak conductance appears as a term, because the dendrites have ion pumps that pump Na+ out of the dendrite and K+ into the dendrite as well as other ion pumps changing the membrane potential. In vivo, if the dVm(t)/dt increases and hence the inward current increases significantly above baseline this means net excitation; if the dVm(t)/dt is significantly negative (i.e., below the baseline), this indicates net inhibition. Neurons may be net excited, without actually firing any APs immediately. If the net excitation prevails, a communication (often a feedback) targeting these pre-excited neurons later can bring them over the threshold to fire.
The difference between the reversal potential and the actual membrane potential is the input driving force. The excitatory (Vm−EE) and inhibitory (Vm−EI) driving forces of the target neurons, all other factors equal, determine how fast and to what extent the communications the neurons receive can drive the neurons towards their firing threshold or keep them away from this threshold. Note that the excitatory driving force is largest when a prevailing inhibition is just released.
Decoding are the immediate changes in inward currents/outward currents and membrane potentials of the target neurons. The target neurons in area 17 of the visual cortex decode the information of the changes in the visual scene contained in the ON r(t) response. The decoding is the immediate changes in inward current d(Vm(t))/dt and the resulting immediate change in the membrane potential ΔVm(t).
The target neurons’s computations start with the synaptic currents (Box ). Excitatory communication gives inward synaptic current, inhibitory communication gives outward current. The synaptic currents propagate into the dendrites. Here the complicated interactions between many membrane currents, axial currents and dendritic conductances take place in a non-linear manner. The excitatory dendritic potentials may propagate though the soma of the neuron to the axon to generate APs. Or the dendritic potentials are stopped by inhibitory conductances in the dendrites or soma, such that no AP’s can be generated. In both cases the neuron computes (Box ). In the case that it does not generate any AP’s it does not communicate its computations.
What drives single neurons also drives populations of neurons. The two equations (Box ) are valid for single neurons as well as for populations of neurons (Eriksson et al., 2008 ). At a certain cortical point, one can still describe the membrane potential changes of all membranes by Eq. 1 or 2 (but not assume that all individual membranes make identical contributions to the population value). In this paper I have chosen a deterministic formulation of the dynamics of visual cortical neurons, but the formulation could as well have been stochastic without any changes in the principles or their underlying mechanics.
The description of the neural communication and computation dynamics occupies large sections of this paper. The purpose is to describe how the single neuron computations and the communications to target neurons, the dVm/dt and driving forces in the target neurons and the resulting space–time dynamics of communications between neurons, within an area and between cortical areas, drive the brain to an interpretation of the physical surround.
The Cortical Mesh
One problem is that the dynamics of the computations and communications take place in a very complex network of neurons connected by billons of synapses.
Imagine that we put down a small probe of 50 μm in diameter in the cerebral cortex. If the cortex is 1.4 mm thick and has about 80000 neurons per mm3 (visual cortex), the probe will capture about 220 cell bodies of neurons. The sampled tissue cylinder with a cortical surface diameter of 50 μm will contain not only the cell bodies and dendrites and axon terminals of these 220 neurons, but also the dendrites and axons of neurons surrounding the tissue cylinder. If one assumes that the average dendritic span of a neuron is 600 μm (Lübke et al., 2003 ), the small tissue cylinder will contain the dendrites of approximately 75000 neurons. This number may be larger in higher order sensory areas and the prefrontal cortex as the dendritic span is much larger in these areas compared to the primary sensory areas (Elston, 2003 ). In addition the small cortical cylinder contains many axon terminals from neurons within the same area and from neurons in other cortical areas (Figure 1 ). In this cortical space, the mesh, the spatio-temporal changes of synaptic activity could take place in a very complicated way, making it virtually impossible to understand the cortical dynamics even if one had simultaneous measurements of many neurons in the mesh. To reveal the cortical dynamics evolving after a change in the physical surround, one must get space–time maps of the evolution of changes in Vm, i.e., dVm/dt, and changes in APs, i.e., r(t) at best from all visual areas, because these maps will give information about the computations and communications in the visual areas. These quantitative maps must be in real time (ms) and the space must be the real space ( = the mesh) as there is no known method of reducing this space. Some of the figures provide examples of such measurements of space–time maps. Surprisingly, despite the complexity of the mesh, the real-time computations and communications in the living cerebral cortex have a fairly simple spatio-temporal course in the mesh at the mesoscopic (population) scale. This implies that it is possible to derive principles of the computation and communication dynamics from measurements of Vm and r(t) in this mesh.
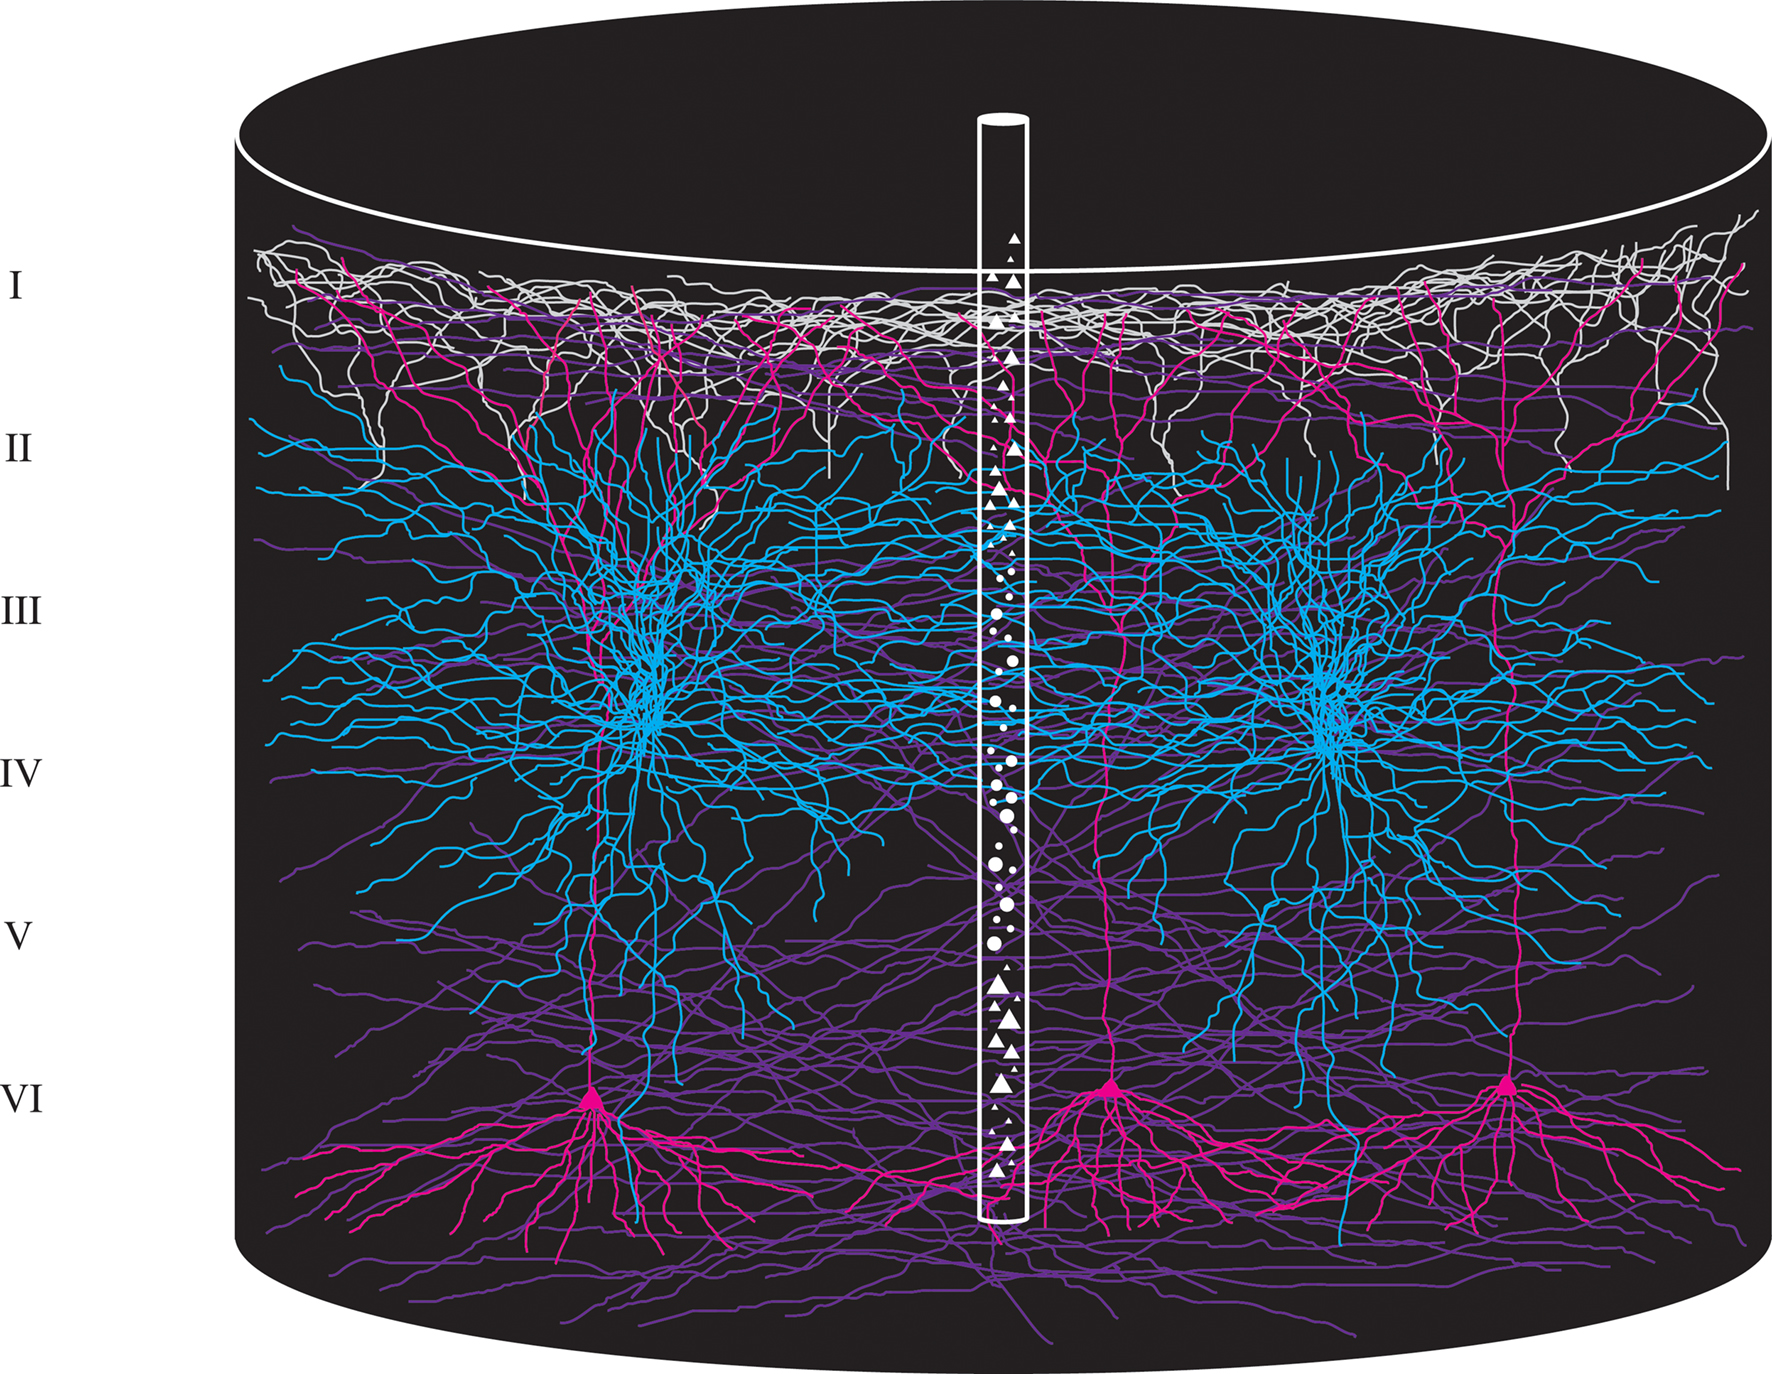
Figure 1. Cartoon of a cylindrical volume of the visual cortex illustrating the extensive spread and overlap of dendrites and axons. Diameter of large cylinder 600 μm, diameter of small cylinder 50 μm. The small cylinder will contain dendrites from approximately 75000 neurons.
The Theoretical Proposal
The ingredients in the proposal are (1) the biophysical concepts of computation, communication, driving, driving force, and decoding (see Box ). (2) Two principles which summarize the biophysical description of neural communication: Neuron populations in any area can drive their target neurons to change dVm/dt with the constraints of Eq. 2 and the factors summarized earlier. Conversely, if the instantaneous rate, r(t) → 0 or r(t) is constant, i.e., dr(t)/dt → 0, and the excitatory driving forces of the target neurons are small, the communication between areas diminish. (3) One axiom for visual transients: The retina transmits changes in the visual scene. (4) The proposal of three principles of (visual) dynamic network properties: pre-excitation, that feedbacks reconcile differences in computations between higher and lower visual areas, and that the network dynamics in visual areas are well behaved. With these ingredients, one can show that a change in the visual scene is associated with single neuron computations and communications to target neurons, changes in the dVm/dt and driving forces in the target neurons and resulting space–time dynamics of communications between neurons within an area and between cortical areas driving the brain to an interpretation of the physical surround in less than 150 ms.
When the retinae detect a change in the field of view, the neurons in the visual areas engage into a dynamic sequence starting by driving the neurons into feed-forward (FF) communication and pre-excitation – then integration of the change signal in higher areas – feedback – reconciling computational differences – decoding of the visual scene – reduced driving forces – decreased communication, and sparse firing lasting until offset of the stimulus or the appearance of a new change in the visual scene. The dynamic sequence is described chronologically from 0 to 150 ms. For each transient state in the dynamic sequence, the neurophysiologic dynamics of the Vm, dVm/dt, and r(t) will be illustrated with recent experimental results, and the biophysical principles and mechanisms underlying this dynamics will be discussed. This constitutes the main contents. In order to keep the text within reasonable limits, only a few of the numerous predictions are mentioned. Computational models of the visual cortex, even with simpler architecture than the actual mesh, could probably express the dynamics embedded in the dynamic sequence. However, such computational models most likely have to be large-scale models, as models with small degrees of freedom do not express the transient dynamics examined in this paper (Rabinovich et al., 2008 ). To keep the text within reasonable limits, large-scale computational models are neither presented nor discussed here.
Neuron Populations in Any Area Can Drive Neurons to Which They are Directly Connected
Neurons simply drive other neurons into excitation or inhibition. There is no need for any distributing or gating mechanisms to regulate the communications between neurons. This principle also implies that there is no default order of excitation of cortical areas. Neurons sending their axons to other cortical areas are excitatory (Maunsell and Van Essen, 1983 ; Ottersen and Storm-Mathisen, 1986 ; Loewenstein and Somogyi, 1991 ; Rockland and Drash, 1996 ; Anderson and Martin, 2002 ). The cell bodies of driving neuron populations can be located in any cortical area: prefrontal, motor, higher order sensory, and primary sensory. As each neuron in cortex sends axon terminals to at least 2000–3000 other cortical neurons (Colonnier, 1981 ; Somogyi et al., 1998 ), the number of target neurons will be large when even a small population is driving (Roland, 2002 ) (for definitions see Box ).
Two examples might illustrate the principle of neuronal driving and its consequence of no default communication between cortical areas. For example, visual area should process visual information and somatosensory areas should process somatosensory information. But in situations with simultaneous somatosensory and visual stimulation, neurons in somatosensory areas send synaptic excitations traveling into visual areas, and conversely, visual areas send synaptic excitations traveling into somatosensory areas (Takagaki et al., 2008 ). Moreover, visual areas can be very active without visual stimulation and without organized visual activity. Local dynamics may drive the neurons of a visual area into an up-state, during which the neurons are more excited with Vm around −55 mV and the r(t) increases considerably (Destexthe and Paré, 1999 ; Petersen et al., 2003b ; Crochet and Petersen, 2006 ; Ferezou et al., 2006 ). Occasionally the increased firing rates of a neuron population in an up-state drive target neurons in adjacent cortical areas to excitation and firing. Figure 2 shows an example of such a propagating net excitation. Here the higher parietal visual areas are in an up-state which spreads over the cortex in feedback direction to the primary visual area 17. Similar propagating up-states have also been observed in anesthetized rodents, and turtles (Prechtl et al., 1997 ; Petersen et al., 2003a ,b ; Crochet and Petersen, 2006 ; Ferezou et al., 2006 ; Lippert et al., 2007 ; Xu et al., 2007 ; Takagaki et al., 2008 ).
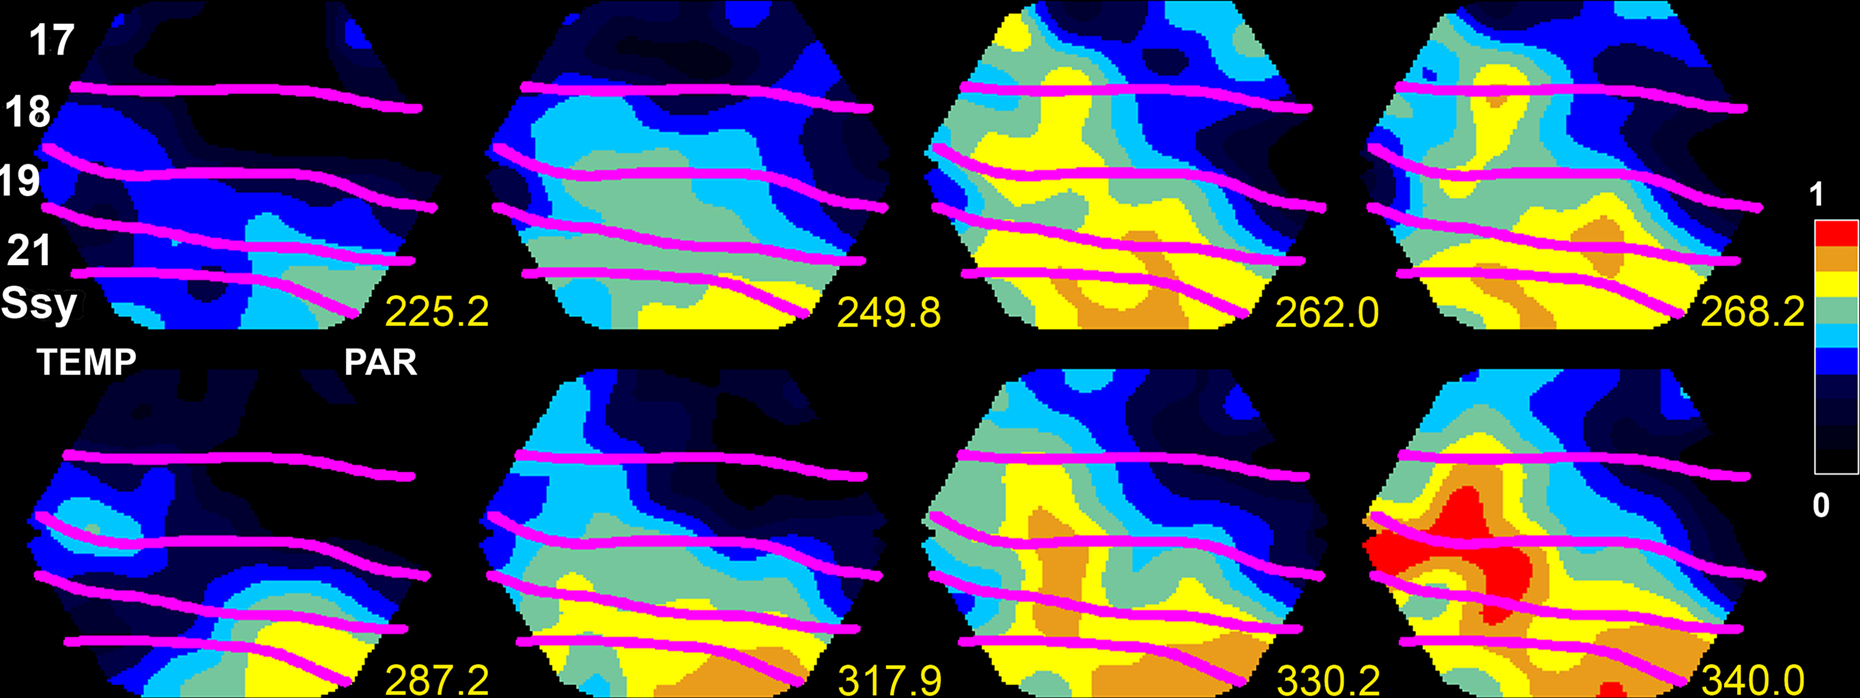
Figure 2. Neurons in the parietal cortex and area SSY of the ferret are in an up-state and send two FBs to lower order areas 249.8–268 ms and 317.9–340.0 ms. Measurement of spontaneous ongoing relative population membrane potentials (measured with the voltage-sensitive dye RH 1838) in areas SSY, 21, 19, 18, and 17 of the ferret. The anatomically reconstructed cytoarchitectural borders shown in magenta overlaying the cortex. Scale: relative membrane potential in fraction of maximum. TEMP temporal lobe localization, PAR parietal lobe localization.
In experiments, the Vm dynamics disappears when glutamate antagonists are applied to the cortex in vivo (Berger et al., 2007 ). This indicates that synaptic activity is the major factor in producing the rich Vm and dVm/dt dynamics in vivo.
The dynamics in communication within and between cortical areas is limited only by how the neurons interconnect by synapses (and by gap-junctions). Within this anatomical constraint, spontaneous as well as evoked APs can drive neuron populations in target areas.
The Retina Transmits Changes in the Visual Scene
Only a minor proportion of the physical surround can be seen. The term the visual scene refers to the part of the physical surround that can be detected by vision. Under normal viewing conditions the rods are saturated, so the cones convey information about the visual scene. Cones only react to changes, i.e., an increase or decrease in the luminance or wavelength composition of the reflected light. To this the retinal ganglion cells react with an ON response. This ON response signals the change in the visual scene and not the visual scene itself (Kuffler, 1953 ; Enroth-Cugell and Jones, 1961 ; Hughes and Maffei, 1966 ; Enroth-Cugell et al., 1983 ; Heggelund et al., 1989). Similarly, the information that is conveyed by the lateral geniculate nucleus (LGN) ON response is about changes in the visual scene and not the actual new scene itself.
This means that the neurons in the primary visual cortex, area 17, initially after a change, should decode changes in the visual scene; but not decode the actual scene (Kinoshita and Komatsu, 2001 ; Eriksson et al., 2010 ). This hypothesis was tested by Eriksson et al. (2010) . The first 20 ms after the change, the r(t) was correlated with the previous scene. Thereafter, for the next 50–60 ms as predicted by Eriksson et al. (2010) , the r(t) was correlated to the difference in luminance between the previous and current scene, i.e., correlated with the change in the visual scene (Figure 3 ). Both the r(t) of single neurons and the r(t) of a large neuron population in area 17 correlated significantly more with the luminance differences than with the previous or current visual scene (Figure 3 ). First, 90 ms after the sudden change in the visual scene, the r(t) was correlated with the current scene.
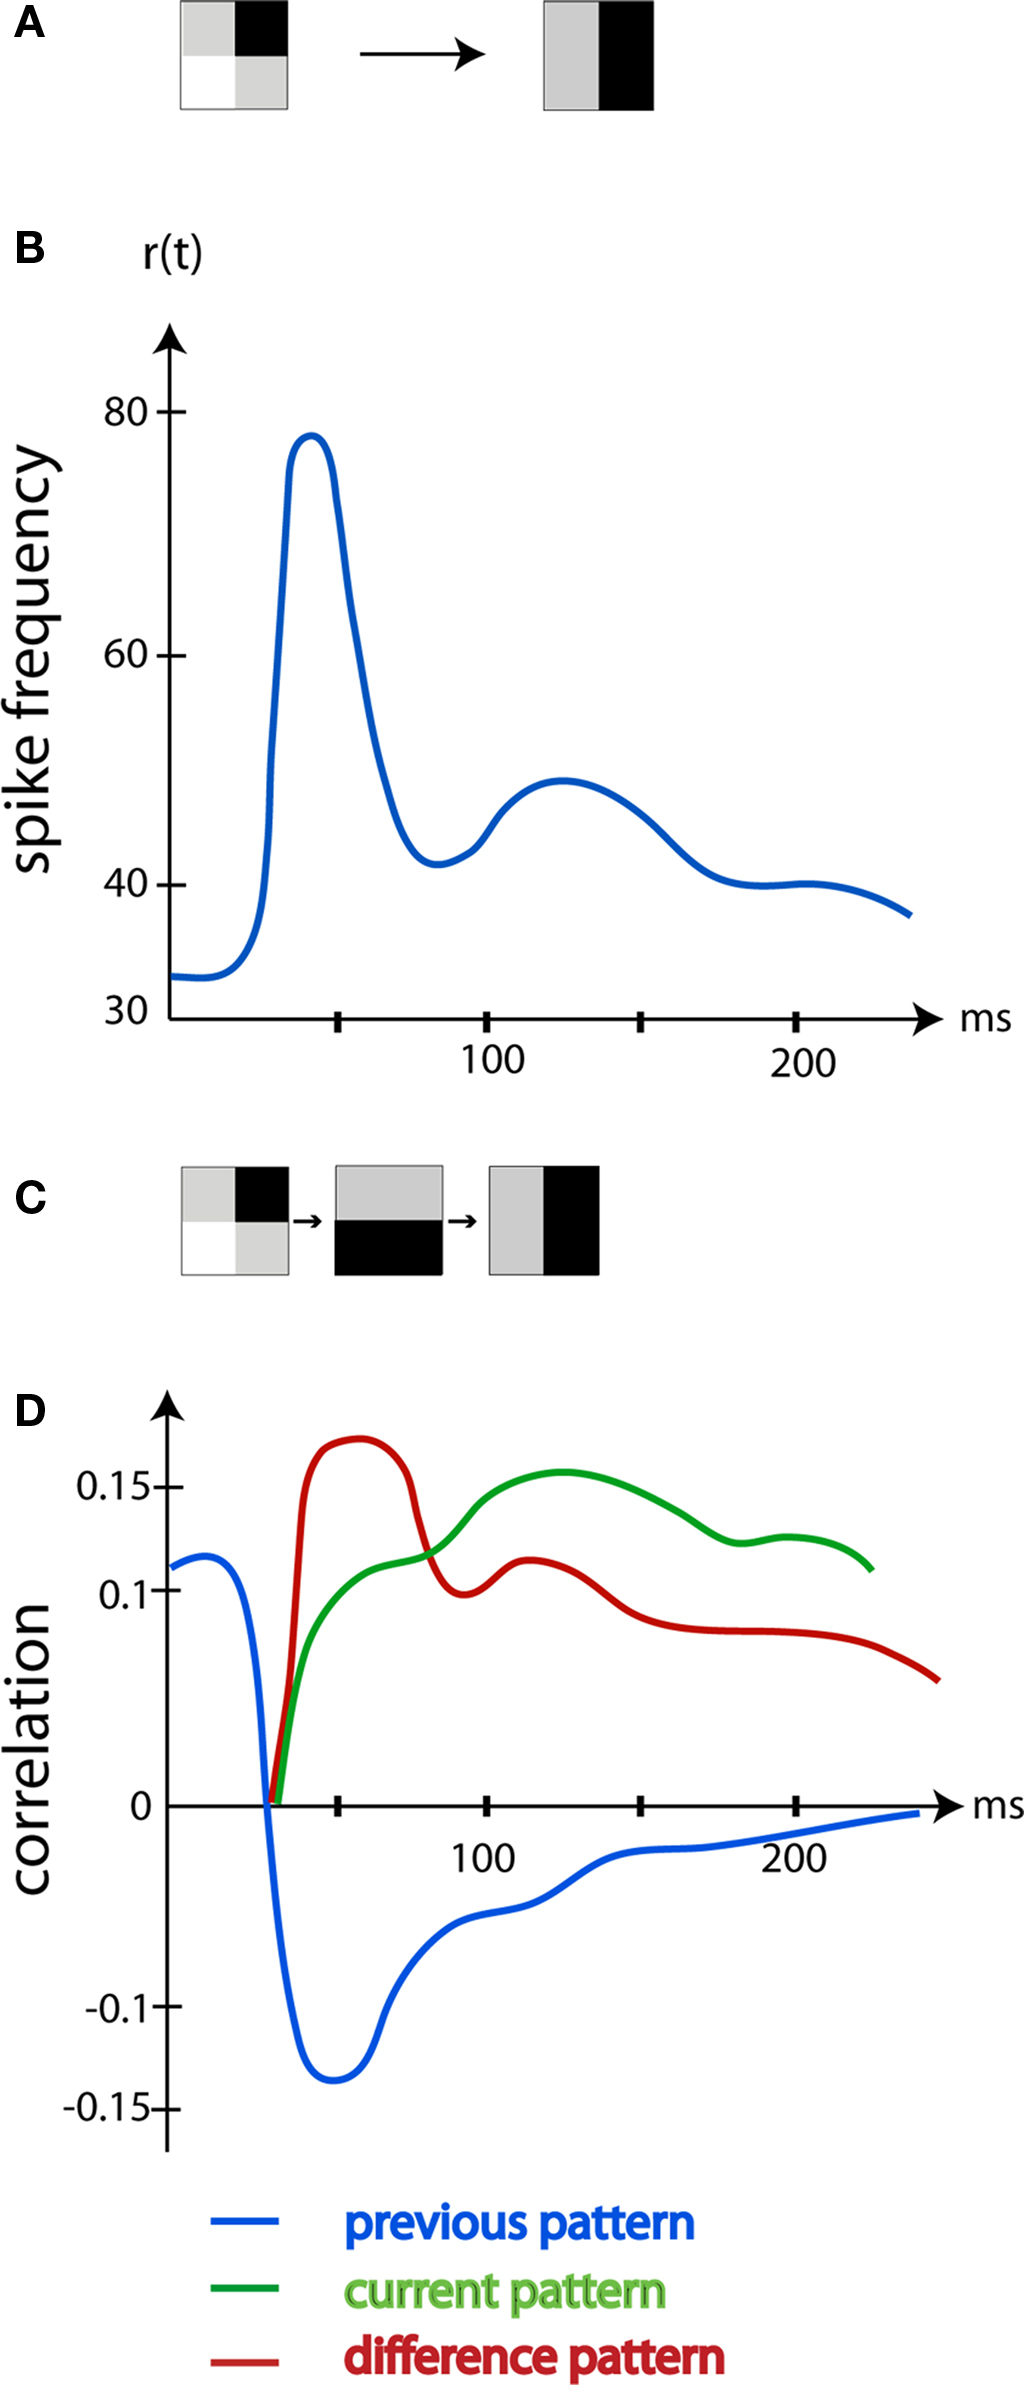
Figure 3. The image decoded by the area 17 neurons changes over time. (A) The left pattern was shown. At time 0 ms the pattern shifted to the right pattern. (B) The mean r(t) in Hz of the area 17 neurons mapping the new pattern (average of five animals). (C) The old pattern (left), the difference between the old pattern and the new pattern (middle), the new pattern (right). (D) The average correlation between the old, the difference pattern and the new pattern and the r(t) of area 17 mapping neurons. Note that, corresponding to the ON response induced by the change to the new pattern, the neurons are mostly correlated with the difference between the old and the new pattern. After 90 ms the neurons code mostly for the current pattern. (Modified from Eriksson et al., 2010 ).
In retrospect, these findings by Eriksson et al. (2010) explain several observations. When we wake up from a dreamless sleep, the visual cortex will undergo the transition from no visual content to receive all changes present in the surroundings. This difference pattern will be very close to the actual scene content. Similarly, most visual physiologists present a homogenous screen and on top of this they present a stimulus. In this case, the changes in luminance and contrast introduced by the stimulus would be close to the stimulus itself. Only when the visual scene is shifted from 1 ms to the next, one would measure the correlations to the difference between the past and the present scene in the spike trains. Under such conditions, the orientation preference of the area 17 neurons will initially reflect the luminance contrast change rather than the true orientation of the stimulus (Ringach et al., 2003 ; Xing et al., 2005 ; Nikolic et al., 2007 ; McLelland et al., 2009 ; Eriksson et al., 2010 ). Note however that the average spike correlation to the difference pattern as well as the current scene pattern is small (Figure 3 ). This is in accordance with other studies (Richmond and Optican, 1990 ; Heller et al., 1995 ; Kinoshita and Komatsu, 2001 ; Eriksson and Roland, 2006 ) and further emphasize that much of the spiking activity has other purposes.
Dynamic Sequence, First Part. A Change in the Field of View Drives Visual Areas Into a Dynamic Sequence of Feed-Forward Communication to Large Populations in Many Visual Areas and Lateral Communication and Pre-Excitation within Each Area
To each change in the visual scene, the retinal ganglion cells make ON responses. The ON response is a rapid increase in the firing rate, r(t), followed by a slightly slower decrease (Figure 4 ). The retinal ON responses drive neurons in early visual areas to fire similar ON responses and communicate ON responses to several visual areas with neurons having favorable driving forces. Within each area, the population receiving the ON response drive neurons in the surround into a pre-excitation. When the pre-excitation is maximal, higher visual areas send feedback (FB) to all neurons that received the communication of the visual change. The targets of the FB are the large populations of neurons in lower order areas, which at this moment are pre-excited or firing. Figure 4 shows the r(t) ON response and related variables in the primary visual area, area 17 during the feed-forward and the FB phases.
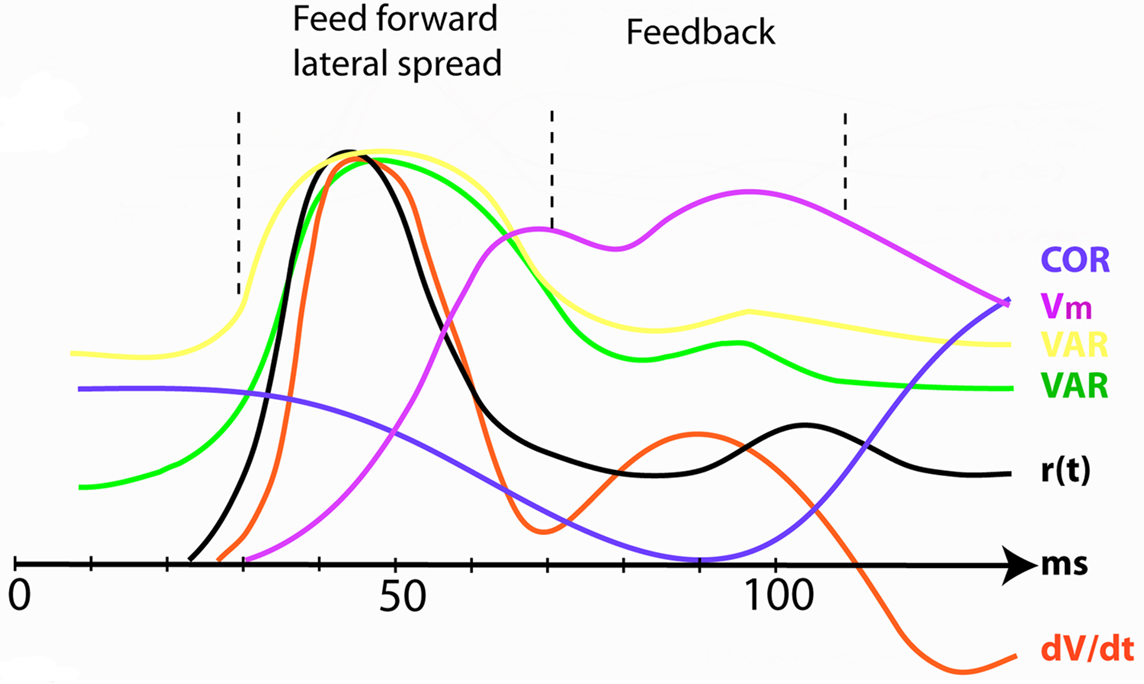
Figure 4. The increase and reduction in dimensionality at the mapping site of the object in visual area 17 after introduction of a stationary object at time 0. COR correlation in r(t) between pairs of neurons (Smith and Kohn, 2008 ). Vm population membrane voltage. VAR (yellow) variance of the population membrane potential (calculated from Roland et al., 2006 ); VAR (green) trial-by-trial variance in the firing rate (Gawne et al., 1996 ); r(t) firing rate; dV/dt time derivative of membrane potential V (proportional to net membrane current); (Eriksson et al., 2008 ). As the variance decrease and the correlations increase in the feedback interval the dimensionality reduces. All data normalized to maximum values.
The dynamic sequence is a consequence of the principle that the retina transmits changes in the visual scene as driving ON responses and the principle that neurons in any area can drive their target neurons into excitation if the driving forces of the target neurons are favorable. Examples of changes in the visual scene are when an object suddenly appears or an object moves into the visual field of view. Sudden changes in the visual scene are transients that are especially advantageous for the study of cortical dynamics. In artificial vision, scientists often use stimuli with continuous oscillating changes, for example gratings drifting with a constant velocity. For such stimuli, the dynamic sequence will appear in the first 100–120 ms after the start of the stimulus. It is outside the scope of this article to analyze the further dynamics associated with such stimuli.
Figure 5 shows a cartoon of the whole dynamic sequence when a new object appears in the field of view. This may be divided into the spatio-temporal cortical dynamics of the communications within and between areas (Figure 5 A), and the temporal dynamics in Figures 5 B,C of the local computations where the object is mapped in each area. Area 17, the primary visual area, has detailed retinotopy, i.e., the topology of the area resembles the topology of the retina. In area 17, the neurons have small receptive fields. The second area, exemplified by area 21 is also a retinotopic area, but with less distinct retinotopy and neurons with large receptive fields. The two last example areas are PP in the parietal cortex and one area in the inferior temporal cortex, IT. The IT area is a non-retinotopic area (Nelson and Bower, 1990 ), like that found in the inferior part of the temporal lobe of carnivores and primates (Figure 5 A).
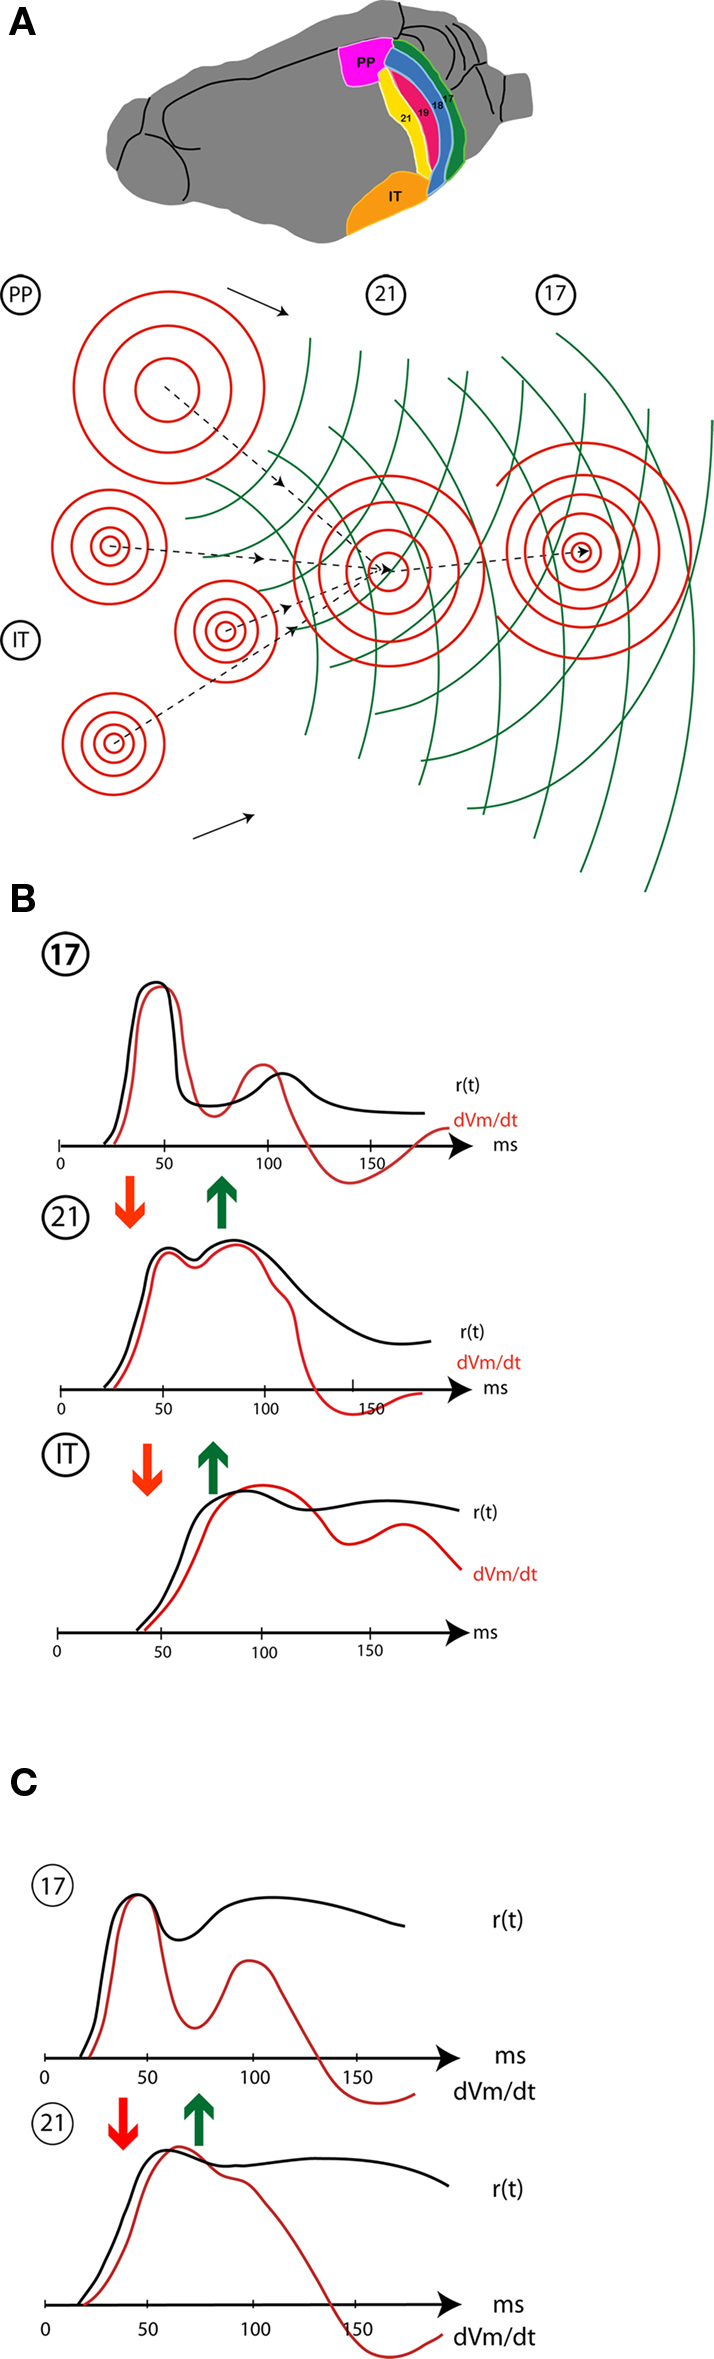
Figure 5. Schematic display of spatio-temporal dynamics of the population firing rates, r(t), membrane potentials and population dVm/dt (net membrane current) in areas 17,21,and visual temporal cortex (IT). (A) occipital, temporal, and parietal (PP) visual areas in the ferret showing the mapping and lateral spreading excitation (red) in response to a small stationary object appearing in the field of view. The object is mapped once in the retinotopically organized areas 17 (18, 19 not shown) 21, and PP, but several places in IT (non-retinotopic). The focused excitatory FB shown by stippled curves with arrows and the broad FB propagation is shown in green. (B) Stationary object appearing at time 0: temporal dynamics of the population firing rates and the dVm/dt at the mapping sites in areas 17, 21, and IT. Initially the local r(t) drives the dVm/dt (based on Salazar et al., 2004 ; Eriksson et al., 2008 ; Roland unpublished; Chen et al., 2007 ). (C) Moving object: r(t) and dVm/dt at the initial mapping sites in areas 17 and 21 (modified after Harvey et al., 2009 ). Arrows show the communication directions (FF red, FB green).
Consider first the temporal changes in driving forces, membrane currents and firing frequency, r(t) when an object pops up in the visual scene. When the object pops up it elicits ON responses in retinal ganglion cells. The retinal ON responses drive the neurons of the LGN to generate similar ON responses. If neurons in area 17 fire sparsely, the ON responses from the LGN drives the neurons in area 17 efficiently because most neurons are likely to have a Vm varying around −65 to −75 mV (Destexhe et al., 2003 ; Crochet and Petersen, 2006 ; Ferezou et al., 2006 ; Rudolph et al., 2007 ; Eriksson et al., 2008 ). The neurons located at the retinotopic cortical site corresponding to the retinal change compute a similar ON response, a sharp increase in r(t) and a sharp net increase in the inward current (excitation) (Figure 5 B). The outward current also increases simultaneously, but not to the extent that it prohibits the net excitation (Borg-Graham et al., 1998 ; Monier et al., 2008 ). The ON responses from the layer IV neurons communicate net excitation to the dendrites of layer III neurons in the output layer. The layer III neurons, in turn, compute similar ON-responses and communicate these to areas 19 and 21 and eventually to parietal visual areas (PP) and to scattered populations of neurons in the inferior temporal cortex (IT) (Figure 5 B).
If a moving object appears in the field of view, the temporal dynamics of areas 17, 18, 19, and 21 are quite similar, suggesting that the biophysical mechanisms in area 17 may also be similar (Figure 5 C). A moving object also elicits a retinal ON response that, in most trials, drives the area 17 neurons into a similar excitatory ON response with increases in dVm/dt, r(t) and Vm (Figure 5 C). From area 17, areas 18, 19, and 21 are also driven into excitatory ON responses by FF communications albeit with a lag of 10 ms for areas 19 and 21 and parietal visual areas (Figure 5 C). In the particular case of objects moving over the retina, the driving forces of the retinal input are now severely reduced where the object was first mapped in area 17 (because the object has moved on).
The spatio-temporal dynamics is known from recent publications. It evolves as follows for a static object appearing in the visual scene. First the object is mapped retinotopically in area 17 as a dynamic bump in dVm/dt, r(t), and Vm (a bump is a smooth mathematical function with a precise topology) (Figure 6 ). Locally, in the bump, some neurons fire ON responses as already mentioned, but the number of neurons that just increase their inward current, but do not fire, by far exceeds the number of neurons firing (Roland et al., 2006 ; Berger et al., 2007 ). This is probably because each neuron sends axons to 2000–5000 target neurons, most of these in the local surround. This makes the population net dVm/dt lag the r(t) with a few ms in Figures 4 and 5 B,C (Eriksson et al., 2008 ). The layer III object-mapping neurons drive target neurons surrounding the bump (Nauhaus et al., 2009 ), because the Vm in the remaining of areas 17 and 18 is not directly driven by the retinal communication and the target neurons in the surround thus have favorable excitatory driving forces (Figures 5 A and 6 ). This lateral excitation spreads in all directions from the population of mapping neurons (Grinvald et al., 1994 ; Bringuier et al., 1999 ; Slovin et al., 2002 ; Roland et al., 2006 ) (Figure 5 ). As seen from Figure 6 , the net excitation is larger where the object is mapped, but not negligible in the rest of areas 17 and 18 (where the object background is mapped). Pre-excitation in the form of lateral spreading net excitation is also seen in other species (Petersen et al., 2003a ; Homma and Tanifuji, 2006 ; Benucci et al., 2007 ; Ferezou et al., 2006 , 2007 ; Lippert et al., 2007 ; Xu et al., 2007 ; Han et al., 2008 ; Nauhaus et al., 2009 ). Pre-excitation is proposed as a general dynamic mechanism, bringing the target neurons into a state of net-inward currents – insufficient to make them fire – but large enough for them to fire when neurons from another area communicate. For example, most neurons in areas 17 and 18 are pre-excited. When the feedback to these early visual areas arrives from higher order areas, many are brought over their firing threshold. At 65–70 ms the lateral spreading pre-excitation reaches its maximal amplitude.
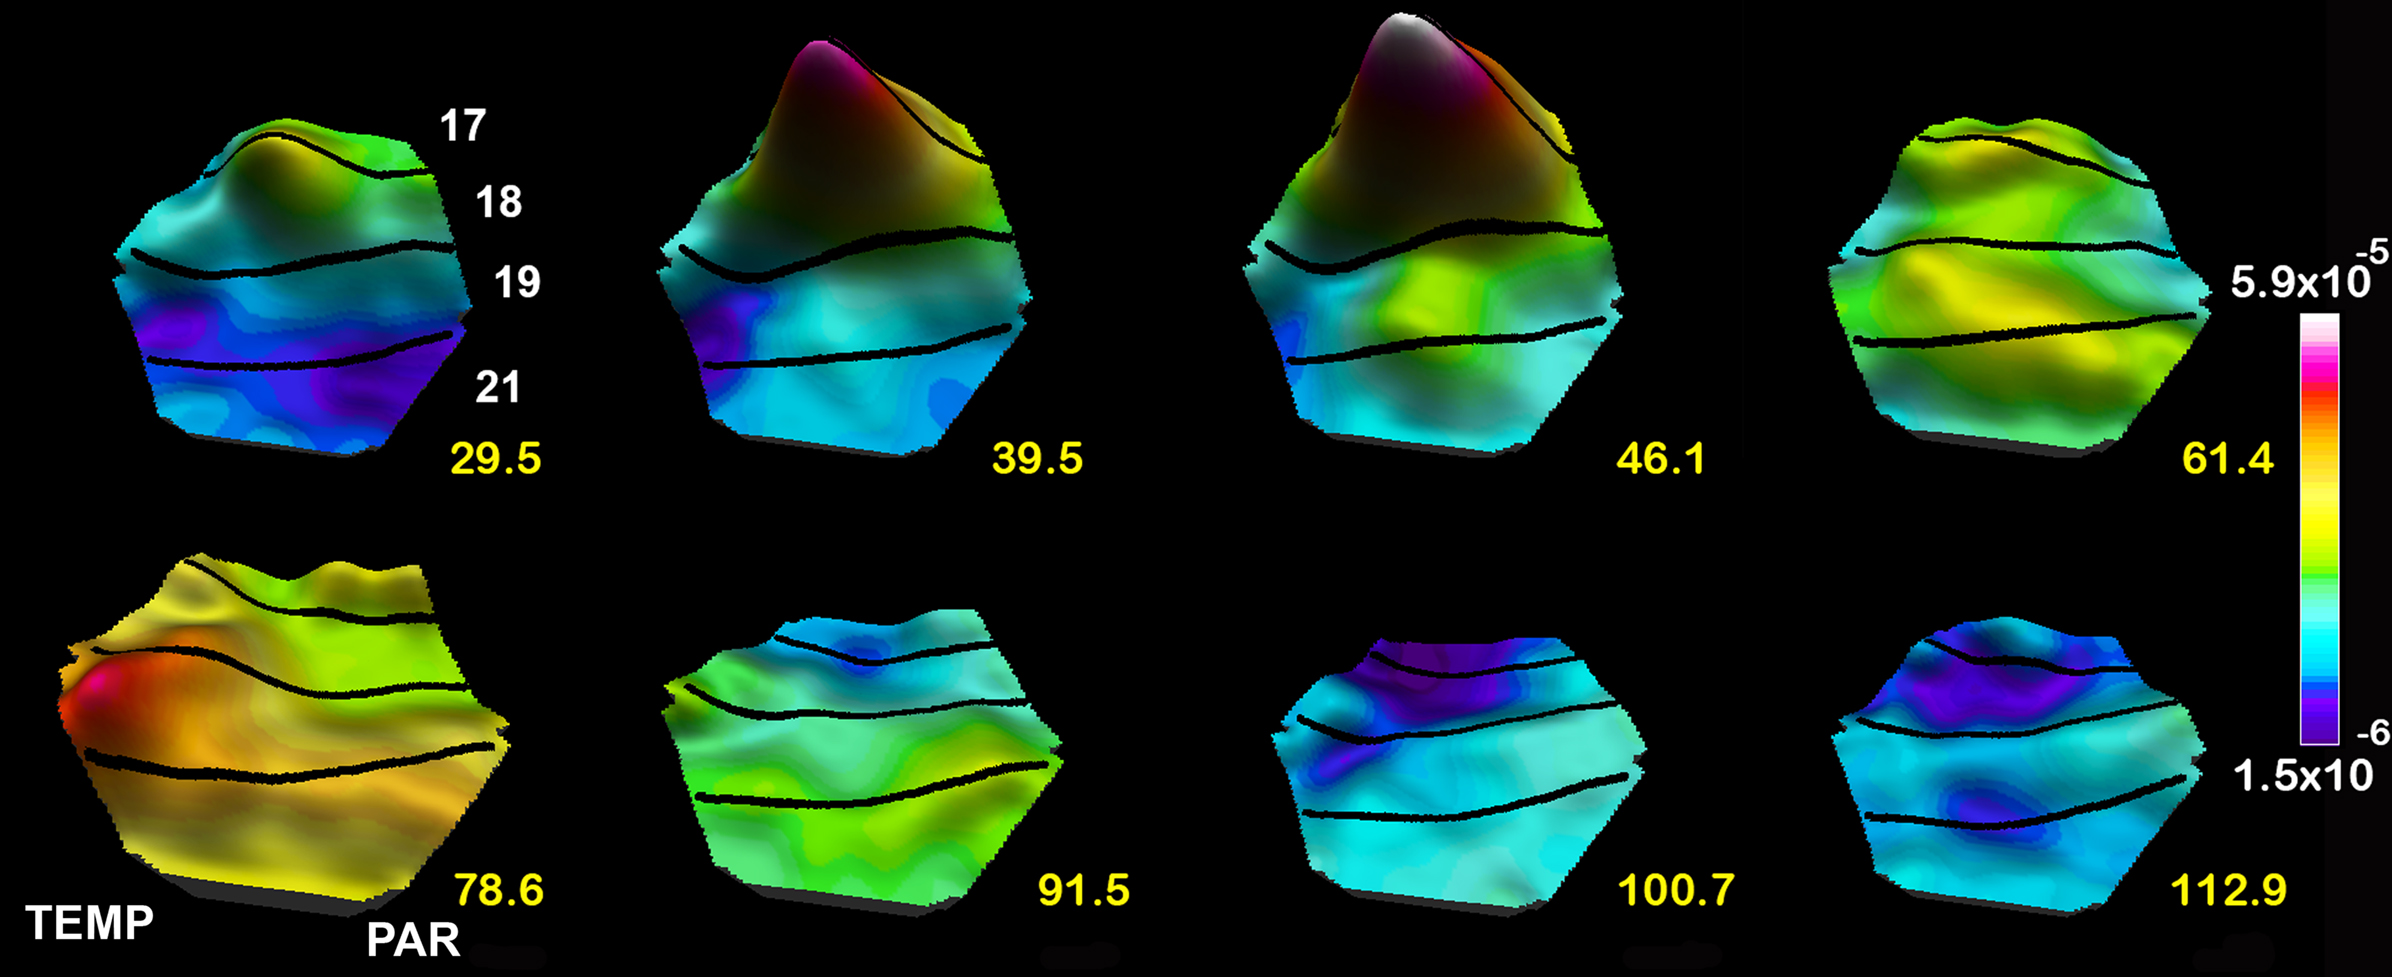
Figure 6. Spatio-temporal dynamics of the dVm/dt in response to a stationary object appearing at time 0 ms. Note the large bump mapping the object at the area 17/18 border, the smaller emerging bump at the area 19/21 border 39.5 and 46.1 ms) and the lateral spreading excitation from the center of both bumps, the FB 61.4–78.6 ms, the lateral spreading inhibition (negative dVm/dt) spreading out first from the 17/18 mapping site and then from the 19/21 area mapping site 91.5 ms to 112.9 ms.
The layer III neurons are also the output neurons to other areas (Rockland, 1997 ) and drive the retinotopic corresponding neurons in area 19 and 21 to net excitation and firing (Figures 5 B and 6 ). This produces a smaller bump where the object is mapped, and subsequently a more moderate lateral pre-excitation (Figure 6 ). Thus during the first 70 ms large populations of neurons in many visual areas become exited just below threshold or fire because the excitatory driving forces are favorable to the FF communication of the retinal change in these areas. In most of the areas receiving the ON response, some neurons fire, but many more become net-excited below the firing threshold (Figures 5 A and 6 ).
If a moving object appears in the field of view, the spatio-temporal dynamics roughly follows a similar scheme. Communications from the LGN drive an initial bump in area 17 mapping the moving object. The neurons in the bump drive a lateral spreading pre-excitation and communicate FF to higher order areas (Figure 7 ). Figure 5 C shows the driving neurons communicating the r(t) ON response to the target population in area 21 and the net-inward currents in the neurons mapping the moving object at the area 17/18 border and the 19/21 border during FF and FB. If the object moves over the retina, the LGN-cortical communication of r(t) will target neuron populations located at subsequently more and more lateral positions from the cortical point where the moving object was initially mapped. As the neurons at the cortical site of the initial mapping fire and drive their target neurons outside this site into a lateral spreading excitation (Figure 7 A), the moving ON input to neurons in the cortical direction of motion adds net-inward current to the already exited neurons, but only in the direction of cortical motion. When the ON communication from LGN moves further, the target neurons in the direction of cortical motion only gets additional inward current. This produces a pre-excitation and sparse firing ahead of the moving map of the object in areas 17/18 and 19/21 where most of the neurons are excited below firing threshold, but waiting for an additional excitation to bring them over threshold (Figures 7 A,B). According to Harvey et al. (2009) this mechanism repeats and enhances in higher order areas 19 and 21, which compute an extended excitation ahead of the mapping of the object. This computation is communicated as an excitatory FB to areas 17 and 18 at the time when the excitatory driving forces are favorable (84–99 ms Figure 7 ). As the specific directional pre-excitation has just evolved in area 17 and 18, inward current adds now from the excitatory FB and fire the neurons as far as 8° ahead (Harvey et al., 2009 ) (Figures 7 A,B and 10 ).
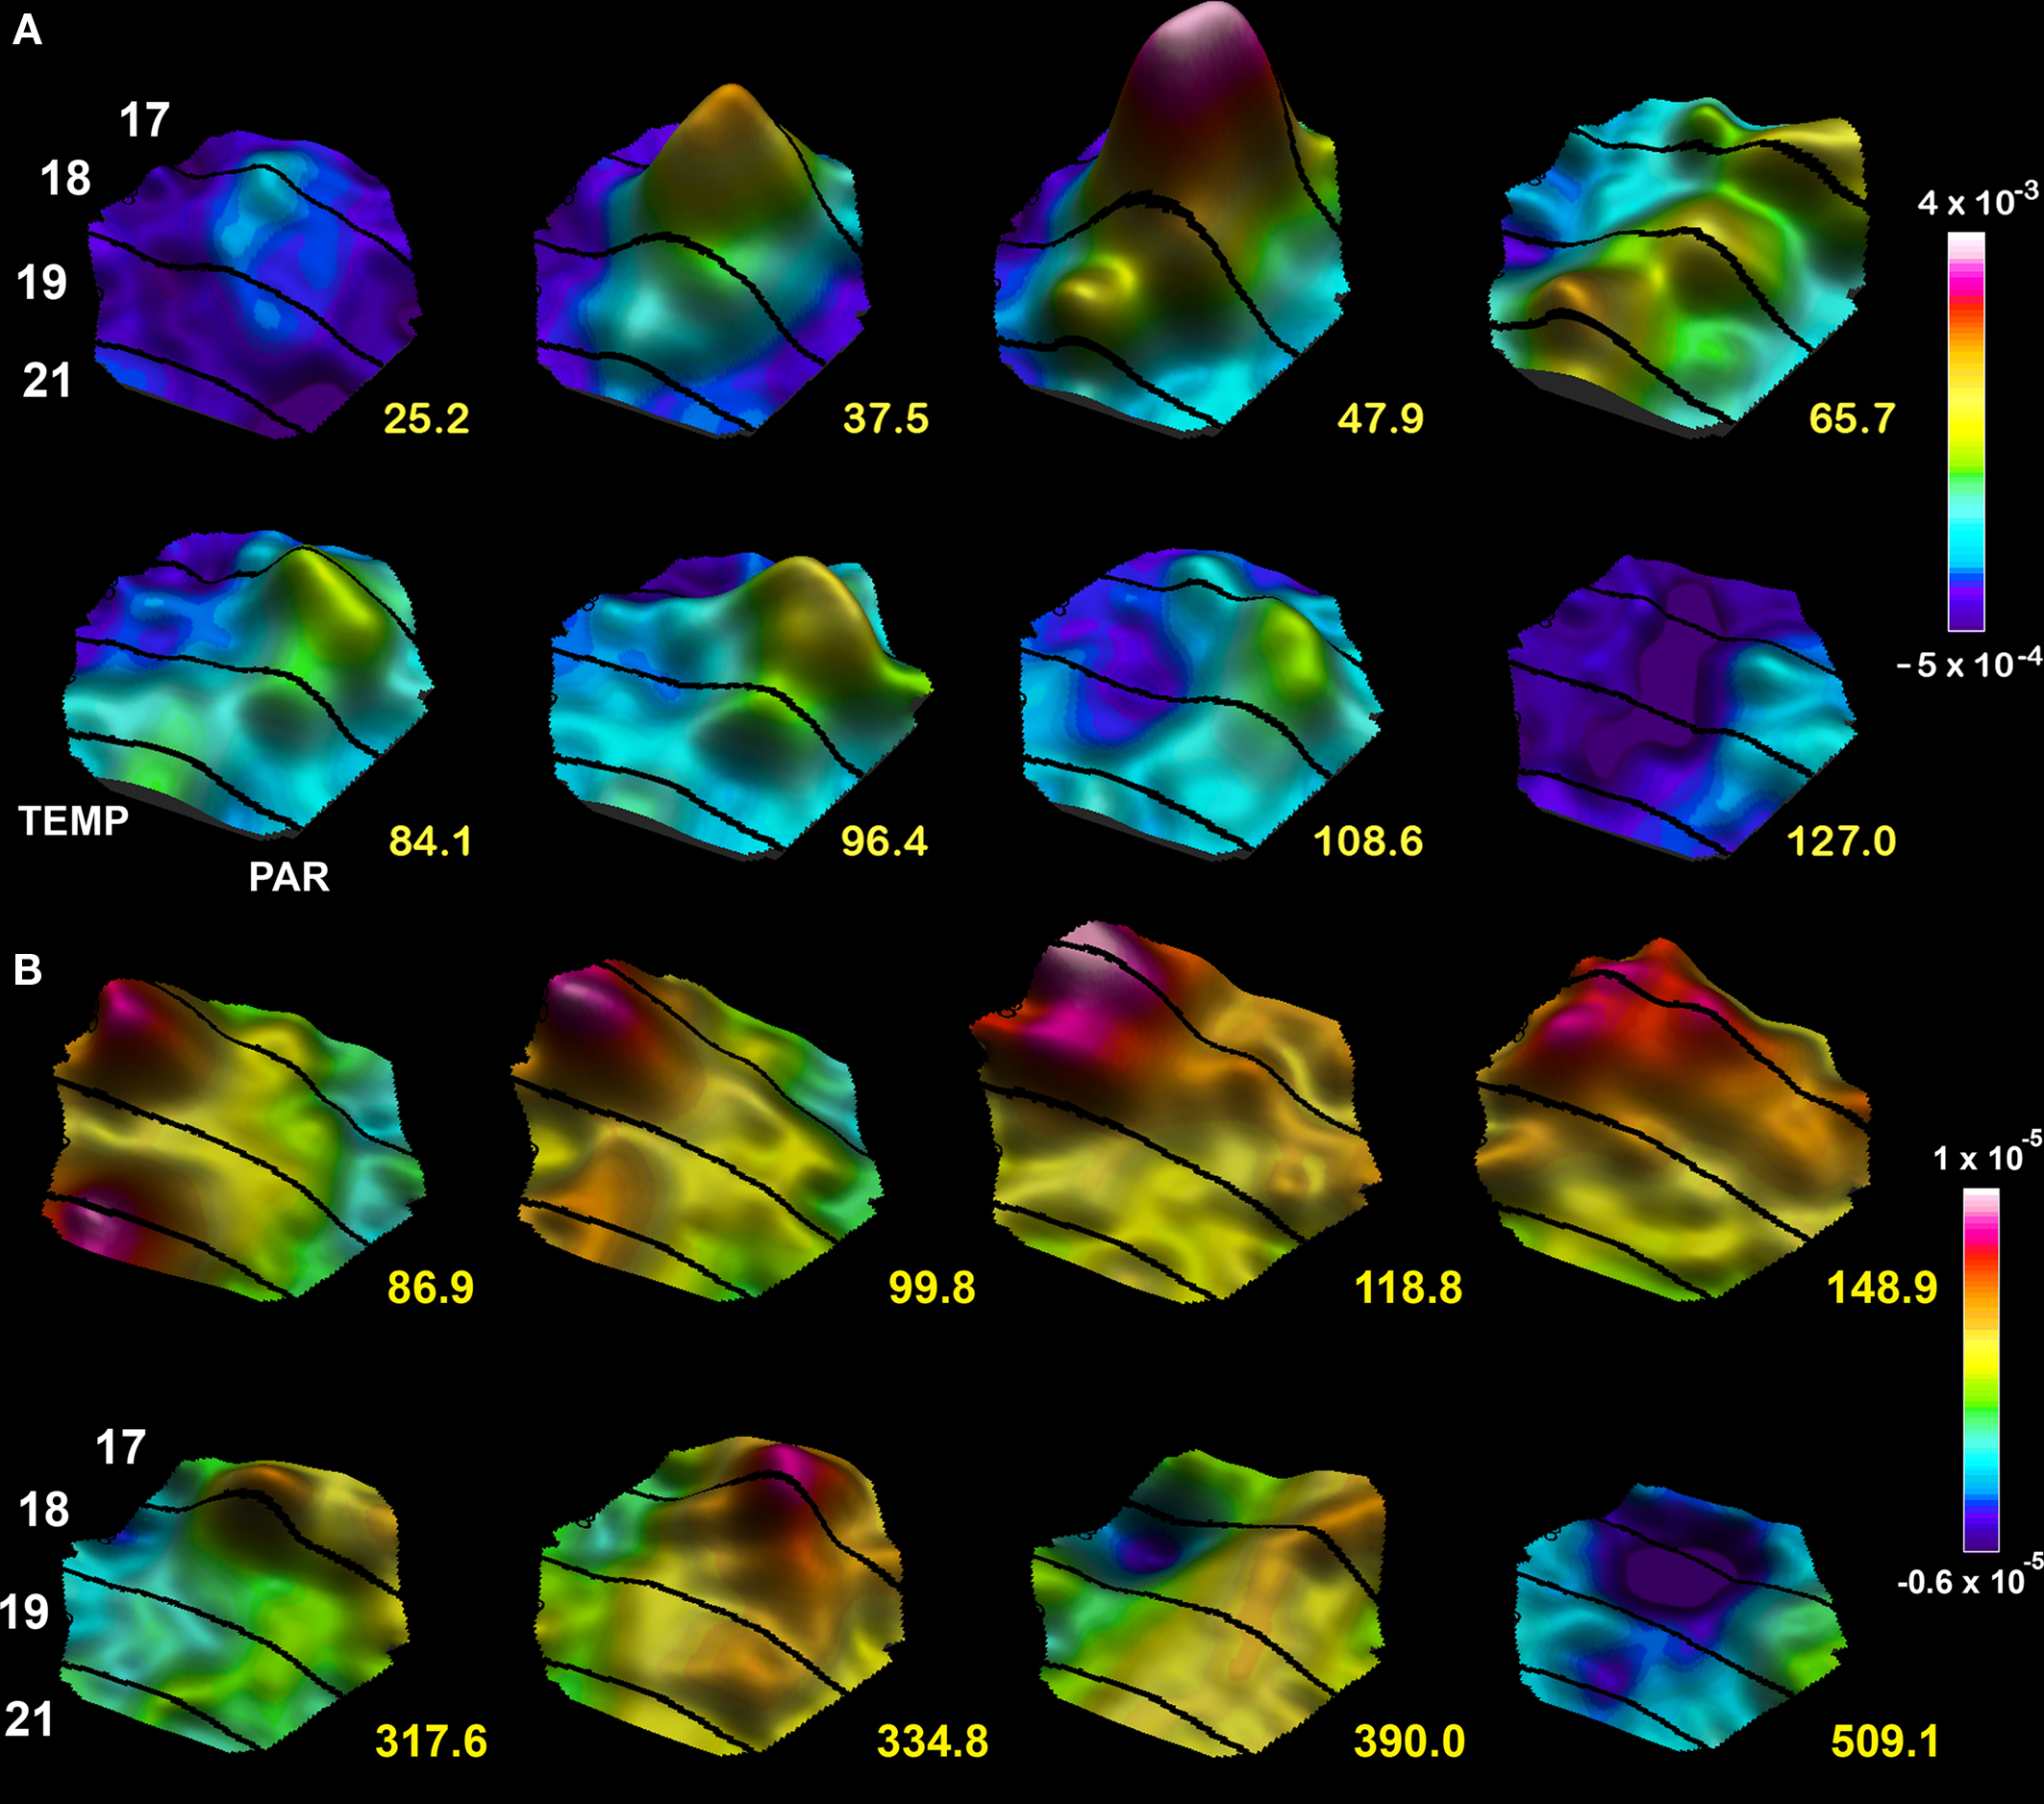
Figure 7. Spatio-temporal dynamics snapshots of the dVm/dt in response to a moving bar 1 × 2°. (A) Appearing in the center of field of view at time 0 ms. Note the FF excitation establishing a moving bump at the area 19/21 border, the lateral spreading excitation from both mapping sites, the FB directed towards the cortical direction of motion 65.7–84.1 ms and the resulting excitation in the direction of cortical motion along the 17/18 border 96.4 ms, the lateral inhibition spreading behind the excitations mapping the moving object 108.6–127 ms. (B) Moving object appearing 10.5° from the center in the peripheral field of view. The mapping of the moving object enters the measurement area at 86.9 ms. FB from the 19/21 mapping site towards the 17/18 mapping site 99.8–118 ms, computation of an excitation in the cortical direction of motion 148.9 ms, progress towards the cortical zone mapping the center of field of view 317–334.8 ms associated with a new FF excitation towards the 19/21 border. As the object moves on the lateral spreading inhibition appears at the sites where the object was mapped along the 17/18 cytoarchitectural border.
Despite the uncertainty in predicting dynamics of complex systems in general, the dynamic sequence is the most likely outcome from a sudden change in the visual surround. The neurons in visual areas are driven by retinal-LGN ON responses, if the driving forces are favorable. In each visual area the neurons fire at the retinotopic sites and from these mapping neurons, many more neurons become pre-excited either by lateral net excitation or specifically in the cortical direction of object motion during the first 70 ms.
As the Retina Transmits Changes in the Visual Scene, the Neurons in the Visual Areas must Integrate the Changes with Their Previous Activity
In order to compute the current scene under sudden visual scene shifts, the visual cortical neurons must integrate the change signal with the activity remaining from the previous scene in order to gain information about the present scene. Thus an optimal decoding will integrate the inward current induced by the ON response with the current membrane potential. Although the pyramidal neurons in area 17 receiving the ON response from the LGN have some integrating properties, the area 17 neurons tend to respond with similar ON responses as the neurons in the LGN (Jung et al., 1952 ; Hubel and Wiesel, 1962 ; Hirsch et al., 1998 ; Martinez et al., 2002 ).
In the higher order inferior temporal visual areas, the constituents of the visual scene are mapped according to shape, not according to retinal position (Tanaka et al., 1991 ; Wang et al., 1996 ; Tsunoda et al., 2001 ; Yamane et al., 2006 ). This mapping shows size and gaze shift invariance (Tovee et al., 1993 ; Ito et al., 1995 ) meaning that the IT neurons lost information of the relations between figure and background, retinal position, and object size (Baylis and Driver, 2001 ). This information however is present in the parietal visual areas and may be present in the FB from these areas (Eriksson and Roland, 2006 ; Roland et al., 2006 ).
Although there is sparse information about the membrane dynamics in IT, the driving by afferent axons is such that the whole area becomes net excited with some maxima scattered over the area and neurons firing most at the locations of the maxima (Homma and Tanifuji, 2004; Tanaka et al., 1991 ; Wang et al., 1998 ; Yamane et al., 2006 ) (Figure 5 A).
The neurons in the inferior temporal cortex integrate over longer time-intervals compared to those in the primary and early visual areas (Kovács et al., 1995 ; Schroeder et al., 1998 ; Freedman et al., 2003 ; Brincat and Connor, 2006 ; Chen et al., 2007 ; Akrami et al., 2009 ) (Figure 5 B). As the inferior temporal neurons start their integration some 50 ms after the sudden scene change, it takes some time to compute the current scene. In IT cortex the neurons integrate from 50 to 70 ms the change in the visual scene communicated to them in the form of an ON r(t) from lower order visual areas. The layer III neurons are the first to be driven in IT by the FF communication (Schroeder et al., 1998 ; Chen et al., 2007 ). The integration may take place in the dendrites of the neurons in supragranular layers. Simultaneously the dendrites in supragranular layers could be retrieved for their memory (Roland, 2002 ). The retrieved memories are r(t)s which correlate with the recognized objects (Liu et al., 2009 ). The proposal is that this information is then communicated as a FB to lower order areas. The dendrites of the neurons of the IT network integrate what is communicated to them by increasing their inward currents to provide a net increase in the excitation (dVm/dt) peaking around 70–80 ms (Figure 5 B). The net increases in the inward current drives the IT neurons to fire and in turn their target neurons to fire above their spontaneous rate (Li et al., 1993 ; Nakamura et al., 1994 ; Kovács et al., 1995 ; Schroeder et al., 1998 ; Rolls and Deco, 2001 ; Tompa et al., 2005 ; Chen et al., 2007 ). It is assumed that some of the target neurons have FB axons to areas 21, 19, and 17 (Rockland, 1997 ).
As seen in Figure 3 , the r(t) correlation to the current scene in area 17 dominates after 90 ms. This is just after the FB from the higher order visual areas has reached area 17 (Figures 5 B, 6 , and 7 ). The FB arrival in area 17 gives rise to a second and smaller increase in r(t) in area 17 peaking just after 100 ms (Roland et al., 2006 ) (Figures 4 –6 , and 8 ). Since the IT neurons may be better suited to compute the objects of the current scene, than are the area 17 neurons, the area 17 neurons may be dependent on the FB from IT to convert their change-decoding into a decoding of the current scene.
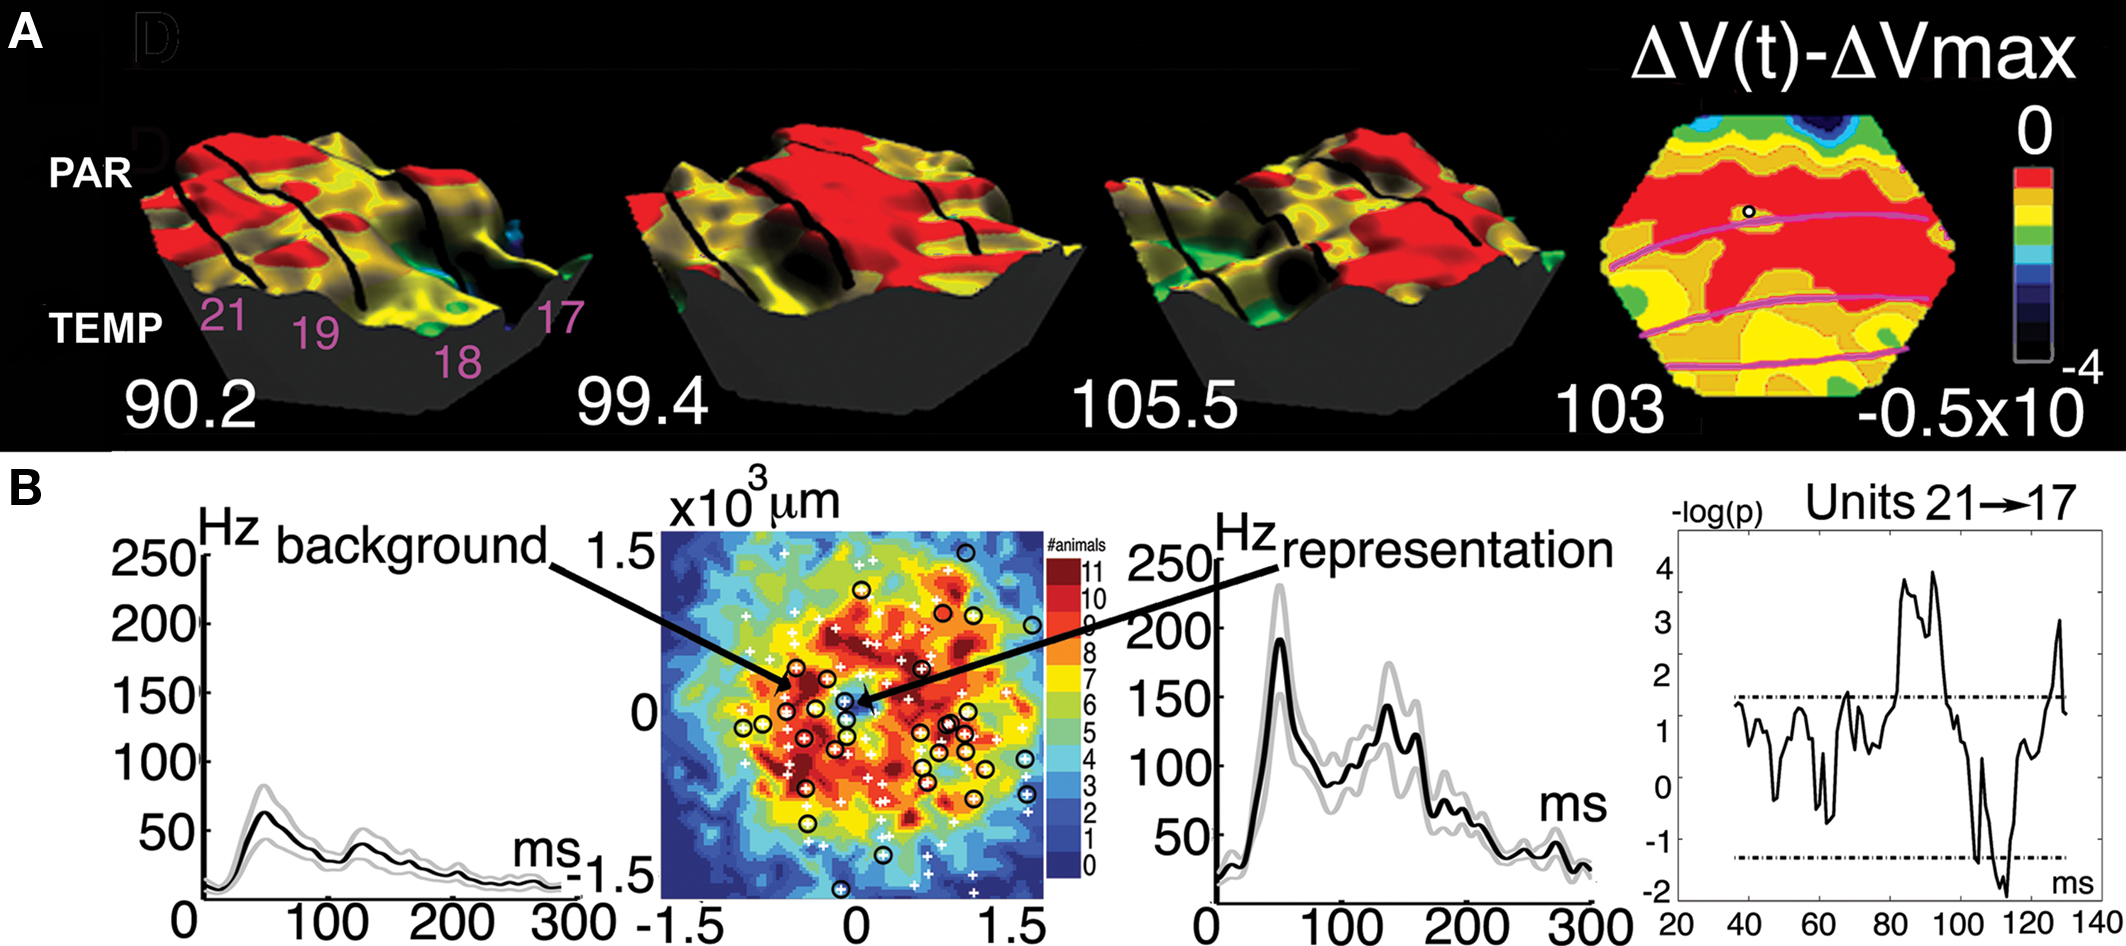
Figure 8. The feedback to the appearance a small stationary luminance defined square. (A) Three-dimensional display of the top of the FB excitation moving from parietal and temporal visual areas via areas 21, 19, and 18 to area 17. Time in milliseconds after the appearance of the square. Right: The FB in interaction with the mapping neurons in areas 17/18 segments the square from its background at 103 ms. (B) From the left: The neurons in areas 17 and 18 mapping the object background fire significantly when the square is introduced (multiunit activity). The electrode penetration sites in relation to the segmentation of the square from its background in 11 animals. The multiunit activity of neurons mapping the square (standard errors of mean shown). Neurons firing statistically significantly in the cortex mapping the object background between the mapping site at the area 19/21 border and the site in area 17. Note the statistically significant firing at the time the FB passes 86–96 ms and the following significant decrease in the firing rate (modified from Roland et al., 2006 ).
In addition to the neurophysiological evidence for change–integration decoding by visual areas, there are other arguments. The first is that, that if the perception of the scene should be completed in 120–150 ms, there is no time for any further cycles of FB and FF for recognizing the new items and the new scene. Indeed humans are able to recognize objects shown for 60–70 ms even when such short exposure is followed by a mask (Kovács et al., 1995 ; Thorpe et al., 1996 ; Delorme et al., 2000 ) whereas recognition of the whole scene takes 40–60 ms more (Rieger et al., 2005 ). Neither is there any chance that a second ON response to the same change in the visual scene should develop which could drive the integration of the change once more. The purpose of the FB from IT cortex to lower order visual areas then is suggested to be communication of the interpretation and recognition of current objects to lower order areas.
To Each Change in the Visual Scene, Neurons in Higher Order Areas Send Feedback to Many Neurons in Lower Order Areas
In cortical dynamics, feedback (FB) is the communication of a higher order area’s computational results to a lower order area. The FB described here is a cortico–cortical FB appearing usually 70–120 ms after the change in the visual scene. This FB is an expression of the dynamics of the network of neurons in the visual areas and independent of whether the animal is awake or anesthetized (Tagagaki, 2008 ; Eriksson and Roland, 2006 ; Roland et al., 2006 ; Xu et al., 2007 ; Harvey et al., 2009 ). This distinguishes FB from other “top–down” phenomena associated with attention, expectation and anticipation (Roland, 1981 ; Friedman-Hill et al., 2003 ; Ro et al., 2003 ; Maunsell and Treue, 2006 ). Also attention related FB seems to have another time course 150–300 ms (Mehta et al., 2000a ,b ). The FB is a consequence of the principle that neurons drive their targets if the driving forces are favorable.
Neurons in higher areas from 45 to 75 ms compute what is communicated to them to arrive at results that differ from those computed in the primary and lower order visual areas (Shinomoto et al., 2009 ). Examples are categorization of objects, memory retrieval and memory formation, interpretations and predictions (Freedman et al., 2003 ; Brincat and Connor, 2006 ; Ahmed et al., 2008 ; Akrami et al., 2009 ; Harvey et al., 2009 ; Liu et al., 2009 ). In addition the receptive field size increases from 1° in area 17 to 60° in higher order retinotopic areas (Rosa et al., 1997 ; Gattass et al., 2005 ). The span of the dendritic branches and their number of synapses increases from lower to higher order areas (Elston, 2003 ), and the anatomical circuitry also changes (Barone et al., 2000 ). Neurons in the inferior temporal cortex integrate over longer times than do area 17 and 18 neurons.
There is increasing evidence that populations of neurons in higher order areas send FB to early areas 17 and 18 in the time interval 70–120 ms (Lamme, 1995 ; Vanduffel et al., 1997 ; Hupé et al., 1998 ; Angelucci et al., 2002 ; Salazar et al., 2004 ; Eriksson and Roland, 2006 ; Roland et al., 2006 ; Lippert et al., 2007 ; Xu et al., 2007 ; Ahmed et al., 2008 ; Scholte et al., 2008 ; Takagaki et al., 2008 ; Harvey et al., 2009 ; Wibral et al., 2009 ). The direct evidence for FB stems from observations of (“waves” of) net synaptic excitation (Berger et al., 2007 ; Eriksson et al., 2008 ) moving with relatively high velocity over the cortex from higher order areas to lower order areas (Eriksson and Roland, 2006 ; Roland et al., 2006 ; Lippert et al., 2007 ; Xu et al., 2007 ; Ahmed et al., 2008 ; Takagaki et al., 2008 ; Harvey et al., 2009 ). The spatial progress of the FB over the cortex matches the course of the FB axons, in species in which there is anatomical evidence (Cantone et al., 2005 , 2006 ; Eriksson and Roland, 2006 ; Roland et al., 2006 ; Ahmed et al., 2008 ; Harvey et al., 2009 ) (Figures 6 –8 ). This suggests that the FB axons make synapses on their way to lower areas (Rockland, 1997 ). Other, indirect, evidence for FB stems from cross-correlations between local field potentials in higher order areas and area 17 with a lag of some 5–10 ms (Von Stein et al., 2000 ; Eckhorn et al., 2004 ; Salazar et al., 2004 ; Wibral et al., 2009 ) and cross-correlations in the firing of neurons in supra- and infra-granular layers with the laminar firing in higher order areas (see below). Yet other evidence for FB stem from temporary or permanent interference with the function of higher order areas (Mignard and Malpeli, 1991 ; Vanduffel et al., 1997 ; Hupé et al., 1998 ; Galuske et al., 2002 ).
The neurons in the temporal cortex and the neurons in parietal cortex generate FB to area 17 and lower order sensory areas (Figures 5 A and 8 ). There is at least one FB to any change in the visual scene (Roland et al., 2006 ; Xu et al., 2007 ; Ahmed et al., 2008 ; Harvey et al., 2009 ). Feedback is the rule, rather than the exception (1st principle). Since the FBs are the computational results of the populations of neurons in higher order areas, and since the higher areas should be able to compute interpretations of any visual scene, the feedbacks should be diverse in origin, shape, amplitude, timing, cortical trajectory, and targets. This diversity in turn then should depend partly on the changes in the visual scene, for example whether the objects in the scene are moving or the scene is stationary. It is not known exactly how the excitatory FB is computed, but laminar recordings of local field potentials from temporal visual areas show excitatory activity of infra-granular neurons just prior to the FB (Schroeder et al., 1998 ; Chen et al., 2007 ). Experimentally the feedbacks are fast, propagating with velocities of 0.2–0.3 mm ms−1 over the cortex and in general excite large populations of neurons in lower order areas (Eriksson and Roland, 2006 ; Roland et al., 2006 ; Xu et al., 2007 ; Ahmed et al., 2008 ; Takagaki et al., 2008 ; Harvey et al., 2009 ).
The Principle of Reconciling Computational Differences by Feedbacks
The principle states that computational differences between higher and lower order areas reconcile by FB. When the FB arrives in the lower order area, the neurons in the lower order area will decode the FB and compute a result, r(t), that in most cases will give rise to cortical spatio-temporal dynamics of the Vm and r(t) similar to that in the higher order areas. This is in particular true for those populations of neurons in lower order areas being pre-exited. Higher order areas may also reconcile their mutual computational differences by mutual excitatory communications, as may lower order areas.
When a stationary object appears in the field of view, this elicits FB from temporal and parietal visual areas at 60–75 ms. The FB first aims at the cortical sites mapping the change in areas 19/21 and 17/18 (Figures 5 A and 8 A). This is the focused FB. The focused FB first reaches the mapping sites in areas 19 and 21. At the mapping sites in area 21 and 19, the inward current is still increased at 75 ms (Figure 5 B). The additional inward current provided by the FB may further accelerate the inward current (Figure 6 ). The r(t) increases, most pronounced in the infra- and supragranular layers, reach a new maximum at 80 ms (Figure 9 ).
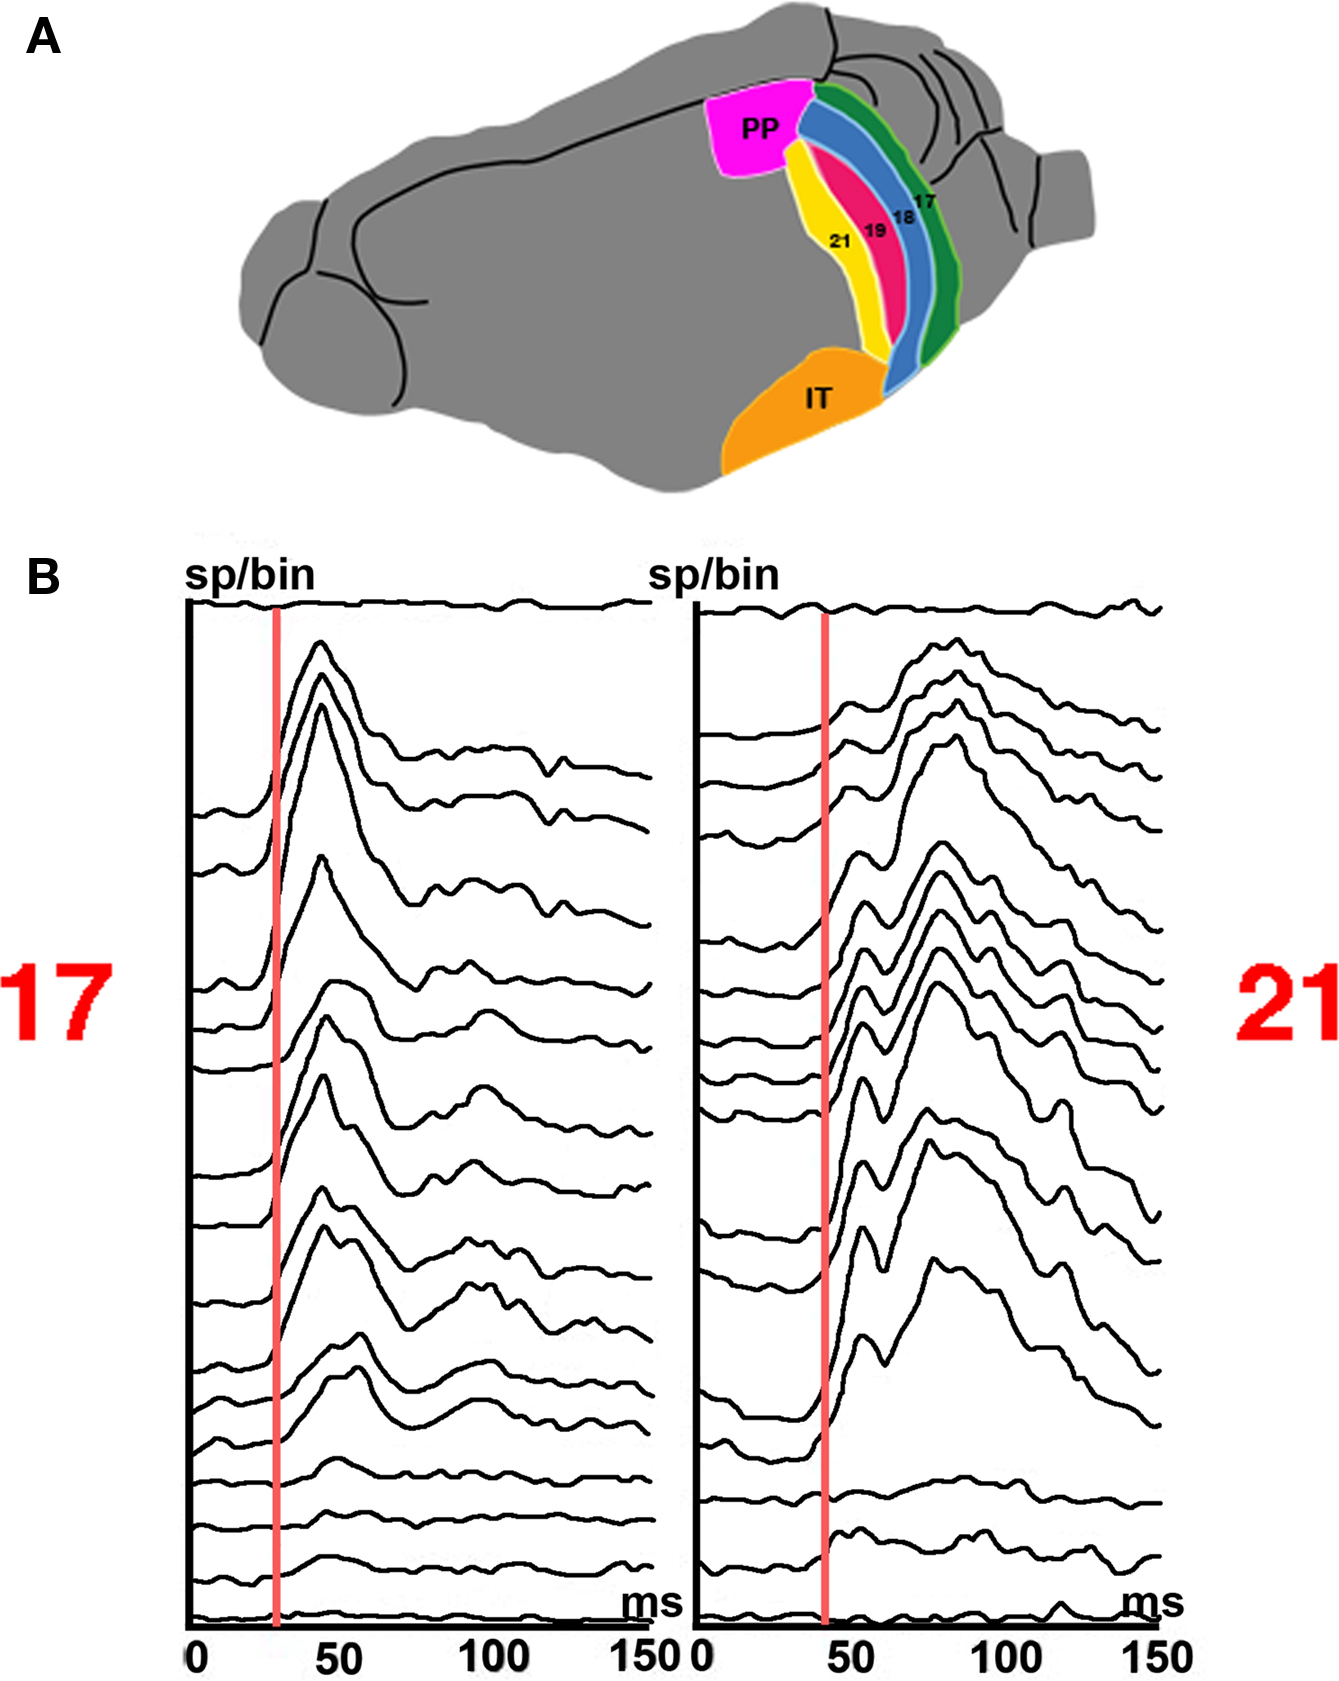
Figure 9. Laminar firing at the mapping sites in area 17 and 21 of a stationary square appearing at 0 ms. (A) Six visual areas of the ferret. (B) Post stimulus histogram from 16 leads. Note the difference in latencies between laminae and the longer latencies to peak in area 21. Note also the larger amplitude of the r(t) and earlier peak to the FB from higher order areas at 80 ms in area 21 compared to the second peak in area 17 (100 ms).
Meanwhile the FB continues towards the mapping sites in areas 17 and 18. Here the effects of the ON response have faded. First, the intensive firing associated with the ON response may have opened K+ channels in the spiking neurons, which brought down the dVm/dt towards baseline (sometimes called spike rate adaptation). Second, with the ON response, the inhibitory drive increased, which attenuated the net-inward current and reduced the r(t) (Figure 5 B). At 75 ms the inward current at the mapping site diminished considerably to the level of the pre-excited neurons. From then on the dVm/dt in area 17 does not change much. The pre-excited neurons, however, should have been free from spike rate adaptation and significant inhibition (Figures 5 B, 6 , and 8 ). Thus when the FB arrived, the target neurons in areas 18 and 17 should have reasonable excitatory driving forces. The excitatory FB increases the inward current of the pre-exited neurons and those neurons not firing, but as the Vm is still relatively high in area 17 at 75 ms (Figure 4 ), the increases in dVm/dt and Vm become more moderate (Figures 5 B, 6 , and 8 ). For this reason the increase in r(t) in area 17 to the FB is also moderate (Figures 5 B, 8 , and 9 ). This second and moderate increase in the firing rate at the object-mapping site in area 17 has been known for many years, but it has not previously been associated with cortical FB. What speaks against thalamo–cortical origin and local generation of the 100–110 ms firing is that this r(t) increase is most pronounced in supra- and infra-granular layers (Figure 9 ). Moreover, the r(t) increase, by 5–8 ms, lags the increase in dVm/dt induced by the FB (Figures 5 B and 8 B). Furthermore, in area 21 at the mapping site, the increase of the r(t) peaked at 80 ms and preceded the weaker increases at the mapping site in area 17 in the supra- and infra-granular layers peaking at 100 ms (Figure 9 ). In area 17 at the mapping site, the many pre-exited neurons decode the FB, i.e., the communication of the computational results of higher order area neurons. Since the FB, hypothetically, drives mainly pre-excited and non-firing neurons, these neurons will compute the computational results of the higher areas, and when they fire communicate these results to their local surround.
The firing associated with the FB again increases the inhibitory driving forces in area 17. The pyramidal neurons in layers II and III are monosynaptically connected to nearby inhibitory neurons and most of these connections are mutual (Holmgren et al., 2003 ). As many pyramidal neurons connect to one and the same interneuron (Holmgren et al., 2003 ), the more pyramidal neurons fire the stronger the inhibition that is returned. This means that when the firing of such an interneuron becomes sufficiently strong, it can silence many surrounding pyramidal neurons. As the FB also ceases and the retinal communication of APs to area 17 is now moderate and steady state, the outward currents drive the mapping neurons in area 17 into net inhibition (100–130 ms) (Figures 5 B, 6 , and 8 B).
The inhibition starts at the mapping site, driving the dVm/dt below baseline (Figures 6 and 7 ). At this moment the temporal, and parietal areas provide a broad FB exciting the cortex that was pre-excited in areas 21, 19, 18, and 17 and mapping the object background (Figure 8 A). When the broad excitatory FB sweeps over areas 18 and 17, the excited neurons located in the cortex mapping the object background fire sparsely (Figure 8 B). The firing in the cortical domain mapping the background in areas 19, 18, and 17 also follow the same pattern of a clear, but sparse increase in r(t) followed, after 15 ms, by a short significant decrease of the r(t) (Figure 8 B). As the broad FB lags the FB to the 17/18 mapping sites by 8–10 ms (see Figure 5 A), the two feedbacks and their related firing provide a segmentation of figure from ground in time and cortical space (Roland et al., 2006 ) (Figures 8 A,B). This is one example of reconciling computational differences between higher and lower order visual areas, because the IT neurons have no information about the relations between object and background (Baylis and Driver, 2001 ).
That the FB to the mapping sites may contain (integrated) information about the current visual scene has support from studies showing that the information about the current visual scene in the r(t) in area 17 increases in the interval 90–120 ms (Heller et al., 1995 ; Eriksson et al., 2010 ). Under the assumption that the FB to areas 17 and 18 contain information about the current visual scene, the FB serves the purpose of reconciling the differences in the computational results by the higher areas (having integrated the change of scene with the previous scene) and the lower order areas (having just finished computing the change) (Figure 5 ). After the decoding of the FB by the lower order areas, the discrepancy disappears. This also implies that the lower order areas, after the feedbacks, compute visual scenes as opposed to just computing visual changes by appearing or disappearing objects.
For objects moving over the retina, lower order areas compute a pre-excitation in the direction of cortical motion (Figure 7 ). The higher order areas 19 and 21 compute a more extended excitation predicting the future course of the object mapping over the cortex (Movie 1 in supplementary file, 104–120 ms) (Harvey et al., 2009 ). This predictive net excitation is sent as a FB at 115–120 ms exciting the moving object map in areas 17 and 18 (Figure 7 and Movie 1 in supplementary material). But mainly the FB targets the cortex in areas 17 and 18 where the neurons were specifically pre-excited, i.e., ahead of the object mapping (Movie 1 in supplementary material and Figure 7 B) (Harvey et al., 2009 ). The additional inward current from the excitatory FB seemingly brings the pre-exited neurons over their firing threshold, especially in the infra-granular layers (Figure 10 ). Here, in area 17, the neurons fire along the predicted future cortical path (Movie 1 in supplementary material and Figure 10 ). The FB thus also in this condition reconciles the computational differences between higher areas (19/21) and lower visual areas (17/18) by targeting the pre-exited neuron population, which then computes a result similar to that of areas 19 and 21.
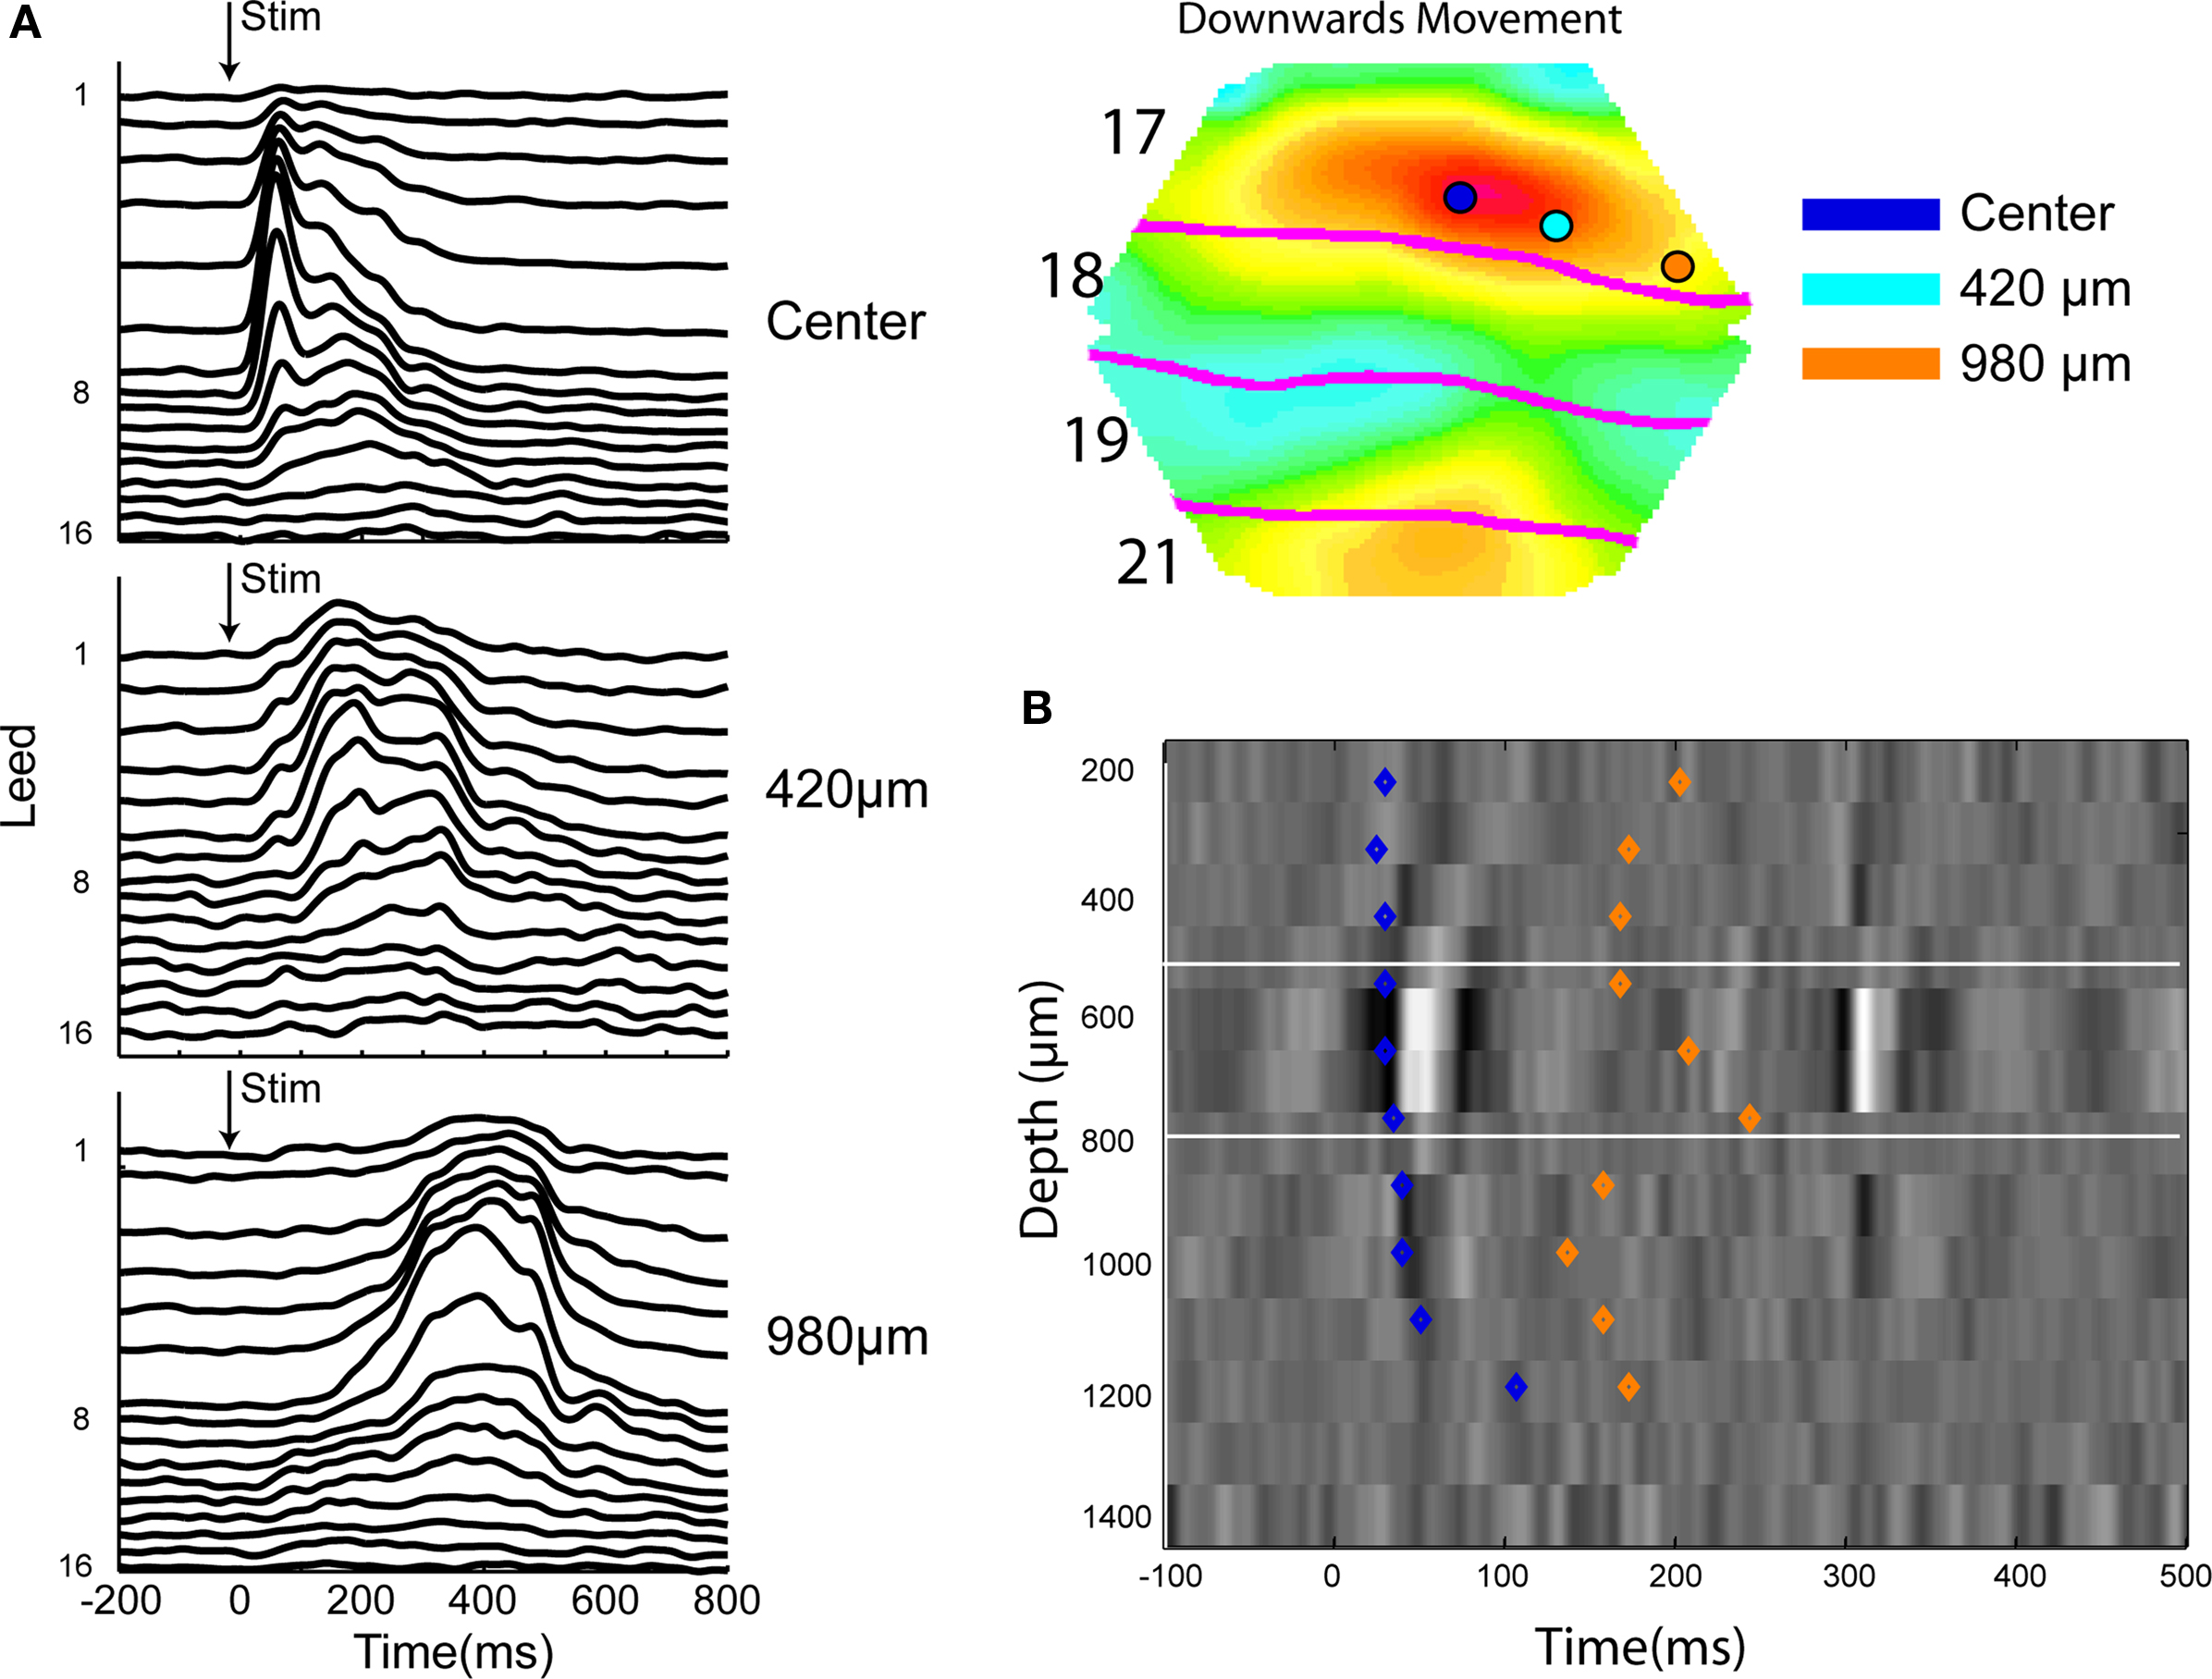
Figure 10. Laminar firing to a small bar moving downwards along the vertical meridian at three different positions along the cytoarchitectural border between areas 17 and 18 mapping the vertical meridian. (A) The moving bar was introduced moving from the center of field of view. From the top laminar post stimulus histogram from 16 leads across the cortex at the point mapping the center of field of view showing the latency differences. At 420 μm, i.e., 85 ms after the appearance the neurons in the upper layers fire first. At 980 μm, i.e., at 195 ms and after the FB the infra-granular neurons lead the onset of firing. (B) Current source density at the center cortical point with the onset latencies of the laminar onsets of firing (from M. Harvey, unpublished material from experiments described in Harvey et al., 2009 ).
As the moving object was mapped with different delays in different visual areas, these mappings were out of phase. After 60–70 ms the mapping in areas 19/21 appeared ahead of that in 17/18 (Movie 1 in supplementary material). However, after the FB from areas 19 and 21 has reached areas 18 and 17, the excitation across areas 17, 18, 19, and 21, from 150 ms and onwards progress in phase over the cortex (Movie 1 in supplementary material and Figure 7 B). Whether the cortico–cortical FB alone is instrumental to synchronize the progress of the excitatory activity over several visual areas remains to be tested experimentally. Cortico–thalamo–cortical FB may also be instrumental to reconcile and bring the mappings in phase (Silito et al., 2006 ).
One may question whether this principle of neuron populations in the (visual) cortical areas reconciling differences in computations between higher and lower areas also works if the FB is carrying information about the visual scene that violates the physical content of that scene. This question was examined in recent studies of a visual illusion, apparent motion. Primates and carnivores perceive apparent motion when a series of static images are displayed in quick succession with a spatial shift, such as in movies, video and TV. If a static object is displayed this way, the neurons in the primary visual cortex, area 17, correctly map the object in distinct and successively different retinotopic sites as increases in the inward current and an r(t) ON-response (Ahmed et al., 2008 ). The firing is very sparse between these mapping sites (Figure 11 ). However, after the offset of the object in one position, neurons in higher order visual areas 19 and 21 map the object as moving over the cortex between its retinotopic mapping positions (Figure 11 ). This is presumably due to the larger receptive fields of the neurons in areas 19 and 21 (Manger et al., 2002 ; Philipp et al., 2006 ). This implies that computation of motion takes place in the higher order area at retinotopic coordinates in area 19 between the successive object-mapping sites, whereas the neurons in corresponding retinotopic sites of area 17 show just spontaneous activity and resting baseline Vm (Figure 11 ). The 19/21 neurons, mapping the object as moving between the object-mapping sites, send a FB to the neurons located in between the retinotopic mapping sites in areas 17/18 (Figure 11 C). This FB excites and fire the neurons in area 17 in between the retinotopic map of the object in one stationary position and the next (Ahmed et al., 2008 ) (Figures 11 E,F). This replicates the computational result of areas 19/21 and reconciles the computational difference between areas 17/18 and 19/21 and probably other visual areas within 40 ms after the offset of the object at one position.
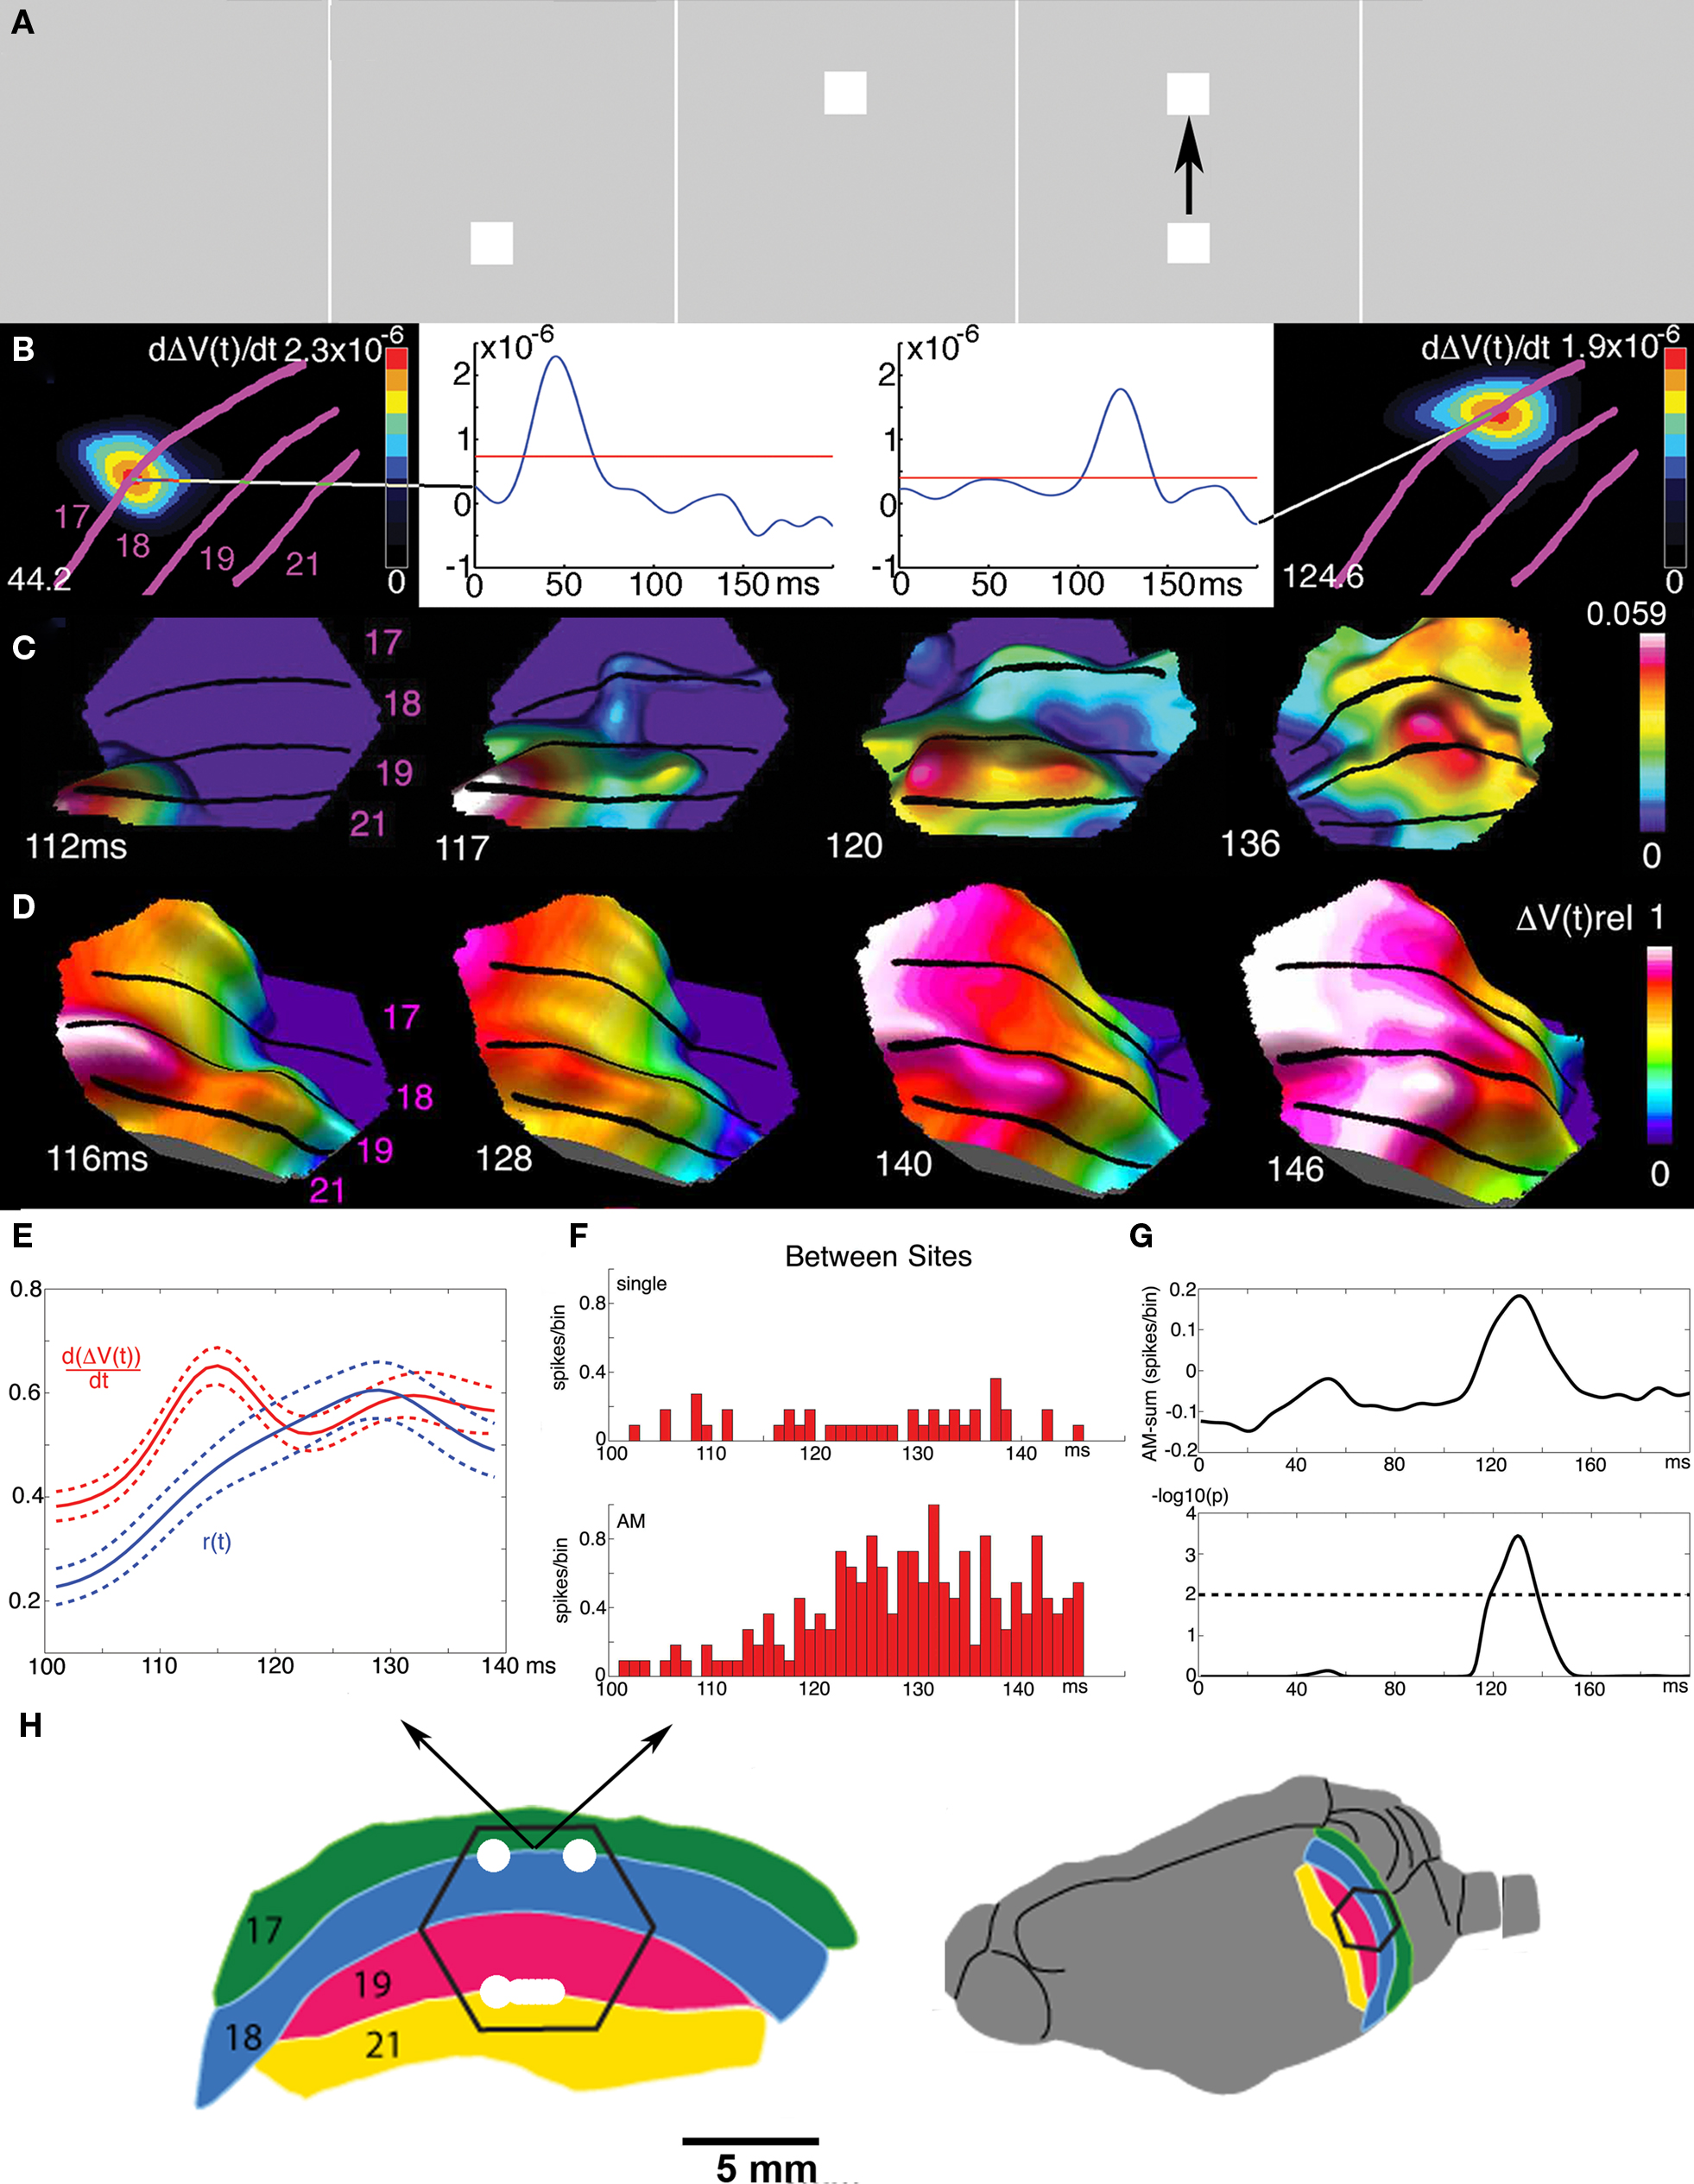
Figure 11. Cortical spatio-temporal dynamics of the apparent motion illusion. (A) A square is shown to the ferret in quick succession in two positions in the field of view, giving the illusion of apparent motion in humans. (B) The square is mapped as increases in dVm/dt in the cortex at two distinct positions at the 17/18 area border 44.2 and 124.6 ms. (C) At 112 ms a FB from areas 19/21 exciting the neurons on the way back to area 17, then turning and exciting and firing the neurons in the space in-between the mappings at the 17/18 border. (D) After this the excitation of areas 17, 18, 19, and 21 progress over the cortex in phase. (E) the transverse excitation (dVm/dt) induced by the FB and the r(t) in between the stationary mappings. Average of 10 animals with S.E.M. (F) Firing of a multiunit at the 17/81 border between the stationary object mappings to the control (only one object flashed at the time at the corresponding positions) and during apparent motion (AM). (G) Mean difference between the r(t) in 10 animals between the apparent motion condition and the sum of r(t) in the control conditions (top). Bottom: units firing significantly more APs in apparent motion condition, but only just after the FB to area 17 and only in between the object mappings shown in B. (H) Cartoon of visual areas 17, 18, 19, and 21 with the mappings of the bottom and top square (A) in the time interval 100–140 ms. Note that the higher order areas 19/21 in the apparent motion case enslave areas 17/18 to compute (apparent) object motion out of objects initially mapped as stationary objects by the 17/18 neurons (modified from Ahmed et al., 2008 ).
That the FB from higher order areas was instrumental in producing apparent motion in areas 17/18 is supported by the finding that the net excitation from the FB propagated from the mapping site of the object at the off-going position to the cortical position where the object just went on. Moreover, this was followed within 5–10 ms by an increase in r(t) between these object-mapping positions (Figures 11 E,F). Further, if first one object is shown in the center of field of view, and at the offset of this object, two identical objects are shown flanking the center of field of view – this elicits, in humans, the perception of the first object being split and moving as two objects to the flanking positions. In the ferret visual cortex, the mapping in area 17 is first as three stationary objects. In areas 19 and 21 the objects are mapped as one object being split and then moving to the flanking positions. Areas 19 and 21 then 32 ms after the offset of the center object send precise timed FBs to excite and fire neurons in between the center of field of view representation in area 17 and the retinotopic flanking positions (Ahmed et al., 2008 ). Prior to the FB, the mapping of the object in different areas was out of phase, but after the FB at 116–126 ms the excitation in cortex across the four visual areas progressed in phase, similar to what happens in continuous motion (Figure 11 D).
If a new object, object 2, appears in the field of view say 40 ms after object 1, the neurons mapping object 1 in area 17 have already communicated an ON response to the higher order areas. Object 2 will start to be mapped as an ON response in area 17 at 65 ms, i.e., just before the FB (about the change in the scene induced by object 1) arrives. The prediction is that the excitatory FB then will increase the inward current of the neurons in area 17 also mapping object 2 and hence increase the ON response and feed-forward r(t) associated with object 2. This increased ON response in turn will lead to a second FB to the lower order areas reconciling the presence of both object 2 and object 1. In this case the higher order area’s FB cannot overrule the appearance of a salient change in the visual scene. If a mask of the same size replaces object 1 after 40 ms, the second FB will excite the neurons in cortex mapping the change induced by the mask and its background. The computational differences between higher and lower order areas would be reconciled (the interpretation of the scene would be mask + background). If object 2 appears at a position besides or partly overlapping object 1, the second FB will target the object 2 mapping site as normally and the computational differences between higher and lower areas will be reconciled by a second FB.
All computational differences must be reconciled if the network of many neuron populations in the visual areas should arrive at an unambiguous computational result about the visual scene. In ambiguous scenes, Rubin’s vase and Necker cube for example, the lower order areas will map the physical contours correctly. The FB communicated from the higher order areas contains their current computational result. This changes when the computation in higher order areas changes to give the alternative interpretation. Therefore the alternative result will be communicated as FB to the lower order areas. In either case the mappings in area 17 prior to the arrival of the FB will be identical and the computation of the FB by lower order areas in any case will reconcile the computational difference.
The experimental examples showed that the feedbacks from higher order areas are diverse in origin direction, shape, cortical trajectories, and targets. The decoding of the FB provides information about the higher order areas interpretation of the current visual scene (Figures 5 –8 and 11 ). In the examples with moving objects and apparent motion, the lower order areas, after the FB, indeed computed dynamics in cortical space and time similar to that of the higher areas. The diversity of the FBs seems related to the differences in the visual scenes. In each case it is possible to decode the FB by measuring the Vm or dVm/dt dynamics. The decoding in retinotopic cortical space shows the visual areas interpretation of the scene. The effect of the FB on the target neuron populations in lower areas is not always improving the brains interpretation of physical realities in the visual surroundings (apparent motion, split motion), but the prediction is that FBs reconcile computation discrepancies between the higher and lower areas often in favor of the higher order areas computations.
The principle of FB reconciling the computational difference between higher and lower visual areas may seem similar to a proposal by Mumford (1992) and similar to predictive coding (Rao and Ballard, 1999 ). However in both these proposals area 17 sends error signals to the higher order areas, in contrast to the present proposal. Furthermore the FB in the model of Rao and Ballard (1999) is inhibitory. This is in conflict with the observations that cortico–cortical axons are excitatory. Moreover the predictive coding scheme assumes that the cortex possess an internal representation of the visual world and from this make predictions that are compared with the sensory signals. For the principle of reconciliation of computational differences (Box ) assumptions of prior knowledge, representations, and prediction are needless. The only assumption made is that the IT neurons integrate the communicated ON response. The FB excitation is needed to communicate the computational results of the higher order areas to the lower areas. The space–time dynamics of the decodings of all communications in the interval when the FB is active (80–130 ms) makes the interpretation of the scene by the lower areas.
One may ask how the higher order areas may reconcile their computational results? They may do this by communicating their results directly. In general two mutually, excitatory connected areas will, after a while, develop increases in dVm/dt, r(t), and Vm in the cortical zones their connections target. As pre-excitation is assumed to be present in all visual areas engaged by the FF communication, this might facilitate the reconciling. This is more easily seen in retinotopic-organized areas where similar dynamics evolve after both FF and FB (Figures 5 , 6 , and Movie 1 in supplementary material). If the areas do not directly communicate, they may communicate FB to the same lower areas (Figure 5 A). Here their results are reconciled.
When the Drive of the Driving Neurons Decrease and the dVm/dt and Excitatory Driving Forces of the Target Neurons Decrease – The Communications between Areas Diminish or Cease
As long as populations of neurons in different areas continue to communicate their different computational results, the network of interconnected cortical areas has not arrived at a coherent interpretation of the current visual scene. So, what stops or minimizes the communications between areas? Generally, the effect on the communications between areas depends on the biophysical state of the communicating and driving neurons and the biophysical state of the target neurons, especially their dVm/dt and Vm (1st principle, Box ). In most cases the FB will reconcile the computational differences between higher and lower areas. The excitatory driving forces of the populations in lower visual areas decrease after the FB if no new changes appear in the field of view and if the computational differences between cortical areas are reconciled. Contributing factors are the high Vm, that neurons just fired, and prevailing inhibition. This brings the network into a new dynamic regime, in which neurons in most visual areas fire sparsely. The sparse firing prevents the transition to spontaneous ongoing dynamics. When the driving forces decrease, the communications between areas cease or diminish radically.
The net excitation of the feedback arriving in areas 18 and 17 increases the Vm to its maximum at 90–130 ms where the object is mapped (Figures 4 , 6 , and 7 A; Harvey et al., 2009 ). The firing rate r(t) also increases in the interval 100–150 ms (Figures 9 and 10 ). If no further changes in the field of view are communicated to these sites, the r(t) and subsequently also the Vm(t) decreases (Figures 4 , 5 , 9 , and 10 ). The dVm(t)/dt turns negative in the supragranular layers, well below the baseline (Figures 6 and 7 A: 100–110 ms). This net outward current spreads out from the sites mapping the object as a lateral spreading inhibition in the supragranular layers. The lateral spreading inhibition could be the result of several inhibitory mechanisms. It does not seem to be induced by the FB, as lateral spreading inhibition appears also systematically at cortical sites where an object moving over the retina was mapped as increases in Vm(t) and r(t) (Figure 7 B; Harvey et al., 2009 ). So in general (lateral spreading) inhibition seem to follow peak firing with a delay of 80–150 ms. One plausible mechanism could be that the increase in Vm and r(t) opens Ca2+ channels and increases Ca2+ conductance. The increased Ca2+ activates an afterhyperpolarization K+ conductance that with a delay brings the dVm/dt down below baseline. This is most likely to happen where the firing has been most intense, which is where the object was mapped (Figures 6 and 7 ). The result is a net outward current that would be maximal at the cortical point(s) of maximal net excitation (Figures 6 and 7 ).
For the perception of stationary objects, the layer IV neurons, after the effect of the FB subsided, only receive a sustained input from the retina and LGN, i.e., dr(t)/dt ≈ 0. Such an input could drive some regular spiking excitatory neurons and perhaps some inhibitory neurons to moderate firing (Contreras and Palmer, 2003 ; Shinomoto et al., 2009 ). In addition, the remaining non-firing neurons may be under a regime of slight overweight of shunting inhibition (Monier et al., 2008 ). The lateral spreading inhibition inhibits the population in the output layer, layer III, and thus severely reduce FF communication to other visual areas. These factors reduce the FF communications to other areas. Furthermore the FF communication will consist of spike trains with little frequency modulation (dr(t)/dt → 0) which will have difficulties to drive target populations. Finally, in the higher order areas, the neurons will also tend to go to a more sustained firing with little modulation of r(t)(dr(t)/dt → 0) (Figures 5 B,C). This reduces the probability of further FBs. The neurons mapping the object will now fire sparsely, but at a rate above the spontaneous activity. As the mapping neurons and the neurons mapping the object background decoded the FB, this indicates that the sparse firing from 90 to 120 ms and onwards to some extent is related to the current visual scene (see also Eriksson et al., 2010 ). This regime may continue until the object disappears and the inhibition associated with the OFF response allows the neurons to return to the state of spontaneous ongoing firing. Pernberg et al. (1998) and Eriksson et al. (2008) showed that the initial effect of the offset of a stimulus most likely was inhibition.
For the perception of moving objects, the scene is not coherent until a catch-up saccade brings the moving object into the center of field of view. When the object is in the center of field of view, it can be segmented from its (now moving) background and, if it is pursued with the eyes, treated almost as a stationary object. Accelerations or decelerations of the object may induce retinal slips that are corrected by minor saccades.
Indeed the dVm/dt decreases below baseline for both stationary and moving stimuli some 80 ms after the peak firing (Figures 4 –7 ). For stationary stimuli, the Vm after 150 ms also goes below baseline in layers I–III and stays there until the stimulus goes OFF (Eriksson et al., 2008 ). This also indicates that no further FB are issued towards areas 17 and 18 from higher order areas and that the layer IV driving of supragranular layers is very modest in the simple case of no further changes in the visual scene. As there is still some sparse steady rate firing after 150 ms even in the supragranular layers (Figures 9 and 10 ) one should probably interpret this as specific firing driven by layer IV in an supragranular environment of net inhibition. The perception of the detailed visual scene may start at 120 ms (Rieger et al., 2005 ), when these communications and driving forces reduce to leave a constant input to the area 17 weakly driving the network of visual areas by FF communications. This stage of the cortical dynamics continues until the stimulus goes off, or until a new object appears, or until a saccade is made to other targets in the field of view.
Visual Cortical Dynamics are Well Behaved at the Mesoscopic Scale
The retina and LGN communicate changes in the visual scene. Neurons at any site can drive neurons to which they are directly connected. Pre-excitation feedbacks reconcile computational differences between higher and lower visual areas. Conversely, if the driving decrease and the excitatory driving forces decrease, the communications between areas diminish or cease. These five principles govern the most common dynamic sequence associated with a change in the visual scene:
1. The network of populations of neurons in visual areas tends to engage in a dynamic sequence of FF communications of the visual change signal to many visual areas, local pre-excitation/lateral spreading excitation within areas engaging large numbers of neurons. Then integration of the inward current associated with the change signal in neurons in higher visual areas and resulting memory formation/recognition conveyed in FB to lower order areas.
2. The FB and mutual inter-area communications, through their biophysical impact on the prevailing firing and pre-excited neurons, reconcile computational differences between areas and establish more coherent Vm and r(t) in the visual areas at the mesoscopic scale reflecting the cortex interpretation of the current visual scene.
3. After this the populations of neurons in the visual areas go towards a regime with negative dr(t)/dt and dVm(t)/dt followed by dr(t)/dt → 0 and dVm/dt → 0. This is characterized by sparse firing and strongly reduced driving forces.
4. These dynamics evolve in the cortical mesh after a sudden change in the visual scene and have a fairly simple spatio-temporal course making it possible to read the decoding of communicated messages at the mesoscopic scale.
Thus, despite the limited information about the change or the current scene in the individual spike trains in visual areas, the target neurons in the mesh, after FB, arrive at an interpretation of the current visual scene after some 100–120 ms. One may regard the instantaneous spike rate, r(t) as a dynamic mechanism of driving the target neurons by inward and outward currents. The r(t) of neurons in lower visual areas may first carry certain information about the change in the visual scene and after the FB certain information about the current scene, but mainly the r(t) is a dynamic mechanism of driving target neurons. Because the r(t)s locally and from higher order areas at 90–110 ms communicate to the target neurons in the mesh in a spatially coherent fashion (Figures 6 –8 and 11 ), the lower visual areas can compute the interpretation of the current scene. This spatial coherence is one sign of well-behaved dynamics. The 6th principle states that the dynamics of the visual neurons are well behaved at the mesoscopic scale.
For the sake of clarity I emphasized the most frequent dynamics in the description of the dynamic sequence. But in reality, the LGN ON responses communicated to area 17 must interact with the ongoing spontaneous activity of the neurons in area 17. Moreover, depending on the viewing conditions, contrast and luminance changes can be subtle, giving rise to only weak retinal ON responses, for example from the peripheral retina. Thus under several circumstances the ON responses are weak and can fail to drive the area 17 neurons to FF communication to other areas. In these occasions, there would be no dynamic sequence of FF–FB and no integration of visual changes. One should not forget that the biophysical principles of neural communication determine the directions of communications implying that there are conditions associated with other dynamic sequences. This notwithstanding, the network of cortical areas at the mesoscopic scale display relatively stable dynamic sequence associated with the appearance objects in the visual scene for its main variables Vm, dVm/dt, and r(t). The experimental results showed that the space–time dynamics of this sequence modifies depending on the nature of the change in the visual scene. The surprising fact is that the biophysical mechanisms underlying the dynamic sequence are so robust that they are effective in most trials, even under anesthesia (Grinvald et al., 1994 ; Bringuier et al., 1999 ; Eriksson and Roland, 2006 ; Roland et al., 2006 ; Lippert et al., 2007 ; Ferezou et al., 2007 ; Xu et al., 2007 ; Ahmed et al., 2008 ; Harvey et al., 2009 ).
It is not known from experiments how large a proportion of the dendrites undergo the spatio-temporal dynamics shown in Figures 5 –8 and 11 . Theoretically however, coherent Vm changes in dendrites and coherent r(t) increases in neurons at even small proportions can be quite forceful at the population scale (Zohary et al., 1990 ; Averbeck et al., 2006 ; Chen et al., 2006 ). The dynamics evolving from a change in the visual scene is likely to engage very large populations of neurons, at least in the order of millions in carnivores and primates.
One implication of the well-behaved cortex is that significant proportions of its neurons should not bifurcate into oscillations and universal synchronous firing as oscillations and synchronous firing represent stable fixed points precluding further dynamics. It is unlikely that the fast propagation of excitation over the cortex from FB, lateral spreading excitation, and pre-excitation could be due to millions of neurons with intrinsic oscillating Vms that suddenly produced phase-shifts mimicking the shape and precision of the diverse dynamics characteristic for different visual scenes. Although one, in principle, could describe any change in Vm and r(t) in Fourier terms, it is peculiar to use the term oscillations for dynamics that at most constitute one cycle (Figures 3 –8 , 11 , and Movie 1 in supplementary material). Although the dynamic sequence of the communications and computations after a change in the field of view seem stable in most trials, it is important that the neurons can escape into new trajectories when new changes appear or when attention or thinking so demands. This suggests that the well-behaved visual cortex will not end up in stable fixed points (strong attractors).
The reason why the visual cortex is well behaved is that population Vm recordings from the cortex (often done with voltage-sensitive dyes) stem from the cortical mesh of dendrites and axon terminals from very many neurons at each cortical point (Figure 1 ). This means that measurements of dVm/dt are weighted means of the excitation or reduction of excitation (inhibition) of dendrites and axon terminal from more than 75000 neurons. Due to the large span of the dendrites compared to the size of the somata, the population of neurons to which the dendrites belong will change only slowly from one cortical point to the next. This aspect of the well-behaving population Vm, the spatial coherence, was first detected by Arieli et al. (1995) (but see London et al., 1989 ) and confirmed by other groups (Slovin et al., 2002 ; Chen et al., 2006 ; Roland et al., 2006 ; Lippert et al., 2007 ). However even if the mesh gives spatial coherence at the mesoscopic scale, this coherence increases after the FB (Figures 4 and 6 –11 ). Another reason why the cortex populations are well behaved is that cortical well-timed communications and FB can address large populations of pre-excited neurons.
The independence of the proposed principles and the possibilities of generalizing the principles to all forms of cortical dynamics could easily be questioned. Should one, instead of having two principles dealing with the biophysics of neural communication, simply state that all cortical dynamics must follow the laws of biophysics? Well then, which are the laws of biophysics? Similarly should the idea that “all computational differences must be reconciled if the network of many neuron populations in the visual areas should arrive at an unambiguous computational result about the visual scene” be a principle? I chose to emphasize the cortical biophysical dynamics that accomplished this, instead of proposing this idea as a principle. Could one generalize the principles of pre-excitation and reconciling FB in the visual areas, to one principle stating that computational differences among directly connected neuron populations in two different cortical areas will reconcile because of their mutual excitatory connections? Perhaps, but so far there are no experimental results that support such a generalization. Furthermore, dynamics can usually not be predicted from anatomy.
As almost all immediate Vm changes, dVm/dt, are postsynaptic, it follows that observing the dVm/dt is observing the decoding (Box ). It is not possible to measure these variables in each and every neuron in the cortical mesh of axons and dendrites in the cortex, but it is possible to measure the changes in Vm simultaneously over very large neuron populations (see Figures 2 ,6 ,7 ,8 , and 11 ). Due to the nature of mesh and the well-behaving population Vm dynamics, one can observe what the neurons decode. For the retinotopic-organized areas, how dVm/dt, r(t), and Vm evolve in cortical space–time bears direct relation to the change in the visual scene, i.e., the decoding in retinotopic space shows the interpretation of the scene. For example an emerging bump means that an object appeared in the field of view. Two moving bumps mean that two objects are moving in the field of view over the retina. Feedback from areas 19 and 21 SSY targeting between stationary bumps in area 17 and moving to adjacent positions in one direction means that apparent motion is taking place (Figure 11 ). Feedback targeting the retinotopic mapping of an object and the cortex representing the background differently means segmentation of object from background (Figure 8 ). Prediction of the future cortical trajectory of an object moving in one direction (Movie 1 in supplementary material), etc. It is thus possible to decode (part of) the internal dynamics of the cortex in terms of interpretations of (changes in) the visual scene. The prediction from the principles is that the change in the visual scene is integrated with the firing related to the previous scene and communicated as FB to lower order areas, implying that the visual areas together after the FBs compute the visual scene. These principles obviate any binding problem.
The picture emerging from these new experimental studies is that the visual cortical areas through FF, lateral/pre-excitation and FB may arrive at a uniform coherent computation reflecting the visual scene in less than 150 ms. The spread of the retinal information to large populations in many areas initially increase the computational dimensions. The pre-excitation in combination with the FB and the resulting sparse firing increases the pair-wise correlation in r(t) among neurons and reduces the dimensionality considerably (Figures 3 –6 ). The properties of the visual cortical dynamics summarized above in this section imply that one can describe the Vm, dVm/dt and r(t) dynamics as well behaved at the mesoscopic scale. This does not exclude that the Vm, dVm/dt, and r(t) dynamics of single neurons in the cortical mesh could be bad, incoherent and unrelated to the communications or computations reflected at the mesoscopic scale – one does not know. Even if this was so, it might not matter that much because the overall dynamics is well behaved and reflect the interpretation of large populations of neurons of the current visual scene.
The six principles are theoretical proposals relying on the assumption that the experimentally observed dynamics of populations of cortical neurons can be explained from the relatively simple biophysics underlying excitation and inhibition. I tried to provide plausible biophysical descriptions of the mechanisms underlying the principles. This had some experimental support from recent experiments in which the dynamics to transients was examined. But these experiments are still few. The principles carry many predictions, but in this text I mentioned only a few to avoid overloading the text. The principles are theoretical and predictive and easily lend themselves to experimental tests. They point to mechanisms for the computation of perceptual unity. They explain how the brain could compute the current visual scene in less than 120 ms, by essentially one sequence of FF-lateral spreading excitation/specific pre-excitation- and FB.
Conflict of Interest Statement
The author declares that the research was conducted in the absence of any commercial or financial relationships that could be construed as a potential conflict of interest.
Acknowledgments
I thank Stylianos Papaioannou for producing Figure 9 , and Michael Harvey for producing Figure 10 , and John Hertz for critical comments. This work was supported by The Swedish Science Council K2010-62X-09456-20-3 and the Wallenberg Foundation
Supplementary Material
The Supplementary Material for this article can be found online at http://www.frontiersin.org/systemsneuroscience/paper/10.3389/fnsys.2010.00028/
Movie 1. The relative Vm in response to a bar moving downwards from the peripheral field of view (statistically significant p < 0.01 after Bonferroni correction). The black holes show the electrode penetration sites. When the multiunit activity at any of the 16 leads at a penetration site becomes statistically significant (p < 0.01) the hole turns white. Note the mapping of the future trajectory of the bar mapping first from the higher order areas (19 and 21) at 100-130 ms, and the FB from these areas to the bar mapping in lower order areas 17/18 at 116-130 ms. Then when the bar mapping in 17/81 has reached the left arrow the future cortical trajectory of this mapping is maximal and the multiunit activity increases significantly ahead of the mapping. And indeed at 620 ms the bar map reaches the predicted site. Note also that from 160 ms and onwards the cortical excitations progress in phase in higher and lower areas. (From Harvey et al., 2009 ).
References
Ahmed, B., Hanazawa, A., Undeman, C., Eriksson, D., Valentiniene, S., and Roland, P. E. (2008). Cortical dynamics subserving visual apparent motion. Cereb. Cortex 18, 2796–2810.
Akrami, A., Liu, Y., Treves, A., and Jagadeesh, B. (2009). Converging neuronal activity in inferior temporal cortex during the classification of morphed stimuli. Cereb. Cortex 19, 760–776.
Anderson, J. C., and Martin, K. A. C. (2002). Connection from cortical area V2 to MT in macaque monkey. J. Comp. Neurol. 443, 56–70.
Angelucci, A., Levitt, J. B., Walton, J. S., Hupé, J.-M., Bullier, J., and Lund, J. S. (2002). Circuits for local, and globalö signal integration in primary visual cortex. J. Neurosci. 22, 8633–8646.
Arieli, A., Shoham, D., Hildesheim, R., and Grinvald, A. (1995). Coherent spatiotemporal patterns of ongoing activity revealed by real-time optical imaging coupled with single-unit recording in the cat visual cortex. J. Neurophysiol. 73, 2072–2093.
Averbeck, B. B., Latham, P. E., and Pouget, A. (2006). Neural correlations, population coding and computation. Nat. Rev. Neurosci. 7, 358–366.
Azouz, R., and Gray, C. M. (2000). Dynamic spike threshold reveals a mechanism for synaptic coincidence detection in cortical neurons in vivo. Proc. Natl. Acad. Sci. U.S.A. 97, 8110–8115.
Barone, P., Batardiere, A., Knoblauch, K., and Kennedy, H. (2000). Laminar distribution of neurons in extrastriate areas projecting to visual areas V1 and V4 correlates with the Hierarchical Rank and Indicates the operation of distance rule. J. Neurosci. 20, 3263–3281.
Baylis, G., and Driver, J. (2001). Shape-coding in IT cells generalizes over contrast and mirror reversal, but not figure-ground reversal. Nat. Neurosci. 4, 937–942.
Benucci, A., Frazor, R. A., and Carandini, M. (2007). Standing waves and traveling waves distinguish two circuits in visual cortex. Neuron 55, 103–117.
Berens, P., Keliris, G. A., Ecker, A. S., Logothetis, N. K., and Tolias, A. S. (2008). Feature selectivity of the gamma-band of the local field potential in primate primary visual cortex. Front. Neurosci. 2, 199–207. doi:10.3389/neuro.01.037.2008.
Berger, T., Borgdorff, A., Crochet, S., Neubauer, F. B., Lefort, S., Fauvet, B., Ferezou, I., Carleton, A., Lüscher, H.-R., and Petersen, C. C. H. (2007). Combined voltage and calcium epiflourescence imaging in vitro and in vivo reveals subthreshold and suprathreshold dynamics of mouse barrel cortex. J. Neurophysiol. 97, 3751–3762.
Borg-Graham, L. J., Monier, C., and Frégnac, Y. (1998). Visual input evokes transient and strong shunting inhibition in visual cortical neurons. Nature 393, 369–373.
Brincat, S. L., and Connor, C. E. (2006). Dynamic shape synthesis in posterior inferotemporal cortex. Neuron 49, 17–24.
Bringuier, V., Chavane, F., Glaeser, L., and Fregnac, Y. (1999). Horizontal propagation of visual activity in the synaptic integration field of area 17 neurons. Science 283, 695–699.
Bullier, J., Hupé, J. M., James, A., and Girard, P. (2001). The role of feedback connections in shaping the responses of visual cortical neurons. Prog. Brain Res. 134, 193–204.
Burns, B. D., and Webb, A. C. (1976). The spontaneous activity of neurones in the cat’s cerebral cortex. Proc. R. Soc. Lond., B, Biol. Sci. 194, 211–223.
Cantone, G., Xiao, J., and Levitt, J. B. (2006). Retinotopic organization of ferret suprasylvian cortex. Vis. Neurosci. 23, 61–77.
Cantone, G., Xiao, J., McFarlane, N., and Levitt, J. B. (2005). Feedback connections to ferret striate cortex: direct evidence for visuotopic convergence of feedback inputs. J. Comp. Neurol. 487, 312–331.
Carandini, M., Heeger, D. J., and Movshon, J. A. (1997). Linearity and normalization in simple cells of the macaque primary visual cortex. J. Neurosci. 17, 8621–8644.
Chen, C.-M., Lakatos, P., Shah, A. S., Mehta, A. D., Givre, S. D., Javitt, D. C., and Schroeder, C. E. (2007). Functional anatomy and interaction of fast and slow visual pathways in macaque monkeys. Cereb. Cortex 17, 1561–1569.
Chen, Y., Geisler, W. S., and Seidemann, E. (2006). Optimal decoding of correlated neural population responses in the primate visual cortex. Nat. Neurosci. 9, 1412–1420.
Colonnier, M. (1981). “The electron-miscroscopic analysis of the neuronal organization of the cerebral cortex,” in The Organization of the Cerebral Cortex, eds F. O. Schmitt, F. G. Worden, G. Adelman, and S. G. Dennis (Cambridge, MA: MIT Press), 125–152.
Contreras, D., and Palmer, L. (2003). Response to contrast of electrophysiologically defined cell classes in primary visual cortex. J. Neurosci. 23, 6936–6945.
Crochet, S., and Petersen, C. C. H. (2006). Correlating whisker behavior with membrane potential in barrel cortex of awake mice. Nat. Neurosci. 9, 608–610.
Delorme, A., Richard, G., and Fabre-Thorpe, M. (2000). Ultra-rapid categorisation of natural scenes does not rely on colour cues: a study in monkeys and humans. Vision Res. 40, 2187–2200.
Destexthe A., and Paré, D. (1999). Impact of spontaneous synaptic activity on the resting properties of cat neocortical pyramidal neurons in vivo. J. Neurophysiol. 81, 1531–1547.
Destexhe, A., Rudolph, M., and Pare, D. (2003). The high-conductance state of neocortical neurons in vivo. Nat. Neurosci. 4, 739–751.
DeYoe, E. A., and Van Essen, D. C. (1988). Concurrent processing streams in monkey visual cortex. TINS 11, 219–226.
Dinse, H. R., and Kruger, K. (1994). The timing of processing along the visual pathway in the cat. Neuroreport 5, 893–897.
Eckhorn, R., Gail, A., Bruns, A., Gabriel, A., Al-Shaikhli, B., and Saam, M. (2004). Neural mechanisms of visual associative processing. Acta Neurobiol. Exp. 64, 239–252.
Elston, G. N. (2003). Cortex, cognition and the cell: new insights into the pyramidal neuron and prefrontal function. Cereb. Cortex 13, 1124–1138.
Enroth-Cugell, C., and Jones, R. W. (1961). Responses of retinal ganglion cells to exponentially increasing light stimuli. Science 134, 1884–1885.
Enroth-Cugell, C., Robson, J. G., Schweitzer-Tong, D. E., and Watson, A. B. (1983). Spatio-temporal interactions in cat retinal ganglion cells showing linear spatial summation. J. Physiol. 341, 279–307.
Eriksson, D., and Roland, P. (2006). Feed-forward, feedback and lateral interactions in membrane potentials and spike trains from the visual cortex in vivo. J. Physiol. Paris 100, 100–109.
Eriksson, D., Tompa, T., and Roland, P. E. (2008). Non-linear population firing rates and voltage sensitive dye signals in visual areas 17 and 18 to short duration stimuli. PLoS One 3, e2673. doi: 10.1371/journal.pone.0002673.
Eriksson, D., Valentiniene, S., and Papaioannou, S. (2010). Relating information, encoding and adaptation: Decoding the population firing rate in visual areas 17/18 in response to stimulus transition. PLoS One 5, e10327. doi:10.1371/journal.pone.0010327.
Felleman, D. J., and Van Essen, D. C. (1991). Distributed hierarchical processing in the primate cerebral cortex. Cereb. Cortex 1, 1–47.
Ferezou, I., Bolea, S., and Petersen, C. C. (2006). Visualizing the cortical representation of whisker touch: voltage-sensitive dye imaging in freely moving mice. Neuron 50, 617–629.
Ferezou, I., Haiss, F., Gentet, L. J., Aronoff, R., Weber, B., and Petersen, C. C. H. (2007). Spatiotemporal dynamics of cortical sensorimotor integration in behaving mice. Neuron 56, 907–923.
Freedman, D. J., Riesenhuber, M., Poggio, T., and Miller, E. K. (2003). A comparison of primate prefrontal and inferior temporal cortices during visual categorization. J. Neurosci. 23, 5235–5246.
Friedman-Hill, S. R., Robertson, L. C., Desimone, R., and Ungerleider, L. G. (2003). Posterior parietal cortex and the filtering of distractors. Proc. Natl. Acad. Sci. U.S.A. 100, 4263–4268.
Galuske, R. A., Schmidt, K. E., Goebel, R., Lomber, S. G., and Payne, B. R. (2002). The role of feedback in shaping neural representations in cat visual cortex. Proc. Natl. Acad. Sci. U.S.A. 99, 17083–17088.
Gattass, R., Nascimento-Silva, S., Soares, J. G., Lima, B., Jansen, A. K., Diogo, A. C., Farias, M. F., Botelho, M. M., Mariani, O. S., Azzi, J., and Fiorani, M. (2005). Cortical visual areas in monkeys: location, topography, connections, columns, plasticity and cortical dynamics. Philos. Trans. R. Soc. Lond. B Biol. Sci. 360, 709–731.
Gawne, T. J., Kjaer, T. W., Hertz, J. A., and Richmond, B. J. (1996). Adjacent visual cortical complex cells share about 20% of their stimulus-related information. Cereb. Cortex 6, 482–489.
Gray, C. M., and Singer, W. (1989). Stimulus-specific neuronal oscillations in orientation columns of cat visual cortex. Proc. Natl. Acad. Sci. U.S.A. 86, 1698–1702.
Grinvald, A., Lieke, E. E., Frostig, R. D., and Hildesheim, R. (1994). Cortical point-spread function and long-range lateral interactions revealed by real-time optical imaging of macaque monkey primary visual cortex. J. Neurosci. 14, 2545–2568.
Haider, B., Duque, A., Hasenstaub, A. R., and McCormick, D. A. (2006). Neocortical network activity in vivo is generated through a dynamic balance of excitation and inhibition. J. Neurosci. 26, 4535–4545.
Han, F., Caporale, N., and Dan, Y. (2008). Reverberation of recent visual experience in spontaneous cortical waves. Neuron 60, 321–327.
Harvey, M. A., Valentiniene, S., and Roland, P. E. (2009). Cortical membrane potential dynamics and laminar firing during object motion. Front. Syst. Neurosci. 3:7, doi:10.3389/neuro.06.007.2009
Heller, J., Hertz, J. A., Kjær, T. W., and Richmond, B. J. (1995). Information flow and temporal coding in primate pattern vision. J. Comp. Neurosci. 2, 175–193.
Hirsch, J. A., Alonso, J. M., Reid, R. C., and Martinez, L. M. (1998). Synaptic integration in striate cortical simple cells. J. Neurosci. 18, 9517–9528.
Holmgren, C., Harkany, T., Svennenfors, B., and Zilberter, Y. (2003). Pyrimidal cell communication within local networks in layer 2/3 of rat neocortex. J. Physiol. 551, 139–152.
Homma, R., and Tanifuji, M. (2006). Comparison of functional maps in macaque area TE revealed by in vivo optical imaging with voltage-sensitive dye and intrinsic signal imaging. Soc. Neurosci. (Abstract 818.21).
Hubel, D. H., and Wiesel, T. N. (1962). Receptive fields, binocular interaction and functional architecture in the cat’s visual cortex. J. Physiol. (Lond.) 160, 106–154.
Hughes, G. W., and Maffei, L. (1966). Retinal ganglion cell response to sinusoidal light stimulation. J. Neurophysiol. 29, 333–352.
Hupe, J. M., James, A. C., Payne, B. R., Lomber, S. G., Girard, P., and Bullier, J. (1998). Cortical feedback improves discrimination between figure and background by V1, V2 and V3 neurons. Nature 394, 784–787.
Ito, M., Tamura, H., Fujita, I., and Tanaka, K. (1995). Size and position invariance of neuronal responses in monkey inferotemporal cortex. J. Neurophysiol. 73, 218–226.
Jung, R., Baumgarten, R. V., and Baumgartner, G. (1952). Microleads of single nerve cells in visual cortex of cat: photo-activated neurons. Arch. Psychiatr. Nervenkr. Z. Gesamte Neurol. Psychiatr. 189, 521–539.
Katsuyama, N., Tsumoto, T., Sato, H., Fukuda, M., and Hata, Y. (1996). Lateral suprasylvian visual cortex is activated earlier than or synchronously with primary visual cortex in the cat. Neurosci. Res. 24, 431–435.
Kinoshita, M., and Komatsu, H. (2001). Neural representation of the luminance and brightness of a uniform surface in the macaque primary visual cortex. J. Neurophysiol. 86, 2559–2570.
Kovács, G., Vogels, R., and Orban, G. A. (1995). Cortical correlate of pattern backward masking. Proc. Natl. Acad. Sci. U.S.A. 92, 5587–5591.
Kuffler, S. W. (1953). Discharge patterns and functional organization of the mammalian retina. J. Neurophysiol. 16, 37–68.
Lamme, V. A. F. (1995). The neurophysiology of figure-ground segregation in primary visual cortex. J. Neurosci. 15, 1605–1615.
Li, L., Miller, E. K., and Desimone, R. (1993). The representation of stimulus familiarity in anterior inferior temporal cortex. J. Neurophysiol. 69, 1918–1929.
Lippert, M. T., Takagaki, K., Xu, W., Huang, X., and Wu, J.-Y. (2007). Methods for voltage-sensitive dye imaging of rat cortical activity with high signal-to-noise ratio. J. Neurophysiol. 98, 502–512.
Liu, H., Agam, Y., Madsen, J. R., and Kreiman, G. (2009). Timing, timing, timing: fast decoding of object information from intracranial field potentials in human visual cortex. Neuron 62, 281–290.
Livingstone, M. S., and Hubel, D. H. (1988). Segregation of form, color, movement, and depth: anatomy, physiology, and perception. Science 240, 740–749.
Loewenstein, P. R., and Somogyi, P. (1991). Synaptic organization of cortico-cortical connections from the primary visual cortex to the posteromedial lateral suprasylvian visual area in the cat. J. Comp. Neurol. 310, 253–266.
London, J. A., Cohen, L. B., and Wu, J. Y. (1989). Optical recordings of the cortical response to whisker stimulation before and after the addition of an epileptogenic agent. J. Neurosci. 9, 2182–2190.
Lübke, J., Roth, A., Feldmeyer, D., and Sakmann, B. (2003). Morphometric analysis of the columnar innervation domain of neurons connection layer 4 and layer 2/3 of juvenile rat barrel cortex. Cereb. Cortex 13, 1051–1063.
Manger, P. R., Kiper, D., Masiello, I., Murillo, L., Tettoni, L., Hunyadi, Z., and Innocenti, G. M. (2002). The representation of the visual field in three extrastriate areas of the ferret (Mustela putorius) and the relationship of retinotopy and field boundaries to callosal connectivity. Cereb. Cortex 12, 423–437.
Martinez, L. M., Alonso, J. M., Reid, R. C., and Hirsch, J. A. (2002). Laminar processing of stimulus orientation in cat visual cortex. J. Physiol. 540, 321–333.
Maunsell, J. H., and Gibson, J. R. (1992). Visual response latencies in striate cortex of the macaque monkey. J. Neurophysiol. 68, 1332–1344.
Maunsell, J. H., and Treue, S. (2006). Feature-based attention in visual cortex. Trends Neurosci. 29, 317–322.
Maunsell, J. H. R., and Van Essen, D. C. (1983). The connections of the middle temporal visual area (MT) and their relationship to a cortical hierarchy in the macaque monkey. J. Neurosci. 3, 2563–2586.
McLelland, D., Ahmed, B., and Bair, W. (2009). Responses to static visual images in macaque lateral geniculate nucleus: implications for adaption, negative afterimages, and visual fading. 29, 8996–9001.
Mehta, A. D., Ulbert, I., and Schroeder, C. E. (2000a). Intermodal selective attention in monkeys. I: distribution and timing of effects across visual areas. Cereb. Cortex 10, 343–358.
Mehta, A. D., Ulbert, I., and Schroeder, C. E. (2000b). Intermodal selective attention in monkeys. II: physiological mechanisms of modulation. Cereb. Cortex 10, 359–370.
Mignard, M., and Malpeli, J. G. (1991). Paths of information flow through visual cortex. Science 251, 1249–1251.
Monier, C., Fournier, J., and Frégnac, Y. (2008). In vitro and in vivo measures of evoked excitatory and inhibitory conductance dynamics in sensory cortices. J. Neurosci. Methods 169, 323–365.
Movshon, J. A., Adelson, E. H., Gizzi, M. S., and Newsome, W. T. (1985). “The analysis of moving visual patterns,” in Study Week on: Pattern Recognition Mechanisms, eds C. Chagas, R. Gattass, and C. Gross (Rome: Vatican Press), 117–151.
Mumford, D. (1992). On the computational architecture of the neocortex. II. The role of cortico-cortical loops. Biol. Cybern. 66, 241–251.
Nakamura, K., Matsumoto, K., Mikami, A., and Kubota, K. (1994). Visual response properties of single neurons in the temporal pole of behaving monkeys. J. Neurophysiol. 71, 1206–1221.
Nauhaus, I., Busse, L., Carandini, M., and Ringach, D. L. (2009). Stimulus contrast modulates functional connectivity in visual cortex. Nat. Neurosci. 12, 70–76.
Nelson, M. E., and Bower, J. M. (1990). Brain maps and parallel computers. Trends Neurosci. 13, 403–408.
Nikolic, D., Haeusler, S., Singer, W., and Maass, W. (2007). “Temporal dynamics of information content carried by neurons in the primary visual cortex,” in Advances in Neural Information Processing Systems, Vol. 19, eds B. Schölkopf, J. Platt, and T. Hofmann (Cambridge, MA: MIT Press), 1041–1048.
Olshausen, B. A., and Field, J. D. (2006). “What is the other 85 percent of V1 doing?,” in 23 Problems in Systems Neuroscience, eds J. Leo van Hemmen and T. J. Sejnowski (New York: Oxford University Press), 182–221.
Ottersen, O. P., and Storm-Mathisen, J. (1986). Excitatory amino acid pathways in the brain. Adv. Exp. Med Biol. 203, 263–284.
Pernberg, J., Jirmann, K.-U., and Eysel, U. T. (1998). Structure and dynamics of receptive fields in the visual cortex of the cat (area 18) and the influence of GABAergic inhibition. Eur. J. Neurosci. 10, 3596–3606.
Petersen, C. C., Grinvald, A., and Sakmann, B. (2003a). Spatiotemporal dynamics of sensory responses in layer 2/3 of rat barrel cortex measured in vivo by voltage-sensitive dye imaging combined with whole-cell voltage recordings and neuron reconstructions. J. Neurosci. 23, 1298–1309.
Petersen, C. C. H., Hahn, T. T. G., Mehta, M., Grinvald, A., and Sakmann, B. (2003b). Interaction of sensory responses with spontaneous depolarization in layer 2/3 barrel cortex. Proc. Natl. Acad. Sci. U.S.A. 100, 13638–13643.
Philipp, R., Distler, C., and Hoffmann, K.-P. (2006). A motion-sensitive area in ferret extrastriate visual cortex: an analysis in pigmented and albino animals. Cereb. Cortex 16, 779–790.
Prechtl, J. C., Cohen, L. B., Pesaran, B., Mitra, P. P., and Kleinfeld, D. (1997). Visual stimuli induce waves of electrical activity in turtle cortex. Proc. Natl. Acad. Sci. U.S.A. 94, 7621–7626.
Rabinovich, M., Huerta, R., and Laurent, G. (2008). Transient dynamics for neural processing. Science 321, 48–50.
Raiguel, S. E., Lagae, L., Gulyas, B., and Orban, G. A. (1989). Response latencies of visual cells in macaque areas V1, V2 and V5. Brain Res. 493, 155–159.
Rao, R. P. N., and Ballard, D. H. (1999). Predictive coding in the visual cortex. A functional interpretation of some extra-classical receptive-field effects. Nat. Neurosci. 2, 79–87.
Richmond, B. J., Optican, L. M. (1990). Temporal encoding of two-dimensional patterns by single units in primate primary visual cortex. II. information transmission. J. Neurophysiol. 64, 370–380.
Rieger, J. W., Braun, C., Bülthoff, H. H., and Gegenfurtner, K. R. (2005). The dynamics of visual pattern masking in natural scene processing: a magnetoencephalography study. J. Vis. 5, 275–286.
Ringach, D. L., Hawken, M. J., and Shapley, R. (2003). Dynamics of orientation tuning in macaque V1: the role of global and tuned suppression. J. Neurophysiol. 90, 342–352.
Ro, T., Breitmeyer, B., Burton, P., Singhal, N. S., and Lane, D. (2003). Feedback contributions to visual awareness in human occipital cortex. Curr. Biol. 13, 1038–1041.
Rockland, K. S. (1997). “Elements of cortical architecture,” in Cerebral Cortex, Vol. 12, eds K. S. Rockland, J. H. Kass, and A. Peter (New York: Plenum Press), 243–293.
Rockland, K. S., and Drash, G. W. (1996). Collateralized divergent feedback connections that target multiple cortical areas. J. Comp. Neurol. 373, 529–548.
Roland, P. E. (1981). Somatotopical tuning on the postcentral gyrus during focal attention in man. A regional cerebral blood flow study. J. Neurophysiol. 46, 744–754.
Roland, P. E. (2002). Dynamic depolarization fields in the cerebral cortex. Trends Neurosci. 25, 183–190.
Roland, P. E., Hanazawa, A., Undeman, C., Eriksson, D., Tompa, T., Nakamura, H., Valentiniene, S., and Ahmed, B. (2006). Cortical feedback depolarization waves: a mechanism of top-down influence on early visual areas. Proc. Natl. Acad. Sci. U.S.A. 103, 12586–12591.
Rolls, E., and Deco, G. (2001). Computational Neuroscience of Vision. Oxford: Oxford University Press.
Rosa, M. G., Casagrande, V. A., Preuss, T., and Kaas, J. H. (1997). Visual field representation in striate and prestriate cortices of a prosimian primate (Galago garnetti). J. Neurophysiol. 77, 3193–3217.
Rudolph, M., Pospischil, M., Timofeev, I., and Destexhe, A. (2007). Inhibition determines membrane potential dynamics and controls action potential generation in awake and sleeping cat cortex. J. Neurosci. 27, 5280–5290.
Salazar, R. F., Kayser, C., and König, P. (2004). Effects of training on neuronal activity and interactions in primary and higher visual cortices in the alert cat. J. Neurosci. 24, 1627–1636.
Scholte H. S., Jolij, J., Fahrenfort, J. J., and Lamme, V. A. (2008). Feedforward and recurrent processing in scene segmentation: electroencephalography and functional magnetic resonance imaging. J. Cogn. Neurosci. 11, 2097–2109.
Schroeder, C. E., Mehta, A. D., and Givre, S. J. (1998). A spatiotemporal profile of visual system activation revealed by current source density analysis in the awake macaque. Cereb. Cortex 8, 575–592.
Shinomoto, S., Kim, H., Shimokawa, T., Matsuno, N., Funahashi, S., Shima, K., Fujita, I., Tamura, H., Doi, T., Kawano, K., Inaba, N., Fukushima, K., Kurkin, S., Kurata, K., Taira, M., Tsutsui, K. -I., Komatsu, H. , Ogawa, T., Koida, K., Tanji, J., Toyama, K. (2009). Relating neuronal firing patterns to functional differentiation of cerebral cortex. PLoS Comput. Biol. 5, e1000433. doi:10.1371/journal.pcbi.1000433.
Silito, A. M., Cudeiro, J., and Jones, H. E. (2006). Always returning: feedback and sensory processing in visual cortex and thalamus. Trends Neurosci. 29, 307–316.
Singer, W. (2004). “Synchrony, oscillations, and relational codes,” in The Visual Neurosciences Vol. 2, eds L. M. Chalupa and J. S. Werner (Cambridge, MA: MIT Press), 1665–1681.
Slovin, H., Arieli, A., Hildesheim, R., and Grinvald, A. (2002). Long-term voltage-sensitive dye imaging reveals cortical dynamics in behaving monkeys. J. Neurophysiol. 88, 3421–3438.
Smith, M. A., and Kohn, A. (2008). Spatial and temporal scales of neuronal correlation in primary visual cortex. J. Neurosci. 28, 12591–12603.
Somogyi, P. S., Tamás, G., Lujan, R., and Buhl, E. H. (1998). Salient features of synaptic organization in the cerebral cortex. Brain Res. Rev. 26, 113–135.
Takagaki, K., Zhang, C., Wu, J., and Lippert, M. T. (2008). Crossmodal propagation of sensory-evoked and spontaneous activity in the rat neocortex. Neurosci. Lett. 431, 191–196.
Tanaka, K., Saito, H., Fukada, Y., and Moriya, M. (1991). Coding visual images of objects in the inferotemporal cortex of the macaque monkey. J. Neurophysiol. 66, 170–189.
Tanaka, Y. Z., Koyama, T., and Mikami, A. (2002). Visual responses in the temporal cortex to moving objects with invariant contours. Exp. Brain Res. 146, 248–256.
Thorpe, S., Fize, D., and Marlot, C. (1996). Speed of processing in the human visual system. Nature 381, 520–522.
Tompa, T., Sáry, G., Chadaide, Z., Köteles, K., Kovács, G., and Benedek, G. (2005). Achromatic shape processing in the inferotemporal cortex of the macaque. Neuroreport 16, 57–61.
Tovee, M. J., Rolls, E. T., Treves, A., and Bellis, R. P. (1993). Information encoding and the responses of single neurons in the primate temporal visual cortex. J. Neurophysiol. 70, 640–654.
Truccolo, W., Hochberg, L. R., and Donoghue, J. P. (2009). Collective dynamics in human and monkey sensorimotor cortex: predicting single neuron spikes. Nat. Neurosci. 13, 105–111.
Tsunoda, K., Yamane, Y., Nishizaki, M., and Tanifuji, M. (2001). Complex objects are represented in macaque inferotemporal cortex by the combination of feature columns. Nat. Neurosci. 8, 832–838.
Ungerleider, L. G., and Mishkin, M. (1982). “Two cortical visual systems,” in Analysis of Visual Behavior, eds D. J. Ingle, M. A. Goodale, and R. J. W. Mansfield (Cambridge, MA: MIT Press), 549–586.
Vajda, I., Lankheet, M. J., Borghuis, B. G., and van de Grind, W. A. (2004). Dynamics of directional selectivity in area 18 and PMLS of the cat. Cereb. Cortex 14, 759–767.
Vanduffel, W., Payne, B. R., Lomber, S. G., and Orban, G. A. (1997). Functional impact of cerebral connections. Proc. Natl. Acad. Sci. U.S.A. 94, 7617–7620.
von der Malsburg, C., and Schneider, W. (1986). A neural cocktail-party processor. Biol. Cybern. 54, 29–40.
Von Stein, A., Chiang, C., and König, P. (2000). Top-down processing mediated by interareal synchronization. Proc. Natl. Acad. Sci. U.S.A. 97, 14748–14753.
Wang, G., Tanaka, K., and Tanifuji, M. (1996). Optical imaging of functional organization in the monkey inferotemporal cortex. Science 272, 1665–1668.
Wang, G., Tanifuji, M., and Tanaka, K. (1998). Functional architecture in monkey inferotemporal cortex revealed by in vivo optical imaging. Neurosci. Res. 32, 33–46.
Wibral, M., Bledowski, C., Kohler, A., Singer, W., and Muckli, L. (2009). The timing of feedback to early visual cortex in the perception of long-range apparent motion. Cereb. Cortex 19, 1567–1582.
Xing, D., Shapley, R. M., Hawken, M. J., and Ringach, D. L. (2005). The effect of stimulus size on the dynamics of orientation selectivity in macaque V1. J. Neurophysiol. 94, 799–812.
Xu, W., Huang, X., Takagaki, K., and Wu, J.-Y. (2007). Compression and reflection of visually evoked cortical waves. Neuron 55, 119–129.
Yamane, Y., Tsunoda, K., Matsumoto, M., Phillips, A. N., and Tanifuji, M. (2006). Representation of the spatial relationship among object parts by neurons in macaque inferotemporal cortex. J. Neurophysiol. 96, 3147–3156.
Zeki, S. (1980b). The response properties of cells in the middle temporal area (area MT) of owl monkey visual cortex. Proc. R. Soc. Lond., B, Biol. Sci. 207, 239–248.
Keywords: membrane potential, laminar firing, object vision, object motion, cortical theory, voltage-sensitive dyes, feedback, inter-area communication
Citation: Roland PE (2010) Six principles of visual cortical dynamics. Front. Syst. Neurosci. 4:28. doi: 10.3389/fnsys.2010.00028
Received: 23 February 2010;
Paper pending published: 14 April 2010;
Accepted: 11 June 2010;
Published online: 02 July 2010
Edited by:
Robert Shapley, New York University, USAReviewed by:
Gustavo Deco, Universitat Pompeu Fabra, SpainKeith P. Purpura, Weill Cornell Medical College, USA
Copyright: © 2010 Roland. This is an open-access article subject to an exclusive license agreement between the authors and the Frontiers Research Foundation, which permits unrestricted use, distribution, and reproduction in any medium, provided the original authors and source are credited.
*Correspondence: Per E. Roland, Department of Neuroscience, Division of Brain Research, Karolinska Institutet, Retzius väg 8 S171 77 Solna, Stockholm, Sweden. e-mail: per.roland@ki.se
Abbreviations: AP, action potential; FB, feedback; IT, inferior temporal; FF, feed-forward; LGN, lateral geniculate nucleus; Vm population membrane potential.