Rewiring neural interactions by micro-stimulation
- 1 Department of Physiology, Feinberg School of Medicine, Northwestern University, Chicago, IL, USA
- 2 Department of Physical Medicine and Rehabilitation, Feinberg School of Medicine, Northwestern University, Chicago, IL, USA
- 3 Department of Physics and Astronomy, Northwestern University, Evanston, IL, USA
- 4 Department of Biomedical Engineering, Northwestern University, Evanston, IL, USA
Plasticity is a crucial component of normal brain function and a critical mechanism for recovery from injury. In vitro, associative pairing of presynaptic spiking and stimulus-induced postsynaptic depolarization causes changes in the synaptic efficacy of the presynaptic neuron, when activated by extrinsic stimulation. In vivo, such paradigms can alter the responses of whole groups of neurons to stimulation. Here, we used in vivo spike-triggered stimulation to drive plastic changes in rat forelimb sensorimotor cortex, which we monitored using a statistical measure of functional connectivity inferred from the spiking statistics of the neurons during normal, spontaneous behavior. These induced plastic changes in inferred functional connectivity depended on the latency between trigger spike and stimulation, and appear to reflect a robust reorganization of the network. Such targeted connectivity changes might provide a tool for rerouting the flow of information through a network, with implications for both rehabilitation and brain–machine interface applications.
Introduction
The processes of motor control, perception, and sensorimotor integration are all emergent properties of the approximately 100 trillion connections among the roughly 100 billion neurons in the human cerebral cortex. During development, the strength and number of these connections are subject to dramatic change, a process referred to as neural “plasticity”. Even during adult life, normal brain function requires constant adjustment of these connections as we learn to interact with the environment and to associate important sensory stimuli with appropriate motor actions. However, neurological disorders may disrupt these learned associations and require the nervous system to reorganize itself in order to restore normal function. Methods allowing the strength of particular pathways to be manipulated could have great importance for the rehabilitative process.
The manipulation of synaptic strength would require an understanding of the specific features of neural activity that normally drive these adaptive changes. In 1949, Donald Hebb postulated that if the activity of one neuron consistently preceded that of a second neuron, the connection from the first to the second would strengthen (Hebb, 1949). Such associations appear to drive plastic changes, from that of the strength of individual synapses to the topological reorganization of large areas of the cortex (Buonomano and Merzenich, 1998; Bi and Poo, 2001). Experimentally, the in vitro associative pairing of presynaptic neural activity with postsynaptic electrical stimulation has been used to drive plastic changes in the connection strength between pairs of neurons. These changes have typically been quantified in terms of the magnitude of the postsynaptic neuron’s response when the presynaptic neuron is activated by an electrical stimulus (Bliss and Gardner-Medwin, 1973). These previous experiments have established that the relative timing between pre- and postsynaptic spikes is critical to the magnitude and sign of the resultant plasticity (Bliss and Collingridge, 1993; Markram et al., 1997; Bi and Poo, 2001). Spike-timing dependent plasticity (STDP) describes the observation that causally related activity (i.e., postsynaptic depolarization following a presynaptic spike within a short latency) leads to strong synaptic potentiation (Bliss and Collingridge, 1993; Markram et al., 1997). In this respect, STDP is a Hebbian learning rule (Caporale and Dan, 2008), and is thus a promising candidate to change the way neurons interact.
More recently, similar paradigms have been used in vivo to explore the effect of plasticity within the intact nervous system (Nelson and Turrigiano, 2008). In these studies natural visual (Schuett et al., 2001; Yao and Dan, 2001; Engert et al., 2002; Fu et al., 2002; Clapp et al., 2006), auditory (Ahissar et al., 1998; Clapp et al., 2005; Zaehle et al., 2007), and proprioceptive stimuli (Esser et al., 2006; Huber et al., 2006), as well as electrical stimulation (Nudo et al., 1990; Racine et al., 1995; Trepel and Racine, 1998; Heynen and Bear, 2001; Werk and Chapman, 2003; Jackson et al., 2006) have all been used to induce Hebbian associations between neurons that are similar to those seen in STDP experiments. As in the in vitro slice preparation, these studies have typically used the magnitude of response to stimulation as the means to evaluate changes in the strength of network connectivity. These studies have provided broad and solid evidence demonstrating that associative mechanisms can cause changes in stimulus-evoked sensory or motor maps.
However, moving from the pairwise, stimulus input/output mapping to a measure that represents the functional interactions within a network is difficult. Measuring the strength of every pairwise stimulus-evoked response becomes rapidly impractical as the size of the network increases. It is also inappropriate theoretically, as the stimulation at any given electrode would inevitably activate many neurons making many different connections than those of the single recorded neuron. Furthermore, because measurement of connectivity in these earlier studies relies on stimulus-evoked activity, it remains to be seen how the conditioning stimulation alters the way the neurons interact with one another in the absence of specific external stimuli, including those not directly activated by the conditioning stimulation.
To address these issues, we have undertaken experiments that use newly developed statistical methods to infer functional connectivity from the statistics of the discharge recorded during spontaneous behavior, rather than relying on the strength of a response to stimulation. Our inferred functional connectivity (IFC) algorithm is based on recent statistical inference algorithms that estimate the coupling between the observed neurons that is maximally consistent with the observed spike discharge (see “Materials and methods”, also (Paninski, 2004; Nykamp, 2005; Okatan et al., 2005; Truccolo et al., 2005; Rigat et al., 2006; Pillow et al., 2008; Stevenson et al., 2009). These algorithms assume parametric, time-dependent forms for the neural interactions and calculate the most likely interactions given the recorded spikes, the set of which is called the pattern of “functional connectivity” (Baccala and Sameshima, 2001; Stevenson et al., 2008).
In this paper, we first demonstrate the ability of the IFC algorithm to track connectivity changes in simulation by comparing IFC to the ground truth values before and after changes imposed on the network. We also present results from a set of in vivo experiments examining plastic changes in IFC among a small set of sensorimotor cortical neurons recorded from rats with multi-electrode arrays. The plastic changes were driven by pairing one or more target stimulus trains with the trigger spiking activity recorded from a single neuron during the rat’s normal, unconstrained behavior. Periodically, the conditioning paradigm was interrupted by recordings also made during the free behavior. This naturally occurring neural activity data was then used as input to the IFC algorithm. The resulting effective connectivity allowed us to monitor plastic changes at various stages of the conditioning protocol.
We found connectivity changes that were spatially localized and dependent on the timing between trigger neuron spikes and target neuron stimulation. We consistently observed an increase in the calculated IFC strength across the trigger–target pair when the stimulation was delivered 5 ms after the trigger spike, and no change when the stimulation was delivered after 500 ms. Weaker changes in the strength of non-targeted connections were also observed; these also depended on the latency of the stimulation, but also on the statistics of the stimulus train. Because these connectivity changes were measured during natural behavior rather than in response to stimulation, they reflect a robust reorganization of the network that manifested itself even in the periods of spontaneous behavior that followed the various stages of the conditioning paradigm.
The ability to evoke and detect such targeted connectivity changes provides a means to reroute the flow of information across a network of cortical neurons. In addition to providing a tool for improving our understanding of the nature and limits of neural plasticity, the ability to manipulate connectivity locally may also have profound implications as a potential therapeutic approach to stroke rehabilitation. Finally, this type of guided, localized plasticity is also intimately associated with the changes that occur within the brains of subjects who learn to control a brain–machine interface (Carmena et al., 2003; Hochberg et al., 2006; Fagg et al., 2007; Velliste et al., 2008).
Materials and Methods
Algorithm
Our primary objective in this work is to develop methods for both quantifying and altering the functional connectivity within a small network of neurons whose activity is recorded in vivo from the rat sensorimotor cortex. The spike-based inference of functional connectivity is based on a generalized linear model similar to that of Pillow et al. (Okatan et al., 2005; Pillow et al., 2008). Briefly, the activation of a given neuron is modeled as a weighted sum of several different sources: inputs from all other observed neurons in the network, the neuron’s own firing history (modeled as a self-connection), and a baseline firing rate (Figure 1A). The self-connection is used to model intrinsic spiking characteristics such as bursting and refractoriness. A fixed, non-linear transformation is used to map activation into a firing rate. Spikes are then generated as a stochastic Poisson process controlled by these firing rates. The free parameters of this model are the time-dependent kernels that describe the effect of each spike on the activation of all observed neurons. An optimization algorithm allows us to find the minimal set of kernels that provide a maximum-likelihood account of the observed spiking behavior of the network (kernels for a four-neuron network, including the “red” and “green” neurons from Figure 1A, are illustrated in Figure 1B). The integral of each kernel over time is used to represent the weight of the corresponding functional connection (Figure 1C). The IFC algorithm aims at estimating functional connectivity by estimating the way neurons interact with one another.
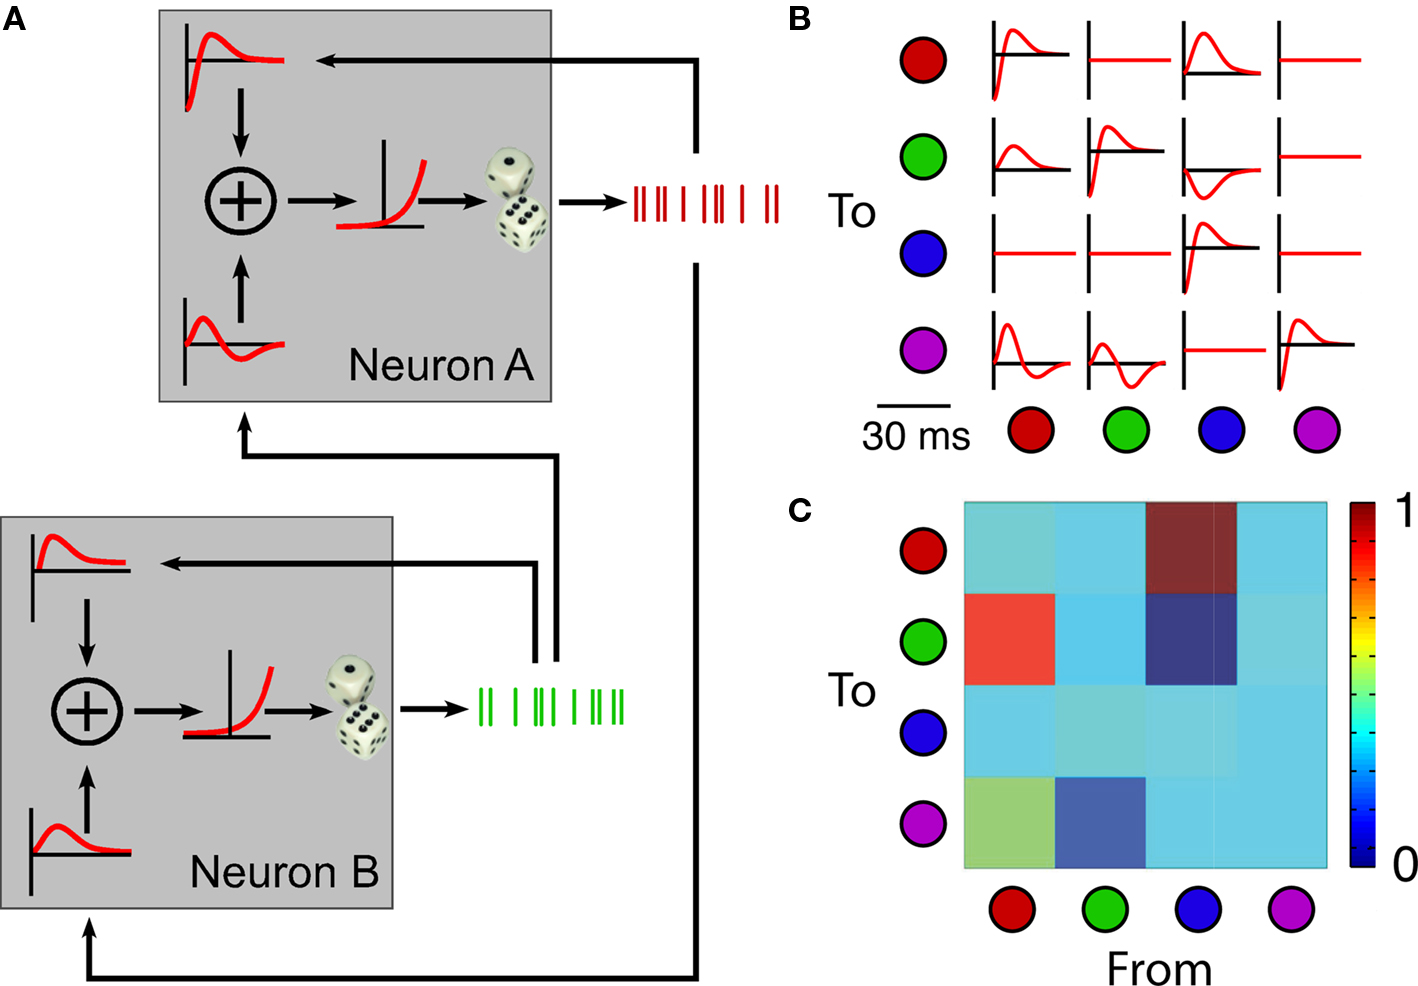
Figure 1. Schematic diagram of the inferred functional connectivity (IFC) algorithm. (A) The discharge of each neuron is driven by input spike trains from itself and from the other neuron, each convolved with a temporal kernel. The convolved inputs are summed, a static non-linearity transforms them into firing rates, and spikes are generated from the resulting Poisson distribution. (B) Recorded spikes are used by the model to estimate the time-dependent pairwise kernels. (C) Each kernel is integrated to produce the connection weight Wij that represents the net effect of neuron j on neuron i. A color scale represents the strength of the connections.
The IFC algorithm is based on a Bayesian approach explored in a number of previously published models (Paninski, 2004; Okatan et al., 2005; Truccolo et al., 2005; Rigat et al., 2006; Pillow et al., 2008; Stevenson et al., 2009). It is a point-process, regularized generalized linear model that extracts the interactions within a population of neurons. Briefly, we consider a population of neurons, each labeled by an index i and described through its instantaneous firing rate λi(t|αi, Ht). Here, αi are network parameters associated with neuron i and Ht is the history of network spiking up to time t. The effect on neuron i at time t of a spike emitted by neuron j at time t′ is quantified by αij(m), where m = t–t′ is the discretized time lag. The connections among neurons are thus described by pairwise time-dependent kernels {αij(m)}. The observed spikes are assumed to be generated by a doubly stochastic Poisson process with instantaneous firing rate:
Here Ij(t−m) is an indicator function that takes the value of 1 if a spike is emitted by neuron j at time (t−m), and 0 otherwise. The sum over all time lags m in the equation above describes the convolution between the kernel αij and the spiking activity Ij.
The net effect of neuron j on neuron i can be quantified by a single scalar connectivity parameter Wij obtained by summing the elements of the corresponding kernel αij over all time lags (the discrete time version of integrating the kernel over time):

The matrix W = {Wij} quantifies the network connectivity. A maximum a-posteriori (MAP) evaluation of the kernels {αij(m)} leads to the estimated W. In the MAP approach implemented here, the log-likelihood of the observed spiking activity is computed using λi(t|αi, Ht), and combined with a prior that favors relatively sparse time-dependent kernels (Pillow et al., 2008). The strength of the sparsity prior was set by fitting a range of values to a subset of data, then computing the reconstruction error of those models on a cross-validation dataset. The hyperparameter that minimized the reconstruction error was then used.
Simulated Neural Network
Simulations were performed in a network of 10,000 neurons. The spatial and temporal properties of the network emulated those of cortical networks. Spatially, the neurons were distributed on the surface of a sphere with a mean density of 100 neurons/mm2. The neurons were implemented using the model of Izhikevich (2003, 2004), in which four parameters suffice to specify the intrinsic dynamical properties of each neuron. The values of these parameters were randomly drawn for each neuron so as to generate a heterogeneous population that included both regular spiking and bursting neurons. The neurons themselves have two state variables, one of which is analogous to the membrane potential of the neuron. The synaptic strength is defined as the change in postsynaptic potential resulting from a presynaptic spike; as such, synaptic strength is expressed in the units of this voltage-like state variable. Neurons were divided into an excitatory population (75% of the neurons) and an inhibitory population (25% of the neurons). Inhibitory neurons only made local projections. Excitatory neurons made 75% of their connections locally and the other 25% around the axon terminal. These connection patterns were chosen based on known properties of the mammalian cortex (Braitenberg and Schuz, 1998; Izhikevich, 2004).
In each simulation, a modified version of the Chinese Restaurant Process (Pitman, 2006) was used to choose the N neurons that constitute the observed subnetwork. The process favored drawing cells that were already connected to highly interconnected neurons. This was done to increase the likelihood of choosing subnetworks with some preexistent structure. The connectivity probabilities of the simulated network were generated in line with in vivo estimates, around 1%. Without some selection bias, most randomly subsampled networks would have had no direct connectivity. All simulations were run for 15 min of simulated time, with a time step of Δt = 1 ms. Each neuron received synaptic input from the network and variable exogenous stimulation at a mean rate of 1 Hz. The mean rate of this stimulation was varied randomly, and the delivery of any given stimulus pulse was also determined stochastically. In order to detect changes in connectivity, a full network was instantiated through the choice of neurons and connections between them, and simulated for 15 min. The spiking activity of N observed neurons was used to determine the functional connectivity of the subnetwork. A small number of connections within the subnetwork were then randomly selected and changed, and the network was simulated for an additional 15 min. The spiking activity of the N observed neurons was used to determine the new functional connectivity of the subnetwork. The inferred connectivity changes ΔW were then compared to the actual connectivity changes.
Array Implantation
Experiments were performed using adult rats (Long–Evans and Sprague–Dawley). All experimental procedures were reviewed and approved by Northwestern University’s Institutional Animal Care and Use Committee (IACUC). Arrays of 16 tungsten microwire electrodes 2 mm in length (Tucker-Davis Technologies, Alachua, FL, USA) were implanted in the forearm area of the sensorimotor cortex centered 3.0 mm lateral and 0.5 mm anterior of bregma. Arrays were driven to a depth of 1000–1300 μm to record from layer V. Recordings during the implant were used to maximize recording quality and neuron yield, causing some variability in implant depth. The arrays were arranged in two rows of eight electrodes each; the rows were separated by 500 μm, and electrodes within the row were separated by 250 μm. Surgery was performed under Ketamine anesthesia, and the rats received Buprinex analgesia and Baytril antibiotic for several days after surgery. Experiments were started no sooner than 5 days after the implantation of the microelectrode array.
Data Collection
Data acquisition and stimulation control was done using a 16- channel recording and stimulating system (Tucker-Davis Technologies, Alachua, FL, USA and Triangle BioSystems, Inc., Durham, NC, USA). During recordings the animal was allowed to behave freely; no task or behavioral response was required. Electrode signals were bandpass filtered (300–3000 Hz). When the signals crossed a voltage threshold, the spike waveform of 1.5 ms duration (beginning 0.4 ms prior to threshold crossing) was saved for off-line analysis. During the stimulation portion of the experiments, action potentials from the trigger neuron were discriminated with a set of window discriminators; after a specified delay following each trigger action potential, a biphasic, fixed-current pulse was sent to the target electrode (30 μA, 0.2 ms per phase). The time of each stimulation pulse was also saved to the data file. Trigger and target neurons were selected for good recording stability and large signal-to-noise ratios. During the stimulation period, which lasted for 40–72 h, the stimulation was periodically interrupted (at intervals of 6–24 h) to record from the entire network. After the conclusion of the stimulation period, recordings from the entire network were made for an additional period ranging up to 6 days. However, the constraint of reliable neuron identification (see below) forced us to restrict the analyses to the 24-h period following the end of stimulation.
Neuron Discrimination and Identification Across Sessions
After data collection from an experiment was finalized, spikes were sorted manually (Offline Sorter, Plexon Inc., Dallas, TX, USA). To study network connectivity over time, we tracked and identified the neurons across recording sessions. Neural identification across sessions was based on the use of distance metrics computed for both spike waveforms and interspike interval distributions. For each of these two properties, the null distribution of distances for a one-sample KS test was obtained from neurons recorded from different electrodes and thus known to be distinct. For a neuron to be considered as having been tracked reliably across sessions, both distances had to be below thresholds determined from the corresponding distribution. The combined use of these two independent properties of spike trains led to empirical p-values below 0.05. For further details, see Supplementary materials and Tolias et al. (2007). Any neuron not tracked reliably across all recording sessions was discarded.
Electrical Stimulation to Change Inferred Functional Connectivity
Our experimental goal was to induce in vivo changes in functional connectivity using a paradigm that has previously been shown to produce changes in the magnitude of stimulus-evoked activity (Fu et al., 2002; Jackson et al., 2006; Jacob et al., 2007). In our experiments we used fine-wire electrode arrays to record the activity of 4–9 neurons in rat forelimb sensorimotor cortex. In each case, one neuron was designated as the trigger and used to control the stimulation. After every spike discriminated from the trigger neuron, a stimulus pulse was delivered at a fixed latency to one or more target electrodes. As a consequence, the electrical stimulation was an exact, time-lagged replica of the trigger spike train.
We ran this stimulation paradigm nearly continuously for 48 h, interrupted only by brief (30–90 min) periods used to record the activity of all observable neurons. During the conditioning period, the only electrode recorded from was the trigger electrode. The target electrode was switched from stimulation (during the conditioning period) to recording using a mechanical switch. These recordings were used to infer both functional connectivity and pairwise correlations within the observed network, and to monitor the time course of connectivity changes throughout the experiment. In order to establish a baseline measure of connectivity, we made two recordings of the network activity, one 24 h before and another immediately prior to the beginning of the stimulation paradigm. To determine the degree of persistence of the plastic changes, we recorded again at 12 and 24 h after stimulation had ended.
BCM Modeling
We implemented a model of plasticity from (Izhikevich and Desai, 2003) that assumes that only the single most recent leading and lagging postsynaptic spikes interact with each presynaptic spike. If the two spike trains have a cross-correlation function described by c(t), the predicted weight change can be written as:
We assumed that without stimulation, the network was in equilibrium over the timescale (∼5 days) that we observed it. Consequently, spike trains measured prior to stimulation were used to fit a, such that no net change was predicted. Because we were interested in the reciprocal (target-to-trigger) connection, xpost(t) was the trigger neuron’s spike train. The cross-correlation function was taken from the trigger–target pair with the assumption that electrical stimulation of the target neuron caused it to fire reliably.
Results
Determination of Inferred Connectivity and its Changes in Simulation
Before analyzing data from the in vivo experiment, we validated the performance of the IFC algorithm by applying it to a large simulated network for which the ground truth was known. To ensure that the inference was robust to assumptions about the precise mechanism of spike generation, we used a neuron model (Izhikevich, 2003) that differed from the generative model assumed by the IFC algorithm. We adjusted the parameters of this model to generate spikes with statistics that were very similar to those we recorded from the rats. The mean discharge for real data was 6 Hz and slightly higher for the simulated data (10 Hz). The Fano factor of the real data had a mean of 1.0, which was very slightly larger than that of the simulated data (0.95). Both the mean firing rate and Fano factor tended to be stable for neurons across recording sessions. More detail is provided in the Supplementary materials. We thus defined a simulation of interacting neurons which can serve as a test bed for the IFC algorithm.
The initial test of the IFC algorithm was undertaken in the simple situation in which the spiking information from all neurons was available to the algorithm. Initial experiments were performed using 12-neuron networks. We quantified the correspondence between the actual and inferred connectivity by calculating the correlation between these two sets of connection weights. The mean R2 across 80 such experiments was 0.83. We conclude that the algorithm performs well when all relevant neurons are observed. However, multi-electrode recordings monitor only a tiny fraction of the behaviorally relevant network. To mimic this condition, we performed an additional 80 experiments using a 10,000-neuron network in which neural activity was severely undersampled. In each of these 80 experiments, we drew six neurons stochastically from the entire network. Only the activity from the neurons in these subnetworks was used by the IFC algorithm. We found that the algorithm did well at revealing the actual connections present in the subnetworks (left column, Figure 2A). In this example, the inferred connectivity was reasonably close to that of the actual connectivity with R2 = 0.5 between the two sets of weights. Most of the strongest connections in the actual network had non-zero inferred weight, while regularization of the connectivity model drove the inferred strength of most of the weaker connections to zero. Across all 80 experiments, the R2 between actual and effective connectivity was somewhat better than in this example, averaging 0.61 ± 0.25. The presence of large numbers of unobserved neurons clearly degrades the performance of the IFC algorithm, but even at a size ratio of >1000:1 between the network and the observed subnetwork, connectivity estimates were significant and captured a large fraction of the actual connection weights within the subnetwork.
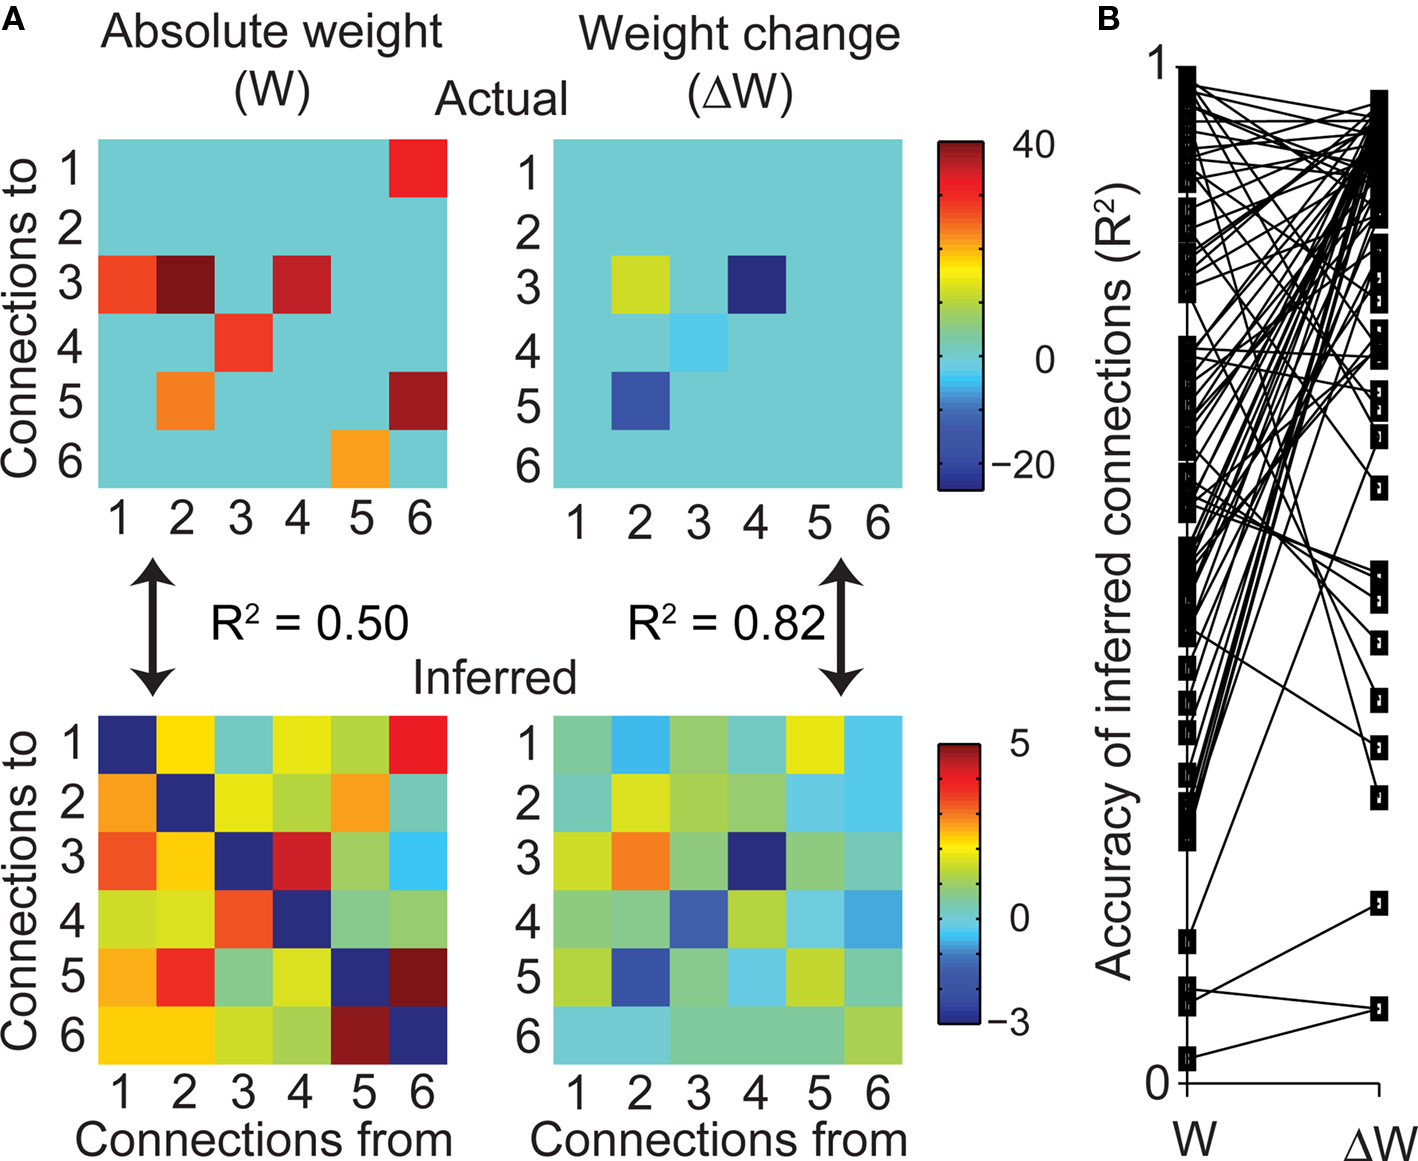
Figure 2. Functional connectivity of subnetworks within large simulated networks. (A) A representative example of the true (top, left) and inferred (bottom, left) connectivity matrix W for a subnetwork of six neurons embedded in a 10,000 neuron network. Plasticity experiment on the same network; true (top, right) and inferred (bottom, right) matrix of connectivity changes ΔW. Units for the true network are defined through the Izhikevich model of neuron spiking, while the units of the inferred network are given by the IFC model. (B) Comparison of R2 for inferred weights W and weight changes ΔW for 80 experiments. Lines join the paired values resulting from a given experiment. Difference in means was highly significant (n = 80, KS-test, p < 10−9).
Even in simulation, we do not expect the estimated functional connectivity to perfectly reproduce the absolute connection strengths within the subnetwork, as additional input from the many unobserved neurons will confound the estimation. However, since the main goal of this work is to monitor plasticity, determining absolute connectivity is less important than determining connectivity changes resulting from plasticity-inducing experimental manipulations. In simulation, we changed the value of the connection weight WAB from neuron B to neuron A, and asked about the resulting changes in IFC. Ideally, the inferred connectivity matrix will accurately reflect the isolated change in WAB while all other connections remain unchanged. Alternatively, interactions between neurons A and B and the unobserved neurons might propagate the isolated change in WAB to other inferred connections in the observed subnetwork, thereby confounding attempts at measuring localized connectivity changes.
We found that while the algorithm did reasonably well at inferring the absolute functional connectivity in the network (see above), it did very well at inferring changes in functional connectivity (right column, Figure 2A). In this example, the R2 between true and inferred ΔW was 0.82. Across all 80 experiments that monitored functional connectivity changes, the mean R2 was 0.81 ± 0.22. In virtually all cases, the estimate of the weight changes was better than that of the weights themselves (Figure 2B). The IFC algorithm is thus capable of monitoring connectivity changes in severely undersampled networks, suggesting that this algorithm may be a useful tool to quantify such plastic changes in vivo. We also compared the structure of the IFC kernels to that of the pairwise cross-correlations for the simulation shown in Figure 2A. The isolated changes to network connectivity caused more diffuse changes to the cross-correlations throughout the network than was the case for the IFC kernels. This result is presented in more detail in Figure S3 in Supplementary materials). These results from simulated data suggest that the IFC provides a stronger tool for measuring isolated changes in the statistical interactions between neurons than do simple pairwise cross-correlations.
Changes in Functional Connectivity Using a Single Target Electrode
We ran experiments that paired spiking of the trigger neuron with electrical stimulation of the target electrode at fixed latency. The results of one of these experiments are summarized in Figure 3.
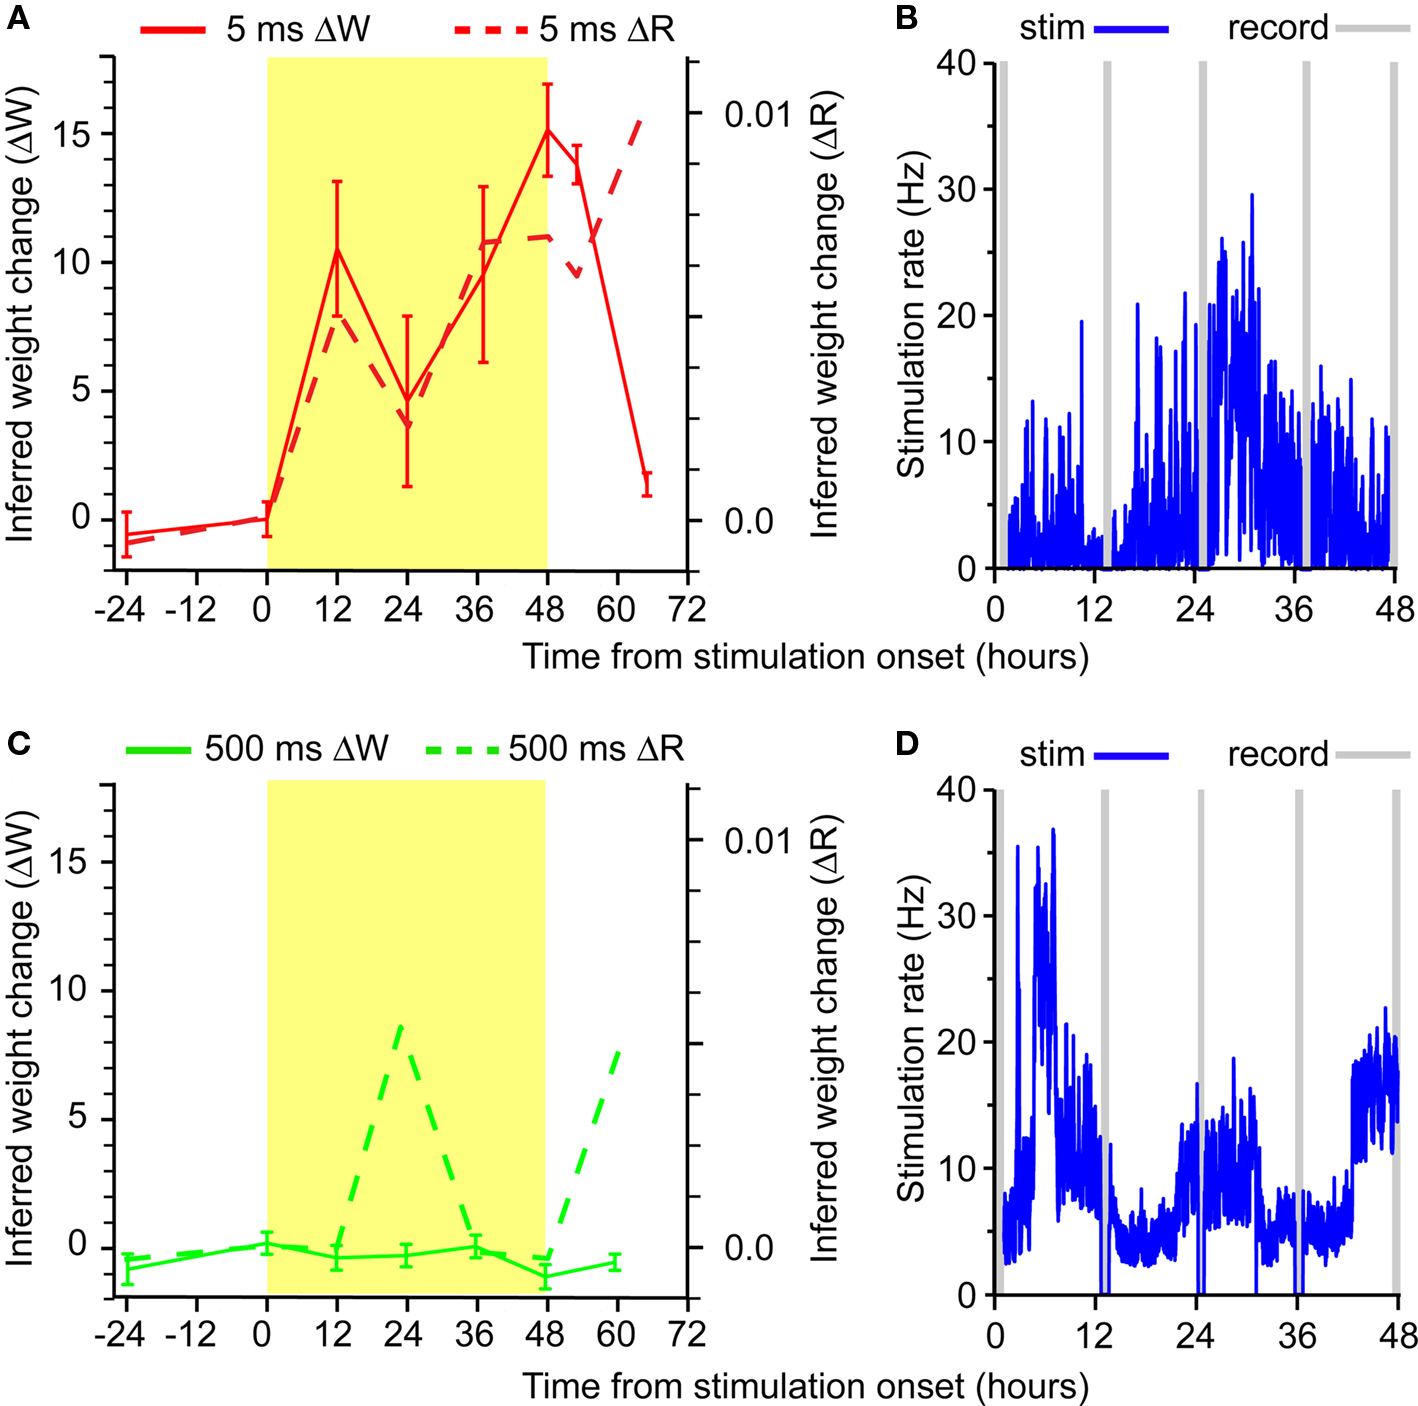
Figure 3. Timecourse of trigger-to-target ΔW and ΔR. Stimulation took place during the 48-h window shown in yellow. (A) Latency between trigger spike and target stimulation was 5 ms. (B) Stimulation rate (binned at 1 min) for the experiment shown in (A). (C) Latency between trigger spike and target stimulation was 500 ms. (D) Stimulation rate for the experiment shown in (C).
No significant change in functional connectivity was detected in the interval between the −24 h recording and the recording immediately prior to stimulation onset (Figure 3A, solid red lines). However, paired spiking and short-latency (5 ms) stimulation triggered significant changes in the network spiking statistics during the subsequent 48 h. Note the strong, progressive increase in potentiation of the IFC from trigger to target neuron. In all cases, ΔW is plotted relative to the IFC measured at time 0. The effect persisted for several hours after the end of the stimulation, returning nearly to baseline within 12–24 h.
The potentiation in IFC was critically dependent on the timing of postsynaptic stimulation. An experiment done using a 500-ms latency between trigger spike and target stimulation resulted in no net potentiation of ΔW (Figure 3C; solid green lines). In this case, the stimulation was also a perfect replica of the trigger spike train. As in the 5-ms condition, all recorded spikes were used to trigger stimulus pulses, but at the longer, 500-ms latency. The marked difference in connectivity change between the 5-ms and the 500-ms latency protocols demonstrates the critical role of timing between trigger and target in inducing neural potentiation. The timing dependence of the potentiation in our experiments is consistent with studies of STDP (Bi and Poo, 2001).
Comparison of IFC and Cross-Correlation
There were also significant changes to the pairwise cross- correlations between neurons in these experiments (Figure 3, dashed lines). Much like W sums the time-dependent components of the kernels, we computed the change in the cross-correlation by summing the cross-correlation value across the same time lags as W, a measure termed ΔR. In the 5-ms latency experiment, there was a strong correspondence between the two measures, except following stimulation offset, when ΔR remained elevated. The difference between the two measures is more evident in the 500 ms experiment in which there were much larger fluctuations in ΔR than occurred in ΔW.
We used the fluctuations in the measured IFC or cross- correlation strength during the baseline period prior to stimulation to estimate the intrinsic variability of both measures. We normalized the variance of these null distributions by dividing them by their respective means. By this measure, the cross-correlation measure, of ΔR, was nearly 2.5 times noisier than IFC (ΔW). Consequently, the sensitivity of IFC to small changes is greater by this same factor, reflected in the magnitude of the 95% (2σ) confidence level threshold (Figure 4). We conclude that IFC is more sensitive than pairwise cross-correlations for describing the statistical interactions between neurons in vivo.
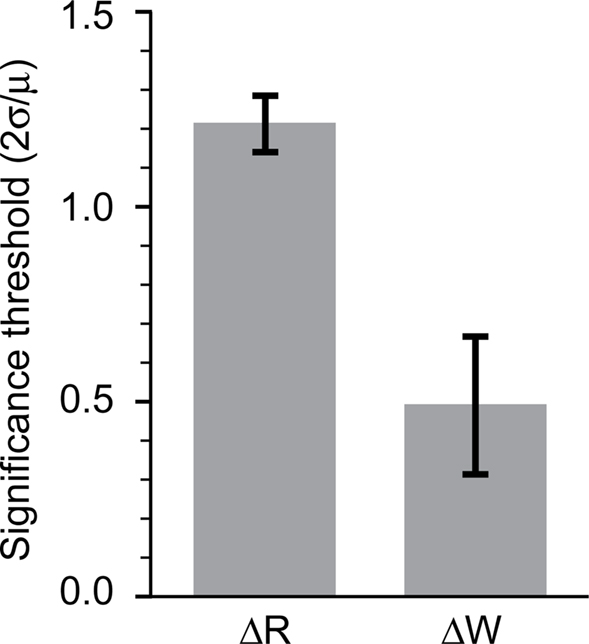
Figure 4. Sensitivity of R and W. Comparison of fluctuations of R and W in prestimulation periods enabled an estimate of the sensitivity of the two measures. A mean-normalized estimate of the standard deviation is shown for R (left) as well as W (right).
Temporal Structure of IFC and Cross-Correlations
We examined the structure of both the IFC kernels and cross-correlations before and after the stimulation to see if either one contained unique information (Figure 5). This figure corresponds to the experiment shown in Figure 3, in which electrode 4 was stimulated whenever a spike was detected on electrode 3. Initially, the corresponding kernel was identically zero, but it increased dramatically following the conditioning stimulation. The timecourse of this change is shown by the solid red line in Figure 3A. Several other connections increased nearly as much (e.g., 4 to 1 and 1 to 4) but the targeted connection was the largest.
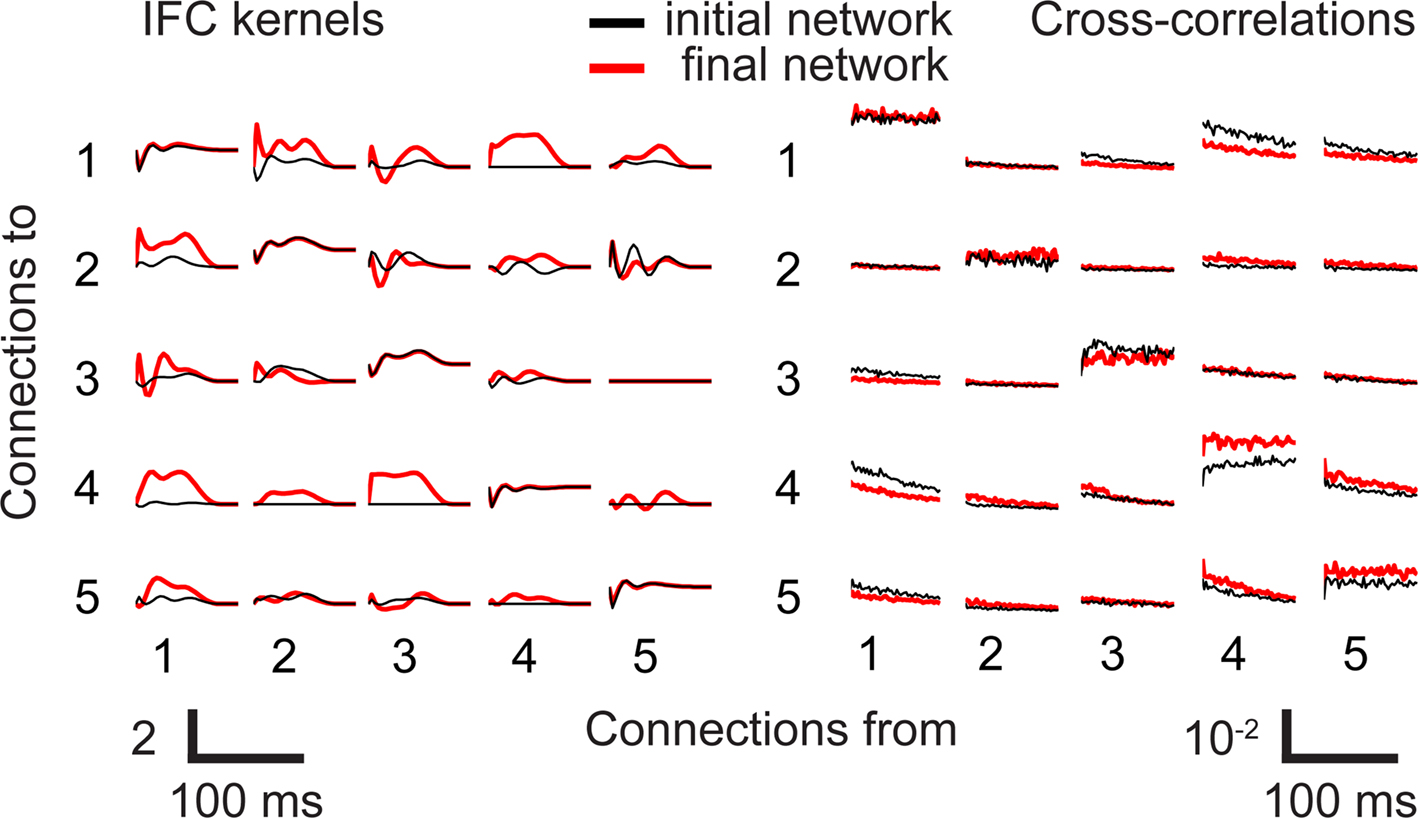
Figure 5. Observed changes in cross-correlations and IFC kernels. IFC kernels (left) and cross-correlation functions (right) for animal BT. These functions are shown before (black) and after (red) the stimulation period. Autocorrelation scale reflecting self connections is 10 times that of the cross-correlations.
Although we have previously described changes only in the integrated magnitude of the IFC kernels (W), we also analyzed their peak value, the lag at which the peak occurred, and the full width at half maximum. The findings were consistent with there being a general scaling of the IFC kernel, with little systematic changes in the temporal dynamics. It should be noted that in two of the five experiments, the prestimulation connection was reduced to zero by the sparsity prior, so that its peak lag and peak width were ill-defined. For the remaining three experiments, the change in peak amplitude for the targeted connections was well correlated with ΔW (R = 0.82), while the lag time of the peak was unchanged by the stimulation (n = 3, one-sample Wilcoxon signed rank test, p = 0.88). The width increased by an average of 4.6 ms, which was also not significantly different from zero (n = 3, one-sample Wilcoxon signed rank test, p = 0.25). The initial strength of the inferred connections was not significantly correlated with the size of the subsequent change.
Overall, there was considerably greater temporal structure in the IFC than the cross-correlations. Nearly all of the cross- correlations had an exponentially decaying shape (Figure 5), and as a consequence, the time of the peak and its width were generally ill-defined. Because they also often lacked a well-defined background level, it was more difficult to judge whether changes in magnitude reflected a change in scale or offset. Using the signed integral of the cross-correlation, there were eight connections with greater potentiation than the targeted connection in this experiment, and 11 that had smaller potentiation or depression. The combination of its greater sensitivity and varied temporal structure suggests that the IFC represents a more useful measure of altered network dynamics than do pairwise cross-correlations.
Changes in Functional Connectivity Using Two Target Electrodes
We performed several experiments in which a single neuron was used to trigger stimulation in two target electrodes to test the interaction of potentiation effects. One target was stimulated at a 5-ms latency following the discriminated trigger spikes; the other at a latency of 500 ms. In these experiments, the pattern of stimulation in the two target electrodes was identical except for the 495 ms difference in timing. As in the single-electrode stimulation experiments described above, the connection associated with the 5-ms latency was preferentially strengthened following the onset of stimulation (Figure 6). The large potentiation of the connection to the 5-ms latency target was clearly distinct from the small change of the connection to the 500-ms latency target (Figure 6A). The latter was comparable in magnitude to the fluctuations in IFC observed during the 24-h period preceding stimulation (see Figure 6B). Small increases were also observed in non-targeted connections (see Figure 6C). Interestingly, in this experiment the largest IFC increase in a non-targeted connection was observed in the reciprocal connection from the 5-ms latency target to the trigger.
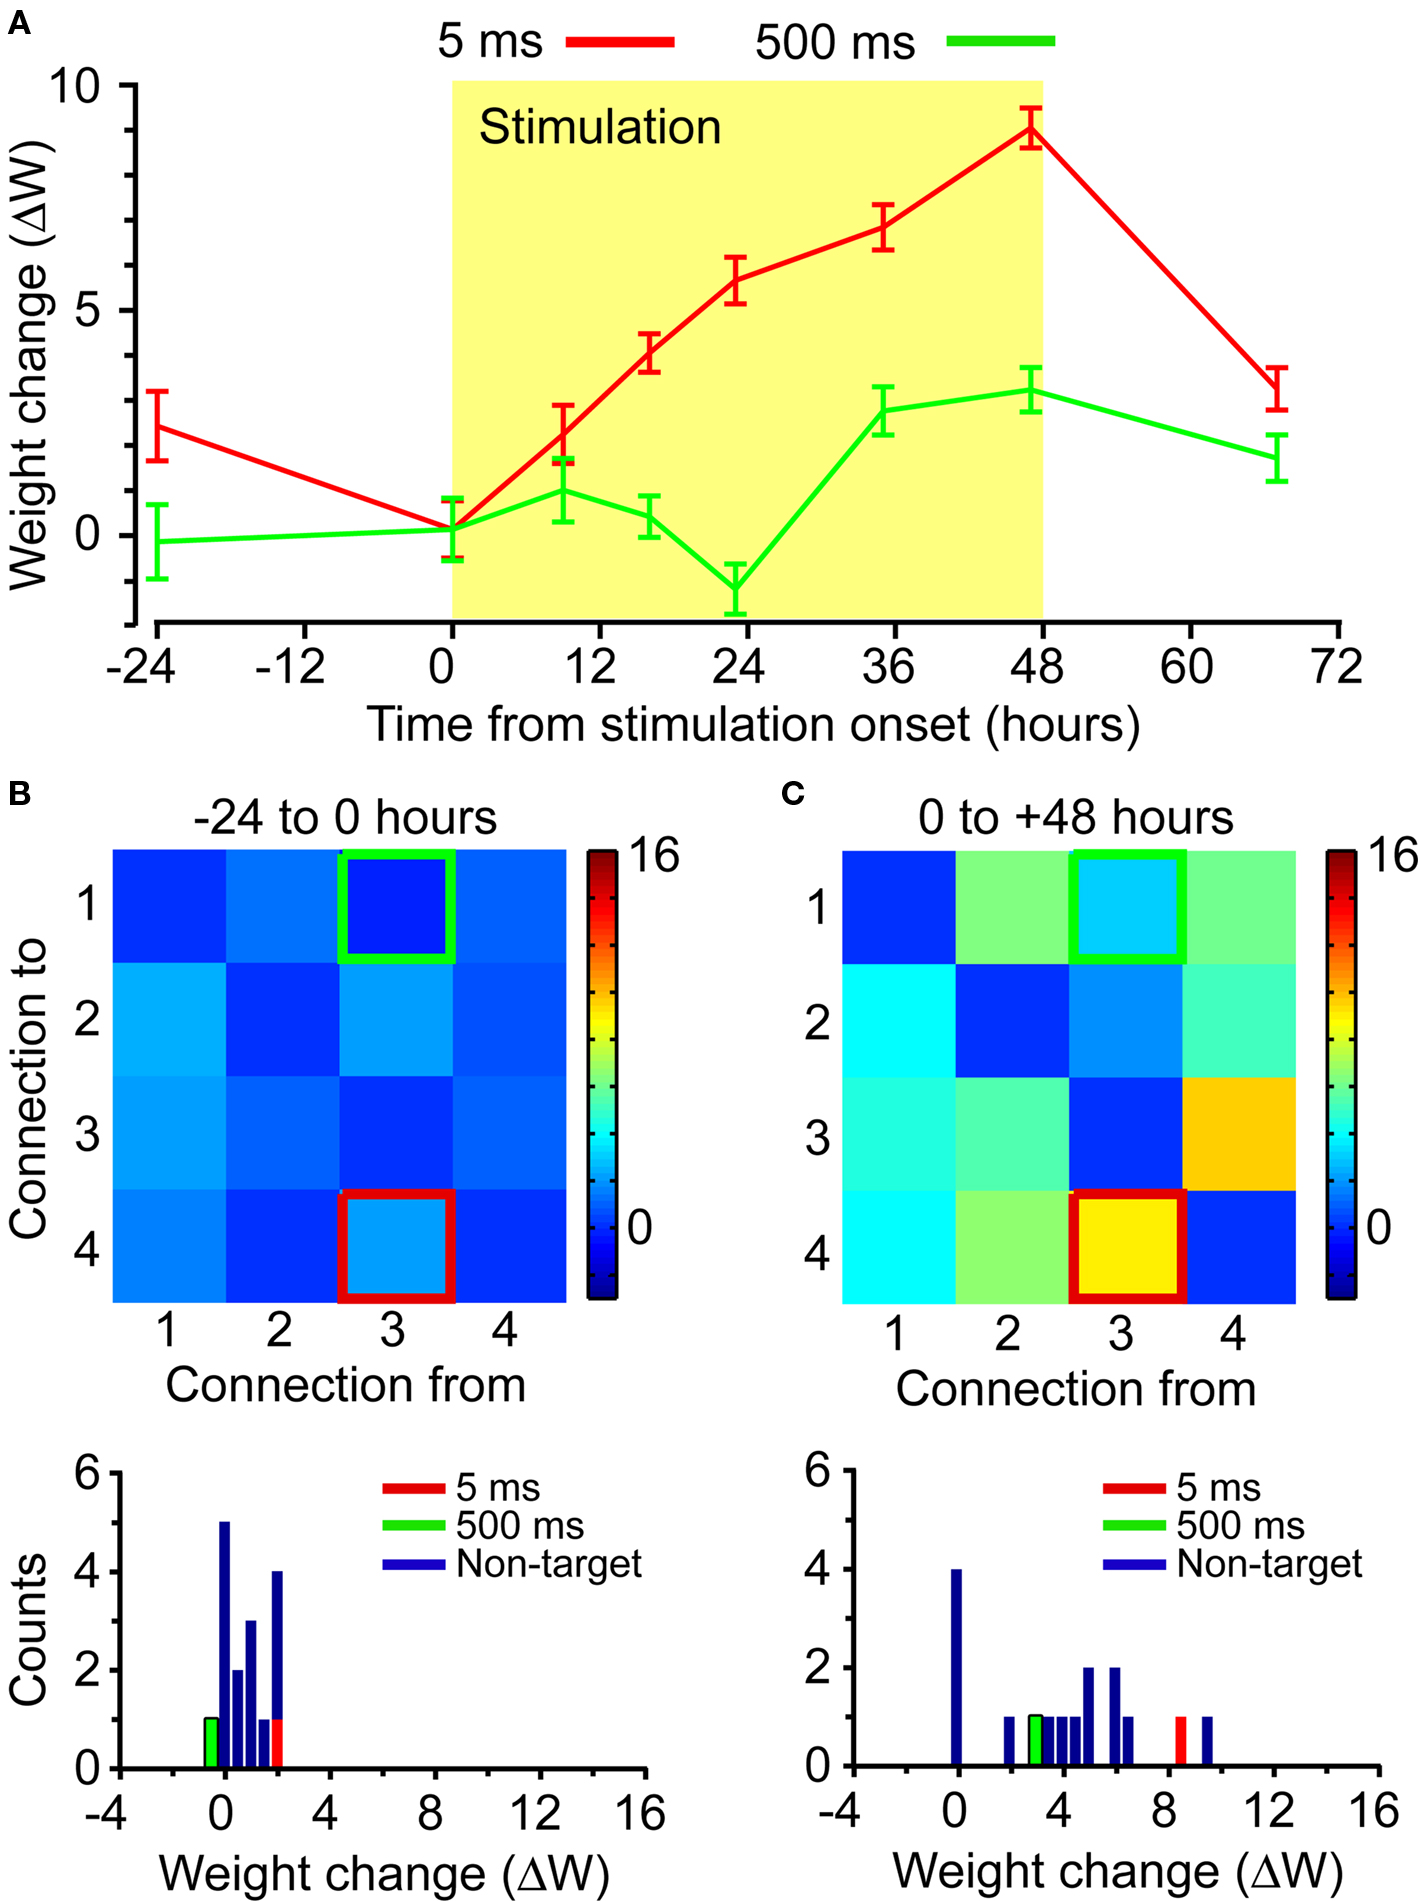
Figure 6. Connectivity changes from combined stimulation. Two target electrodes were stimulated in a single experiment, each at a different latency with respect to the trigger spikes. Red indicates the connection stimulated at 5-ms latency; green indicates the connection stimulated at 500-ms latency. (A) Timecourse of trigger-to-target ΔW. (B) Matrix and histogram of connectivity changes ΔW for the 24-h period prior to the onset of stimulation. (C) Matrix and histogram of connectivity changes ΔW for the 48-h stimulation period.
Changes in Functional Connectivity Among Non-Targeted Neurons
Significant changes in IFC were induced only when the latency between trigger spike and target stimulation was within the range expected to produce STDP (see Figures 3 and 6). However, the stimulation protocol affected connections beyond those between trigger and target neurons. Figure 7 shows a striking example of this non-targeted potentiation, following the onset of stimulation with a 5-ms latency (compare Figure 7C to Figure 7A). In this example, the largest increase corresponds to the trigger-to-target connection, but several other connections were also strengthened. This coexistence of both targeted and non-targeted potentiation was consistently observed in all our 5-ms latency experiments.
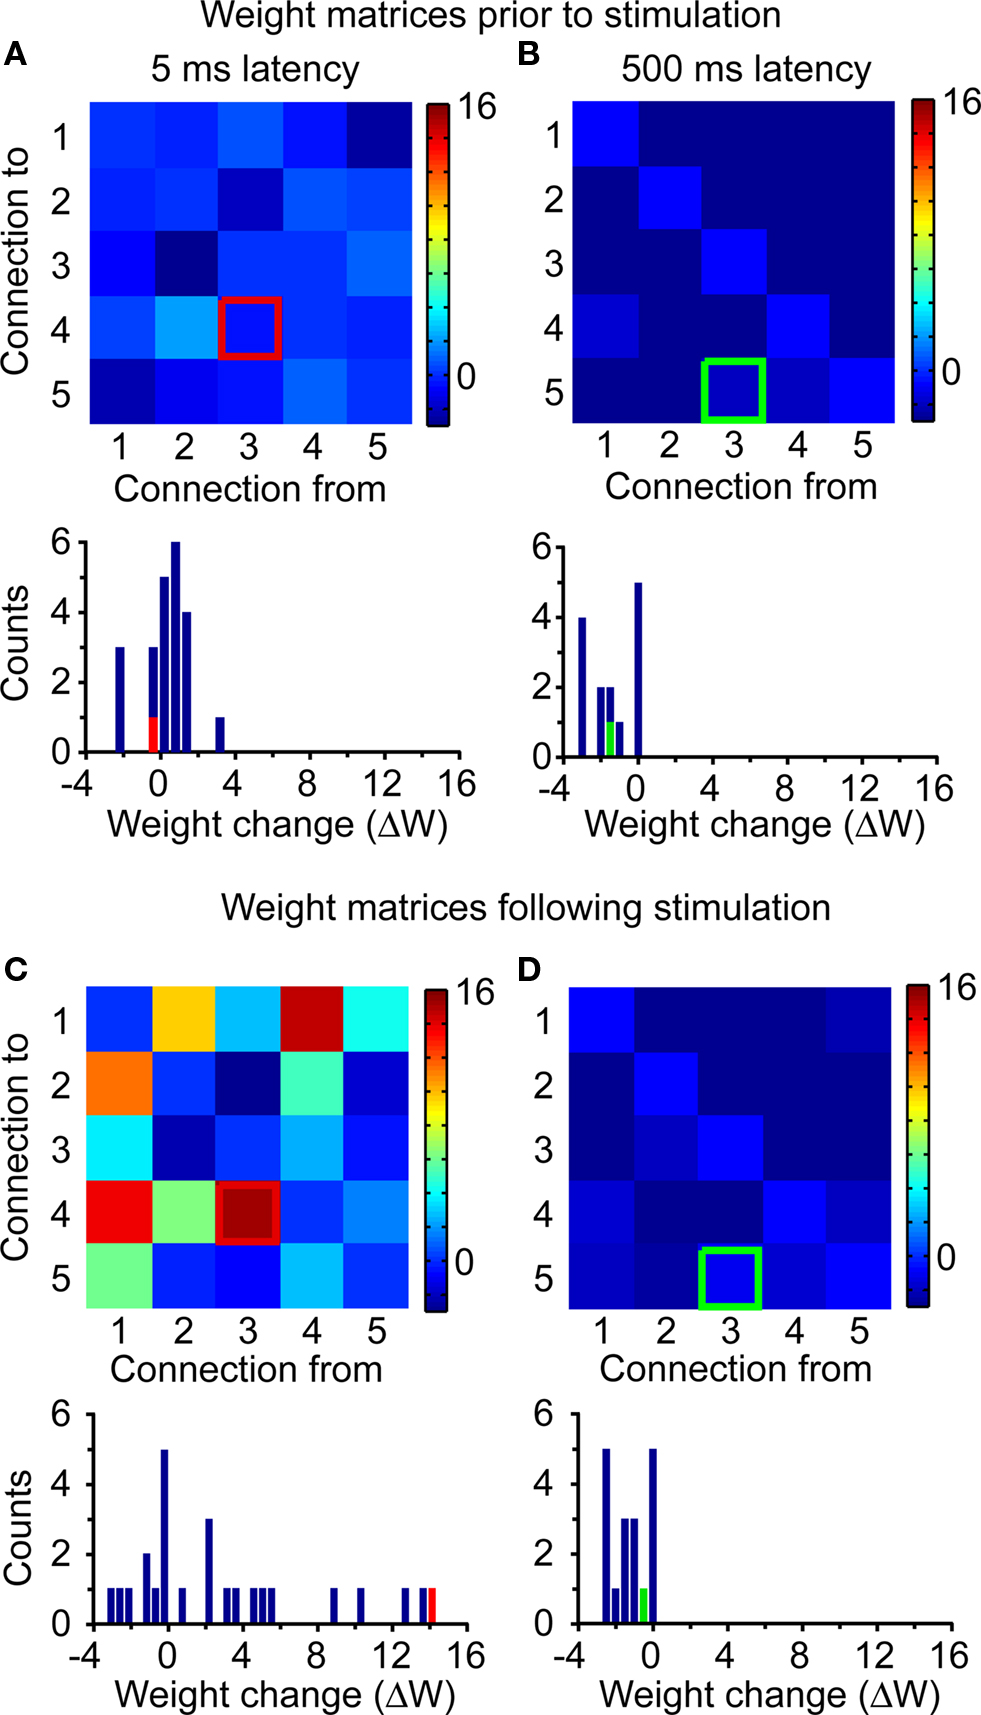
Figure 7. Network-wide potentiation effects. Matrix of connectivity changes ΔW for the two stimulation experiments of Figure 3. In all plots, the trigger-to-target connection is highlighted. (A) ΔW matrix and histogram for the period from −24 to 0 h for the 5-ms latency stimulation. (B) Corresponding results for the period from −24 to 0 h for the 500-ms latency stimulation. (C) Results for the period from 0 to 48 h after the onset of stimulation at 5-ms latency. (D) Corresponding results for the period from 0 to 48 h after the onset of stimulation at 500-ms latency.
Unlike the significant potentiation observed at 5 ms (see Figure 7C), stimulation at a latency of 500 ms induced no substantial changes in either targeted or non-targeted connections (see Figure 7D), being essentially identical to those in (B), prior to the onset of stimulation. It is important to note again that the targeted neurons received very similar amounts of stimulation in both 5- and 500-ms latency experiments, except for the difference in latency after the trigger spike. The dependence of both targeted and non-targeted potentiation on the latency of stimulation was a consistent finding across all our experiments.
Stimulation Statistics Effect on Potentiation
The exponential model of STDP (Bi and Poo, 2001) can be successfully used to explain potentiation when the presynaptic spikes are well separated in time. However, as trigger spikes occur more frequently, their potentiation effects overlap in time and become less dependent on the timing of individual spikes (Markram et al., 1997; Sjostrom et al., 2001; Froemke et al., 2006). In an effort to understand the non-targeted potentiation observed in our short-latency stimulation experiments, we examined the statistics of the target stimulation trains, including their mean rate and autocorrelation.
For each of five experiments that included a short-latency target we computed the mean autocorrelation of the stimulation train for lags from 20 to 100 ms, a range chosen to approximate the time course of calcium accumulation in dendritic spines following electrical stimulation (Yuste and Denk, 1995; Sabatini et al., 2002). This measure of autocorrelation essentially measures the “burstiness” of the stimulus train; the more bursting, the higher the autocorrelation. The changes in strength, ΔW of non-targeted connections were highly correlated with this autocorrelation measure, with R2 = 0.94 (Figure 8). Non-targeted potentiation did not seem to be due to the mean rate of stimulation, which was uncorrelated or only weakly correlated with both the average non-targeted ΔW (R2 = 0.01) and the target-to-trigger ΔW (R2 = 0.51). Importantly, neither mean stimulation rate nor stimulation autocorrelation was predictive of the potentiation ΔW of the trigger-to-target connection (R2 = 0.01 and 0.35 respectively).
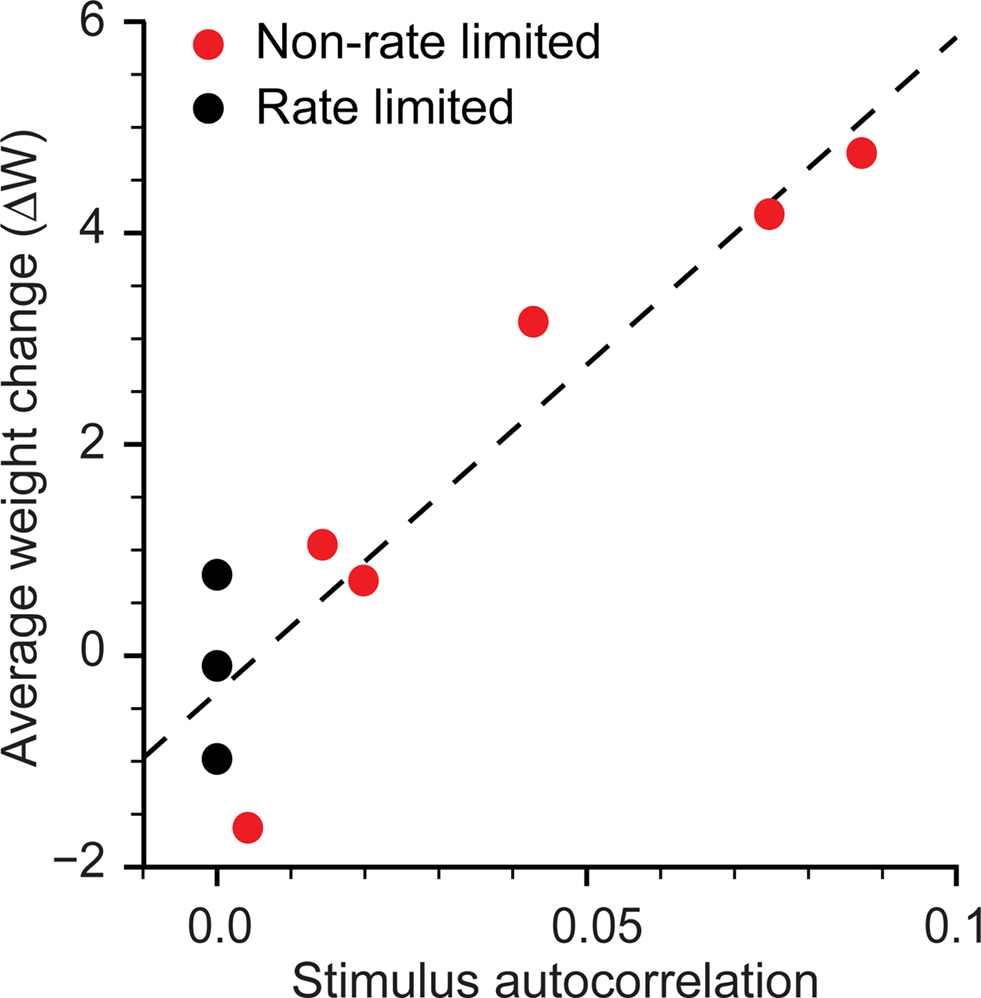
Figure 8. Effect of stimulus autocorrelation on network-wide potentiation. For all experiments at 5-ms latency (red), the average connectivity change ΔW for non-targeted connections had a linear dependence on the autocorrelation of the stimulus train averaged over lags from 20 to 100 ms. Average weight changes for the rate limited experiments with an enforced autocorrelation of 0 (black) are clustered around zero.
Autocorrelation-Limited Stimulation
In the previous experiments, the stimulus train (and hence its autocorrelation) was identical to that of the trigger neuron. To explore the potential causal relationship between stimulus autocorrelation and non-targeted potentiation, we performed a series of experiments in which we restricted the autocorrelation of the stimulus train while preserving the latency between trigger spike and target stimulation. The stimulator was limited to a maximum rate of 10 Hz, thereby fixing the stimulus autocorrelation within the 100 ms window identically to zero. These rate-limited experiments resulted in a trigger-to-target potentiation similar to that of the standard experiments, an example of which is the six to five connection in the displayed experiment (Figures 9A,B). The time course of this change (Figure 9C) was essentially the same as in the standard experiments. There were also changes in the non-targeted connections but they were distributed in a substantially different fashion from those of the standard experiment. As the color bar in (B) suggests, the changes were more uniformly distributed, with a mean very near zero. These findings were consistent across three experiments (Figure 9D), all of which had large target potentiation and near-zero mean off-target changes. As in the standard experiments, no potentiation occurred with stimulation at long latency (500 ms).
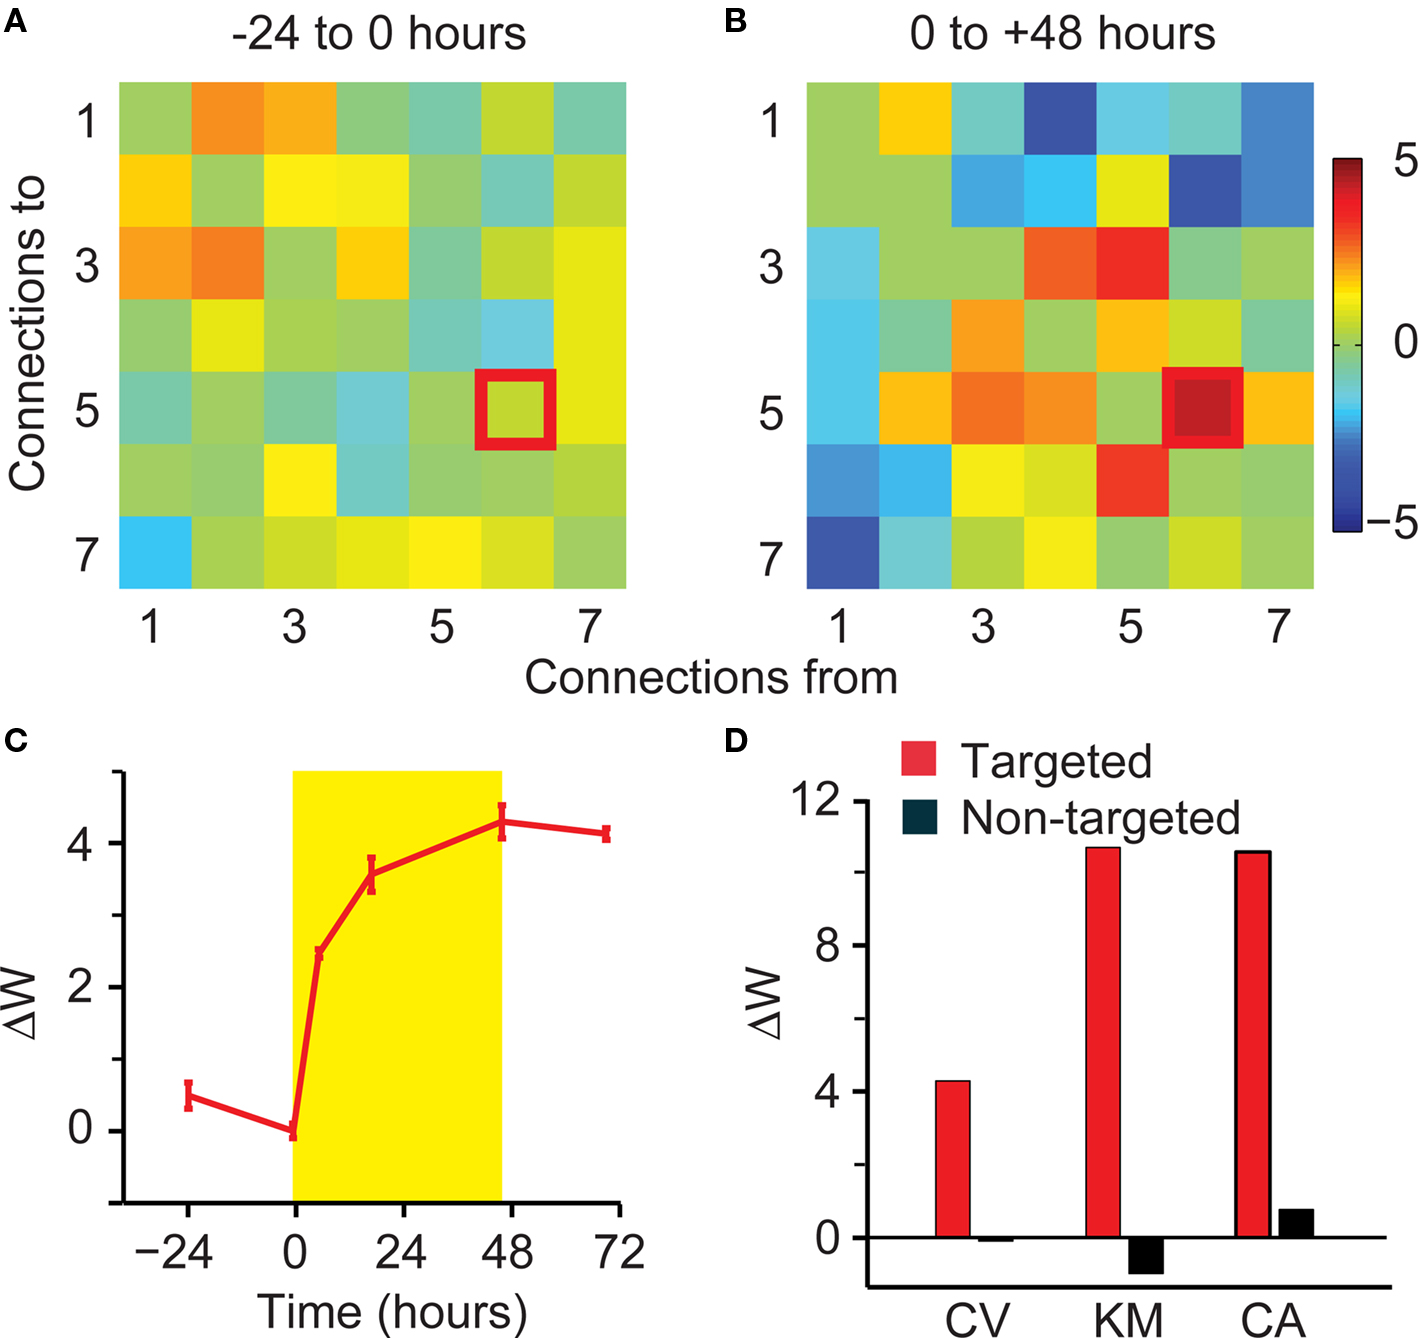
Figure 9. Network-wide potentiation effects in rate-limited experiments. (A) ΔW matrix for the period from −24 to 0 h for the rate-limited, 5-ms latency stimulation. (B) Results for the period from 0 to 48 h after the onset of rate-limited stimulation at 5-ms latency. (C) Timecourse of trigger-to-target ΔW. (D) Summary of ΔW for targeted (red) and the average of all non-targeted connections (black).
Induced Changes in Functional Connectivity
All experiments in which the target was stimulated at 5-ms latency resulted in an increase in the strength of the trigger-to-target functional connection (Figure 10A, red). Trigger spikes used to control stimulation at 500-ms latency led to no significant changes in strength of the trigger-to-target connections (Figure 10A, green). Even for rat Pt, for which the short-latency potentiation was unusually small, the 5-ms latency ΔW was larger than all but one 500-ms latency ΔW.
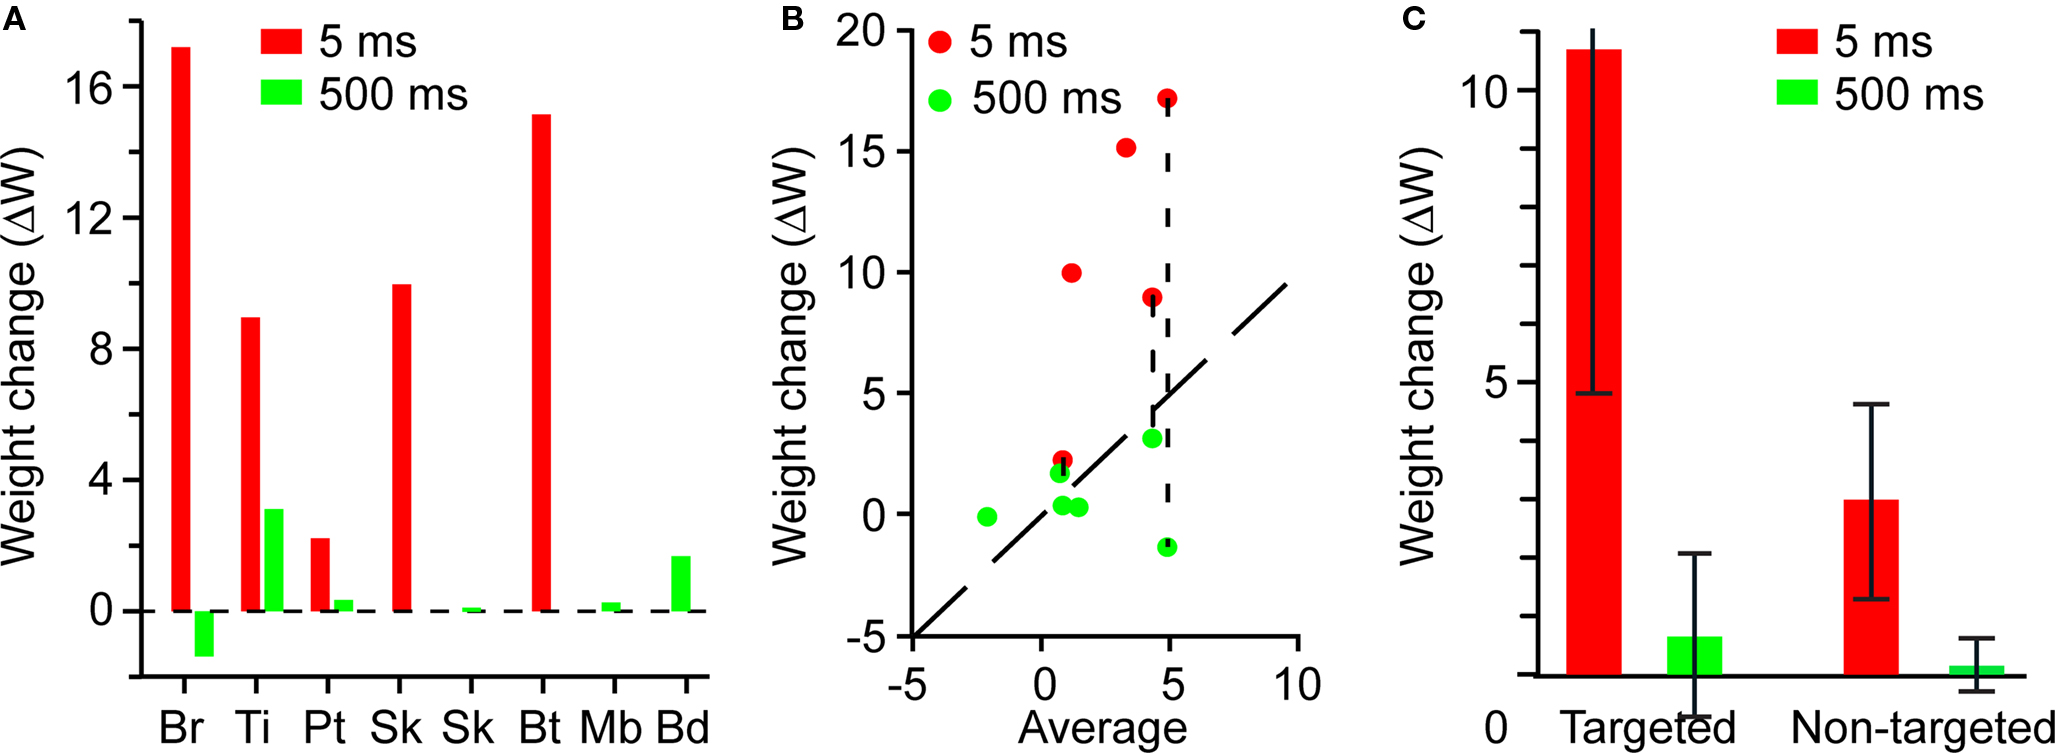
Figure 10. Potentiation of targeted and non-targeted connections at short and long latencies. In all panels, red refers to 5-ms latency, and green refers to 500-ms latency. (A) Mean weight change of targeted connections. Experiments on animals Br, Ti, and Pt involved stimulation of two electrodes at different latencies, as in Figure 6. (B) ΔW of the targeted connection as a function of the average ΔW for all non-targeted connections; equal values lie on the diagonal dashed line. Paired results for experiments with two stimulation electrodes are identified by vertical dashed lines. (C) Average connectivity changes ΔW for targeted and non-targeted connections, at 5- and 500-ms latency. The upper error bound for the targeted, 5-ms connections has been truncated.
The nature of the non-targeted potentiation is further illustrated in Figure 10B, which shows the ΔW for the trigger-to-target connection vs. the mean of ΔW for the non-targeted connections. All short-latency targets show a ΔW larger than the associated average weight change, substantially so in all but one experiment. The anomalous point is that from rat Pt, as discussed above. In addition, the weight change of the non-targeted connections was larger in those experiments that included a 5-ms latency target.
The weight change was larger for the targeted than for the non-targeted connections (Figure 10C). For targeted connections, the mean ΔW was 10.7 ± 5.9 for 5-ms latency, but only 0.45 ± 1.49 for 500-ms latency. This 16-fold difference was highly significant (n = 5, Wilcoxon rank-sum test, p < 0.01). For non-targeted connections, potentiation was observed only in experiments that included a 5-ms latency target. The mean value of this non-targeted potentiation was 2.8 ± 1.8, significantly smaller than the mean ΔW for targeted connections (n = 5, Wilcoxon rank-sum test, p = 0.04). The variability in mean ΔW was the result largely of animal Pt. The distribution of ΔWs for non-targeted connections was approximately normal (n = 89, Jarque–Bera test, p = 0.15), and highly significantly greater than zero (n = 89, t-test, p << 0.001) in the short-latency experiments. In experiments that only included a 500-ms latency target, there were no significant changes in functional connectivity and the mean ΔW for targeted connections was not significantly different from that of non-targeted connections (n = 6, Wilcoxon rank-sum test, p = 0.39). Furthermore, the distribution of ΔWs after 48-h stimulation with long latency did not differ from the distribution of ΔWs during the 24 h before stimulation (n = 77, Wilcoxon rank-sum test, p = 0.31).
Reciprocal Potentiation
In the experiments with short-latency stimulation, the mean change in the target-to-trigger (reciprocal) connection was 7.0, larger than the remainder of the non-targeted changes, but smaller than the trigger-to-target ΔW. While there are many important differences between experiments examining a single, isolated synapse and the IFC measured here, the Hebbian-like aspects of our basic result make the reciprocal potentiation we observed surprising on face. To determine whether reciprocal depression might actually have been the predicted consequence of our stimulation paradigm, we applied data recorded from potentiation experiments to a rate-based model of plasticity (see “Materials and methods”). Rather than depression, the spiking observed in all five experiments led to a predicted potentiation of the target-to-trigger connection.
Discussion
Precisely timed pre- and postsynaptic activity is thought to drive changes in the strength of connections between neurons, and has been postulated to be one of the mechanisms by which long-term memories are instantiated in neural circuits (Bliss and Collingridge, 1993; Abbott and Blum, 1996). Up to now, evidence for these changes has been limited to changes in stimulus-evoked activity or in the pairwise correlation between neurons. Here we use a novel statistical measure to monitor changes in functional connectivity within a network of neurons that has been subjected to a paradigm designed to elicit STDP. Here we initially address some of the essential statistical questions related to the use of the IFC, followed by a discussion of the biological implications of the in vivo experimental results.
Performance and Validation of the Inferred Functional Connectivity Algorithm
The IFC algorithm used to infer the effective strength of connections between neurons is based on a Bayesian approach to account for the statistics of spiking throughout the observed network. The use of this algorithm to infer functional connectivity provides several advantages over connectivity analysis based on cross-correlation. By incorporating constraints that penalize a large number of connections, the approach provides a parsimonious and robust description of network connectivity. Prior knowledge of other physiological or behavioral signals can easily be incorporated as additional constraints to the Bayesian model, resulting in further improved connectivity estimates (Stevenson et al., 2008). In that earlier study, we validated the IFC algorithm using a completely observed network of simulated neurons whose properties exactly matched the generative model assumed by the IFC. In the current simulations we aimed to test the robustness of the algorithm under somewhat more realistic conditions, including the use of Izhikevich-type neurons. Here we validated the IFC algorithm using localized connectivity changes within small, observed subnetworks embedded within much larger unobserved networks. These results were intended to mimic to a greater extent, the in vivo multi-electrode recordings that can give access to only a tiny fraction of the total network.
The IFC does not describe the precise structural or anatomical connectivity among the observed neurons. Rather, it describes a system that approximates the statistics and dynamics of the observed network of neurons. Likewise, we consider it to be unlikely that the detected connectivity change was the result simply of the potentiation of monosynaptic connections between trigger and target neurons. At distances corresponding to the spacing of the electrode array, the probability of a monosynaptic connection can be conservatively estimated to be less than 1% (Braitenberg and Schuz, 1998).
It would be very interesting to know just how important the indirect connections are in vivo. However, there are several fundamental reasons why our simulations may not address this question satisfactorily. (1) The properties of our simulated network were not meant to represent the properties of the in vivo network in great detail. For this reason, we are reluctant to draw too many detailed biological conclusions. (2) It is reasonable to assume that indirect effects may play a more prominent role in vivo than in our simulation, simply because of the much larger number of possible indirect routes. (3) Computing the ground truth indirect connectivity within a 10,000 node network is probably not feasible computationally. Even considering paths of five or fewer links, roughly 1016 connection strengths that would need to be integrated for each pair of neurons.
Mechanisms for Targeted Potentiation
In the subsequent in vivo experiments, we monitored changes in functional connectivity over the course of several days, before, during, and after conditioning stimulation. The associative pairing of spiking and electrical stimulation at 5-ms latency resulted in consistent and robust changes in functional connectivity; these changes may be interpreted as the strengthening (or weakening) of connections within this small network of observed neurons. There might also be some concern that the potentiation that we have observed might simply be due to general stimulation-induced changes in the state of network synchrony. There are at least two reasons why this seems quite unlikely. First, the lack of potentiation for the 500-ms latency stimulation is an important control. If electrical stimulation by itself was enough to raise a network into a highly correlated “up state”, we would expect to see IFC potentiation at the long (500 ms) latency. Second, the trigger-to-target connection underwent the largest ΔW in all but one case (and in that experiment, it was the second largest). It is not clear how changes in synchronized network activity would preferentially alter this connection, except by the potentiation of mono- or poly-synaptic pathways between the two neurons.
We found no relationship between the number of stimulation events and the evoked potentiation across experiments. However, the observed potentiation was strongly dependent on the latency between the trigger spike and the electrical stimulation. This latency was consistent with that found in previous studies of STDP, in that 5 ms was effective, while 500 ms was not (Bi and Poo, 1998; Fu et al., 2002; Jackson et al., 2006).
Studies of STDP have yielded significant evidence that the conjunction of presynaptic spiking and postsynaptic depolarization mediates synaptic potentiation. Presynaptic spiking causes the release of glutamate and the activation of NMDA receptors, and postsynaptic depolarization removes the Mg2+ block of the NMDA channel. This results in Ca2+ influx through the channel, possibly the crucial signaling mechanism for mediating synaptic potentiation (Neveu and Zucker, 1996; Yang et al., 1999; Sabatini et al., 2002). The properties of STDP have been tested in vitro in many experiments (Bi and Poo, 2001). More recently, changes consistent with STDP have also been demonstrated in a variety of in vivo preparations. A partial list includes: changes in the direction of torque pulses evoked from motor-cortical stimulation (Jackson et al., 2006), shifts in the preferred orientation of V1 neurons in response to oriented gratings (Schuett et al., 2001; Fu et al., 2002), and changes in the somatic representation of the limb in M1 (Nudo et al., 1990; Teskey et al., 2007). These changes in both sensory and motor systems reflect an altered mapping between the environment and single neurons. A limitation of these in vivo studies is their reliance on stimulus-evoked postsynaptic activity to detect changes in synaptic efficacy. Here we have shown that induced Hebbian associations can indeed produce robust changes in functional connectivity within recorded neural ensembles that closely resemble STDP in many respects.
There is some question as to what is activated by the extracellular electrical stimulation. It has traditionally been thought that the currents used in this study cause activation throughout an approximate radius of 100 μm (Stoney et al., 1968). However, recent work suggests that extracellular electrical stimulation causes sparse, spatially diffuse patterns of activation (Histed et al., 2009). In either case, the observed preferential potentiation of the targeted connection, as well as its dependence on latency, imply we were able to activate the target neuron reliably with electrical stimulation.
Finally, our sampling of neurons in the cortex may have influenced our results. The trigger and target neurons were chosen for recording quality, and the array was positioned at depth to maximize signal strength. While it is possible that the effects may have been to some extent, dependent on the particular layer in which recordings were made, it is impossible for us to address this question with our data.
Mechanisms for Reciprocal and Non-Targeted Potentiation
The classic STDP curve (Bi and Poo, 1998) would predict that the repetitive activation of the trigger neuron prior to the target neuron would cause depression, not potentiation, of the target-to-trigger connection. Those experiments varied the relative timing between a single pre- and a single postsynaptic spike. When more natural spike trains were used (van Rossum et al., 2000; Sjostrom et al., 2001; Froemke and Dan, 2002), the STDP curve failed to predict the net potentiation. When it is modified to better predict the potentiation resulting from realistic spike trains, the STDP learning rule begins to closely resemble the Bienenstock–Cooper–Munro (BCM) rate-based model of plasticity (Bienenstock et al., 1982; Izhikevich and Desai, 2003; Pfister and Gerstner, 2006). We used a rate-based model that also included the effects of correlations between the spike trains to estimate what sort of reciprocal potentiation or depression our protocol would cause (see “Materials and methods”). With this model, we found the potentiation of the reciprocal (target-to-trigger) connection was consistent in sign with the model predictions.
The use of simultaneous multi-electrode recordings coupled with the IFC algorithm allowed us to monitor neurons not directly involved in the experimental manipulation. Consequently, in addition to the unanticipated potentiation of the target-to-trigger connection, we discovered significant potentiation of many non-targeted connections, provided the target was stimulated at 5-ms latency. The fact that the IFC algorithm correctly identified isolated connectivity changes in simulation suggests that these non-targeted in vivo effects correctly inferred changes beyond that of the trigger-to-target connection. The non-targeted potentiation may have been the result of existing connections from stimulated neurons surrounding the target electrode. These connections could have led to activation of the non-targeted neurons at only slightly longer latencies than the target, still within the window for plasticity, resulting in weaker, but significant potentiation. Remarkably, the magnitude of this non-targeted potentiation was very well predicted by the degree of autocorrelation in the stimulation train, including several experiments in which we artificially reduced this autocorrelation to zero. This finding is also consistent with the rate-based models of in vivo synaptic plasticity described above (Bienenstock et al., 1982; Froemke et al., 2006). Both of these models propose that inputs leading to high levels of postsynaptic firing cause synaptic potentiation, while inputs leading to low levels of postsynaptic firing cause synaptic depression; this empirical statement relates to levels of postsynaptic Ca2+ (Neveu and Zucker, 1996; Yang et al., 1999). Highly autocorrelated stimulation trains will typically produce higher postsynaptic activity than less autocorrelated trains; moreover, electrical stimulation may have the additional effect of extending the timecourse of postsynaptic Ca2+ (Sabatini et al., 2002). Stimulation might result in significant co-modulation of activity in the vicinity of the stimulating electrode, and the autocorrelation of the stimulation may drive potentiation of non-targeted connections. Both of these effects might enhance the potentiation due to multiple, indirect pathways.
Timecourse of Changes in IFC
The observed onset of the potentiation was fairly rapid; changes were typically detected at the first testing point, after only 6 h of stimulation. Highly variable potentiation onsets have been reported in previous studies: effects have been observed after minutes (Ahissar et al., 1998; Fu et al., 2002; Crochet et al., 2006; Jacob et al., 2007) or have taken as long as days to weeks (Trepel and Racine, 1998; Ivanco and Racine, 2000; Werk and Chapman, 2003; Jackson et al., 2006). This range can be attributed to different induction protocols and different mechanisms of activity-dependent potentiation, as well as different experimental preparations. In our experiments, potentiation persisted beyond the end of the stimulation, but the extent of this persistence was also variable. Twenty-four hours after the end of stimulation, there was a mean residual potentiation of 20% of the value inferred at the end of stimulation. The plasticity we induced thus appears to be retained over extended periods of time. The timecourse and scale of persistence for the non-targeted potentiation was similar to that of the target (R2 = 0.84).
Summary and Conclusions
The approach reported here provides more direct access to connectivity changes than that afforded by more traditional stimulus-driven methods. We postulate that the repetitive pairing of a trigger neuron spike with stimulation of the target neuron created the conditions necessary for STDP and led to changes in synaptic weights. These manipulations caused changes in the spontaneous spiking behavior of the network that allowed us to infer the underlying changes in functional connectivity. The fact that these changes were detected and quantified during the animals’ natural behavior indicates that the experimental manipulation resulted in a robust change in the routing of information through the network. We anticipate that the techniques used here for measuring changes in functional connectivity may also be useful for the study of learning and plasticity in more natural, experience-driven environments. Furthermore, rerouting of information processing in the brain through Hebbian stimulation of individual neurons holds real promise for rehabilitation and motor control. The emergent field of brain–machine interfaces has made it possible to control a prosthetic limb or a computer cursor through signals extracted from a small population of neurons. The ability to induce plastic changes in the connectivity of these small networks of recorded neurons is likely to improve control of the device. Furthermore, we anticipate that the artificial potentiation of neural connections may also prove to be a useful tool to augment traditional rehabilitative strategies for motor (Kipke et al., 2008) and cognitive injury (Serruya and Kahana, 2008).
Conflict of Interest Statement
The authors declare that the research was conducted in the absence of any commercial or financial relationships that could be construed as a potential conflict of interest.
Acknowledgments
The authors gratefully acknowledge the contribution of Mr. Luke Jordan, who assisted in many different technical aspects of the experiment. Drs. Mark Laubach and Robert Rennaker provided valuable advice related to implant procedures. Conversations with Drs. Sandro Mussa-Ivaldi and Yang Dan were invaluable for both the experimental design and the interpretation of results. The work was supported in part by a grant from NINDS (R01 NS048845), NIH/NINDS fellowship F31NS062552, and by support from the Searle Foundation through the Chicago Community Trust.
Supplementary Material
The Supplementary Material for this article can be found online at http://www.frontiersin.org/neuroscience/systemsneuroscience/paper/10.3389/fnsys.2010.00039/
References
Abbott, L. F., and Blum, K. I. (1996). Functional significance of long-term potentiation for sequence learning and prediction. Cereb. Cortex 6, 406–416.
Ahissar, E., Abeles, M., Ahissar, M., Haidarliu, S., and Vaadia, E. (1998). Hebbian-like functional plasticity in the auditory cortex of the behaving monkey. Neuropharmacology 37, 633–655.
Baccala, L. A., and Sameshima, K. (2001). “Overcoming the limitations of correlation analysis for many simultaneously processed neural structures,” in Progress in Brain Research, Vol. 130. ed. M. A. Nicolelis (New York: Elsevier), 33–47.
Bi, G., and Poo, M. (2001). Synaptic modification by correlated activity: Hebb’s postulate revisited. Annu. Rev. Neurosci. 24, 139–166.
Bi, G. Q., and Poo, M. M. (1998). Synaptic modifications in cultured hippocampal neurons: dependence on spike timing, synaptic strength, and postsynaptic cell type. J. Neurosci. 18, 10464–10472.
Bienenstock, E. L., Cooper, L. N., and Munro, P. W. (1982). Theory for the development of neuron selectivity: orientation specificity and binocular interaction in visual cortex. J. Neurosci. 2, 32–48.
Bliss, T. V. P., and Collingridge, G. L. (1993). A synaptic model of memory: long-term potentiation in the hippocampus. Nature 361, 31–39.
Bliss, T. V., and Gardner-Medwin, A. R. (1973). Long-lasting potentiation of synaptic transmission in the dentate area of the unanaesthetized rabbit following stimulation of the perforant path. J. Physiol. 232, 357–374.
Braitenberg, V., and Schuz, A. (1998). Cortex: Statistics and Geometry of Neuronal Connectivity. Berlin: Springer.
Buonomano, D. V., and Merzenich, M. M. (1998). Cortical plasticity: from synapses to maps. Annu. Rev. Neurosci. 21, 149–186.
Caporale, N., and Dan, Y. (2008). Spike timing-dependent plasticity: a Hebbian learning rule. Annu. Rev. Neurosci. 31, 25–46.
Carmena, J. M., Lebedev, M. A., Crist, R. E., O’Doherty, J. E., Santucci, D. M., Dimitrov, D., Patil, P. G., Henriquez, C. S., and Nicolelis, M. A. (2003). Learning to control a brain-machine interface for reaching and grasping by primates. PLoS Biol. 1, 193–208.doi:10.1371/journal.pbio.0000042.
Clapp, W. C., Eckert, M. J., Teyler, T. J., and Abraham, W. C. (2006). Rapid visual stimulation induces N-methyl-D-aspartate receptor-dependent sensory long-term potentiation in the rat cortex. Neuroreport 17, 511–515.
Clapp, W. C., Kirk, I. J., Hamm, J. P., Shepherd, D., and Teyler, T. J. (2005). Induction of LTP in the human auditory cortex by sensory stimulation. Eur. J. Neurosci. 22, 1135–1140.
Crochet, S., Fuentealba, P., Cisse, Y., Timofeev, I., and Steriade, M. (2006). Synaptic plasticity in local cortical network in vivo and its modulation by the level of neuronal activity. Cereb. Cortex 16, 618–631.
Engert, F., Tao, H. W., Zhang, L. I., and Poo, M. M. (2002). Moving visual stimuli rapidly induce direction sensitivity of developing tectal neurons. Nature 419, 470–475.
Esser, S. K., Huber, R., Massimini, M., Peterson, M. J., Ferrarelli, F., and Tononi, G. (2006). A direct demonstration of cortical LTP in humans: a combined TMS/EEG study. Brain Res. Bull. 69, 86–94.
Fagg, A. H., Hatsopoulos, N. G., de Lafuente, V., Moxon, K. A., Nemati, S., Rebesco, J. M., Romo, R., Solla, S. A., Reimer, J., Tkach, D., Pohlmeyer, E. A., and Miller, L. E. (2007). Biomimetic brain machine interfaces for the control of movement. J. Neurosci. 27, 11842–11846.
Froemke, R. C., and Dan, Y. (2002). Spike-timing-dependent synaptic modification induced by natural spike trains. Nature 416, 433–438.
Froemke, R. C., Tsay, I. A., Raad, M., Long, J. D., and Dan, Y. (2006). Contribution of individual spikes in burst-induced long-term synaptic modification. J. Neurophysiol. 95, 1620–1629.
Fu, Y. X., Djupsund, K., Gao, H., Hayden, B., Shen, K., and Dan, Y. (2002). Temporal specificity in the cortical plasticity of visual space representation. Science 296, 1999–2003.
Heynen, A. J., and Bear, M. F. (2001). Long-term potentiation of thalamocortical transmission in the adult visual cortex in vivo. J. Neurosci. 21, 9801–9813.
Histed, M. H., Bonin, V., and Reid, R. C. (2009). Direct activation of sparse, distributed populations of cortical neurons by electrical microstimulation. Neuron 63, 508–522.
Hochberg, L. R., Serruya, M. D., Friehs, G. M., Mukand, J. A., Saleh, M., Caplan, A. H., Branner, A., Chen, D., Penn, R. D., and Donoghue, J. P. (2006). Neuronal ensemble control of prosthetic devices by a human with tetraplegia. Nature 442, 164–171.
Huber, R., Ghilardi, M. F., Massimini, M., Ferrarelli, F., Riedner, B. A., Peterson, M. J., and Tononi, G. (2006). Arm immobilization causes cortical plastic changes and locally decreases sleep slow wave activity. Nat. Neurosci. 9, 1169–1176.
Ivanco, T. L., and Racine, R. J. (2000). Long-term potentiation in the reciprocal corticohippocampal and corticocortico pathways in the chronically implanted, freely moving rat. Hippocampus 10, 143–152.
Izhikevich, E. M. (2004). Which model to use for cortical spiking neurons? IEEE Trans. Neural Netw. 15, 1063–1070.
Jackson, A., Mavoori, J., and Fetz, E. E. (2006). Long-term motor cortex plasticity induced by an electronic neural implant. Nature 444, 56–60.
Jacob, V., Brasier, D. J., Erchova, I., Feldman, D., and Shulz, D. E. (2007). Spike timing-dependent synaptic depression in the in vivo barrel cortex of the rat. J. Neurosci. 27, 1271–1284.
Kipke, D. R., Shain, W., Buzsaki, G., Fetz, E., Henderson, J. M., Hetke, J. F., and Schalk, G. (2008). Advanced neurotechnologies for chronic neural interfaces: new horizons and clinical opportunities. J. Neurosci. 28, 11830–11838.
Markram, H., Lubke, J., Frotscher, M., and Sakmann, B. (1997). Regulation of synaptic efficacy by coincidence of postsynaptic APs and EPSPs. Science 275, 213–215.
Neveu, D., and Zucker, R. S. (1996). Postsynaptic levels of [Ca2+]i needed to trigger LTD and LTP. Neuron 16, 619–629.
Nudo, R. J., Jenkins, W. M., and Merzenich, M. M. (1990). Repetitive microstimulation alters the cortical representation of movements in adult rats. Somatosens. Mot. Res. 7, 463–483.
Nykamp, D. Q. (2005). Revealing pairwise coupling in linear-nonlinear networks. SIAM J. Appl. Math. 65, 2005–2032.
Okatan, M., Wilson, M. A., and Brown, E. N. (2005). Analyzing functional connectivity using a network likelihood model of ensemble neural spiking activity. Neural. Comput. 17, 1927–1961.
Paninski, L. (2004). Maximum likelihood estimation of cascade point-process neural encoding models. Netw. Comput. Neural Syst. 15, 243–262.
Pfister, J.-P., and Gerstner, W. (2006). Triplets of spikes in a model of spike timing-dependent plasticity. J. Neurosci. 26, 9673–9682.
Pillow, J. W., Shlens, J., Paninski, L., Sher, A., Litke, A. M., Chichilnisky, E. J., and Simoncelli, E. P. (2008). Spatio-temporal correlations and visual signalling in a complete neuronal population. Nature 454, 995–999.
Racine, R., Chapman, C., Trepel, C., Teskey, G., and Milgram, N. (1995). Post-activation potentiation in the neocortex. IV. Multiple sessions required for induction of long-term potentiation in the chronic preparation. Brain Res. 702, 87–93.
Rigat, F., de Gunst, M., and van Pelt, J. (2006). Bayesian modeling and analysis of spatio-temporal neuronal networks. Bayesian Anal. 1, 733–764.
Sabatini, B. L., Oertner, T. G., and Svoboda, K. (2002). The life cycle of Ca2+ ions in dendritic spines. Neuron 33, 439–452.
Schuett, S., Bonhoeffer, T., and Hubener, M. (2001). Pairing-induced changes of orientation maps in cat visual cortex. Neuron 32, 325–337.
Serruya, M. D., and Kahana, M. J. (2008). Techniques and devices to restore cognition. Behav. Brain Res. 192, 149–165.
Sjostrom, P. J., Turrigiano, G. G., and Nelson, S. B. (2001). Rate, timing, and cooperativity jointly determine cortical synaptic plasticity. Neuron 32, 1149–1164.
Stevenson, I. H., Rebesco, J. M., Hatsopoulos, N. G., Haga, Z., Miller, L. E., and Kording, K. P. (2009). Bayesian inference of functional connectivity and network structure from spikes. IEEE Trans. Neural Syst. Rehabil. Eng. 17, 203–213.
Stevenson, I. H., Rebesco, J. M., Miller, L. E., and Kording, K. P. (2008). Inferring functional connections between neurons. Curr. Opin. Neurobiol. 18, 582–588.
Stoney, S. D., Jr., Thompson, W. D., and Asanuma, H. (1968). Excitation of pyramidal tract cells by intracortical microstimulation: effective extent of stimulating current. J. Neurophysiol. 31, 659–669.
Teskey, G. C., Young, N. A., van Rooyen, F., Larson, S. E. M., Flynn, C., Monfils, M.-H., Kleim, J. A., Henry, L. C., and Goertzen, C. D. (2007). Induction of neocortical long-term depression results in smaller movement representations, fewer excitatory perforated synapses, and more inhibitory synapses. Cereb. Cortex 17, 434–442.
Tolias, A. S., Ecker, A. S., Siapas, A. G., Hoenselaar, A., Keliris, G. A., and Logothetis, N. K. (2007). Recording chronically from the same neurons in awake, behaving primates. J. Neurophysiol. 98, 3780–3790.
Trepel, C., and Racine, R. J. (1998). Long-term potentiation in the neocortex of the adult, freely moving rat. Cereb. Cortex 8, 719–729.
Truccolo, W., Eden, U. T., Fellows, M. R., Donoghue, J. P., and Brown, E. N. (2005). A point process framework for relating neural spiking activity to spiking history, neural ensemble, and extrinsic covariate effects. J. Neurophysiol. 93, 1074–1089.
van Rossum, M. C. W., Bi, G. Q., and Turrigiano, G. G. (2000). Stable Hebbian learning from spike timing-dependent plasticity. J. Neurosci. 20, 8812–8821.
Velliste, M., Perel, S., Spalding, M. C., Whitford, A. S., and Schwartz, A. B. (2008). Cortical control of a prosthetic arm for self-feeding. Nature 453, 1098–1101.
Werk, C. M., and Chapman, C. A. (2003). Long-term potentiation of polysynaptic responses in layer V of the sensorimotor cortex induced by theta-patterned tetanization in the awake rat. Cereb. Cortex 13, 500–507.
Yang, S.-N., Tang, Y.-G., and Zucker, R. S. (1999). Selective induction of LTP and LTD by postsynaptic [Ca2+]i elevation. J. Neurophysiol. 81, 781–787.
Yao, H., and Dan, Y. (2001). Stimulus timing-dependent plasticity in cortical processing of orientation. Neuron 32, 315–323.
Yuste, R., and Denk, W. (1995). Dendritic spines as basic functional units of neuronal integration. Nature 375, 682–684.
Keywords: brain machine interface, functional connectivity, hebbian association, plasticity, rat, sensorimotor cortex
Citation: Rebesco JM, Stevenson IH, Körding KP, Solla SA and Miller LE (2010) Rewiring neural interactions by micro-stimulation. Front. Syst. Neurosci. 4:39. doi: 10.3389/fnsys.2010.00039
Received: 27 February 2010;
Paper pending published: 02 May 2010;
Accepted: 21 July 2010;
Published online: 23 August 2010
Edited by:
Reza Shadmehr, Johns Hopkins School of Medicine, USAReviewed by:
Paul Cisek, University of Montreal, CanadaOpher Donchin, Ben-Gurion University of the Negev, Israel
Copyright: © 2010 Rebesco, Stevenson, Kördinag, Solla and Miller. This is an open-access article subject to an exclusive license agreement between the authors and the Frontiers Research Foundation, which permits unrestricted use, distribution, and reproduction in any medium, provided the original authors and source are credited.
*Correspondence: Lee E. Miller, Department of Physiology, Feinberg School of Medicine, Northwestern University, 303 East Chicago Avenue, Chicago, IL 60611, USA. e-mail: lm@northwestern.edu