Whole brain resting-state analysis reveals decreased functional connectivity in major depression
- 1 Leiden Institute for Brain and Cognition, Leiden, Netherlands
- 2 Department of Radiology, Leiden University Medical Center, Leiden, Netherlands
- 3 Institute of Psychology, Leiden University, Leiden, Netherlands
- 4 Oxford Centre for Functional Magnetic Resonance Imaging of the Brain, University of Oxford, Oxford, UK
- 5 Department of Clinical Neuroscience, Imperial College London, London, UK
- 6 Department of Psychiatry, Leiden University Medical Center, Leiden, Netherlands
- 7 Department of Radiology, Division of Image Processing, Leiden University Medical Center, Leiden, Netherlands
- 8 Department of Psychiatry, VU Medical Center, Amsterdam, Netherlands
- 9 BCN NeuroImaging Center, University of Groningen, Groningen, Netherlands
Recently, both increases and decreases in resting-state functional connectivity have been found in major depression. However, these studies only assessed functional connectivity within a specific network or between a few regions of interest, while comorbidity and use of medication was not always controlled for. Therefore, the aim of the current study was to investigate whole-brain functional connectivity, unbiased by a priori definition of regions or networks of interest, in medication-free depressive patients without comorbidity. We analyzed resting-state fMRI data of 19 medication-free patients with a recent diagnosis of major depression (within 6 months before inclusion) and no comorbidity, and 19 age- and gender-matched controls. Independent component analysis was employed on the concatenated data sets of all participants. Thirteen functionally relevant networks were identified, describing the entire study sample. Next, individual representations of the networks were created using a dual regression method. Statistical inference was subsequently done on these spatial maps using voxel-wise permutation tests. Abnormal functional connectivity was found within three resting-state networks in depression: (1) decreased bilateral amygdala and left anterior insula connectivity in an affective network, (2) reduced connectivity of the left frontal pole in a network associated with attention and working memory, and (3) decreased bilateral lingual gyrus connectivity within ventromedial visual regions. None of these effects were associated with symptom severity or gray matter density. We found abnormal resting-state functional connectivity not previously associated with major depression, which might relate to abnormal affect regulation and mild cognitive deficits, both associated with the symptomatology of the disorder.
Introduction
Patients suffering from a major depressive episode typically show pervasive depressed mood or anhedonia, accompanied by several cognitive and physical symptoms (American Psychiatric Association, 1994). The apparent heterogeneity in depressive symptom domains (i.e., mood, cognition, motor, and vegetative) is unlikely to be explained by the (functional) breakdown of a single brain area (Davidson et al., 2002). It has thus been proposed that depressive symptoms are associated with dysregulation of a brain network encompassing large parts of the prefrontal cortex (PFC), limbic areas, and subcortical structures (Mayberg, 1997, 2003; Drevets et al., 2008).
Based on data from blood flow and glucose metabolism SPECT and PET studies, and more recently task-related functional MRI (fMRI) studies, current models for depression postulate that ventral and dorsal subsystems of this brain network are differentially affected in this disease (Mayberg, 2003; Drevets et al., 2008). An imbalanced functional integration of these subsystems may lead to a heightened response to negative information in ventral regions (bottom–up) on the one hand and a failure to regulate this response through dorsal regions (top–down) on the other (Phillips et al., 2003). For example, engagement of lateral PFC regions has been linked to efficient top–down regulation of affective responses (Dolcos et al., 2006; Pessoa, 2008), a mechanism that has been shown to fail in patients suffering depression (Johnstone et al., 2007).
Over the last decade, studying such functional interactions between brain regions or systems has become increasingly important for understanding the dynamic interactions between neural systems in both health and disease (Stephan et al., 2008). In depression, several studies have shown abnormal functional connectivity (FC) during both cognitive and emotional task paradigms (Urry et al., 2006; Johnstone et al., 2007; Chen et al., 2008; Matthews et al., 2008), which have already provided valuable insights on how dysfunctional interactions between brain regions may relate to abnormal behavioral response patterns in depressed patients. However, it might also be beneficial to explore whether these connections are compromised in the absence of goal-directed (i.e., task-induced) behavior. For example, resting-state (RS; i.e., without external task demands) FC may be able to predict how the brain responds to an externally cued task (Mennes et al., 2010). Studies employing RS-FC have shown to be successful in mapping large-scale connectivity patterns in the brain (Biswal et al., 1995; Lowe et al., 1998; Fox and Raichle, 2007). In addition, these so-called resting-state networks (RSNs) are found consistently across participants and over time (Damoiseaux et al., 2006; Shehzad et al., 2009) and show a remarkable overlap with patterns of task-induced activity (Smith et al., 2009).
RS-fMRI studies in major depression have recently reported on altered FC in several areas within the proposed network model of depression (Mayberg, 1997; Drevets et al., 2008). Decreased connectivity of the dorsal anterior cingulate cortex (ACC) with the medial thalamus and left pallidostriatum was found in patients suffering from depression, and a trend for decreased connectivity between the ACC and the amygdala (Anand et al., 2005a,b). In another study, depressive patients were found to show increased connectivity of the subgenual ACC (cg25) and the thalamus within the default mode network (DMN) (Greicius et al., 2007), a canonical RSN (Raichle et al., 2001; Greicius et al., 2003). This finding was partially confirmed by a recent study showing unique cg25, but not thalamic, connectivity within the DMN in the depression group (Zhou et al., 2009). It must be noted, however, that for this effect only qualitative comparisons were carried out between the groups. Additionally, these researchers found increased intra-network connectivity in depression between regions of the DMN, and within the task positive network (TPN), which is associated with attention and working memory (Fox et al., 2005), together with increased anticorrelations between regions of the two networks (Zhou et al., 2009). A last study did not show any FC differences between major depressive disorder (MDD) patients and controls using conventional statistics (Craddock et al., 2009). However, the authors were able to discriminate between patients and controls using support vector classification. In addition to the altered FC found in several task-related fMRI studies, these RS findings further support the idea of dysfunctional interactions as a core feature of depressive symptomatology.
To date, RS-fMRI studies focusing on depression examined connectivity in a limited number of predefined regions or networks of interest, thereby not fully exploring the data as acquired with RS-fMRI. That is, recent studies have identified several other networks of simultaneously oscillating brain regions (Beckmann et al., 2005; Damoiseaux et al., 2006), which may represent multiple functional domains. Furthermore, in some of the studies in MDD, comorbidity and use of medication could not be ruled out as potential confounders.
The aim of the present study was to investigate FC patterns using RS-fMRI in medication-free patients with MDD without comorbidity, and carefully matched healthy controls. Rather than focusing on predefined regions or networks of interest, we adopted an inclusive (exploratory) approach by investigating whole-brain RS-fMRI FC at the network level, ensuring the optimal use of the wealth of information present in the data. Based on the current neurobiological models for depression and the RS studies described above, we expected that altered connectivity would be observed in those RSNs that include areas known to be associated with affective (including ventral prefrontal cortex and limbic areas) and more cognitive (including lateral prefrontal and parietal areas) processing, as well as RSNs that show cortico–striatal connectivity.
Materials and Methods
Participants
Participants were selected from the MRI study of the large-scale longitudinal multi-center Netherlands Study on Depression and Anxiety (NESDA)1 (Penninx et al., 2008), which is designed to examine the long-term course and consequences of depression and anxiety disorders. Participants were recruited through general practitioners, primary care and specialized mental care institutions. For the current study, all participants were required to be fluent in Dutch and right-handed. Patients were included when they met the following criteria: (1) a recent diagnosis (i.e., within 6 months before inclusion) of MDD as indexed by the fourth edition of the diagnostic and statistical manual of mental disorders (DSM-IV) (American Psychiatric Association, 1994) based on the Composite Interview Diagnostic Instrument (CIDI; lifetime version 2.1), administered by a trained clinical interviewer, (2) no current comorbidity with other DSM-IV axis-1 disorders, and (3) no use of psychotropic medication. Exclusion criterion for controls was a history of any DSM-IV axis-1 disorder based on the CIDI. Axis-2 disorders were not assessed in this study. Exclusion criteria for all participants were: (1) daily use of medication or other substances known to affect the central nervous system; (2) the presence or history of major internal or neurological disorders; (3) history of dependency on or recent abuse of alcohol and/or drugs (i.e., in the past year) as diagnosed with the CIDI; (4) hypertension; (5) general MRI-contraindications. None of the included patients underwent treatment for depression.
For the present study, imaging data were available from 23 MDD patients who fulfilled the aforementioned criteria. Two patients were removed from the sample due to excessive head motion during scan acquisition (>3 mm in any of the acquired volumes). Two other patients were removed because no proper age-matched healthy control (HC) was available. For each of the remaining 19 MDD patients, we included in a pair-wise fashion an age- and sex-matched healthy control subject, although education was higher in controls (see Table 1). The mean Montgomery–Asberg depression rating scale (MADRS) (Montgomery and Asberg, 1979) symptom severity score for the MDD group was 14.21, SD 9.62, with five participants considered to be in remission (MADRS score <10) at the time of the imaging study. Written informed consent was obtained from all participants and none received compensation except for reimbursement of travel expenses. The study was approved by the Central Ethics Committees of the three participating medical centers (i.e., Leiden University Medical Center [LUMC], Amsterdam Medical Center [AMC], and University Medical Center Groningen [UMCG]).
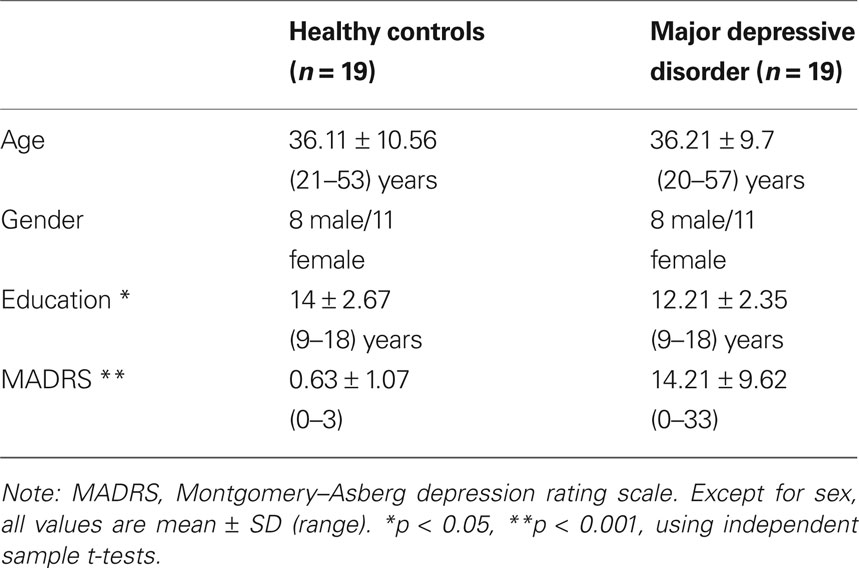
Table 1. Demographic and clinical characteristics for the study sample.
Data Acquisition
Participants were scanned at one of the three participating centers within 8 weeks after completion of NESDA baseline interview (Penninx et al., 2008). RS-fMRI data were acquired at the end of the fixed imaging protocol: after completion of three task-related functional MRI runs (to be reported elsewhere) and the acquisition of an anatomical scan (scan sequence: Tower of London, word encoding, T1-weighted scan, word recognition, perception of facial expression). In the darkened MR room participants were instructed to lie still with their eyes closed and not to fall asleep. Compliance to these instructions was verified as part of the exit interview.
Imaging data were acquired on a Philips 3.0-T Achieva MRI scanner using a six- (Amsterdam) or eight-channel (Groningen and Leiden) SENSE head coil (Philips Medical Systems, Best, The Netherlands). RS-fMRI data were acquired using T2*-weighted gradient-echo echo-planar imaging with the following scan parameters in Amsterdam and Leiden: 200 whole-brain volumes; repetition time (TR) = 2300 ms; echo time (TE) = 30 ms; flip angle = 80º; 35 axial slices; no slice gap; FOV = 220 × 220 mm; in plane voxel resolution = 2.3 mm × 2.3 mm; slice thickness = 3 mm; same in Groningen, except: TE = 28 ms; 39 axial slices; in plane voxel resolution = 3.45 mm × 3.45 mm. For registration purposes and analysis of gray matter density, a high resolution T1-weighted image was acquired with the following scan parameters: repetition time (TR) = 9 ms; echo time (TE) = 3.5 ms; flip angle = 8º; 170 sagittal slices; no slice gap; FOV = 256 × 256 mm; in plane voxel resolution = 1 mm × 1 mm; slice thickness = 1 mm.
Data preprocessing
The preprocessing of RS-fMRI images was carried out using FEAT (FMRI Expert Analysis Tool) Version 5.90, part of FSL (FMRIB’s Software Library2) (Smith et al., 2004). The following processing steps were applied: motion correction (Jenkinson et al., 2002), removal of non-brain tissue (Smith, 2002), spatial smoothing using a Gaussian kernel of 4-mm full width at half maximum, grand-mean intensity normalization of the entire 4D dataset by a single multiplicative factor, high-pass temporal filtering (Gaussian-weighted least-squares straight line fitting, with sigma = 50 s; 0.01 Hz cut-off) and registration to the high resolution T1 and MNI-152 standard space (T1 standard brain averaged over 152 subjects; Montreal Neurological Institute, Montreal, QC, Canada) images (Jenkinson and Smith, 2001; Jenkinson et al., 2002). Normalized 4D data sets were subsequently resampled to 4-mm isotropic voxels to reduce computational burden in the following analysis steps.
Extracting Resting-State Networks
Standard group independent component analysis (ICA) was carried out using probabilistic ICA (PICA) (Beckmann and Smith, 2004) as implemented in FSL’s Multivariate Exploratory Linear Decomposition into Independent Components (MELODIC) Version 3.09. Default group PICA processing steps were applied to the individual preprocessed and normalized data sets: masking out non-brain voxels, voxel-wise de-meaning of the data, and normalization of the voxel-wise variance based on all data sets. Subsequently, data sets from both MDD patients and HCs were concatenated in time to create a single 4D data set, which was then projected into a 20-dimensional subspace using principal component analysis. Next, the data set was decomposed into 20 sets of independent vectors which describe signal variation across the temporal (time-courses) and spatial (maps) domain by optimizing for non-Gaussian spatial source distributions using the FastICA algorithm (Hyvarinen, 1999). At this model order selection, it has been shown that most of the frequently observed large-scale RSNs can be discerned in the data when using this method (Abou-Elseoud et al., 2010). The resulting estimated component maps were divided by the standard deviation of the residual noise and thresholded at a posterior probability threshold of p > 0.5 (i.e., an equal loss is placed on false positives and false negatives) by fitting a Gaussian/Gamma mixture model to the histogram of intensity values (Beckmann and Smith, 2004).
Statistical Analyses
Subject specific statistical maps were created to test for differences between the MDD and HC groups in the identified components. This was done adopting a dual regression procedure (as previously described in: Filippini et al., 2009). In short, multiple linear regression of the z-thresholded Group PICA maps against the preprocessed individual 4D resampled data sets yielded a subject specific time course for each component separately. Next, multiple linear regression of these time courses was carried out against the pre-processed individual 4D data sets in the standard space resolution (i.e., 2 mm), thereby providing better spatial specificity. This resulted in subject specific z-maps for each of the 20 components.
Prior to statistical inference 13 out of the 20 components were identified as anatomically and functionally relevant RSNs upon visual inspection, the seven others reflecting distinct artifacts resulting from head motion, fluctuations in cerebrospinal fluid, and physiological or scanner noise. Criteria for inclusion were: signal within the low frequency range of 0.1–0.01 Hz (Lowe et al., 1998; Cordes et al., 2001), connectivity patterns were mainly located in gray matter, and presence of coherent clusters of voxels (De Martino et al., 2007). Inference was carried out only on the subject specific z-maps of the 13 relevant RSNs. Statistical difference was assessed non-parametrically using FSL’s Randomize tool, Version 2.1, incorporating threshold-free cluster enhancement (TFCE) (Smith and Nichols, 2009). Besides modeling regressors for each of the two groups, additional nuisance regressors describing scanner location and age were added to the model. Separate null distributions of t-values were derived for the contrasts reflecting the between and within group effects by performing 5000 random permutations and testing the difference between groups or against zero for each iteration (Nichols and Holmes, 2002). For each RSN, the resulting statistical maps were thresholded at p ≤ 0.05 (TFCE-corrected for family-wise errors) for the group main effects. Between-group effects were thresholded controlling the local false discovery rate (FDR) (Efron, 2004; Filippini et al., 2009) at q ≤ 0.01 and subsequently spatially masked with a binary representation of the conjunction of the group main effects images. Note that we applied a more stringent FDR threshold than the more generally accepted q ≤ 0.05, together with masking for the group main effects, to decrease susceptibility to type 1 errors when testing multiple RSNs.
Gray Matter Morphology
Major depressive disorder-related gray matter (GM) abnormalities have been found previously in several regions of the brain, although not always consistently (Sheline, 2003; Lorenzetti et al., 2009). To test whether altered FC in the present study might be explained by MRI-detectable loss of gray matter, a VBM style analysis was run on the acquired high resolution T1-weighted data sets (Ashburner and Friston, 2000; Good et al., 2001). Using FSL’s VBM toolbox, all structural images were first brain extracted, then tissue-type segmented, normalized to MNI-152 standard space and non-linearly registered to each other (e.g., Douaud et al., 2007). Next, standard space binary masks were created from the voxels that covered each RSN (conjunction of the FWE-corrected HC > 0 and MDD > 0 contrast maps) as well as from voxels showing differences between the two groups within the separate networks (local FDR controlled HC > MDD and MDD > HC contrast maps). The binary masks were then used to extract mean gray matter intensity scores within these masks for each of the participants. To rule out the influence of any subtle GM density variations, we included the GM values, from both the difference masks and the RSN as a whole, as regressors in the statistical model (see, e.g., Damoiseaux et al., 2008). Additionally, between-group t-tests were carried out on the participants’ mean intensity scores derived from each mask using SPSS Version 16.0 (SPSS Inc., Chicago, IL, USA) to test whether the two groups differed in GM density on average. Note that whole brain VBM results of a large sample (including MDD) from the NESDA study will be reported elsewhere.
Results
Resting-State Functional Connectivity
Thirteen functionally relevant RSNs were found using the group PICA analysis (Figure 1). Most of these networks have been described in previous studies using similar methodology and were shown to be stable across participants and over time (Beckmann et al., 2005; Damoiseaux et al., 2006). The assemblies of brain areas shown in these networks covered the primary [1], lateral [2] and medial visual cortex [3], sensory-motor cortex [4], ventral stream [8] auditory cortex [12], the hippocampus–amygdala complex [9], precuneus [7] together with the DMN [13], a network associated with salience processing (Seeley et al., 2007) [10], and networks encompassing areas associated with higher order cognition such as attention [11] and working memory [5, 6].
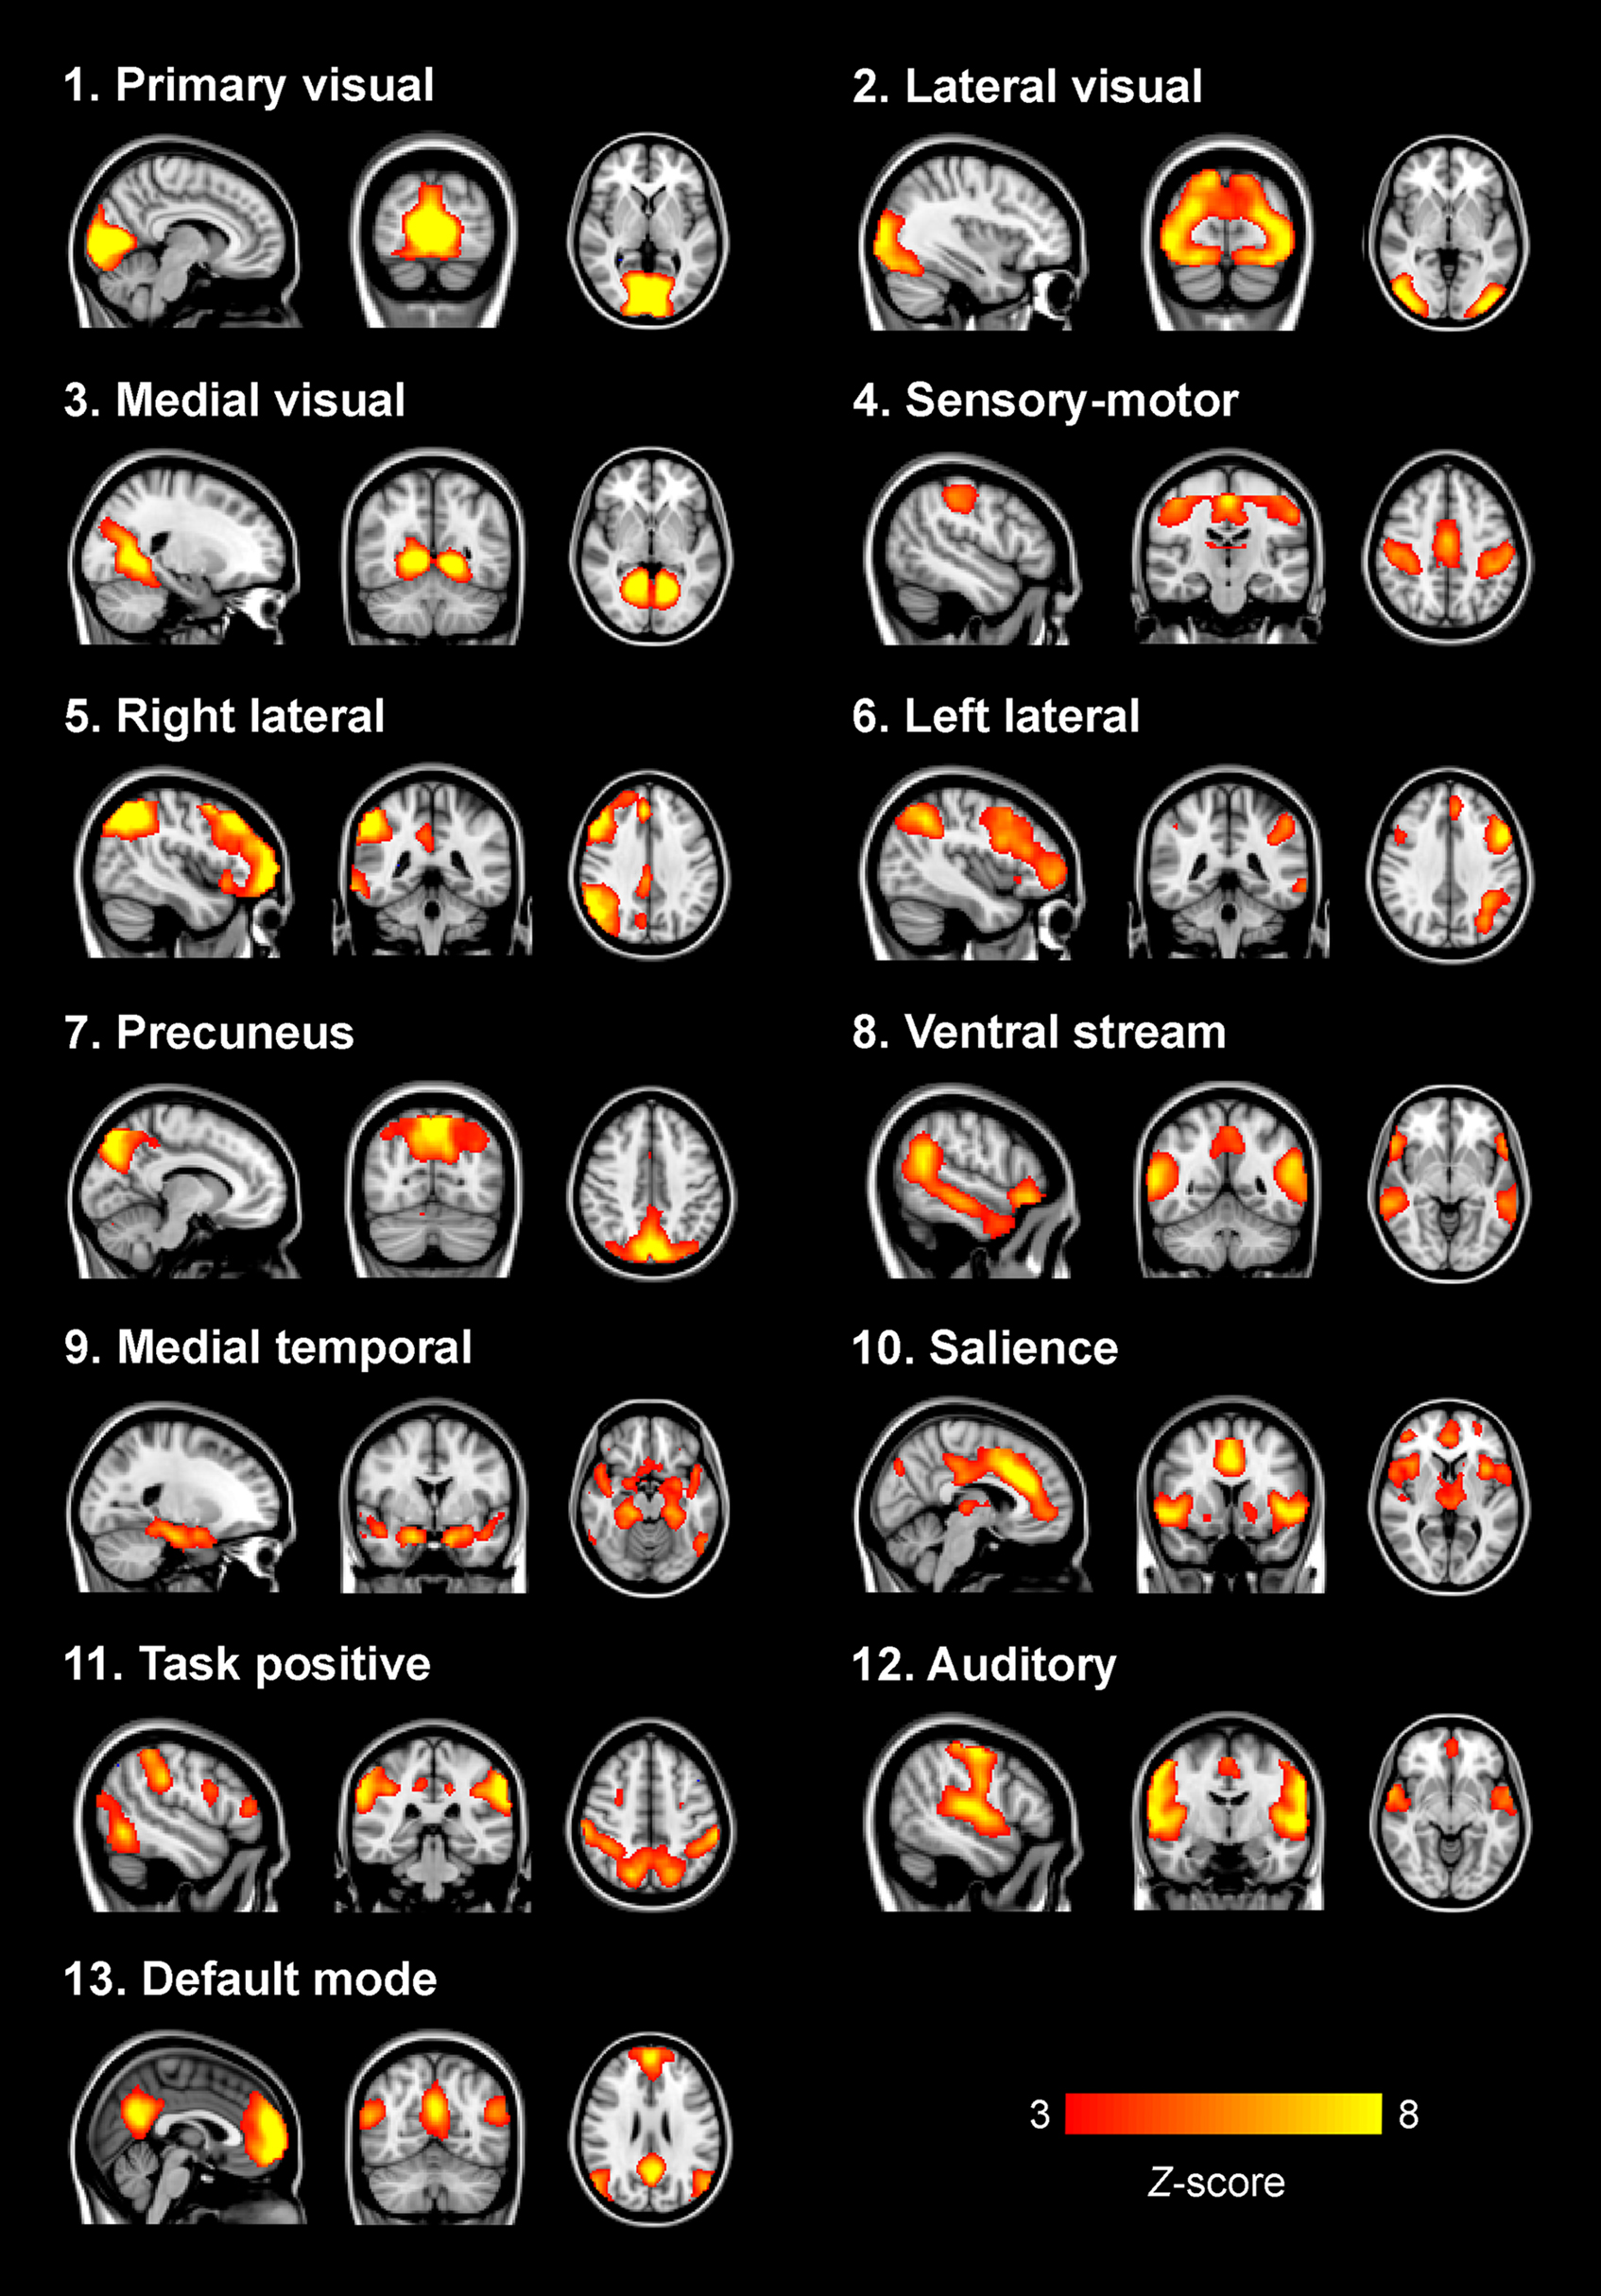
Figure 1. Group ICA functionally relevant resting-state networks. Depicted here are the 13 functionally relevant RSNs resulting from the group PICA step carried out on the concatenated data sets from both patients and controls. Most networks have previously been described (for example in: Beckmann et al., 2005; Damoiseaux et al., 2006) and show assemblies of regions associated with sensory processing, affective processing, and higher order cognitive processes. Images are z-statistics, ranging from 3 to 8, overlaid on the MNI-152 standard brain. The left hemisphere of the brain corresponds to the right side in this image.
The presence of all 13 networks found with PICA was confirmed in both the HC and MDD group by testing the main effects of group on the subject specific z-maps of these networks (all p ≤ 0.05, TFCE and FWE-corrected). Between-group differences in the voxel-wise spatial distribution of the FC maps were subsequently revealed in three networks (local FDR-corrected at q ≤ 0.01) (see Figure 2 and Tables 2–4). Within these networks nearly all differences indicated decreased FC in the MDD group. The first network showed an assembly of functionally connected regions in the auditory cortex (Heschl’s gyrus) bilaterally, extending into the pre- and postcentral gyri, as well as more ventral areas known to be involved in affective processing, including the insula and temporal poles bilaterally, the medial PFC (BA 10) and bilateral amygdala. Whereas the amygdala and left insula showed connectivity with the rest of the network in HCs, these regions showed decreased FC in the depressed group. In addition, increased FC in the MDD group was found in the right inferior frontal gyrus (IFG) within this RSN (Figures 2A,B, RSN 12). The second network mainly showed FC within the lateral parietal cortex, temporal–occipital junction, and precentral gyrus, which are areas involved in attention and working memory. In addition, the frontal poles were found to be negatively associated with the time course of this network. Reduced FC of the left frontal pole was demonstrated in the MDD group (Figures 2A,B, RSN 11). The third network showed functionally integrated areas within the medial occipital cortex, mostly covering Brodmann area 19, involved in visual processing. Although both controls and depressed participants demonstrated this connectivity pattern, a consistent decrease in functional integration of the lingual gyrus was found bilaterally in the MDD group in this RSN (Figures 2A,B, RSN 3).
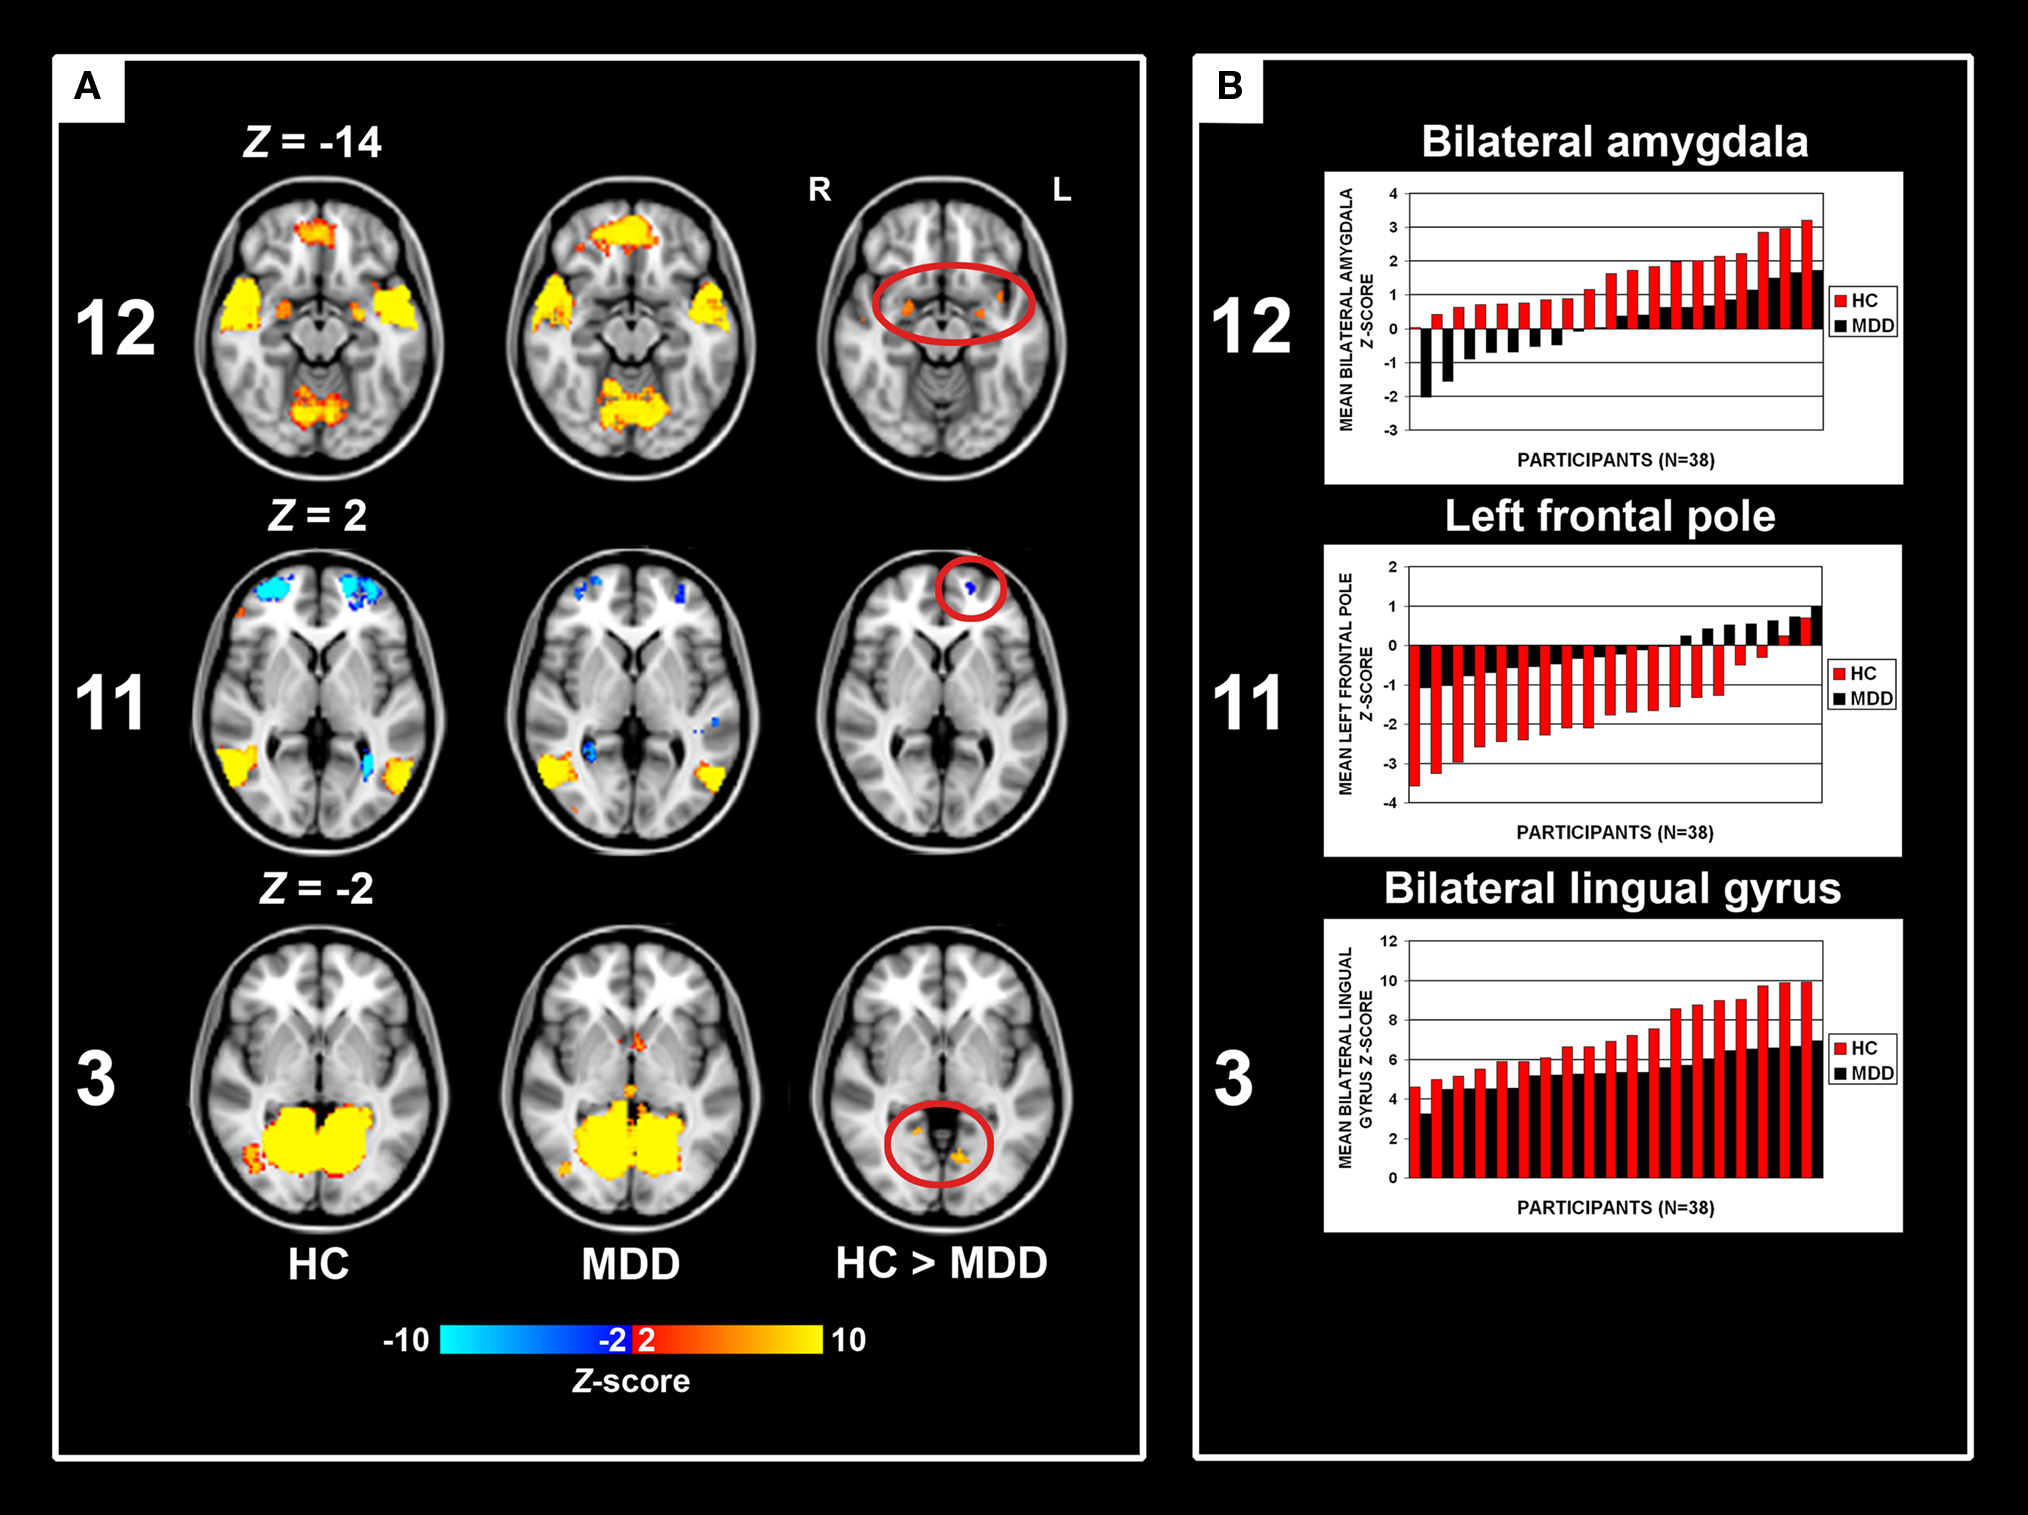
Figure 2. Group main effects and between-group effects. Numbering corresponds to the networks depicted in Figure 1. (A) Depicted here are the group main and between-group effects for three RSNs. Group main effects are corrected for family-wise errors (p < 0.05) and between-group effects are corrected according to a local false discovery rate of 1%. RSN 12 shows an assembly of ventral affective regions, such as temporal poles, insula, medial prefrontal cortex, and amygdala, the latter two regions demonstrating decreased connectivity within the MDD group. RSN 11 shows brain regions linked to attention, of which the left frontal pole shows decreased connectivity in the MDD group. RSN 3 shows MDD-related decreased connectivity of the bilateral lingual gyrus with other medial visual areas. Images are z-statistics, ranging from 2 to 10, overlaid on the MNI-152 standard brain. The left hemisphere of the brain corresponds to the right side in this image. HC, healthy controls; MDD, major depressive disorder. (B) Distribution of the mean individual z-scores within the bilateral amygdala (12), left frontal pole (11), and bilateral lingual gyrus (3). Depicted in red are the controls, in black the MDD group, both sorted from smallest to highest z-value.
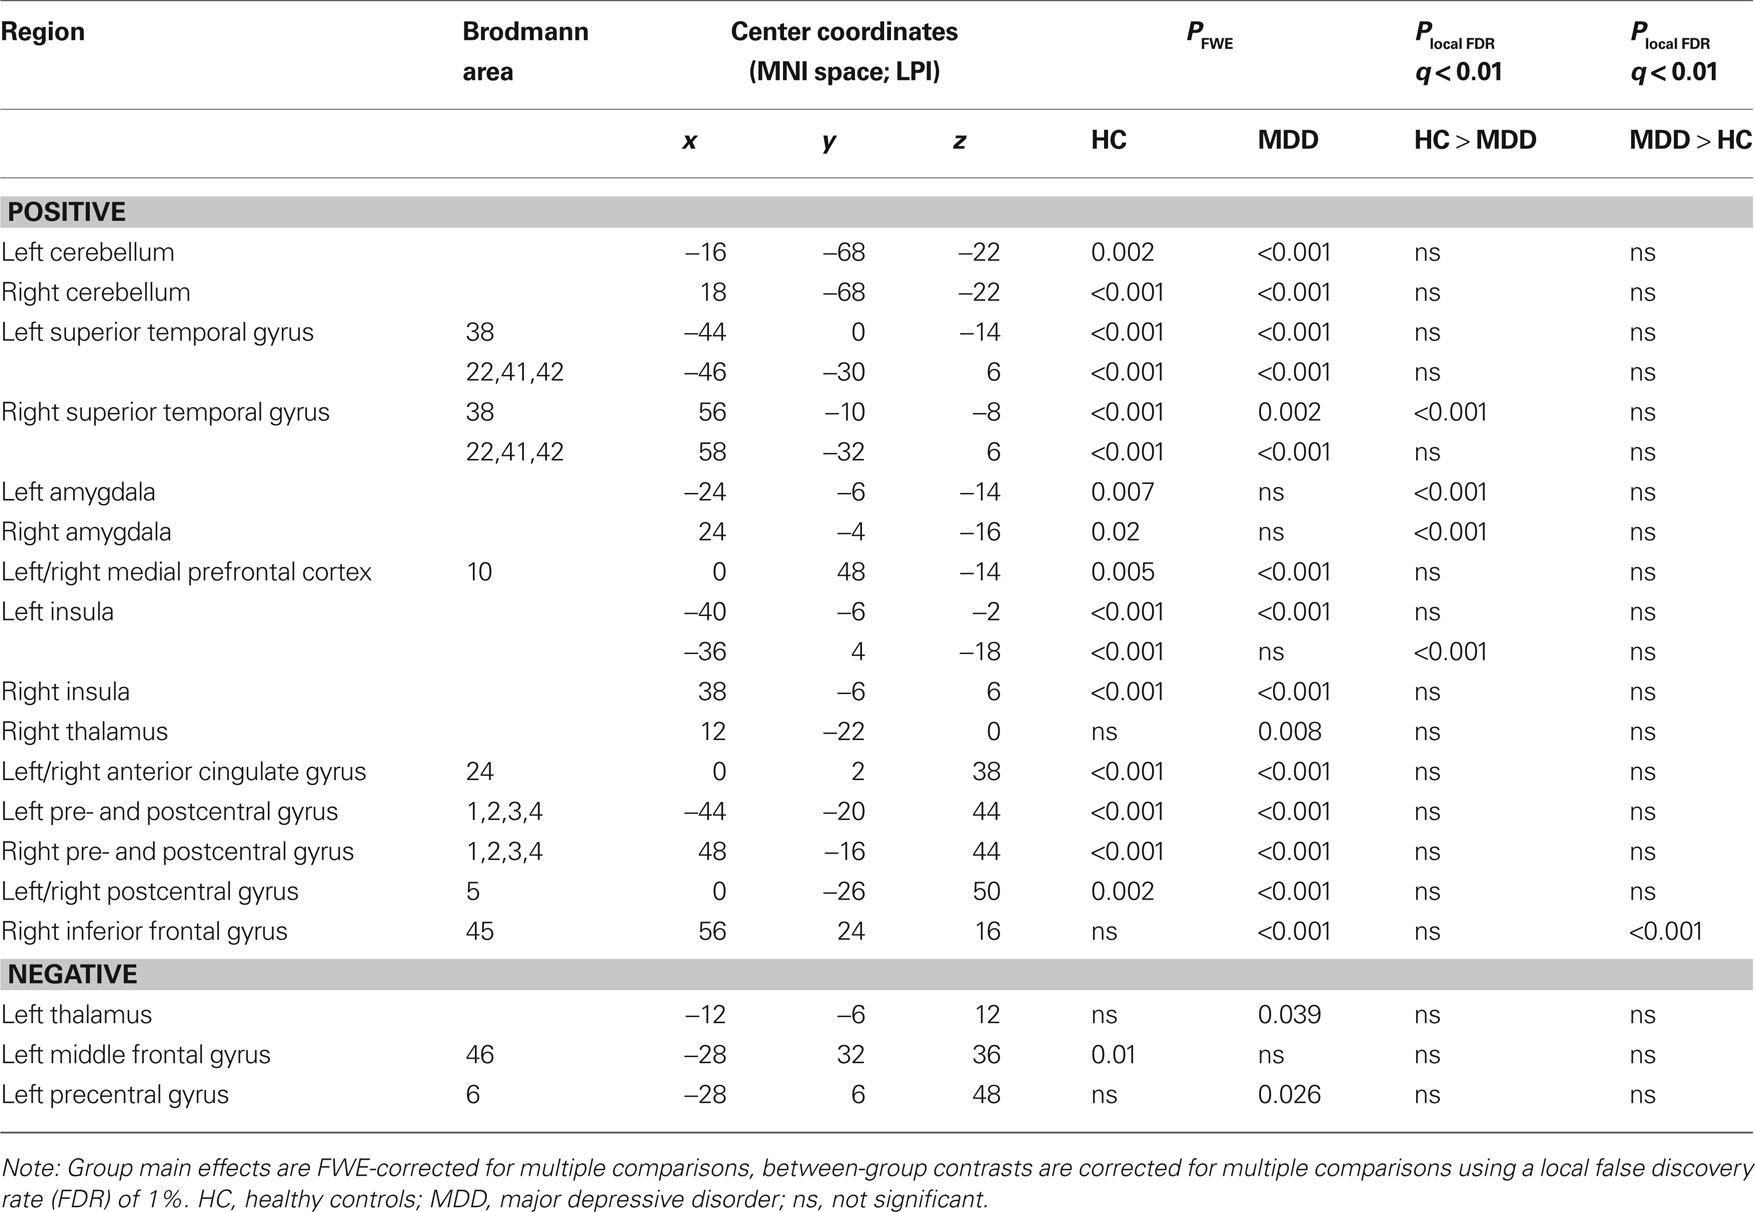
Table 2. RSN 12 characteristics and statistics.
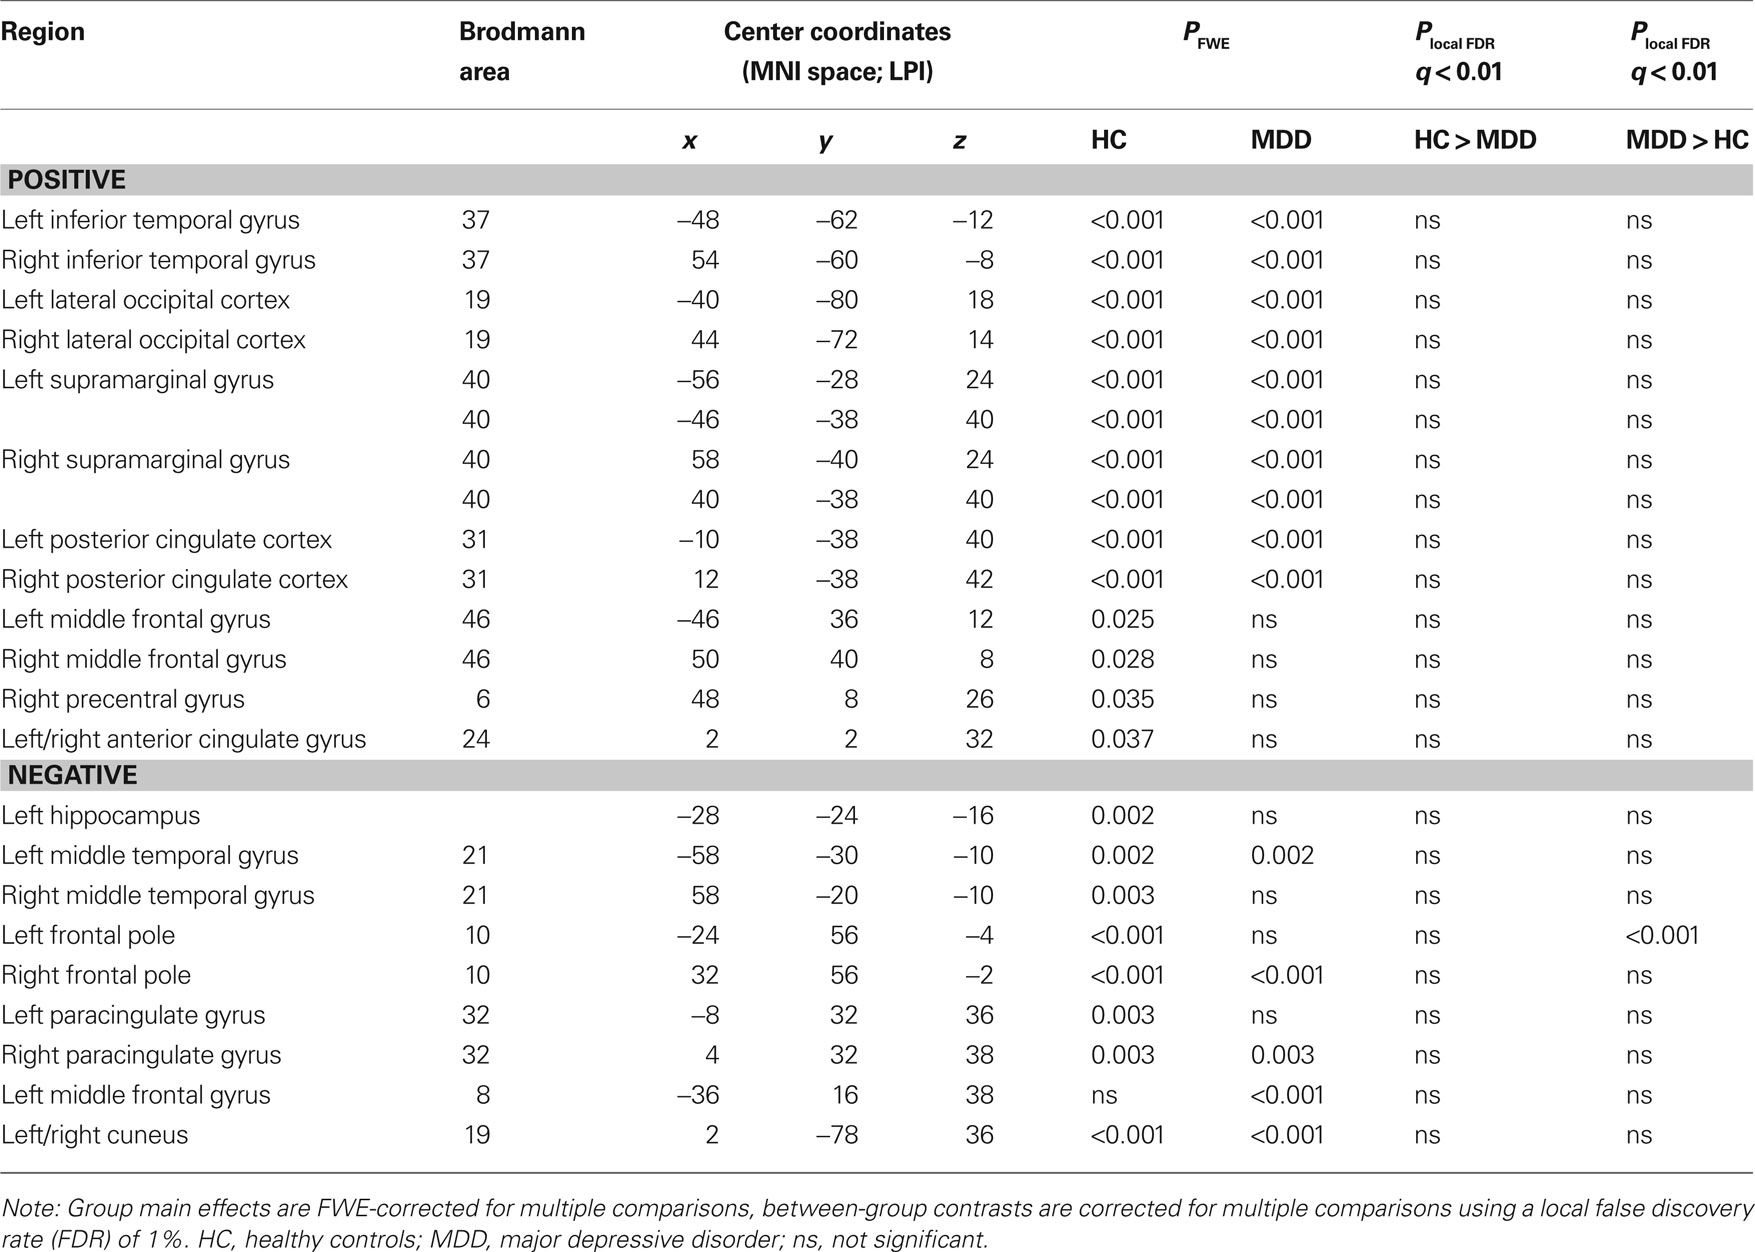
Table 3. RSN 11 characteristics and statistics.
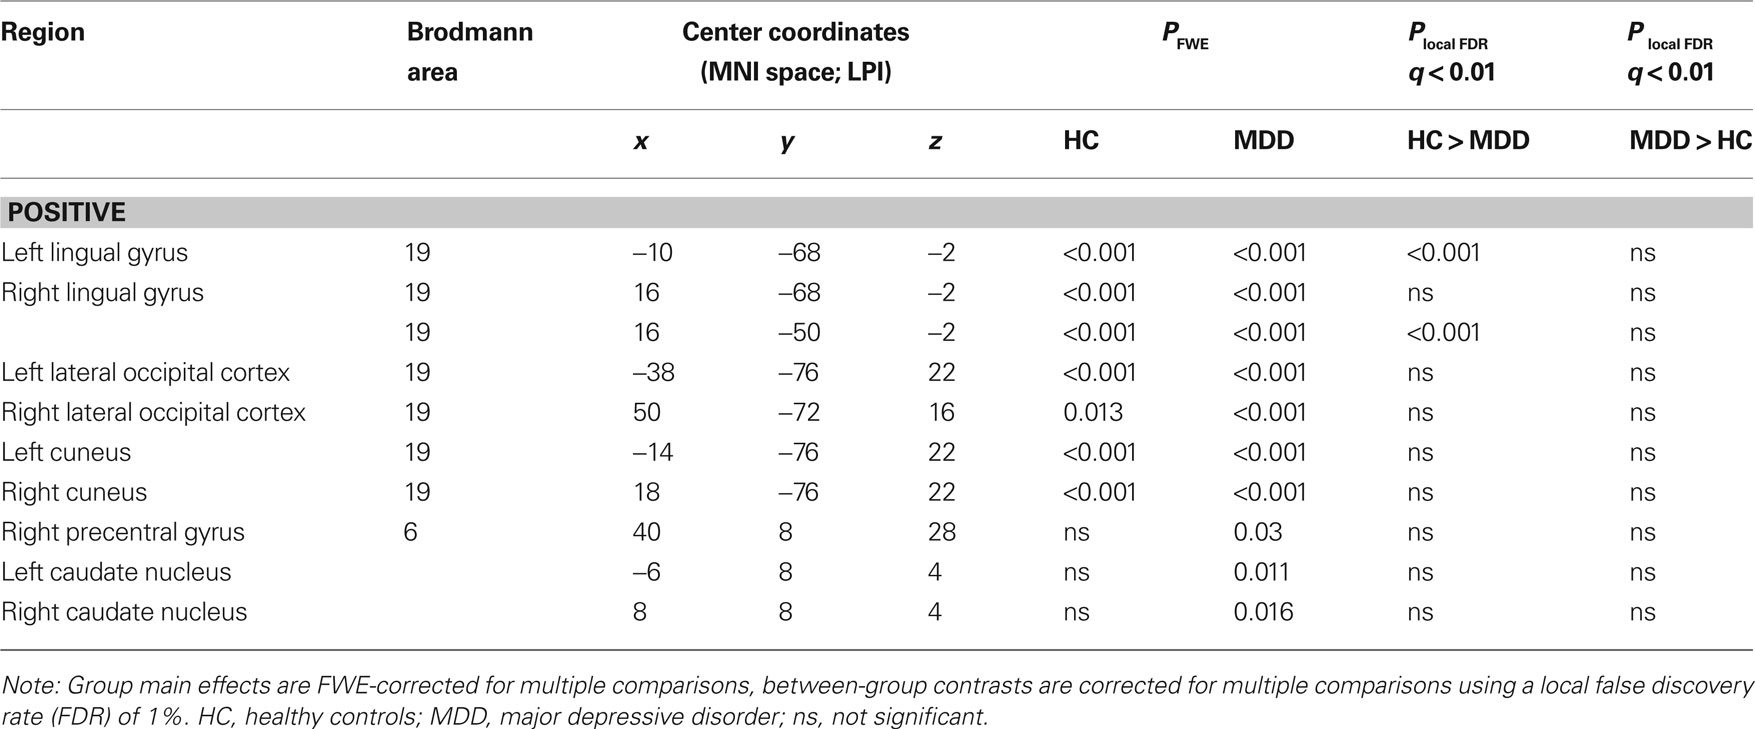
Table 4. RSN 3 characteristics and statistics.
The wide range in MADRS scores in the patient group allowed us to examine the relation between current symptom severity and the strength of the functional connections with the areas showing abnormal connectivity in this study. Within the depression group, Pearson product–moment correlation coefficients were calculated between the MADRS scores and the individual z-scores obtained from the affected areas within the corresponding individual component maps. However, no association was found between strength of the FC and symptom severity in any of the affected regions.
Gray Matter Results
No differences in mean gray matter were observed between controls and depressed participants in either of the three RSNs as a whole, or in the areas showing between-group differences within these RSNs (all t36 < 1, all p > 0.3). In addition, adding GM density values as covariates in the statistical model did not change the functional connectivity results as described in the previous section. This indicates that the altered FC within the three networks is unlikely to be related to macroscopic (i.e., MRI observable) gray matter abnormalities.
Discussion
In the present study we set out to investigate differences in whole brain FC between medication-free MDD patients without comorbidity, and a group of age- and sex-matched healthy controls using RS-fMRI. It was expected that altered connectivity would be observed in those RSNs which contain regions previously described to show altered RS-FC in depression (Anand et al., 2005a,b; Greicius et al., 2007; Zhou et al., 2009), as well as in other regions known to be involved in affective pathology (Phillips et al., 2003; Urry et al., 2006; Johnstone et al., 2007; Chen et al., 2008; Matthews et al., 2008). In this study we mainly found evidence for MDD-related decreased FC within three RSNs. These alterations have not been associated with major depression before.
First, altered FC was found in a network with regions known to be involved in emotional processing and affect regulation, such as the anterior insula, dorsal anterior cingulate cortex (dACC), ventromedial prefrontal cortex (vmPFC), temporal poles and amygdala (Pessoa, 2008). MDD patients showed strongly reduced connectivity with the amygdala within this RSN. Coupling between the vmPFC and amygdala has previously been found during downregulation of negative affect in healthy controls (Urry et al., 2006), as was reflected by decreasing amygdala activation with increasing vmPFC activation. In a similar study in depression, MDD patients showed altered coupling between these regions, potentially reflecting impaired top–down control over amygdala responses and inability to downregulate negative affect (Johnstone et al., 2007). Involvement of the anterior insula along with dACC and somatosensory regions in this network may furthermore underscore its potential role in interoceptive awareness and emotional experience (Critchley et al., 2004). Besides regions showing decreased FC in this RSN, the depression group also demonstrated increased connectivity of the rIFG. This region has been implicated in coping with exertion of both cognitive (Aron et al., 2004) and emotional (Dolcos et al., 2006) control. Recently, IFG function was found compromised in MDD when executive control had to be exerted in minimizing emotional distraction (Wang et al., 2008). Abnormal recruitment of the rIFG within the current RSN may indicate a higher propensity towards inhibition of emotional responses in depression, although the neurocircuitry to successfully do this is compromised. Taken together, the observed decoupling of the amygdala, decreased left insula connectivity and increased rIFG connectivity within this network may be related to the impaired regulation and integration of affective responses observed in MDD patients.
Second, we found reduced involvement of the left lateral frontal pole in a network often referred to as the TPN (Fox et al., 2005), its constituent regions commonly found activated during tasks that require cognitive effort or attention (Corbetta and Shulman, 2002). The lateral frontal poles are thought to play a key role in executive function and stimulus oriented behavior (Burgess et al., 2007a,b), which would complement the proposed function of this RSN. Reduced FC of the left lateral frontal pole, as was found in depression within this network, may thus reflect a suboptimally integrated attention system or reduced externally oriented attention in MDD. This abnormal connectivity pattern may relate to the cognitive deficiencies often observed in depressed patients (Rogers et al., 2004; Ebmeier et al., 2006), yet this relation should be assessed in task-related imaging studies designed to address this question more directly.
Finally, we demonstrated decreased FC of the bilateral lingual gyrus in MDD in a network including ventromedial occipitotemporal areas. Although both groups showed strong connectivity with the bilateral lingual gyrus within this network, MDD patients revealed a consistent decrease in connectivity strength. Abnormalities in the visual stream are not commonly reported in MDD, and the interpretation of this effect in the depressed patients in the current study must therefore remain speculative.
In the present study we did not find abnormalities in regions previously reported to show altered RS FC in MDD. For example, increased involvement of the subgenual ACC and thalamus in the DMN has been found in MDD (Greicius et al., 2007; Zhou et al., 2009), but was not observed in the current study. Previous work furthermore reported increased connectivity of multiple brain regions within the TPN (Zhou et al., 2009). In the present study, in contrast, we showed MDD-related reduced connectivity of the frontal poles, which is at variance with previously found increases in connectivity in this network. In addition, support for reduced coupling between the dorsal ACC and seeds from the pallidostriatum and thalamus in MDD was not found, as has been described in previous studies (Anand et al., 2005a,b).
The discrepancy in results between these studies and ours could be ascribed to differences in patient samples and analysis methods. In contrast to other studies, we report on a sample of medication-free MDD patients without comorbidity and with carefully age- and gender-matched controls. Secondly, for the current study we employed ICA analysis at the group level to obtain whole brain patterns of FC. It is conceivable that this method yields different results compared to approaches using correlations with, or between a priori defined regions of interest, or even when using ICA on individual data sets, although little is at present known about cross-validity between the methods.
A limitation of the present study was that our patient sample was mildly depressed on average. In addition, some patients already showed a clinically significant decrease in symptom severity because of the delay between the diagnostic assessment and the time of scanning. While this may have decreased the overall sensitivity of the study, the method applied was still successful in detecting brain functional correlates of depression, even in a mildly affected patient sample. Moreover, the effects found here were shown not to be associated with the current state of symptom severity, indicating that the observed alterations in FC may not be specific to the active state of the disorder and may not cease to exist during the remitted state.
Another limitation of the current study was the possible influence of between-group differences in heart rate variability and breathing on the results. The sampling rate used in this study (2.2 seconds per volume) was too low to avoid aliasing of these physiological signals in the data acquired. Applying a high-pass temporal filter will therefore not remove all variance caused by these signals. Since physiological activity was not monitored in the current study, it remains unclear if any difference between the two groups has influenced the results. However, it has been shown that ICA is capable of detecting signal sources associated with confounding physiological signals and that it can successfully split these from the signals of interest (Beckmann et al., 2005). We therefore think that it is unlikely that any of the differences found in this study were introduced by these physiological signals.
Because MDD-related gray matter (GM) abnormalities have been reported elsewhere (Sheline, 2003; Lorenzetti et al., 2009), we investigated whether our MDD sample showed regions of altered GM density, potentially biasing FC within the RSNs. However, no differences were observed in average GM density between controls and patients in either of the affected RSNs as a whole, nor in the regions showing altered FC within these RSNs. In addition, GM density variance did not contribute to the altered FC patterns observed. Therefore, it is unlikely that the differences in FC were related to global or focal changes in GM density within the current study sample.
Our MDD group furthermore consisted of both first episode and recurrent episode MDD patients. Recurrency of depressive episodes can be considered an aggravation of MDD, which might cause – or conversely be caused by – an exacerbation of abnormal FC patterns. However, the small size of both subgroups, as well as the cross-sectional nature of the current study, prevented us to address this question and compare the two groups in a meaningful way. Nevertheless, follow-up data are currently being collected as part of the NESDA study. Analysis of these data should allow us to shed more light on this matter and to test whether the RS-FC at baseline may have a predictive value in determining which patients are more vulnerable to develop recurrent depressive episodes. To this end, support vector classification of individual RS-FC maps could be employed (Craddock et al., 2009).
In conclusion, we showed that (a history of) major depression is associated with altered FC within multiple RSNs, which could reflect less integrated processing of affective information in ventral (limbic) areas and compromised cognitive functional pathways in dorsal (PFC) regions. The current findings thereby complement previous findings on both affective and cognitive abnormalities in depression and will further increase our knowledge about the pathophysiology of the disorder.
Conflict of Interest Statement
The authors declare that the research was conducted in the absence of any commercial or financial relationships that could be construed as a potential conflict of interest.
Acknowledgments
The infrastructure for the NESDA study is funded through the Geestkracht programme of the Netherlands Organization for Health Research and Development (ZonMw, grant number 10-000-1002) and is supported by participating universities and mental health care organizations (VU University Medical Center, GGZ inGeest, Arkin, Leiden University Medical Center, GGZ Rivierduinen, University Medical Center Groningen, Lentis, GGZ Friesland, GGZ Drenthe, IQ Healthcare, Netherlands Institute for Health Services Research (NIVEL) and Netherlands Institute of Mental Health and Addiction (Trimbos). The authors gratefully acknowledge Ramona Demenescu and Anita Kuiper for MRI operation, and Evelinda Baerends for useful discussions on the methods.
Footnotes
References
Abou-Elseoud, A., Starck, T., Remes, J., Nikkinen, J., Tervonen, O., and Kiviniemi, V. (2010). The effect of model order selection in group PICA. Hum. Brain Mapp. 31, 1207–1216.
American Psychiatric Association (1994). Diagnostic and Statistical Manual of Mental Disorders, 4th Edn. Washington, D.C.: American Psychiatric Association.
Anand, A., Li, Y., Wang, Y., Wu, J., Gao, S., Bukhari, L., Mathews, V. P., Kalnin, A., and Lowe, M. J. (2005a). Activity and connectivity of brain mood regulating circuit in depression: a functional magnetic resonance study. Biol. Psychiatry 57, 1079–1088.
Anand, A., Li, Y., Wang, Y., Wu, J., Gao, S., Bukhari, L., Mathews, V. P., Kalnin, A., and Lowe, M. J. (2005b). Antidepressant effect on connectivity of the mood-regulating circuit: an FMRI study. Neuropsychopharmacology 30, 1334–1344.
Aron, A. R., Robbins, T. W., and Poldrack, R. A. (2004). Inhibition and the right inferior frontal cortex. Trends Cogn. Sci. 8, 170–177.
Ashburner, J., and Friston, K. J. (2000). Voxel-based morphometry – the methods. Neuroimage 11, 805–821.
Beckmann, C. F., DeLuca, M., Devlin, J. T., and Smith, S. M. (2005). Investigations into resting-state connectivity using independent component analysis. Philos. Trans. R. Soc. Lond. B Biol. Sci. 360, 1001–1013.
Beckmann, C. F., and Smith, S. M. (2004). Probabilistic independent component analysis for functional magnetic resonance imaging. IEEE Trans. Med. Imaging 23, 137–152.
Biswal, B., Yetkin, F. Z., Haughton, V. M., and Hyde, J. S. (1995). Functional connectivity in the motor cortex of resting human brain using echo-planar MRI. Magn. Reson. Med. 34, 537–541.
Burgess, P. W., Dumontheil, I., and Gilbert, S. J. (2007a). The gateway hypothesis of rostral prefrontal cortex (area 10) function. Trends Cogn. Sci. 11, 290–298.
Burgess, P. W., Gilbert, S. J., and Dumontheil, I. (2007b). Function and localization within rostral prefrontal cortex (area 10). Philos. Trans. R. Soc. Lond. B Biol. Sci. 362, 887–899.
Chen, C. H., Suckling, J., Ooi, C., Fu, C. H., Williams, S. C., Walsh, N. D., Mitterschiffthaler, M. T., Pich, E. M., and Bullmore, E. (2008). Functional coupling of the amygdala in depressed patients treated with antidepressant medication. Neuropsychopharmacology 33, 1909–1918.
Corbetta, M., and Shulman, G. L. (2002). Control of goal-directed and stimulus-driven attention in the brain. Nat. Rev. Neurosci. 3, 201–215.
Cordes, D., Haughton, V. M., Arfanakis, K., Carew, J. D., Turski, P. A., Moritz, C. H., Quigley, M. A., and Meyerand, M. E. (2001). Frequencies contributing to functional connectivity in the cerebral cortex in “resting-state” data. Am. J. Neuroradiol. 22, 1326–1333.
Craddock, R. C., Holtzheimer, P. E., III, Hu, X. P., and Mayberg, H. S. (2009). Disease state prediction from resting state functional connectivity. Magn. Reson. Med. 62, 1619–1628.
Critchley, H. D., Wiens, S., Rotshtein, P., Ohman, A., and Dolan, R. J. (2004). Neural systems supporting interoceptive awareness. Nat. Neurosci. 7, 189–195.
Damoiseaux, J. S., Beckmann, C. F., Arigita, E. J., Barkhof, F., Scheltens, P., Stam, C. J., Smith, S. M., Rombouts, S. A. (2008). Reduced resting-state brain activity in the “default network” in normal aging. Cereb. Cortex 18, 1856–1864.
Damoiseaux, J. S., Rombouts, S. A., Barkhof, F., Scheltens, P., Stam, C. J., Smith, S. M., and Beckmann, C. F. (2006). Consistent resting-state networks across healthy subjects. Proc. Natl. Acad. Sci. U. S. A. 103, 13848–13853.
Davidson, R. J., Pizzagalli, D., Nitschke, J. B., and Putnam, K. (2002). Depression: perspectives from affective neuroscience. Annu. Rev. Psychol. 53, 545–574.
De Martino, F., Gentile, F., Esposito, F., Balsi, M., Di, S. F., Goebel, R., and Formisano, E. (2007). Classification of fMRI independent components using IC-fingerprints and support vector machine classifiers. Neuroimage 34, 177–194.
Dolcos, F., Kragel, P., Wang, L., and McCarthy, G. (2006). Role of the inferior frontal cortex in coping with distracting emotions. Neuroreport 17, 1591–1594.
Douaud, G., Smith, S., Jenkinson, M., Behrens, T., Johansen-Berg, H., Vickers, J., James, S., Voets, N., Watkins, K., Matthews, P. M., and James, A. (2007). Anatomically related grey and white matter abnormalities in adolescent-onset schizophrenia. Brain 130, 2375–2386.
Drevets, W. C., Price, J. L., and Furey, M. L. (2008). Brain structural and functional abnormalities in mood disorders: implications for neurocircuitry models of depression. Brain Struct. Funct. 213, 93–118.
Ebmeier, K., Rose, E., and Steele, D. (2006). Cognitive impairment and fMRI in major depression. Neurotox. Res. 10, 87–92.
Efron, B. (2004). Large-scale simultaneous hypothesis testing: the choice of a null hypothesis. J. Amer. Statistical Assoc. 99, 96–104.
Filippini, N., MacIntosh, B. J., Hough, M. G., Goodwin, G. M., Frisoni, G. B., Smith, S. M., Matthews, P. M., Beckmann, C. F., and Mackay, C. E. (2009). Distinct patterns of brain activity in young carriers of the APOE-epsilon4 allele. Proc. Natl. Acad. Sci. U. S. A. 106, 7209–7214.
Fox, M. D., and Raichle, M. E. (2007). Spontaneous fluctuations in brain activity observed with functional magnetic resonance imaging. Nat. Rev. Neurosci. 8, 700–711.
Fox, M. D., Snyder, A. Z., Vincent, J. L., Corbetta, M., Van, E., and Raichle, M. E. (2005). The human brain is intrinsically organized into dynamic, anticorrelated functional networks. Proc. Natl. Acad. Sci. U. S. A. 102, 9673–9678.
Good, C. D., Johnsrude, I. S., Ashburner, J., Henson, R. N., Friston, K. J., and Frackowiak, R. S. (2001). A voxel-based morphometric study of ageing in 465 normal adult human brains. Neuroimage 14, 21–36.
Greicius, M. D., Flores, B. H., Menon, V., Glover, G. H., Solvason, H. B., Kenna, H., Reiss, A. L., and Schatzberg, A. F. (2007). Resting-state functional connectivity in major depression: abnormally increased contributions from subgenual cingulate cortex and thalamus. Biol. Psychiatry 62, 429–437.
Greicius, M. D., Krasnow, B., Reiss, A. L., and Menon, V. (2003). Functional connectivity in the resting brain: a network analysis of the default mode hypothesis. Proc. Natl. Acad. Sci. U. S. A. 100, 253–258.
Hyvarinen, A. (1999). Fast and robust fixed-point algorithms for independent component analysis. IEEE Trans. Neural Netw. 10, 626–634.
Jenkinson, M., Bannister, P., Brady, M., and Smith, S. (2002). Improved optimization for the robust and accurate linear registration and motion correction of brain images. Neuroimage 17, 825–841.
Jenkinson, M., and Smith, S. (2001). A global optimisation method for robust affine registration of brain images. Med. Image Anal. 5, 143–156.
Johnstone, T., van Reekum, C. M., Urry, H. L., Kalin, N. H., and Davidson, R. J. (2007). Failure to regulate: counterproductive recruitment of top-down prefrontal-subcortical circuitry in major depression. J. Neurosci. 27, 8877–8884.
Lorenzetti, V., Allen, N. B., Fornito, A., and Yucel, M. (2009). Structural brain abnormalities in major depressive disorder: a selective review of recent MRI studies. J. Affect. Disord. 117, 1–17.
Lowe, M. J., Mock, B. J., and Sorenson, J. A. (1998). Functional connectivity in single and multislice echoplanar imaging using resting-state fluctuations. Neuroimage 7, 119–132.
Matthews, S. C., Strigo, I. A., Simmons, A. N., Yang, T. T., and Paulus, M. P. (2008). Decreased functional coupling of the amygdala and supragenual cingulate is related to increased depression in unmedicated individuals with current major depressive disorder. J. Affect. Disord. 111, 13–20.
Mayberg, H. S. (1997). Limbic-cortical dysregulation: a proposed model of depression. J. Neuropsychiatry Clin. Neurosci. 9, 471–481.
Mayberg, H. S. (2003). Modulating dysfunctional limbic-cortical circuits in depression: towards development of brain-based algorithms for diagnosis and optimised treatment. Br. Med. Bull. 65, 193–207.
Mennes, M., Kelly, C., Zuo, X. N., Di, M. A., Biswal, B. B., Castellanos, F. X., and Milham, M. P. (2010). Inter-individual differences in resting-state functional connectivity predict task-induced BOLD activity. Neuroimage 50, 1690–1701.
Montgomery, S. A., and Asberg, M. (1979). A new depression scale designed to be sensitive to change. Br. J. Psychiatry 134, 382–389.
Nichols, T. E., and Holmes, A. P. (2002). Nonparametric permutation tests for functional neuroimaging: a primer with examples. Hum. Brain Mapp. 15, 1–25.
Penninx, B. W., Beekman, A. T., Smit, J. H., Zitman, F. G., Nolen, W. A., Spinhoven, P., Cuijpers, P., De Jong, P. J., Van Marwijk, H. W., Assendelft, W. J., Van Der Meer, K., Verhaak, P., Wensing, M., De Graaf, R., Hoogendijk, W. J., Ormel, J., and Van Dyck, R. (2008). The Netherlands Study of Depression and Anxiety (NESDA): rationale, objectives and methods. Int. J. Methods Psychiatr. Res. 17, 121–140.
Pessoa, L. (2008). On the relationship between emotion and cognition. Nat. Rev. Neurosci. 9, 148–158.
Phillips, M. L., Drevets, W. C., Rauch, S. L., and Lane, R. (2003). Neurobiology of emotion perception II: implications for major psychiatric disorders. Biol. Psychiatry 54, 515–528.
Raichle, M. E., MacLeod, A. M., Snyder, A. Z., Powers, W. J., Gusnard, D. A., and Shulman, G. L. (2001). A default mode of brain function. Proc. Natl. Acad. Sci. U. S. A. 98, 676–682.
Rogers, M. A., Kasai, K., Koji, M., Fukuda, R., Iwanami, A., Nakagome, K., Fukuda, M., and Kato, N. (2004). Executive and prefrontal dysfunction in unipolar depression: a review of neuropsychological and imaging evidence. Neurosci. Res. 50, 1–11.
Seeley, W. W., Menon, V., Schatzberg, A. F., Keller, J., Glover, G. H., Kenna, H., Reiss, A. L., and Greicius, M. D. (2007). Dissociable intrinsic connectivity networks for salience processing and executive control. J. Neurosci. 27, 2349–2356.
Shehzad, Z., Kelly, A. M., Reiss, P. T., Gee, D. G., Gotimer, K., Uddin, L. Q., Lee, S. H., Margulies, D. S., Roy, A. K., Biswal, B. B., Petkova, E., Castellanos, F. X., and Milham, M. P. (2009). The resting brain: unconstrained yet reliable. Cereb. Cortex 19, 2209–2229.
Sheline, Y. I. (2003). Neuroimaging studies of mood disorder effects on the brain. Biol. Psychiatry 54, 338–352.
Smith, S. M., Fox, P. T., Miller, K. L., Glahn, D. C., Fox, P. M., Mackay, C. E., Filippini, N., Watkins, K. E., Toro, R., Laird, A. R., and Beckmann, C. F. (2009). Correspondence of the brain’s functional architecture during activation and rest. Proc. Natl. Acad. Sci. U. S. A. 106, 13040–13045.
Smith, S. M., Jenkinson, M., Woolrich, M. W., Beckmann, C. F., Behrens, T. E., Johansen-Berg, H., Bannister, P. R., De, L. M., Drobnjak, I., Flitney, D. E., Niazy, R. K., Saunders, J., Vickers, J., Zhang, Y., De, S. N., Brady, J. M., and Matthews, P. M. (2004). Advances in functional and structural MR image analysis and implementation as FSL. Neuroimage 23 (Suppl. 1), S208–S219.
Smith, S. M., and Nichols, T. E. (2009). Threshold-free cluster enhancement: addressing problems of smoothing, threshold dependence and localisation in cluster inference. Neuroimage 44, 83–98.
Stephan, K. E., Riera, J. J., Deco, G., and Horwitz, B. (2008). The brain connectivity workshops: moving the frontiers of computational systems neuroscience. Neuroimage 42, 1–9.
Urry, H. L., van Reekum, C. M., Johnstone, T., Kalin, N. H., Thurow, M. E., Schaefer, H. S., Jackson, C. A., Frye, C. J., Greischar, L. L., Alexander, A. L., and Davidson, R. J. (2006). Amygdala and ventromedial prefrontal cortex are inversely coupled during regulation of negative affect and predict the diurnal pattern of cortisol secretion among older adults. J. Neurosci. 26, 4415–4425.
Wang, L. H., Labar, K. S., Smoski, M., Rosenthal, M. Z., Dolcos, F., Lynch, T. R., Krishnan, R. R., and McCarthy, G. (2008). Prefrontal mechanisms for executive control over emotional distraction are altered in major depression. Psychiatry Res. 163, 143–155.
Keywords: major depression, resting-state functional magnetic resonance imaging, functional connectivity, independent component analysis, amygdala
Citation: Veer IM, Beckmann CF, van Tol M-J, Ferrarini L, Milles J, Veltman DJ, Aleman A, van Buchem MA, van der Wee NJ and Rombouts SARB (2010) Whole brain resting-state analysis reveals decreased functional connectivity in major depression. Front. Syst. Neurosci. 4:41. doi: 10.3389/fnsys.2010.00041
Received: 29 April 2010;
Paper pending published: 25 June 2010;
Accepted: 23 July 2010;
Published online: 20 September 2010.
Edited by:
Silvina G. Horovitz, National Institutes of Health, USAReviewed by:
Cameron Craddock, Baylor College of Medicine, USAMartin Walter, Otto-von-Guericke-Universität Magdeburg, Germany
Copyright: © 2010 Veer, Beckmann, van Tol, Ferrarini, Milles, Veltman, Aleman, van Buchem, van der Wee and Rombouts. This is an open-access article subject to an exclusive license agreement between the authors and the Frontiers Research Foundation, which permits unrestricted use, distribution, and reproduction in any medium, provided the original authors and source are credited.
*Correspondence: Ilya M. Veer, Department of Radiology, Leiden University Medical Center, Postzone C2-S, P.O. Box 9600, 2300 RC Leiden, Netherlands. e-mail: i.m.veer@lumc.nl