From intracerebral EEG signals to brain connectivity: identification of epileptogenic networks in partial epilepsy
- 1 INSERM, U642, Rennes, F-35000, France
- 2 Université de Rennes 1, LTSI, F-35000, Rennes, France
- 3 INSERM, U751, Marseille, F-1000, France
- 4 AP-HM, Hôpital de la Timone, Service de Neurophysiologie Clinique, Marseille, F-13000, France
- 5 CHU Pontchaillou, Service de Neurologie, Rennes, F-3000, France
Epilepsy is a complex neurological disorder characterized by recurring seizures. In 30% of patients, seizures are insufficiently reduced by anti-epileptic drugs. In the case where seizures originate from a relatively circumscribed region of the brain, epilepsy is said to be partial and surgery can be indicated. The success of epilepsy surgery depends on the accurate localization and delineation of the epileptogenic zone (which often involves several structures), responsible for seizures. It requires a comprehensive pre-surgical evaluation of patients that includes not only imaging data but also long-term monitoring of electrophysiological signals (scalp and intracerebral EEG). During the past decades, considerable effort has been devoted to the development of signal analysis techniques aimed at characterizing the functional connectivity among spatially distributed regions over interictal (outside seizures) or ictal (during seizures) periods from EEG data. Most of these methods rely on the measurement of statistical couplings among signals recorded from distinct brain sites. However, methods differ with respect to underlying theoretical principles (mostly coming from the field of statistics or the field of non-linear physics). The objectives of this paper are: (i) to provide an brief overview of methods aimed at characterizing functional brain connectivity from electrophysiological data, (ii) to provide concrete application examples in the context of drug-refractory partial epilepsies, and iii) to highlight some key points emerging from results obtained both on real intracerebral EEG signals and on signals simulated from physiologically plausible models in which the underlying connectivity patterns are known a priori (ground truth).
Introduction
Epilepsies constitute a common neurological disorder that affects about 1% of the world population (Engel et al., 1993). Epilepsies are characterized by the repetitive seizures (called ictal periods), the frequency and duration of which is variable. In 20–30% of the cases, seizures remain drug-resistant and considerably affect the patient’s quality of life. Drug-resistant epilepsies are often partial or focal, with an origin located in relatively circumscribed brain regions. For patients with partial epilepsy, a surgical treatment can be considered. The problem is then to determine which brain areas which must be removed such that seizures are suppressed under the constraint that post-surgical deficits (sensory-motor or cognitive) induced by surgery are limited. In other words, the epileptogenic zone (EZ) that is responsible for seizures must be defined from anatomo-functional observations acquired during pre-surgical evaluation (Bartolomei et al., 2002).
The delineation of the EZ is the essential diagnostic step, prior to surgery. As the epileptic seizure is a dynamic phenomenon, imaging techniques providing “static” images of the brain (MRI, PET scan) are frequently not the best tools to identify the EZ. About 20–30% of patients have either no lesion or some lesions but without any clear link with their epilepsy.
Electroencephalography is the technique most suited to capture the dynamical properties of a seizure. In some specialized Epilepsy Surgery Units, direct exploration of brain regions using intracerebral depth-electrodes is performed (Bancaud and Talairach, 1973; Chauvel et al., 1993, 1996; Guenot et al., 2001; Cossu et al., 2005; McGonigal et al., 2007). These depth-EEG recordings have long been considered as the “gold standard” for EZ identification. Although they allow for better definition of the EZ, the complete delineation of the EZ may remain elusive, such that suppression of seizures is not always obtained. The reason is that in most of the cases the organization of the EZ is quite complex. This organization corresponds to that of a network of neuronal populations (showing “hyperexcitabilty” and “hypersynchronization” properties) distributed in distinct and distant brain structures. This network is often referred to as the epileptogenic network (Spencer, 2002; Bartolomei et al., 2008b). Accurate identification of epileptogenic networks is the thus the central problem in drug-resistant epilepsies and novel methods have to be proposed to achieve this goal (Wendling et al., 2009). In particular, the demand is high for diagnostic methods allowing for better characterization and interpretation of depth-EEG signals, in terms of underlying neuronal networks and pathophysiological mechanisms taking place in these networks (Rampp and Stefan, 2006).
In this context, signal analysis techniques have considerably developed since the middle of the last century (Brazier and Casby, 1952; Barlow and Brazier, 1954). It is now admitted that signal analysis can provide relevant information regarding epileptic processes (either during interictal or ictal periods) when three conditions are met, at least: (i) signal processing methods are specifically adapted to phenomena under study, (ii) methods have been successfully evaluated on “control” datasets and (iii) the information conveyed by computed quantities is appropriately interpreted.
More specifically, methods aimed at quantifying interactions between recorded structures are of particular interest for identifying functional networks involving spatially distributed brain regions. Over the past decades, considerable effort has been devoted to the development of such methods allowing for characterization of functional and/or effective brain connectivity (Friston, 1994; Jirsa and McIntosh, 2007; Sporns, 2010). A consequence of this increasing interest is that now a plethora of methods is available, each method being based on specific assumptions about the underlying model of relationship between analyzed signals. The objective of this paper is not to provide a comprehensive review of all these methods but rather to focus on those aimed at quantifying functional connectivity from EEG signals. A particular attention is paid to a well-established method in the field of EEG signal processing, namely non-linear regression analysis. Over the past decade, this method has been extensively used in our group to analyze EEG signals recorded in epileptic patients. In this paper, its behavior is illustrated on a typical activity that has long been considered as a hallmark of the EZ: low-voltage rapid discharges observed in depth-EEG signals at the onset of partial seizures. Based on realistic models of coupled neuronal populations, it is showed that this method can provide relevant information on connectivity and can thus be used to interpret the behavior of brain structures involved at the onset of seizures. Finally, the advantages and the limitations of brain connectivity methods will be discussed in the context of the identification of epileptogenic networks from electrophysiological signals, which remains a difficult and still unsolved issue.
Materials and Methods
From EEG Signals to Brain Functional Connectivity: a Brief Overview
The idea of extracting, from EEG recordings, some information about brain connectivity is not new. Research in this domain has been – and is still – very active (Uhlhaas and Singer, 2006) and novel methods (or improvement of existing ones) are continuously reported. The underlying assumption is quite simple: the temporal evolution of the cross-correlation (in a wide sense) between electrophysiological signals recorded (with appropriate time resolution) from spatially distributed brain regions is a reflection of the functional connectivity among these regions. The word “functional” here is important as it marks a difference with the concept of “anatomic connectivity” (the actual brain circuitry) and the concept of “effective connectivity” (the actual influence of one region over another one). Regarding functional connectivity, the first methods (Barlow and Brazier, 1954) were developed in the 50s, just after fast Fourier transform (FFT) algorithms were introduced (Cooley and Tukey, 1965). Authors made use of either the cross-correlation function in the time domain or the coherence function in the frequency domain. The first results about the propagation of interictal events as observed in human intracerebral EEG data were reported by Brazier (1972). A few years later, quantitative analysis of these events was performed on scalp-EEG data (Lopes da Silva et al., 1977). From 1980, with the fast development of computers and EEG digital systems, signal processing methods spread more and more rapidly in the field of neurophysiology (for both clinical and research purpose). In the context of epilepsy, Gotman (1987) made use of the averaged coherence function computed on signals recorded from both hemispheres to study the evolution of inter-hemispheric interactions over the entire duration of partial seizures. This coherence function was also used to reveal the possible existence of activities propagating over short- or long-range connection fibers (Thatcher et al., 1986) as well as synchronization mechanisms particularly at the onset of seizures (Duckrow and Spencer, 1992). A corollary study was the estimation of time delays from coherence values (Avoli et al., 1983; Ktonas and Mallart, 1991) as measured “latencies” can be related to the propagation of activity among distant structures. In this category of coherence-based methods, some attempts to use time-varying linear models (autoregressive models) were also reported. These parametric methods were used to measure the degree of synchronization of interictal and ictal EEG signals and to characterize the relationship between brain oscillations in the time and/or frequency domain (Haykin et al., 1996; Franaszczuk and Bergey, 1999).
It is noteworthy that the aforementioned methods are said to be linear. This means that they can only capture the linear component of the relationship between analyzed time series. However, it is commonly admitted that most of the mechanisms at the origin of the generation of EEG signals are non-linear. Therefore, research effort was also devoted to the development of so-called non-linear methods (Pikovsky et al., 2001). A first family of non-linear methods was introduced in the field of EEG about twenty years ago. It included mutual information (Mars and Lopes da Silva, 1983) and non-linear regression analysis (Pijn and Lopes da silva, 1993b; Wendling et al., 2001b). A second family developed later on, based on works related to the analysis of non-linear dynamical systems and chaos (Iasemidis, 2003; Lehnertz, 1999). Regarding this second family of methods, the number of variants is high. Basically, two groups have emerged: (i) phase synchronization methods (Bhattacharya, 2001; Rosenblum et al., 2004) which first estimate the instantaneous phase of each signal and then compute a quantity based on co-variation of extracted phases to determine the degree of relationship and (ii) generalized synchronization methods (Arnhold et al., 1999; Stam et al., 2002, 2003) which also proceed according to two steps. Firstly, state space trajectories are reconstructed from scalar time series signals. Secondly, a similarity index is computed to quantify the similarity between these trajectories.
As shown by this brief literature review the panel of methods that can be used to estimate functional connectivity is wide. In a recent comparative study, we have analyzed the performances of ten methods aimed at characterizing functional connectivity from EEG signals. These methods belonged to three families (linear and non-linear regression, phase synchronization, and generalized synchronization) and were evaluated according to a model-based methodology. In considered simulations, the underlying relationship was known a priori (ground truth). It could be controlled using a parameter representing a degree of coupling in the three types of models (coupled stochastic signals, coupled non-linear dynamical systems, and coupled neuronal populations) that were used to generate output signals. Readers may refer to (Ansari-Asl et al., 2006; Wendling et al., 2009) for detailed results. In brief, the most salient findings of this study can be summarized as follows. First, we could demonstrate that some methods are insensitive to the coupling parameter in considered models (for instance, phase synchronization methods when the relationship between simulated signals only involves their envelope). Second, results showed strong dependence on the frequency distribution of signals (broad band versus narrow band). Third, we found that there is no “universal” method, i.e., none of the studied methods performed better than the other ones whatever the considered situation. Nevertheless, results revealed that methods belonging to the family of linear and non-linear regression analyses showed to be always sensitive to the coupling parameter in considered models. In particular, in the context of ictal activity simulated from coupled populations of neurons, the non-linear correlation coefficient h2 showed good performances. The behavior of this method on simulated and on real depth-EEG signals is illustrated in section Application to the identification of epileptogenic networks in partial epilepsies. Theoretical aspects as well as basic principles of the modeling approach are summarized in the next two sections.
Non-Linear Regression Analysis: Non-Linear Correlation Coefficient, Time Delay and Direction Index
Non-linear regression analysis was first introduced in the field of EEG analysis by Lopes da Silva et al. (1989) as a non-parametric method for characterizing the dependency of a signal Y on a signal X, from signal samples only and independently of the type of relation between the two signals. Readers may refer to (Pijn, 1990; Pijn et al., 1992; Pijn and Lopes Da Silva, 1993a; Kalitzin et al., 2007) for theoretical aspects of this method and to (Bartolomei et al., 2001; Wendling and Bartolomei, 2001; Wendling et al., 2001b) for practical application of this method in the context of epileptic activity analysis. In short, the dependency between considered signals is quantified by a normalized non-linear correlation coefficient  given by

where

and where h is a non-linear fitting curve which approximates the statistical relationship between X and Y. In practice, this function h can be obtained from the piece-wise linear approximation between the samples of the two time series. Conceptually,  quantifies the reduction of variance of signal Y that is obtained when Y samples are predicted for X samples. Indeed, as depicted from Eq. (1),
  when there exists no relationship between X and Y (i.e., the conditional variance VAR[Y(t + τ)/X(t)] is equal to the marginal variance VAR[Y(t + τ)). Conversely, signal Y is fully determined by signal X, the conditional variance VAR[Y(t + τ)/X(t)] = 0 and
  .
.
The h2 coefficient is asymmetric ( is different from the quantity
  ). This asymmetry property was shown to provide insight into causality (Arnhold et al., 1999): if signals X and Y are of the same order of complexity and if Y is (at least partially) driven by X then the difference
  is positive. Finally, in Eq. (1), parameter τ corresponds to the time shift that maximizes the value of the h2 coefficient. Due to the asymmetry property, this time shift can take two values (either τXY or τYX) depending on the way the computation of the h2 coefficient is performed (from X to Y or vice versa). As a notation convention, we will consider that τYX > 0 (resp. τYX < 0) in the case where signal Y is delayed (resp. in advance) with respect to X. The time delay information corresponds to the notion of latency classically used in neurophysiology. It can also be related to causality as the delayed activity is more likely – caused by – rather than – causing – the preceding activity.
To end with this section on non-linear regression analysis, it is noteworthy that the asymmetry information and the time delay information were combined in single quantity named “direction index” D (Wendling and Bartolomei, 2001; Wendling et al., 2001a). This quantity allows for more reliable estimation of the direction of coupling between systems that generate signals, compared to the case where asymmetry information and time delay are considered separately. Briefly, the direction index D starts from the fact that the difference Δh2 =  and the difference Δτ = τYX − τXY are both positive when signal Y is dependent on – and is delayed with respect to – signal X. The idea is thus to make a conjoint use of the sign of Δh2 and Δτ in order to provide a probabilistic information on the direction of coupling. A possible formula is
  when the same weighting coefficient is used for the asymmetry and delay information. In this case, D = +1 (respectively −1) denotes that Y (respectively X) is dependant on – and delayed with respect to – X (respectively Y). Conversely, D = 0 denotes either (i) a situation where there is a constant discrepancy between the information provided by the asymmetry (Δh2) and by the time delay (Δτ) or (ii) a situation where the sign of Δh2 and the sign of Δτ continuously fluctuates, over the considered time window.
A Model of Depth-EEG Signals Generated From Coupled Neuronal Populations
A general scientific approach that has proven useful in the study of complex systems is to capture some essential properties in a formal description – a model – which allows for thorough analysis of possible behaviors based on parameters considered in the model. More particularly, in the field of epilepsy, computational neuroscience has developed quite rapidly over the three past decades (Soltesz and Staley, 2008). Besides experimental models, computational models have gained maturity. They are now considered as an efficient way of structuring the tremendous amount of data coming from neurobiological and neurophysiological research in order to interpret experimental findings and, in some cases, to generate hypotheses that can be tested experimentally (Suffczynski et al., 2006). Basically, two complementary approaches developed since the 1970s and led to either detailed (i.e., microscopic) or lumped (i.e., mesoscopic) models of neural systems involved in the generation of epileptic activity. Readers may refer to (Bartolomei et al., 2008b; Lytton, 2008; Ullah and Schiff, 2009) for recent reviews on this topic. In this section, we focus on a mesoscopic model of coupled neuronal populations, illustrated in Figure 1A. This type of model has been described in previous reports (Wendling et al., 2000, 2002, 2005). It is intended to reproduce the activity of two (or more) populations of neurons interacting through excitatory synaptic connections. Each population contains different subsets of neurons, typically main cells, and local interneurons. Figure 1A shows a model of two bi-directionally coupled neuronal populations. Each population comprises a subset of excitatory pyramidal neurons (with collateral glutamatergic excitation) and two subsets of inhibitory interneurons which receive excitatory input (glutamatergic) from pyramidal cells and which, in turn, provide inhibition (GABAergic) to pyramidal cells. It is noteworthy that the mesoscopic approach provides a description of the “average” activity in the considered populations of neurons. This means that it does not require an explicit representation of single units and that it leads to “much smaller” sets of ordinary differential equations, especially when compared to high-dimensional networks in which each neuron is described using a multicompartmental model. Two main input–output functions are used at the level of each subset in order to describe the whole population activity. The first function transforms the average density of incoming action potentials (APs) into an average post-synaptic potential (PSP). This average PSP can be either excitatory (EPSP) or inhibitory (IPSP) depending on the nature of the considered subset of cells. The kinetics of PSPs (rise and decay times) are adjusted to match experimentally recorded PSPs. The second function changes the average PSP into an average density of APs fired by the subset. This function is non-linear and accounts for threshold and saturation effects classically observed in neuronal physiology. In addition to the specific input from population P2 (resp. P1), an input noise p1(t) (resp. p2(t)) is used to describe the influence of non-specific afferences to population P1 (resp. P2). Both signals p1(t) and p2(t) represent a density of action potentials. They were chosen to have a Gaussian distribution (mean = 90, SD = 30). Finally, the model output that is usually chosen is the summation of EPSPs and IPSPs generated at the level of pyramidal cells. Indeed, it can be shown that these summated PSPs are the principal contribution to the local field potential (LFP, the signal that would be recorded by an extracellular electrode positioned in the vicinity of the neuronal population). Note that this output can be directly used as an estimate of the temporal dynamics of the LFP if one neglects the source-sensor transfer function (quasi-static assumption).
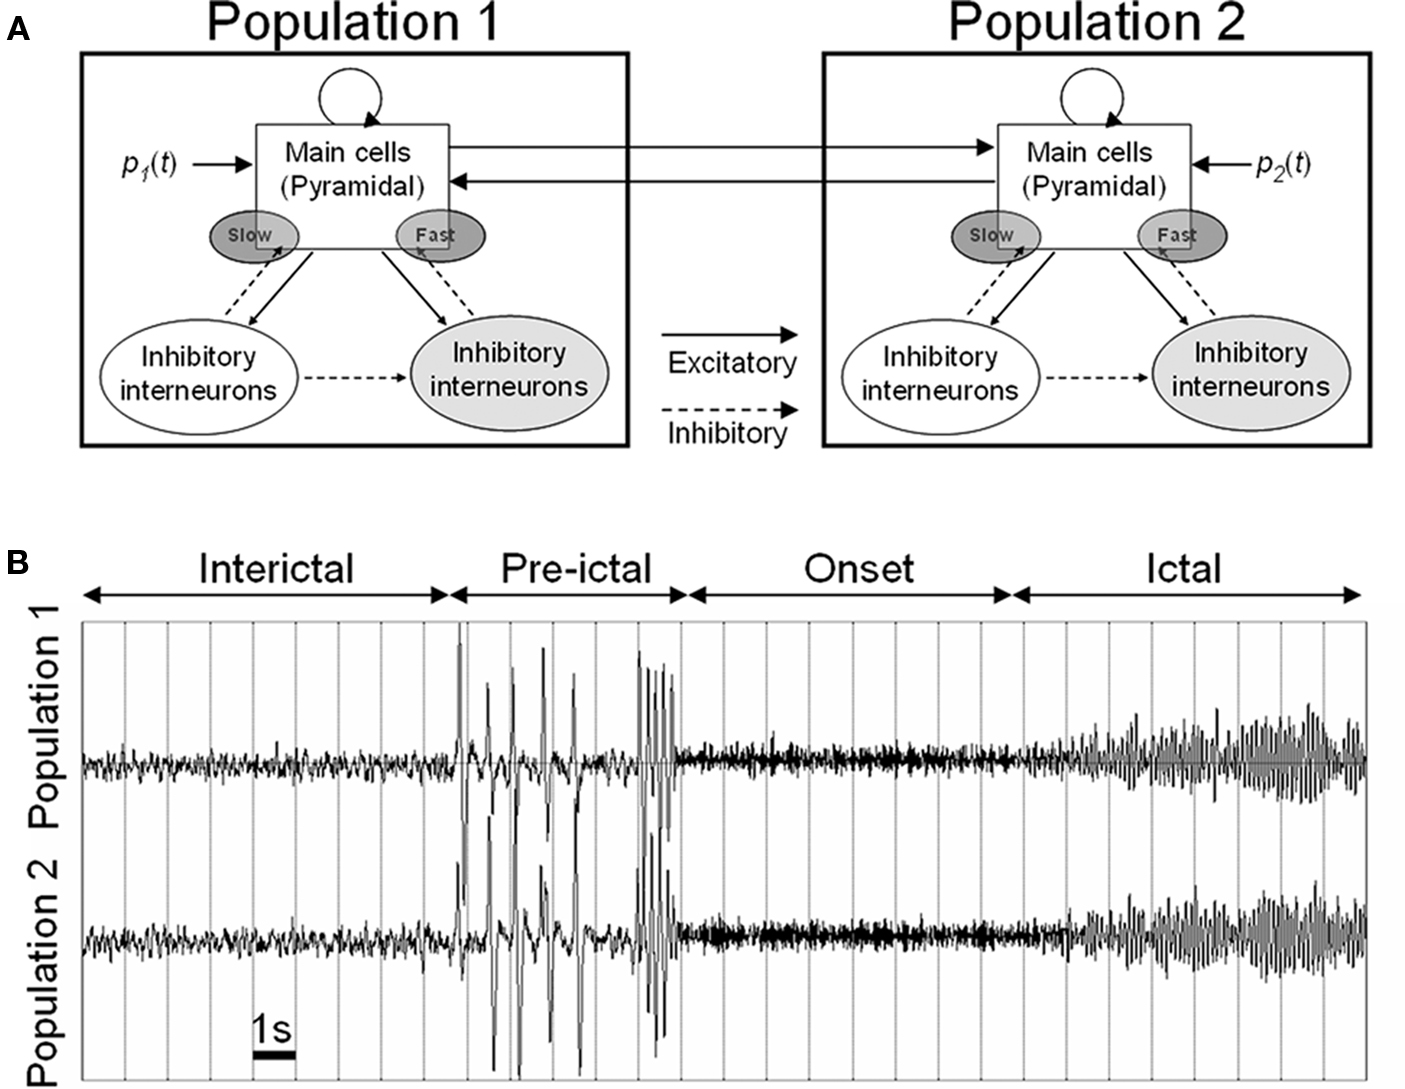
Figure 1. (A) Mesoscopic model of coupled neuronal populations reproducing the activity of two (or more) populations of neurons interacting through excitatory synaptic connections. Each population contains pyramidal cells and local interneurons projecting either to the perisomatic or dendritic region of pyramidal cells. (B) Simulated signals obtained for gradual disinhibition in both neuronal populations (see text for details). This neuronal population model is available at: http://senselab.med.yale.edu/modeldb/showmodel.asp?model=97983.
In the particular context of this study, two important aspects must be underlined. Firstly, this model corresponds to a network of coupled non-linear dynamical systems. Coupling parameters (degree, direction) corresponding to “inter-population” excitatory connections can be tuned. Second, in this network, the behavior of each “node” is governed by “intra-population” parameters, typically the efficacy of excitatory and inhibitory synaptic transmission among local subsets of neurons comprised in the population. These two aspects are illustrated in Figure 1B. In this example, two coupled populations are considered. Inside each population, the scenario is as follows: the excitatory synaptic efficacy is constant but has been augmented with respect to “normal” value while the average IPSP on pyramidal cells is progressively decreased with time. This gradual disinhibition leads to dynamical changes in the system as reflected by simulated signals. Indeed, a first transition from background activity (interictal phase) to spikes (pre-ictal phase) is observed in this simulation. Spikes occur synchronously, they become more frequent and then an abrupt change to higher frequency activity happens (onset phase). This fast activity finally changes into higher-amplitude lower-frequency activity (ictal phase). Such dynamics and transitions match those occurring in depth-EEG signals recorded from limbic structures in temporal lobe epilepsy (TLE) as already reported in (Wendling et al., 2002, 2005) and as briefly described in the next section.
Application to the Identification of Epileptogenic Networks in Partial Epilepsies
Stereoelectroencephalography as a Presurgical Exploration Technique
Among pre-surgical evaluation methods, stereoelectroencephalography (SEEG) permits direct recording of electrical activity from brain structures that are potentially part of the epileptogenic zone. It provides electrophysiological markers of epileptic activities (interictal and ictal) in the form of time series signals with excellent temporal resolution (about 1 ms). The term “stereoelectroencephalography” was introduced by Bancaud et al. (1965) to emphasize the fact that recording of electrical activity is performed within the intracranial space (rather than from the surface) and that stereotaxic determination of the anatomical structures is necessary to “strategically” position intracerebral multi-contact electrodes (Figure 2). The positioning of electrodes is determined in each patient from available non-invasive information and hypotheses about the localization of his/her epileptogenic zone. Implantation accuracy is per-operatively controlled by telemetric X-ray imaging. A post-operative CT scan without contrast product is then used to verify both the absence of bleeding and the precise 3D location of each electrode contact. After SEEG exploration, intracerebral electrodes are removed and an MRI is performed on which the trajectory of each electrode remains visible. Finally, a CT scan/MRI data fusion is performed to anatomically locate each contact along each electrode trajectory. In practice, SEEG is carried out as part of normal clinical care of patients who give their informed consent about the use of data for research purposes.
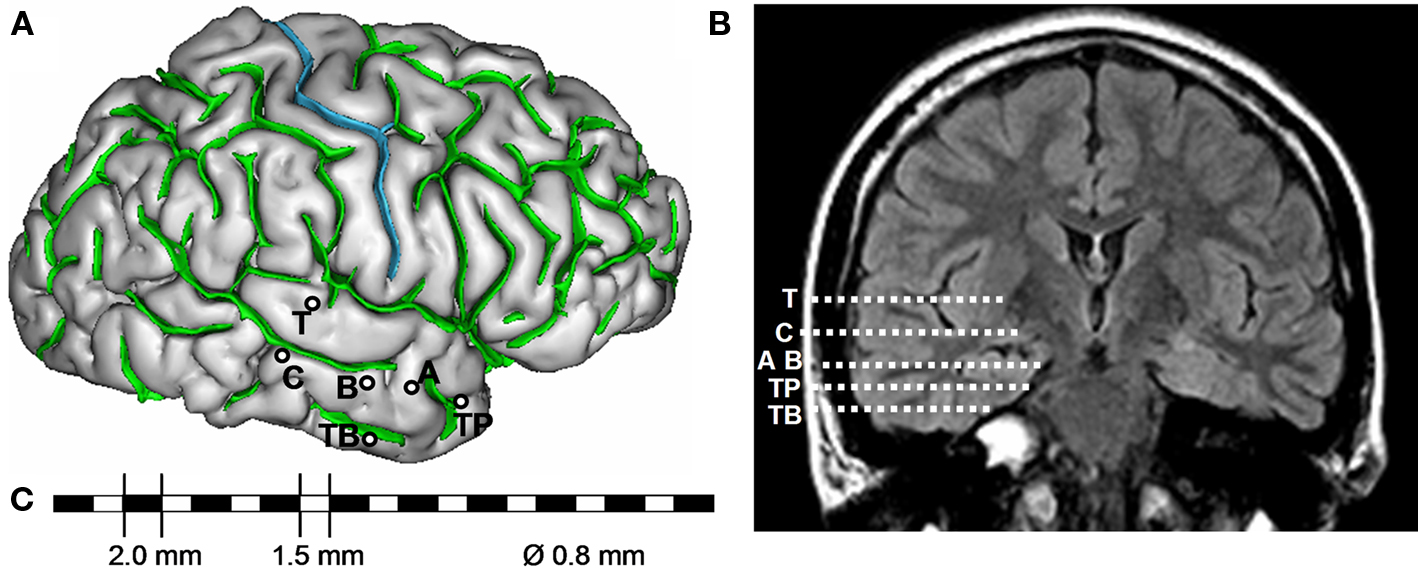
Figure 2. Example of SEEG exploration in patient with mesial temporal lobe epilepsy. (A) Intracerebral implantation scheme. Electrodes are identified by one or two capital letters: A, B and C (medial contacts: amygdala, anterior part of hippocampus, posterior part of hippocampus; lateral contacts: middle temporal gyrus from anterior to posterior part), T (medial contacts, insula; lateral contacts, superior temporal gyrus), TB (medial contacts, entorhinal cortex; lateral contacts, temporo-basal cortex), TP (temporal pole). (B) Electrode trajectories reported on MRI data (coronal view). (C) Each intracerebral electrode is composed of 10–15 cylindrical contacts (length: 2 mm, diameter: 0.8 mm, 1.5 mm apart).
Transition to Ictal Activity in Temporal Lobe Epilepsy (TLE): Description of Intracerebral Electrophysiological Signals
An example of intracerebral SEEG recording is given in Figure 3. In this example, the patient had mesial TLE. Signals were recorded on a 128-channel Deltamed™ system and were sampled at 256 Hz. The only filter present in the acquisition procedure is a hardware analog high-pass filter (cut-off frequency equal to 0.16 Hz) used to remove very low frequency variations of the baseline. For simplicity, only signals recorded from contacts located in the hippocampus (anterior and posterior parts), in the entorhinal cortex, in the amygdala and in the lateral temporal cortex (middle temporal gyrus) are represented in Figure 3. This electrophysiological pattern is very typical in TLE and reproducible in the various ictal episodes of a given patient (Wendling et al., 1996, 1997). Interictal and pre-ictal spikes (generally of higher amplitude) are usually observed in limbic structures (Figure 3A, before seizure onset). They are also observed in lateral structures of the temporal lobe relatively frequently (Wendling et al., 2003). Of particular interest is the activity observed at the onset of seizures. Indeed, in TLE (but not only), the onset of seizures is very often characterized by the appearance of a fast activity (also referred to as rapid discharge) in mesial structures (Figure 3A, seizure onset). This fast onset activity dramatically differs from interictal background activity recorded far from seizure (in time). The salient feature is a re-distribution of the energy of intracerebral EEG signals into higher frequency bands. Typically, in the temporal lobe, the dominant frequency ranges from 20 to 30 Hz (Figure 3B) which corresponds to the low gamma frequency band. The duration of the rapid discharge may vary from patient to patient. Generally, it lasts for 5 to 10 s. Then, as the seizure develops, the signal frequency gradually slows down and the amplitude progressively increases. The activity becomes more rhythmic and more synchronous across the recorded regions. Clinical symptoms generally occur during this “clonic” phase. Finally, seizure termination occurs after a few tens of seconds with respect to onset. A striking and reproducible feature is the “abrupt stop” of the ictal activity simultaneously observed on all channels.
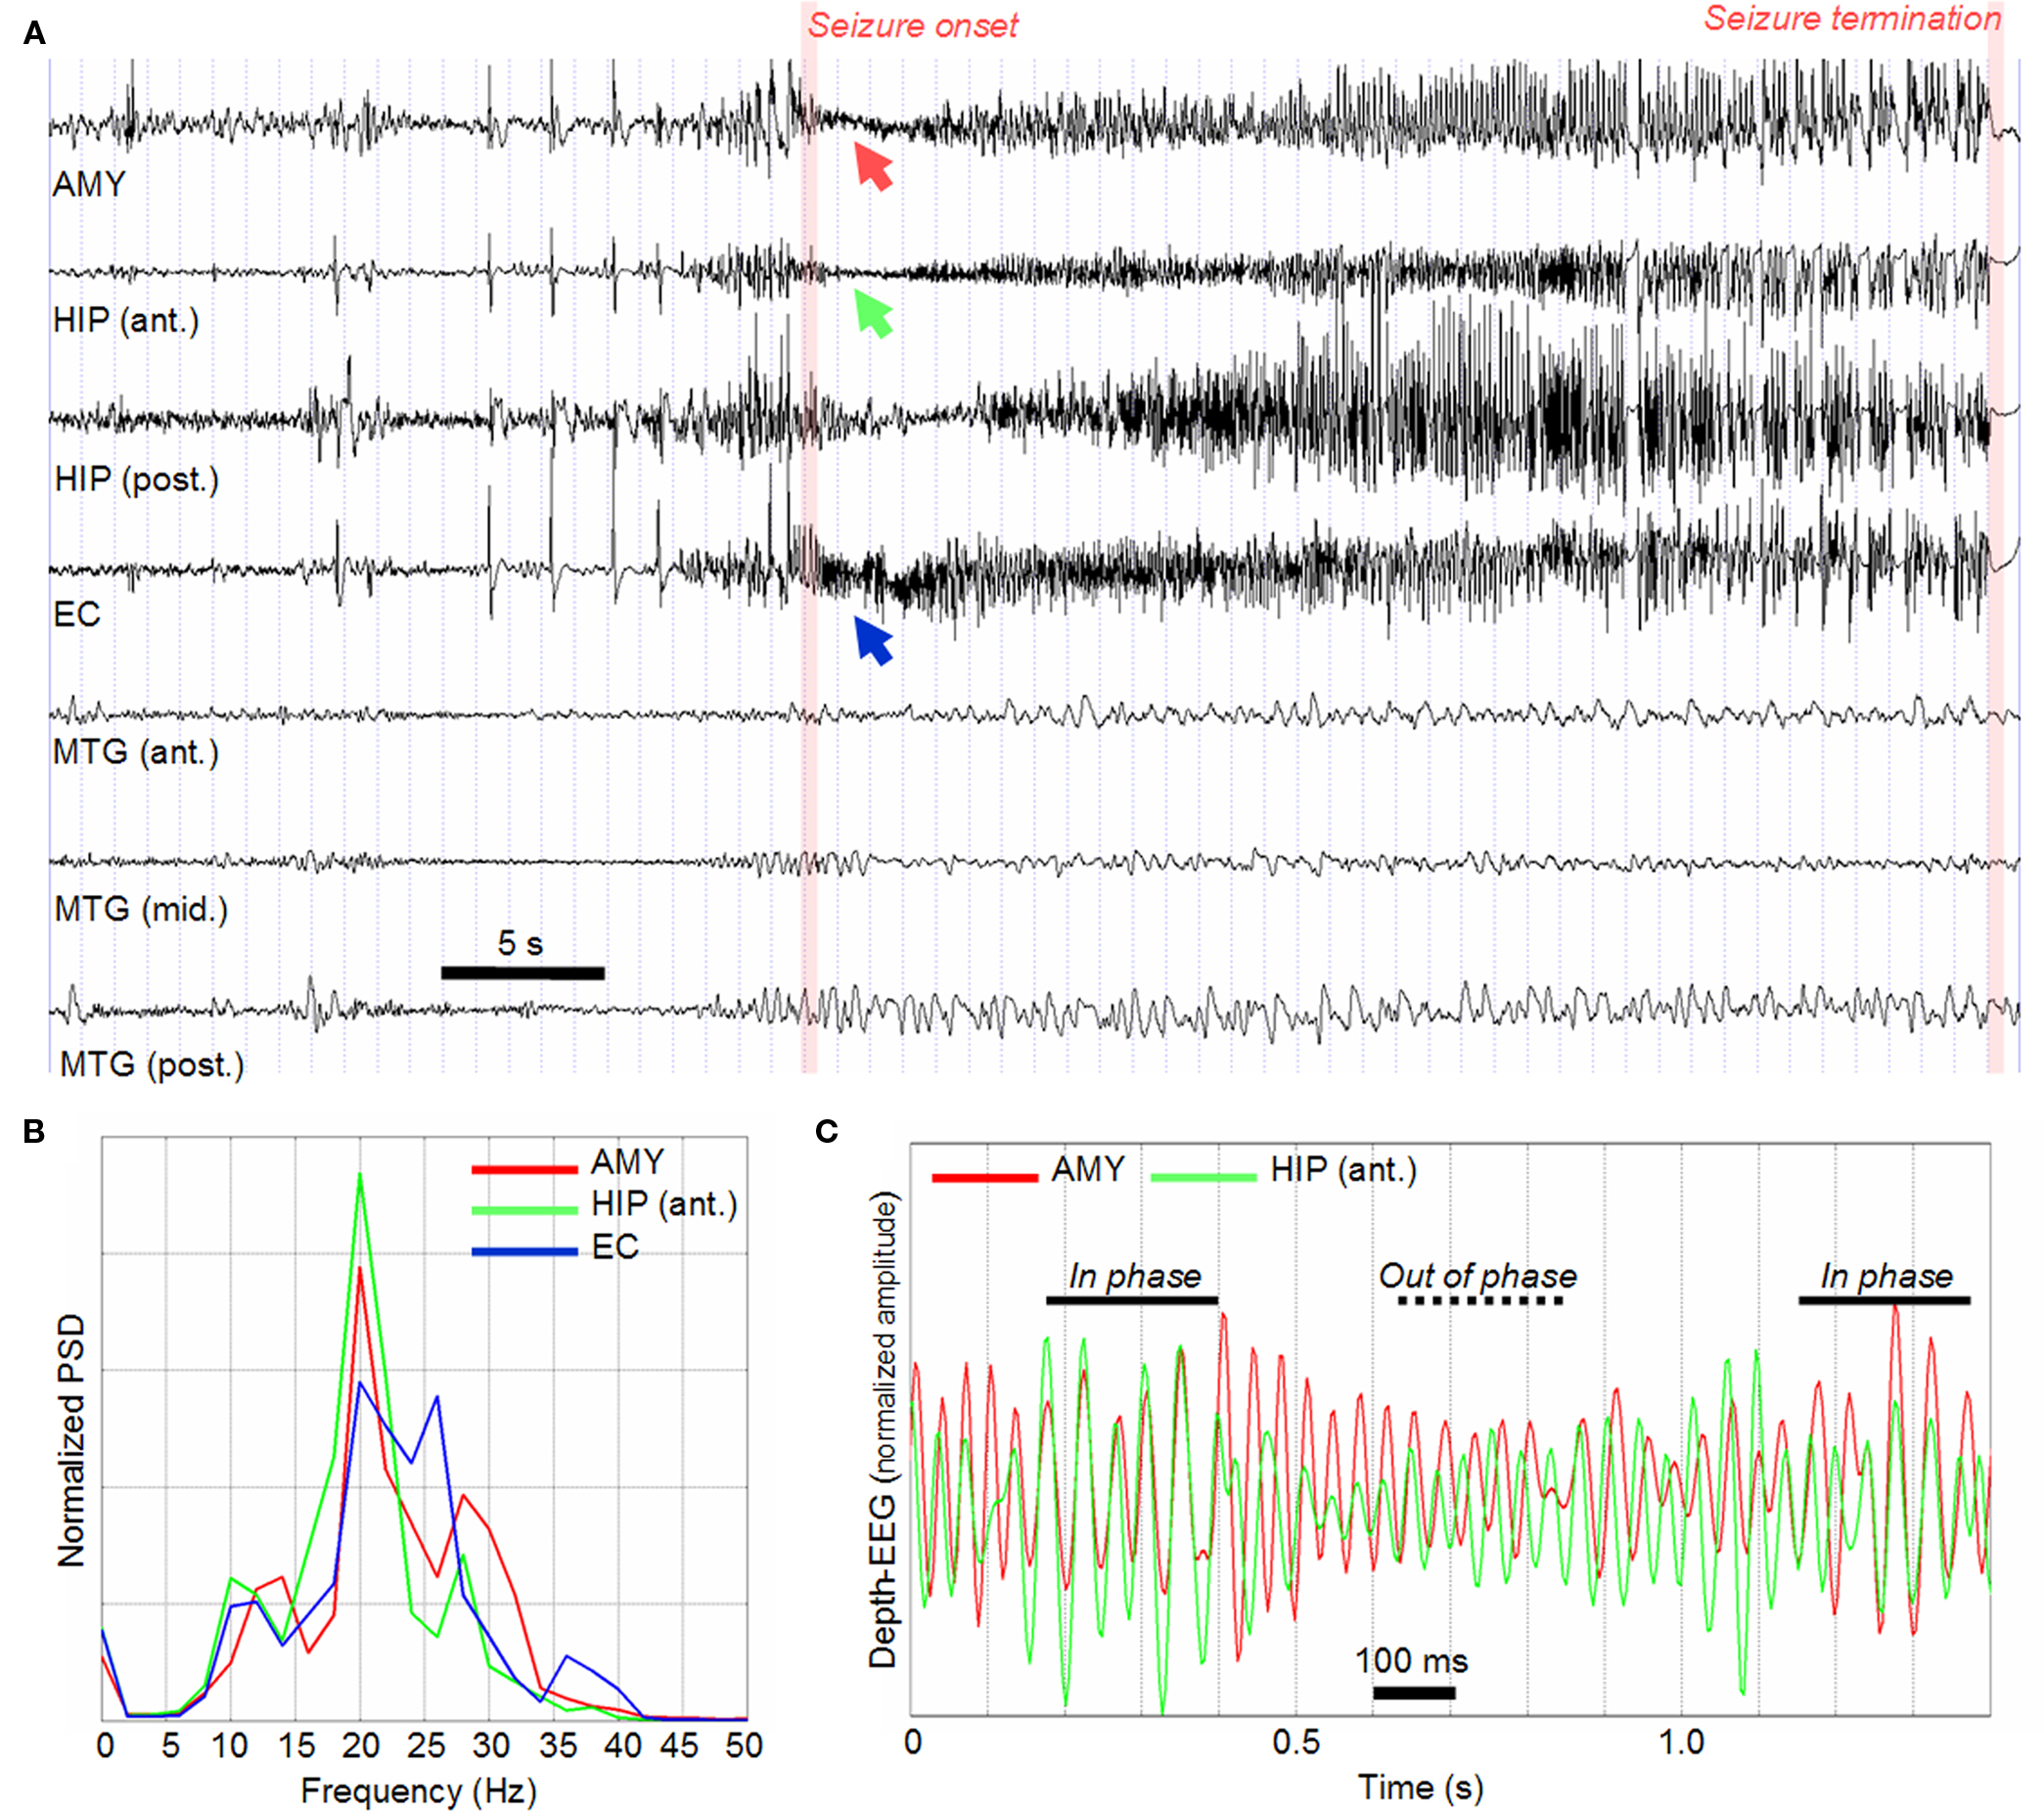
Figure 3. (A) Example of SEEG recording (bipolar signals) performed during transition to seizure activity. Only signals recorded from mesial (AMY, HIP, EC) and lateral (MTG) structures in the temporal lobe are represented. AMY, amygdala; HIP (ant.), anterior part of hippocampus; HIP (post.), posterior part of hippocampus; EC, entorhinal cortex; MTG (ant., mid., post.), middle temporal gyrus from anterior to posterior part). (B) Normalized power spectral density (PSD) computed on the segment of SEEG signal corresponding to seizure onset and where a fast activity (about 25 Hz) is observed. (C) A zoom on the fast onset activity showing that a jitter is present: as time goes on, signals are either in phase or out of phase.
The diversity of dynamics (and transitions of dynamics) observed at the level of depth-EEG signals shows that the epileptic seizure is a complex dynamical process. The seizure onset is particularly important in this dynamical process as it conveys key information about the EZ: what are the involved structures? Why and how are these structures engaged into the fast activity? What is the underlying network and how is it organized? Which “nodes” in this network should be removed in the aim to suppress ictal activity? These are typical questions faced by epileptologists as they analyze EEG recordings. From the signal processing viewpoint, these are particularly difficult questions. Indeed, the seizure onset phase is relatively short (a few seconds) and the number of seizures, in a given patient, is usually limited (typically in the order of 5–10 s). Therefore, statistical significance of computed quantities (whatever the quantity) is always a delicate issue. The close analysis of rapid discharges reveals that they often start quasi-synchronously (Figure 3A). As far as limbic structures are concerned, their frequency content is quite similar, as depicted in Figure 3B which shows the power spectral density (PSD) of signals recorded from the amygdala, the hippocampus, and the entorhinal cortex during the fast onset activity. This PSD reveals that rapid discharges are quite narrow band (15–30 Hz) which is confirmed by the plot in Figure 3C where the “sinusoidal” nature and amplitude modulation of recorded signals can be easily observed. This plot also shows a striking feature of recorded signals: a jitter is present as shown by the alternation of epochs where signals are either in phase or out of phase. By “jitter,” we mean a “phase shift” (between analyzed quasi-sinusoidal depth-EEG signals) that is continuously and randomly changing over the duration of the fast activity. This jitter makes the problem of interpreting the propagation of epileptic activity quite complicated. Indeed, from visual inspection, it cannot be determined whether one signal is in advance – or is delayed – with respect to the other signal.
Application of Non-Linear Regression Analysis to Fast Onset Activity
This section illustrates the behavior of non-linear regression analysis as applied on the fast activity recorded at the onset of seizures (as described above). The non-linear correlation coefficient h2, the time delay, and the direction index were computed on signals recorded from the amygdala (AMY), the anterior hippocampus (HIP, ant.) and the entorhinal cortex where rapid discharges could be observed (Figure 3). The three pair-wise combinations (AMY vs. HIP, AMY vs. EC, and AMY vs. HIP) were considered.
In order to assess the statistical significance of measured quantities, we compared the statistical distributions of the h2 values, as computed over the seizure onset period and over the interictal period that precedes the seizure. As these distributions are not normal, a possible approach is to compare the means of Z-transformed variables via t-tests. Indeed, it can be shown that the variable w = 1/2 × log((1 + r)/(1 − r)) (Eq. 3, where r denotes the linear correlation coefficient) follows a Gaussian distribution. However, it is worth to mention that this transformation cannot be readily applied in the case of non-linear correlation values, as those computed in the example shown in Figures 3 and 4. Indeed, the r quantity takes values in the interval [−1, 1] and is therefore mapped into the interval ]−∞, +∞[. Conversely, the non-linear correlation coefficient h2 is strictly positive (see Eq. 1). Therefore, using Eq. 3, it will be mapped into the R + = ]0, +∞[ interval and theoretically can never follow a normal distribution. To deal with this issue a solution is to set the variable r equal to (2 × h2 − 1) in Eq. 3. This transformation is such that r takes values in the interval [−1, 1] and that w = 1/2 × log (h2/(1 − h2)) takes values in ]−∞, +∞[ with a distribution that can be assumed to be Gaussian (verified on empirical histograms). In addition, it worth mentioning that the time delay and direction index can only be interpreted in the situations where the h2 coefficient is significantly high. Indeed, analyzing those quantities is meaningless when there is no relationship between recorded brain sites.
Results are summarized in Figure 4 which shows the behavior of estimated quantities. Note that the h2 coefficient and the time delay were computed according to the two possibilities: dependence of the first signal on the second one (Figure 4, solid line) and vice versa (Figure 4, dash line). First, results showed that for the two first pairs (AMY vs. EC, Figure 4A) and (HIP vs. EC, Figure 4B), the behavior of computed quantities is similar. First, the h2 values averaged over the duration of the fast discharge were found to be significantly higher (AMY vs. EC: p = 5.706e−3, HIP vs. EC: p = 8.743e−3) than those computed on interictal activity. Second, time delays were found to be relatively stable over this seizure onset period as the direction index that is negative in both cases, indicating that the direction of coupling was more likely to be from the EC toward the AMY (Figure 4A, fourth plot) and from the EC toward the HIP (Figure 4B, fourth plot). Results were quite different regarding the third pair (AMY vs. HIP, Figure 4C). The average h2 values were not found to be different from those computed during interictal activity (AMY vs. HIP: p = 0.215). Second, time delays were found to be unstable as continuously varying from positive to negative value. This resulted in a direction index which stayed close to 0 and which was more difficult to interpret in term of effective connectivity.
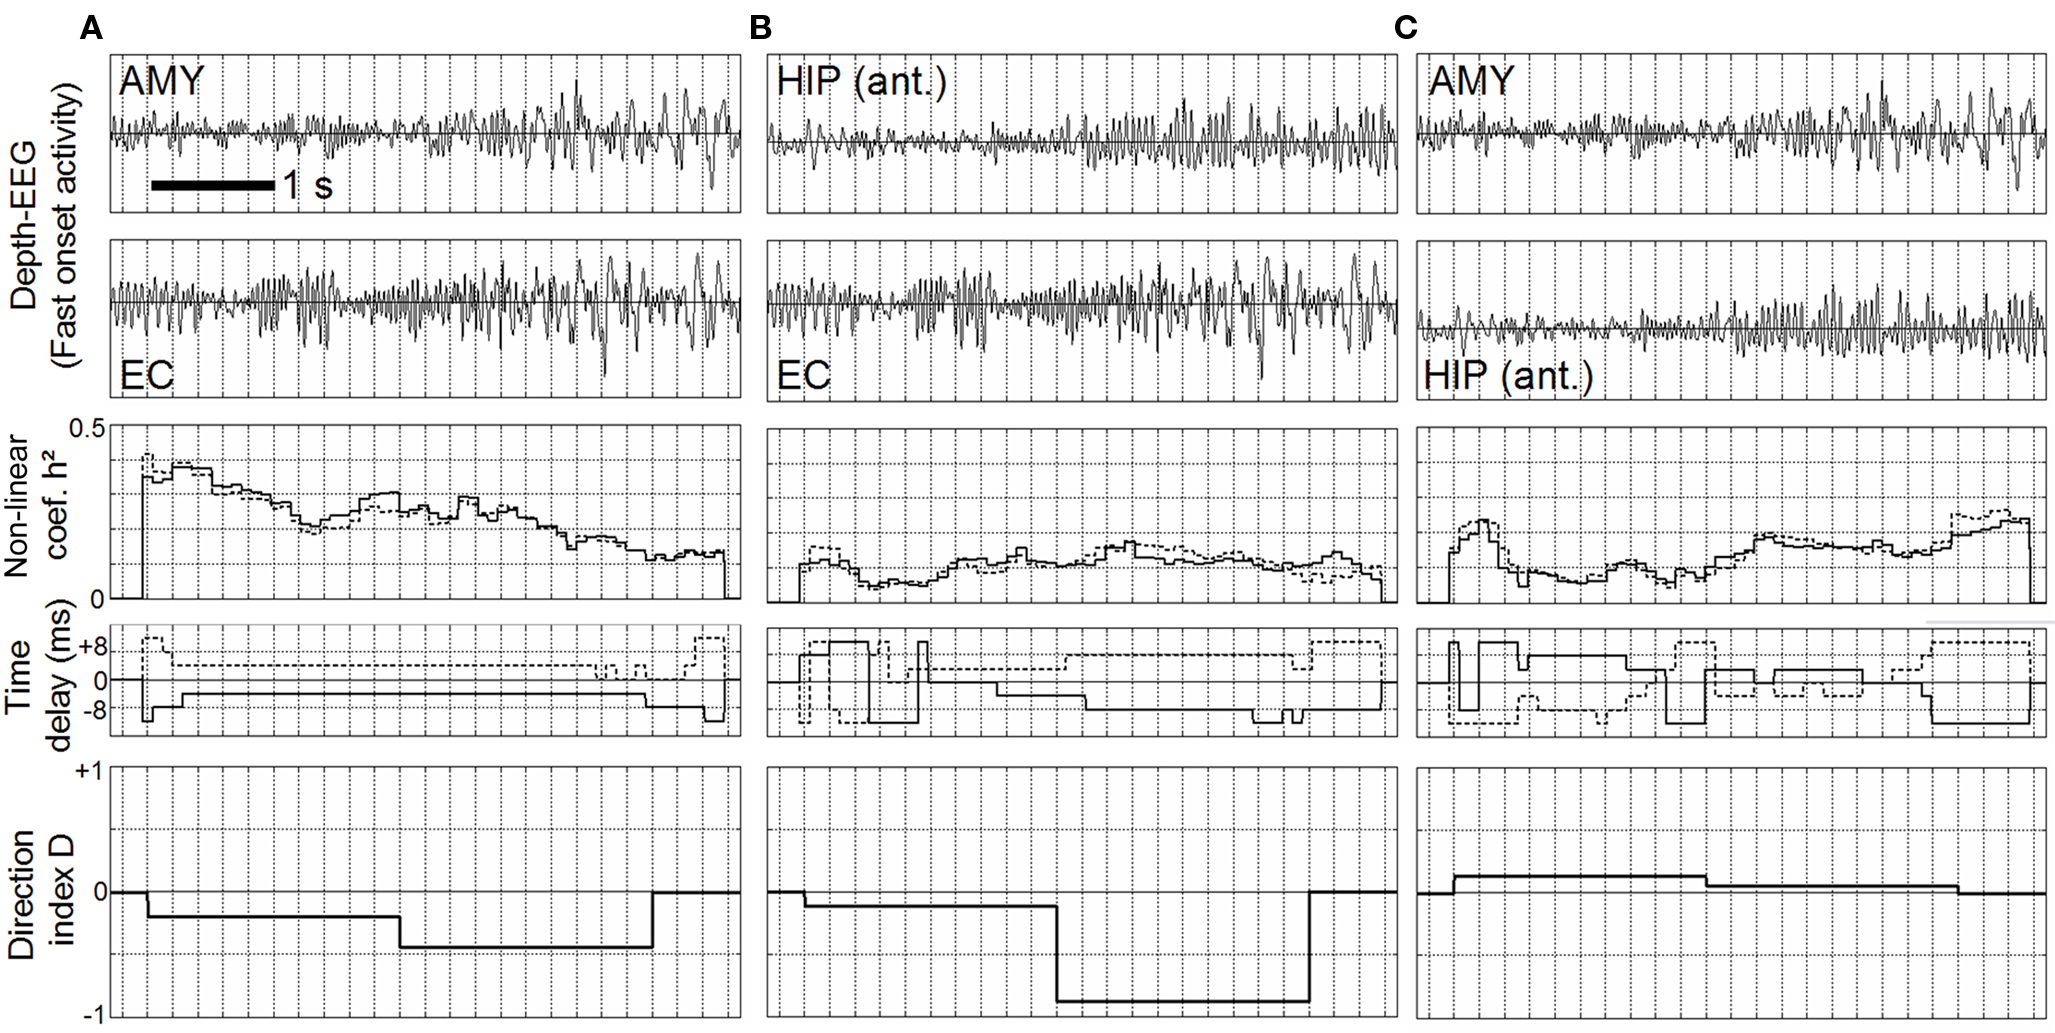
Figure 4. Non-linear regression analysis applied on real EEG signals according to a pair-wise procedure (AMY vs. EC (A), HIP vs. EC (B), AMY vs. HIP (C)), during the fast onset activity. Left, middle: h2 coefficient values are significantly high (**) compared to values measured during interictal periods. Time delays (solid line: upper signal vs. lower, dotted line: lower signal vs. upper) are stable. Direction index is lower than 0 indicating that lower signal is driving the upper signal. Right: Time delays are unstable and direction index stays close to 0, providing no clues about the direction of coupling.
This example (typical of mesial TLE) shows the difficulty of interpreting connectivity measures performed on intracerebral EEG data. Indeed, we are facing situations where computed quantities exhibit different behaviors. As described in the next section, data simulated from models in which (i) the excitability of neuronal populations and (ii) the underlying connectivity among these populations are known a priori may help this interpretation.
Model-Based Interpretation of Connectivity Measures at Seizure Onset
In this section, we report results about the behavior of non-linear regression analysis (h2, time delay and direction index measures) as applied on signals simulated from two coupled neuronal populations. Simulations were performed under two constraints: (i) the spectral content of simulated signals matches that of real signals and (ii) a jitter similar to that observed in real data is also present in simulated signals.
Results are reported in Figure 5. A first general result is that the model could generate a fast activity (about 25 Hz, as observed) at the level of both populations if, and only if, the ratio between excitation and inhibition was increased such that the populations of neurons become “more excitable.” Note that this result is not new. It was already shown (Wendling et al., 2002, 2005) that decreased inhibition (at the level of GABAa,slow receptors on pyramidal cells) leads to a dramatic change in the model: the fast feedback inhibitory loop (involving GABAa,fast receptors on pyramidal cells) becomes very active and leads to the generation of fast IPSPs on pyramidal cells (GABAa,fast receptors). These IPSPs dramatically affect the LFP by adding higher-frequency components.
Starting from this “increased excitability” condition at both populations, we found three situations where the model could generate signals with the aforementioned constraints.
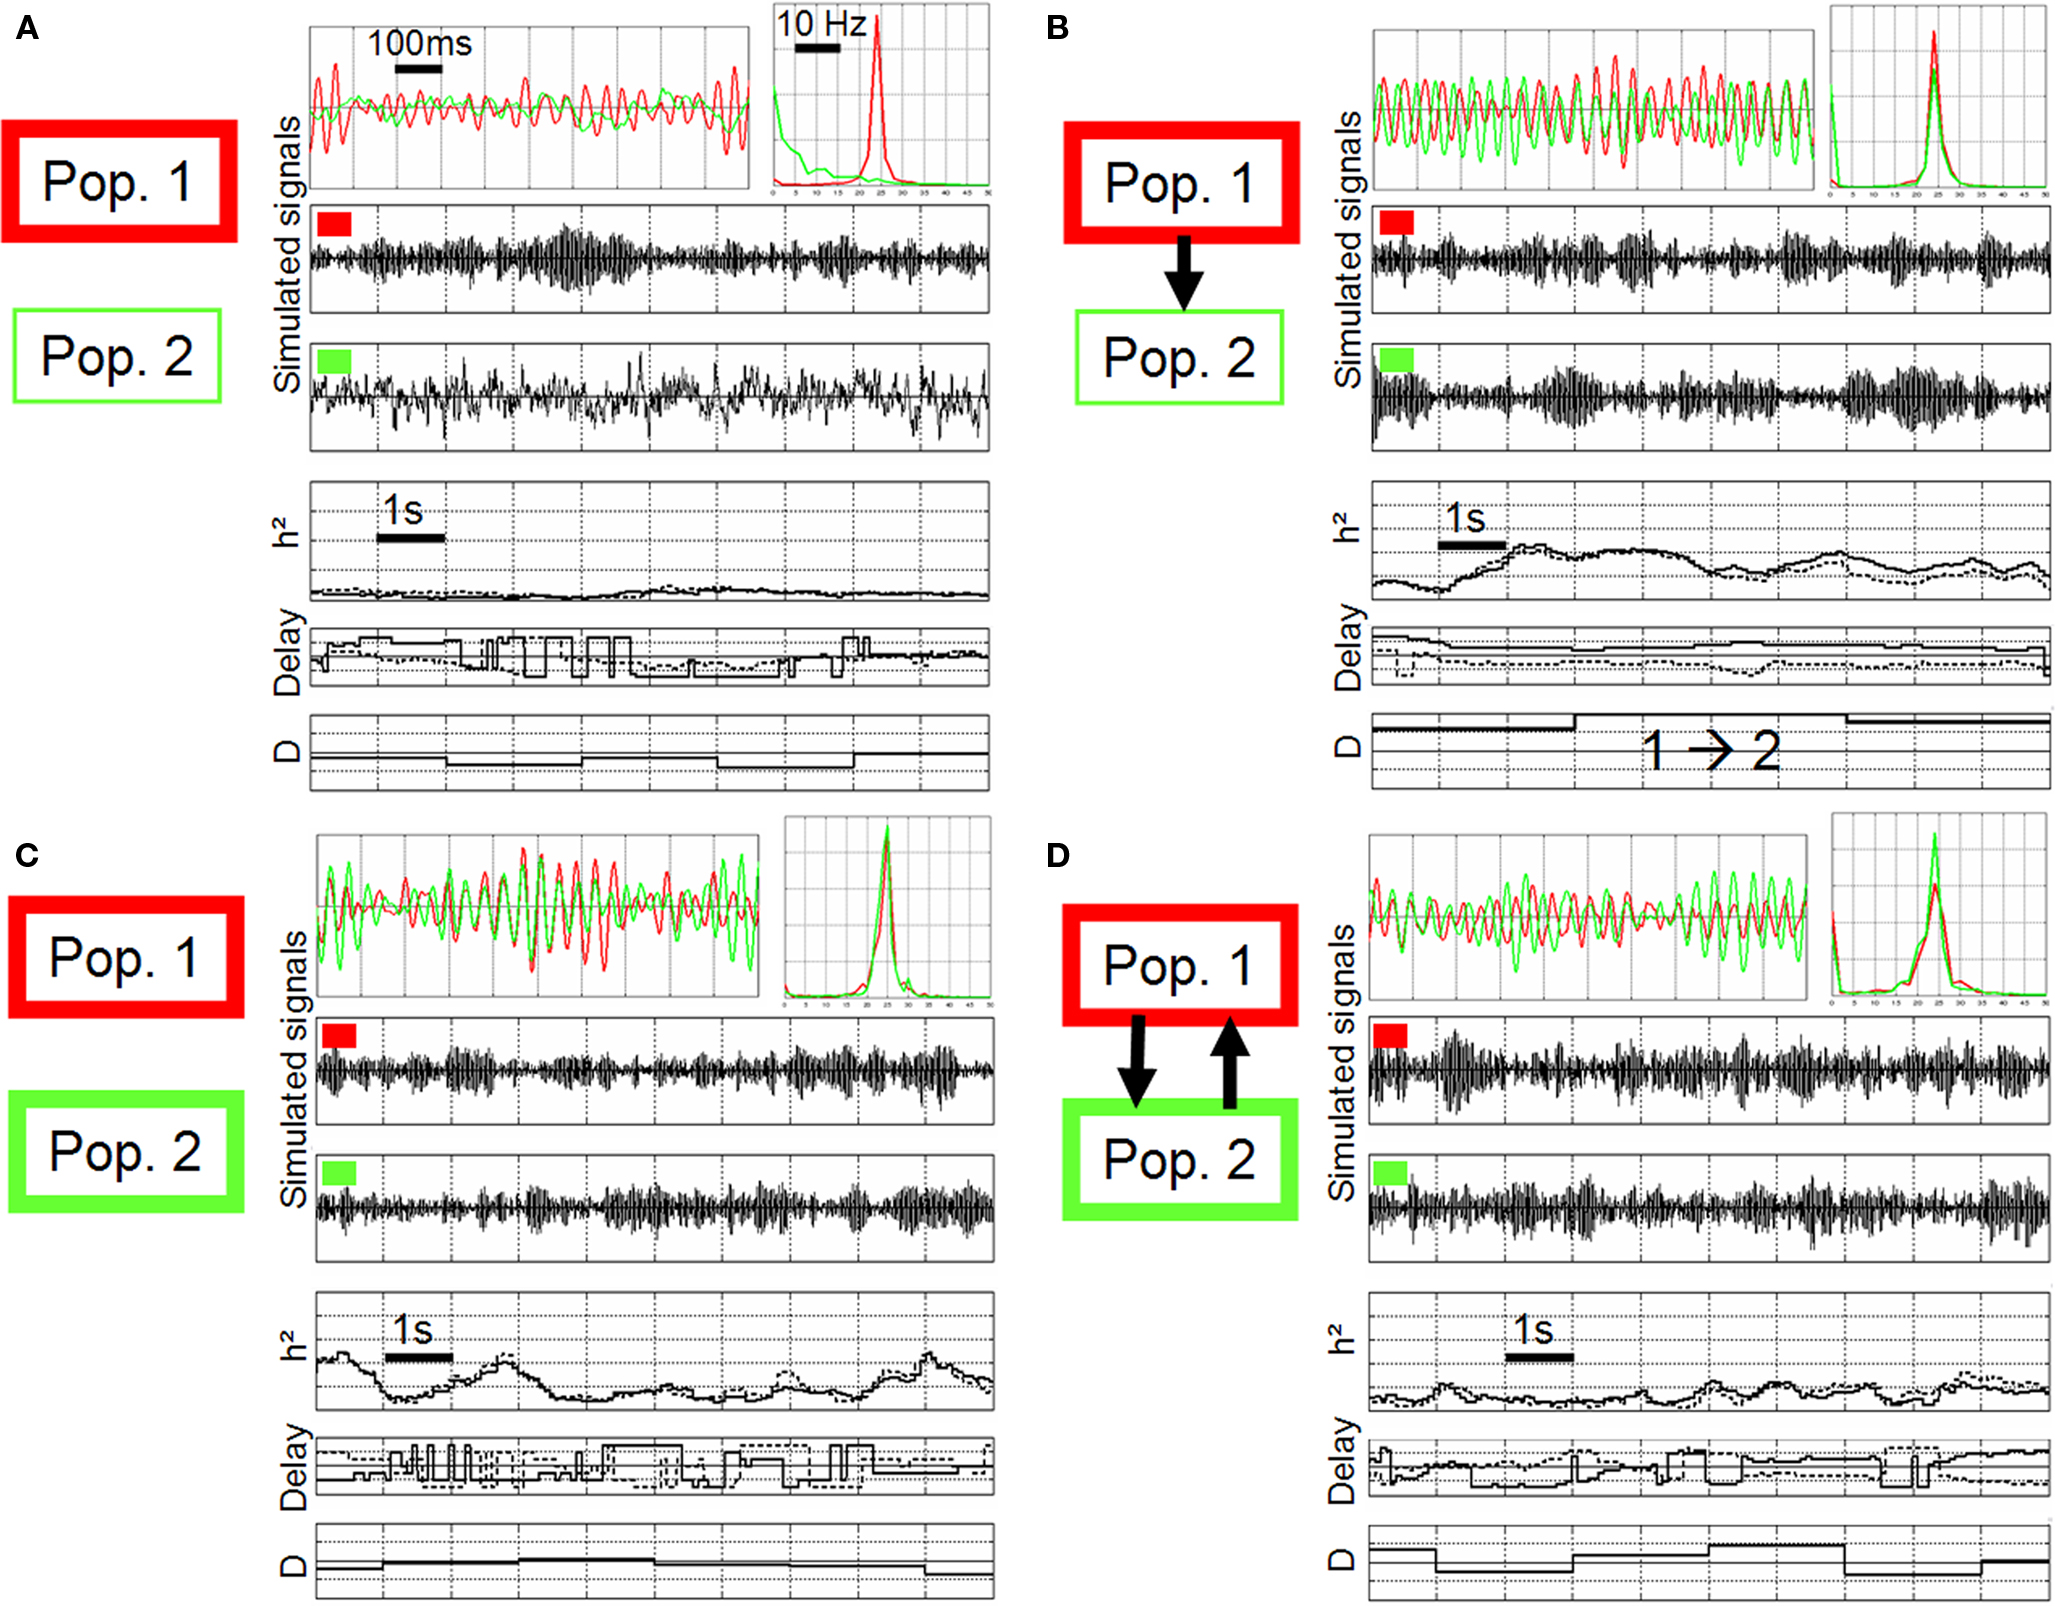
Figure 5. Non-linear regression analysis applied on simulated signals, using the same method settings compared to Figure 4. (A) Different scenarios were considered regarding the intrinsic excitability of neuronal populations (thin line: excitability increased, thick line: excitability more strongly increased) and regarding the connectivity (no coupling, unidirectional coupling, bidirectional coupling). (B–D): both populations generate a fast activity (about 25 Hz) and a jitter is observed between simulated signals (red vs. green) as in real signals. Note that the behavior of non-linear regression analysis (h2 coefficient, time delays, direction index D) depends on the modeled situation (see text for details).
The first situation is displayed in Figure 5B where excitability was strongly increased in population 1 (thick red rectangle) and less strongly in population 2 (thin green rectangle) and where population 2 received excitatory input from population 1 (unidirectional arrow). Note that without this excitatory drive, population 2 did not generate a fast activity, as shown in Figure 5A. In other words, the fast discharge in population 2 “is caused by” the input from population 1. In this situation (Figure 5B), a significant increase of the h2 value could be measured with respect to the uncoupled situation (Figure 5A). Time delays were found to be quite stable and symmetric. Finally, the direction index was strictly positive, clearly indicating an influence of population 1 on population 2.
The second situation is displayed in Figure 5C. Here, populations were uncoupled but excitability was strongly increased in both populations such that they both generated a fast activity “intrinsically”. It can be depicted that the behavior of measured quantities is different compared to the previous situation. The h2 values were lower and the variance strongly increased. Time delays were found to be very unstable, continuously reversing as time goes on. Conversely, the direction index D was more stable and centered around 0. It did not indicate a preferred direction in the coupling between population 1 and population 2.
The third situation is illustrated in Figure 5D. Here, excitability was increased and both populations mutually interacted. For each population, the excitatory input from the other population was such that it generated a fast activity. Again, and as the underlying scenario changed, measured quantities behaved in a different manner compared to previous situations. Strikingly, the h2 values measured in a situation where neuronal populations are bi-directionally coupled were even lower compared to the previous uncoupled situation (Figure 5C). Time delays were also found to be very unstable. Finally, the direction index was also close to 0 but the variance was higher compared to the uncoupled situation. In order to assess the statistical significance of results, we generated long-duration simulated signals (400 s) from which we could evaluate the asymptotic behavior (mean and standard deviation) of measured quantities. Results are summarized in Figure 6. They corroborated those obtained on shorter duration segments. The most salient finding is that there was only one situation, among the three analyzed situations, for which measured quantities provided a non-ambiguous result. This situation is that presented in Figure 5B and corresponds to the case where population 2 generated a rapid discharge, due to the excitatory drive from population 1.
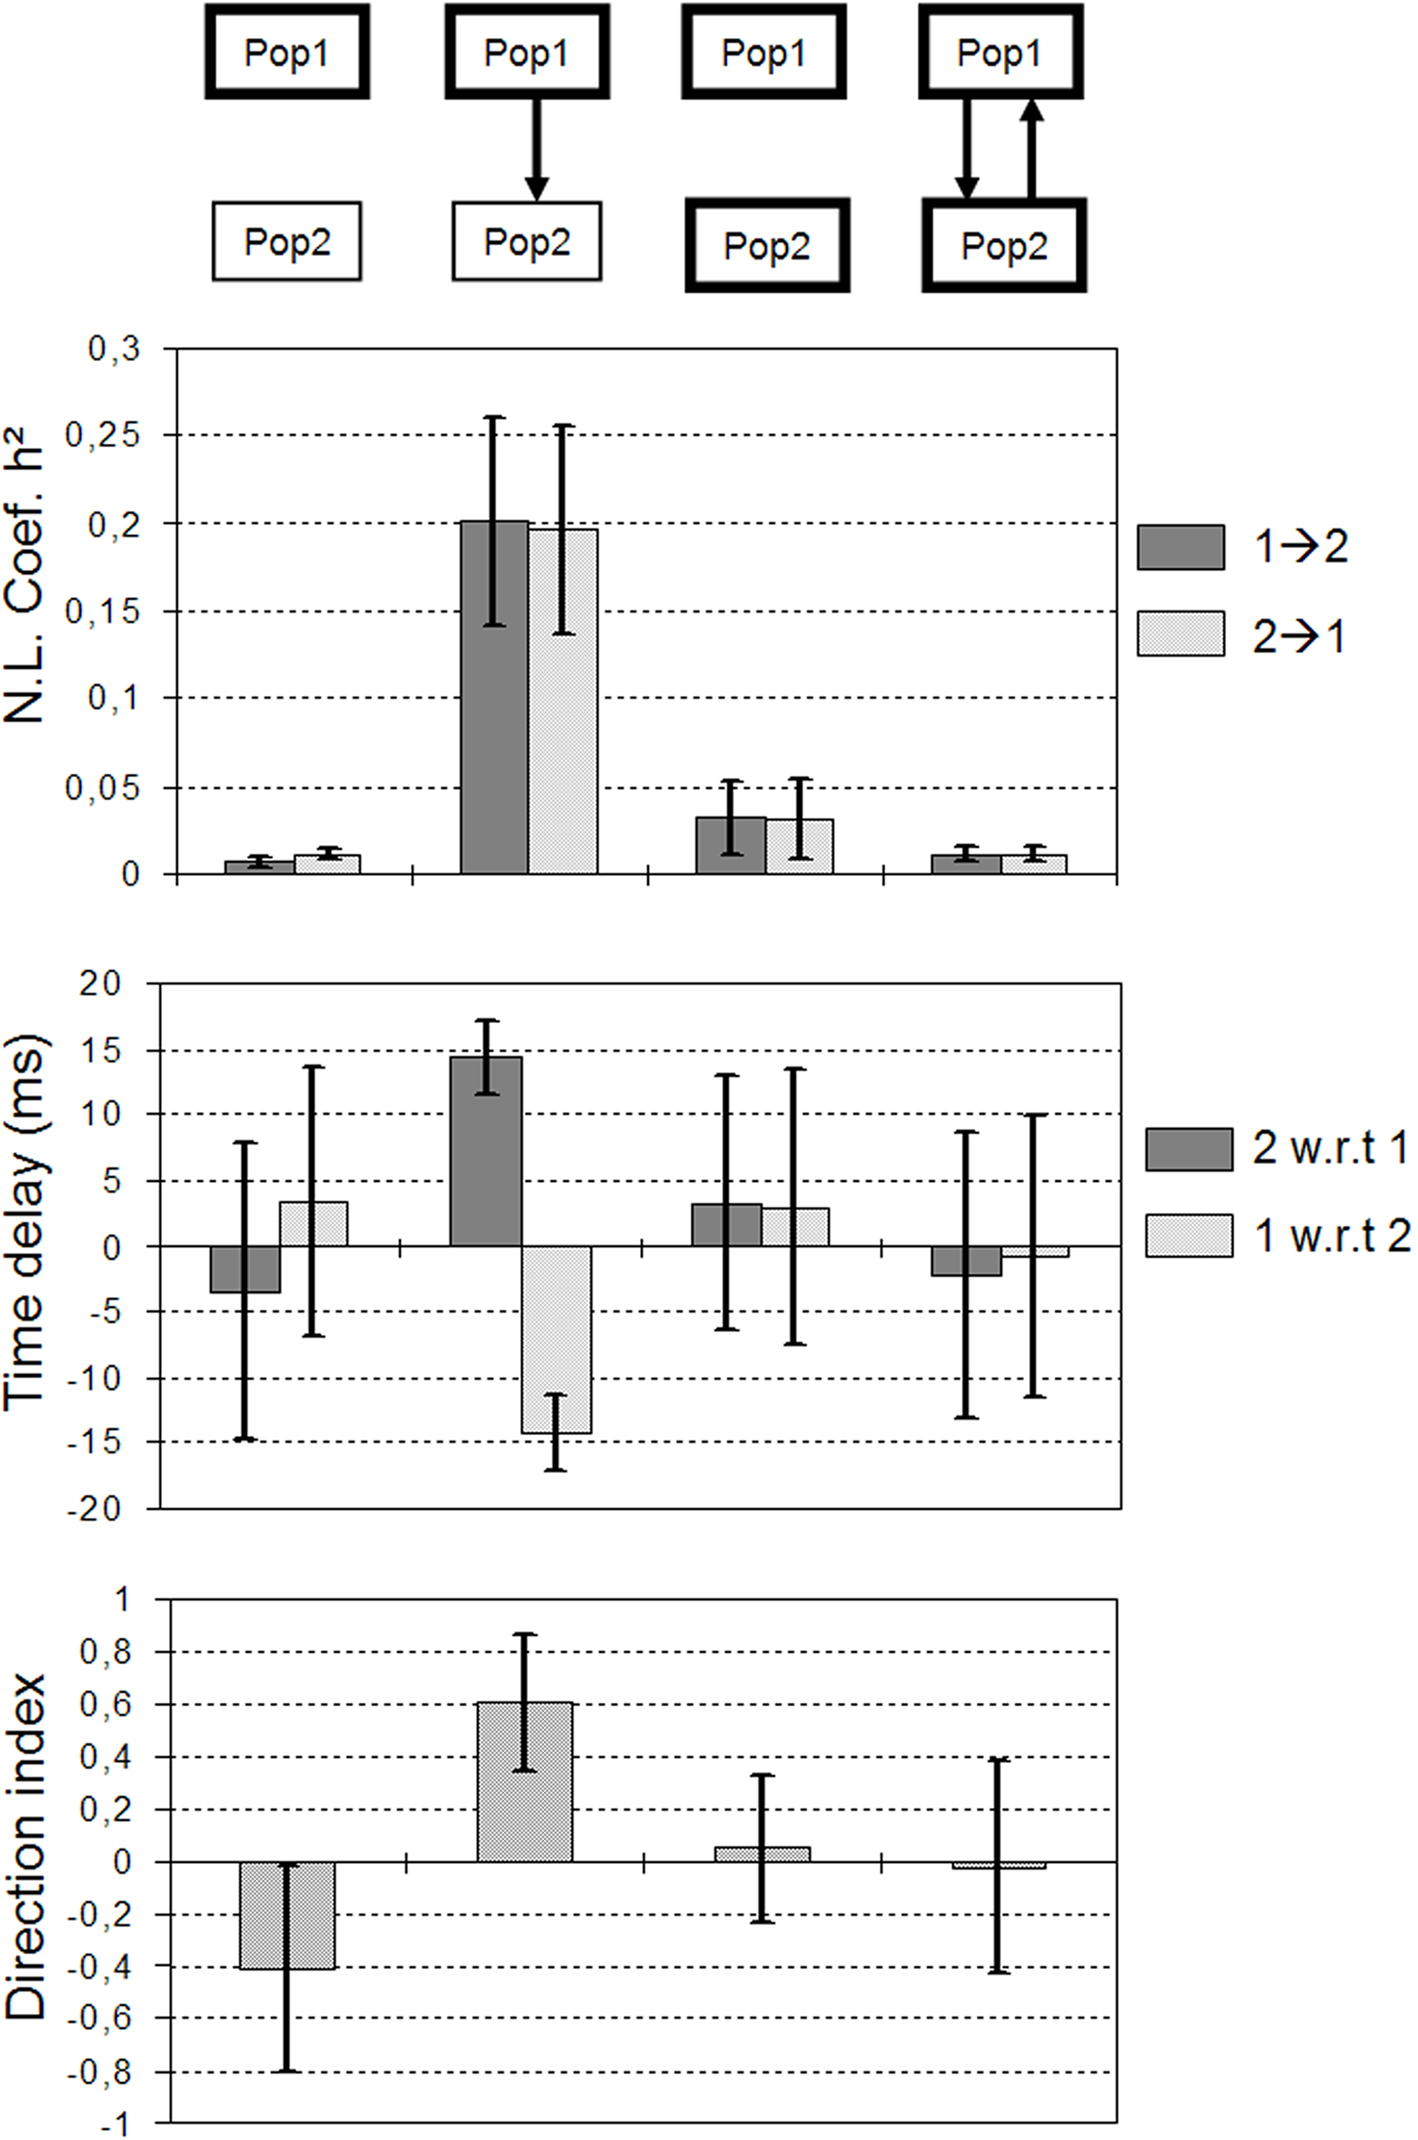
Figure 6. Asymptotic behavior (mean and standard deviation computed over 500 s) of measured quantities in the four situations considered in Figure 5. For one situation measured quantities provide a non-ambiguous result. It corresponds to the case where population 2 generates a rapid discharge, due to the excitatory drive from population 1 (see also Figure 5B).
Therefore, according to the above simulation results, a possible interpretation of the underlying network organization in the example of real data show in Figure 3 is as follows. In the three recorded structures (AMY, HIP, and EC), excitability would be increased with respect to normal condition. The disinhibition in the entorhinal cortex would lead to the generation of a fast activity. Then, measured h2 values (functional connectivity), time delay and direction index (effective connectivity) would indicate that the EC is driving the fast activity observed in the two other structures (AMY and HIP).
Discussion
High frequency oscillations occurring at the onset of epileptic seizures have long been considered as a potentially valuable marker of the epileptogenic zone (EZ), usually defined as the subset of brain structures involved in the generation of seizures. These oscillations, also referred to as “fast onset activity” or “rapid discharges” (Allen et al., 1992; Alarcon et al., 1995; Wendling et al., 2003) have been recognized to be one of the most characteristic electrophysiological patterns of the EZ in focal epilepsy (Bancaud et al., 1965). Several experimental (Traub et al., 2001; Uva et al., 2005; Gnatkovsky et al., 2008; de Curtis and Gnatkovsky, 2009) and computational modeling (Wendling et al., 2005) studies demonstrated the existence of a relationship between the epileptogenicity of the neuronal tissue and its propensity to generate fast oscillations at seizure onset. From clinical viewpoint, resection of regions with rapid discharges has also been found to favorably influence the surgical prognosis (Alarcon et al., 1995). A striking feature of rapid discharges is that they always involve distinct – and possibly distant – brain structures, either in a quasi-synchronous or a more delayed manner. Based on these observations, an index, called epileptogenicity index, was recently proposed (Bartolomei et al., 2008a). This index accounts for both spectral (occurrence of fast oscillations) and temporal (delay of occurrence with respect to seizure onset) properties of intracerebral EEG signals to quantify the epileptogenic nature of recorded neuronal systems.
However, the mechanisms of seizure generation and propagation remain elusive. A number of studies have used signal processing techniques (in particular those able to characterize the underlying connectivity) in order to characterize the seizure dynamics from intracerebral EEG data (Gotman, 1987; Lieb et al., 1987; Mormann et al., 2003; Schindler et al., 2007; Bartolomei and Wendling, 2009). The intent of this paper was to also address this issue with a particular focus on the mechanisms involved in the generation of fast activity at the onset of seizures. We assumed that the epileptogenic zone is organized as a network of distributed neuronal populations with altered excitability properties and then study how a simple computational model (two (un)coupled populations) could help us to better interpret connectivity (functional and effective) measures performed on real signals (intracerebral EEG). The main findings of this study are discussed hereafter.
First, what do we learn from this apparently simple model? This question is always raised in any study involving modeling aspects. In the present work, the first insight is that rapid discharges with properties that are similar to those observed in real signals can be generated from different model configurations, in terms of level of excitability (moderate vs. major increase) in the two considered populations and connectivity pattern (no coupling, unidirectional coupling or bidirectional coupling). Indeed, we managed to generate signals that not only have a realistic spectral content but also in which a random phase jitter (instability of the phase difference between signals) is observed. The second insight is that the level of excitability is a crucial parameter. In the network, only the “nodes” with decreased inhibition (i.e., increased excitability) can be involved in the fast onset activity. The tricky question is then related to the mode of involvement of neuronal populations into the fast run. This question leads to the third insight. Our model shows that there are basically two situations. According to the first situation, the level of excitability in one population is so high that this population “autonomously” generates a fast activity. Of course, this population can have excitatory connections to distant populations (typically on the sub-population of pyramidal cells). When the excitability in these “remote” populations is altered (i.e., also increased), the model shows that they can be “driven” into the fast activity mode. Formally, this “entrainment” would correspond to an external perturbation that continuously drives the target dynamical system away from its “normal” behavior. It is noteworthy that the driven neuronal population does not become unstable as the removal of the external input leads it to return back to “normal background activity”. According to the second situation, the level of excitability in considered populations is such that they autonomously generate a fast activity. In this case, the influence of couplings is much more difficult to determine and would deserve, in itself, a detailed analysis.
Second, what do we learn from signal analysis methods aimed at characterizing the connectivity? It is difficult to answer this question as only one method, among the many methods presented in section “From EEG signals to brain functional connectivity: a brief overview”, was applied on real and simulated signals. In the following we will thus emphasize results we obtained regarding non-linear regression analysis which could provide interpretable results in the first studied situation. A first interesting aspect in this method is that it does not require strong assumptions about the properties of analyzed signals (broadband vs. narrow band, for instance) nor about the nature of the relationship between these signals (linear, non-linear, phase, or amplitude). The only restriction is that the duration of the sliding window (which defines the number of independent (X,Y) pairs of amplitude values) is large enough to correctly estimate the non-linear fitting curve h in Eq. 2. A second interesting aspect is that this method was able to provide reliable results in a complicated situation where the phase difference between signals is continuously varying. On simulated signals, we could obtain statistically significant results regarding the mean non-linear correlation coefficient, time delays (as measured in both directions) and direction index values. Indeed, measured quantities could be related, without ambiguity, to the underlying organization (population 2 receives excitatory input from population 1). Nevertheless, this result also means that there exist some situations where this method cannot provide univocal interpretation of recorded signals. Two examples were presented in this study corresponding to two situations where both neuronal populations generate a fast activity. In this case, we could not determine, from measured quantities, whether or not the two populations are coupled. Therefore, these results show that one should be cautious with the interpretation of connectivity measures, as already mentioned in several studies (Horwitz, 2003; Wendling et al., 2009). In particular, they show that deriving relevant information regarding the underlying effective connectivity is particularly difficult in the situations where the non-linear correlation coefficient is low.
From the physiological viewpoint, these results also show that the notion of “propagation of rapid discharges” should be clarified. Indeed, in some cases, the fact that rapid discharges are observed at different brain sites, is not due to propagation but, instead, to quasi-synchronous involvement of neuronal populations. According to this view, an epileptogenic network would include two types of “nodes,” both having a capacity to generate fast activity due to altered excitation- and/or inhibition-related mechanisms. Some nodes could spontaneously generate rapid discharges and could “drive” some other nodes which would act as “relays” of those rapid discharges. For instance, in real signals shown in this study, the entorhinal cortex would belong to the first category whereas the hippocampus and amygdala would go in the second. This latter point leads us to a frequently asked question: how are functional, effective and anatomical connectivity related one with another? This is still a challenging question that cannot be answered in this study. However, it can be noticed, in the chosen example, that the entorhinal cortex has direct anatomical projections (temporo-amonic pathway) to the hippocampus (see, for instance, Witter and Wouterlood, 2002 for detailed description). Projections to the amygdala are less clear. Some detailed studies were performed in the cat using tract-tracing techniques (Russchen, 1982a,b; Witter and Groenewegen, 1986; Witter et al., 1986). As in the rat (Brothers and Finch, 1985; McDonald and Mascagni, 1997), results showed entorhinal–amygdala projections arising primarily from deep layers of the lateral entorhinal cortex. Although little is known about details of the projection of the entorhinal cortex to the amygdala in primates, such a pathway has been hypothesized in human based on neuronal responses evoked by electrical stimulation (Wilson et al., 1990, 1991). Besides these in vivo studies, functional connections as well as spread of epileptic activity were also studied in vitro, using slice preparations (rat brain) which preserve the connectivity between the hippocampus and the entorhinal cortex (Rafiq et al., 1993) and also with the amygdala (Stoop and Pralong, 2000). These studies confirmed the existence of reciprocal connections between hippocampus and entorhinal cortex. In addition, it was found that bursting epileptic activity could spread via two different pathways, either from entorhinal cortex or hippocampus and both toward the amygdala.
To end with this discussion, one should also mention the limitations of this study that lead, in fact, to open issues that should be addressed in the future. First, scenarios involving more than two coupled neuronal populations should be investigated, keeping in mind that the number of combinations becomes rapidly high with the number of populations and with the various ways of inter-connecting populations. Second, an interesting issue would be to compare results obtained from “classical” methods (as used here) with those obtained with methods “dedicated” to the analysis of causality among time series like Granger causality, directed transfer function and partial directed coherence on simulated signals (Blinowska et al., 2004; Kus et al., 2004). One advantage of these methods is that they make use of multichannel estimates conversely to the method used in this study that proceeds according to a bivariate approach, often considered as less powerful. Nevertheless, for simulated data, most of the studies which analyze the performances of multivariate versus bivariate methods make us of a multivariate autoregressive model which may not be the most relevant model for epileptic ictal-like activity. It would therefore be very informative to test aforementioned methods on signals generated with more “physiologically plausible” models of EEG (or LFP) generation, as the one used in this study and which can easily extended to multiple populations of neurons. A similar approach based on neural mass models was used to examine linear and non-linear methods for assessing functional connectivity (David et al., 2004). Finally, in the context of drug-resistant epilepsy, a nice – but difficult – perspective would be to investigate brain connectivity from both scalp-EEG and depth-EEG signals. This would allow us to assess the relationship between connectivity measures as obtained from global field potentials and from LFPs and to determine whether “finer” hypotheses about the epileptogenic zone could be establish on the basis on non-invasive electrophysiological data.
Conflict of Interest Statement
The authors declare that the research was conducted in the absence of any commercial or financial relationships that could be construed as a potential conflict of interest.
References
Alarcon, G., Binnie, C. D., Elwes, R. D., and Polkey, C. E. (1995). Power spectrum and intracranial EEG patterns at seizure onset in partial epilepsy. Electroencephalogr. Clin. Neurophysiol. 94, 326–337.
Allen, P. J., Fish, D. R., and Smith, S. J. (1992). Very high-frequency rhythmic activity during SEEG suppression in frontal lobe epilepsy. Electroencephalogr. Clin. Neurophysiol. 82, 155–159.
Ansari-Asl, K., Senhadji, L., Bellanger, J. J., and Wendling, F. (2006). Quantitative evaluation of linear and nonlinear methods characterizing interdependencies between brain signals. Phys. Rev. E. Stat. Nonlin. Soft Matter Phys. 74(Pt 1), 031916.
Arnhold, J., Grassberger, P., Lenhertz, K., and Elger, C. (1999). A robust method for detecting interdependences: application to intracranially recorded EEG. Physica D 134, 419–430.
Avoli, M., Gloor, P., Kostopoulos, G., and Gotman, J. (1983). An analysis of penicillin-induced generalized spike and wave discharges using simultaneous recordings of cortical and thalamic single neurons. J. Neurophysiol. 50, 819–837.
Bancaud, J., and Talairach, J. (1973). [Methodology of stereo EEG exploration and surgical intervention in epilepsy]. Rev. Otoneuroophtalmol. 45, 315–328.
Bancaud, J., Talairach, J., Bonis, A., Schaub, C., Szikla, G., Morel, P., and Bordas-Ferrer, M. (1965). La Stéréoélectroencéphalographie dans L’épilepsie: Informations Neurophysiopathologiques Apportées par L’investigation Fonctionnelle Stereotaxique. Paris: Masson.
Barlow, J. S., and Brazier, M. A. (1954). A note on a correlator for electroencephalographic work. Electroencephalogr. Clin. Neurophysiol. 6, 321–325.
Bartolomei, F., Chauvel, P., and Wendling, F. (2008a). Epileptogenicity of brain structures in human temporal lobe epilepsy: a quantified study from intracerebral EEG. Brain 131, 1818–1830.
Bartolomei, F., Wendling, F., and Chauvel, P. (2008b). [The concept of an epileptogenic network in human partial epilepsies]. Neurochirurgie 54, 174–184.
Bartolomei, F., Guye, M., Gavaret, M., Regis, J., Wendling, F., Raybaud, C., and Chauvel, P. (2002). [The presurgical evaluation of epilepsies]. Rev. Neurol. (Paris) 158(Pt 2), 4S55–4S64.
Bartolomei, F., and Wendling, F. (2009). Synchrony in neural networks underlying seizure generation in human partial epilepsies in coordinated activity in the brain. Springer Series Comput. Neurosci. 2, 137–147.
Bartolomei, F., Wendling, F., Bellanger, J. J., Regis, J., and Chauvel, P. (2001). Neural networks involving the medial temporal structures in temporal lobe epilepsy. Clin. Neurophysiol. 112, 1746–1760.
Bhattacharya, J. (2001). Reduced degree of long-range phase synchrony in pathological human brain. Acta Neurobiol. Exp. (Wars) 61, 309–318.
Blinowska, K. J., Kus, R., and Kaminski, M. (2004). Granger causality and information flow in multivariate processes. Phys. Rev. E. Stat. Nonlin. Soft Matter Phys. 70(Pt 1), 050902.
Brazier, M. A. (1972). Spread of seizure discharges in epilepsy: anatomical and electrophysiological considerations. Exp. Neurol. 36, 263–272.
Brazier, M. A., and Casby, J. U. (1952). Cross-correlation and autocorrelation studies of electroencephalographic potentials. Electroencephalogr. Clin. Neurophysiol. 4, 201–211.
Brothers, L. A., and Finch, D. M. (1985). Physiological evidence for an excitatory pathway from entorhinal cortex to amygdala in the rat. Brain Res. 359, 10–20.
Chauvel, P., Landre, E., Trottier, S., Vignel, J. P., Biraben, A., Devaux, B., and Bancaud, J. (1993). Electrical stimulation with intracerebral electrodes to evoke seizures. Adv. Neurol. 63, 115–121.
Chauvel, P., Vignal, J., Biraben, A., Badier, J., and Scarabin, J. (1996). “Stereoelectroencephalography,” in Multimethodological Assessment of the Epileptic Forms, eds G. Pawlik and H. Stefan (New York: Springer Verlag), 80–108.
Cooley, J. W., and Tukey, J. W. (1965). An algorithm for the machine calculation of complex Fourier series. Math. Comput. 19, 297–301.
Cossu, M., Cardinale, F., Castana, L., Citterio, A., Francione, S., Tassi, L., Benabid, A. L., and Lo Russo, G. (2005). Stereoelectroencephalography in the presurgical evaluation of focal epilepsy: a retrospective analysis of 215 procedures. Neurosurgery 57, 706–718; discussion 706–718.
David, O., Cosmelli, D., and Friston, K. J. (2004). Evaluation of different measures of functional connectivity using a neural mass model. Neuroimage 21, 659–673.
de Curtis, M., and Gnatkovsky, V. (2009). Reevaluating the mechanisms of focal ictogenesis: the role of low-voltage fast activity. Epilepsia 50, 2514–2525.
Duckrow, R. B., and Spencer, S. S. (1992). Regional coherence and the transfer of ictal activity during seizure onset in the medial temporal lobe. Electroencephalogr. Clin. Neurophysiol. 82, 415–422.
Engel, J., VanNess, P., Rasmussen, T., and Ojemann, L. (1993). “Outcome with respect to epileptic seizures,” in Surgical Treatment of the Epilepsies, 2nd Edn, ed. J. Engel (New York: Raven Press), 609–622.
Franaszczuk, P. J., and Bergey, G. K. (1999). An autoregressive method for the measurement of synchronization of interictal and ictal EEG signals. Biol. Cybern. 81, 3–9.
Friston, K. (1994). Functional and effective connectivity in neuroimaging: A synthesis. Hum. Brain Mapp. 2, 56–78.
Gnatkovsky, V., Librizzi, L., Trombin, F., and de Curtis, M. (2008). Fast activity at seizure onset is mediated by inhibitory circuits in the entorhinal cortex in vitro. Ann. Neurol. 64, 674–686.
Gotman, J. (1987). Interhemispheric interactions in seizures of focal onset: data from human intracranial recordings. Electroenceph. Clin. Neurophysiol. 67, 120–133.
Guenot, M., Isnard, J., Ryvlin, P., Fischer, C., Ostrowsky, K., Mauguiere, F., and Sindou, M. (2001). Neurophysiological monitoring for epilepsy surgery: the Talairach SEEG method. StereoElectroEncephaloGraphy. Indications, results, complications and therapeutic applications in a series of 100 consecutive cases. Stereotact. Funct. Neurosurg. 77, 29–32.
Haykin, S., Racine, R. J., Xu, Y., and Chapman, C. A. (1996). Monitoring neural oscillation and signal transmission between cortical regions using time-frequency analysis of electroencephalographic activity. Proc. IEEE 84, 1295–1301.
Iasemidis, L. D. (2003). Epileptic seizure prediction and control. IEEE Trans. Biomed. Eng. 50, 549–558.
Jirsa, V., and McIntosh, A. (Eds.). (2007). Handbook of Brain Connectivity. Berlin: Springer Verlag.
Kalitzin, S. N., Parra, J., Velis, D. N., and Lopes da Silva, F. H. (2007). Quantification of unidirectional nonlinear associations between multidimensional signals. IEEE Trans. Biomed. Eng. 54, 454–461.
Ktonas, P. Y., and Mallart, R. (1991). Estimation of time delay between EEG signals for epileptic focus localization: statistical error considerations. Electroencephalogr. Clin. Neurophysiol. 78, 105–110.
Kus, R., Kaminski, M., and Blinowska, K. J. (2004). Determination of EEG activity propagation: pair-wise versus multichannel estimate. IEEE Trans. Biomed. Eng. 51, 1501–1510.
Lehnertz, K. (1999). Non-linear time series analysis of intracranial EEG recordings in patients with epilepsy – an overview. Int. J. Psychophysiol. 34, 45–52.
Lieb, J. P., Hoque, K., Skomer, C. E., and Song, X. W. (1987). Inter-hemispheric propagation of human mesial temporal lobe seizures: a coherence/phase analysis. Electroencephalogr. Clin. Neurophysiol. 67, 101–119.
Lopes da Silva, F., Pijn, J. P., and Boeijinga, P. (1989). Interdependence of EEG signals: linear vs. nonlinear associations and the significance of time delays and phase shifts. Brain Topogr. 2, 9–18.
Lopes da Silva, F. H., van Hulten, K., Lommen, J. G., Storm van Leeuwen, W., van Veelen, C. W., and Vliegenthart, W. (1977). Automatic detection and localization of epileptic foci. Electroencephalogr. Clin. Neurophysiol. 43, 1–13.
Mars, N., and Lopes da Silva, F. (1983). Propagation of seizure activity in kindled dogs. Electroencephalogr. Clin. Neurophysiol. 56, 194–209.
McDonald, A. J., and Mascagni, F. (1997). Projections of the lateral entorhinal cortex to the amygdala: a Phaseolus vulgaris leucoagglutinin study in the rat. Neuroscience 77, 445–459.
McGonigal, A., Bartolomei, F., Regis, J., Guye, M., Gavaret, M., Trebuchon-Da Fonseca, A., Dufour, H., Figarella-Branger, D., Girard, N., Peragut, J. C., and Chauvel, P. (2007). Stereoelectroencephalography in presurgical assessment of MRI-negative epilepsy. Brain 130(Pt 12), 3169–3183.
Mormann, F., Andrzejak, R. G., Kreuz, T., Rieke, C., David, P., Elger, C. E., and Lehnertz, K. (2003). Automated detection of a preseizure state based on a decrease in synchronization in intracranial electroencephalogram recordings from epilepsy patients. Phys. Rev. E. Stat. Nonlin. Soft Matter Phys. 67(Pt 1), 021912.
Pijn, J. (1990). Quantitative Evaluation of EEG Signals in Epilepsy, Nonlinear Associations, Time Delays and Nonlinear Dynamics. Ph.D. Thesis. Amsterdam: University of Amsterdam.
Pijn, J., and Lopes Da Silva, F. (1993a). “Propagation of electrical activity: nonlinear associations and time delays between EEG signals,” in Basic Mechanisms of the EEG, eds S. Zschocke, E. J. Speckmann (Boston: Birkauser), 41–61.
Pijn, J., Velis, D. N., and Lopes da Silva, F. (1992). Measurement of interhemispheric time differences in generalised spike-and-wave. Electroencephalogr. Clin. Neurophysiol. 83, 169–171.
Pijn, J. P., and Lopes da silva, F. H. (1993b). “Propagation of electrical activity: nonlinear associations and time delays between EEG signals,” in Basic Mechanisms of the EEG, Brain Dynamics, eds S. Zschocke and E. J. Speckmann (Boston: Birkhauser), 41–61.
Pikovsky, A., Rosenblum, M., and Kurths, J. (2001). Synchronization: A Universal Concept in Nonlinear Sciences. Cambridge: Cambridge University Press.
Rafiq, A., DeLorenzo, R. J., and Coulter, D. A. (1993). Generation and propagation of epileptiform discharges in a combined entorhinal cortex/hippocampal slice. J. Neurophysiol. 70, 1962–1974.
Rampp, S., and Stefan, H. (2006). Fast activity as a surrogate marker of epileptic network function? Clin. Neurophysiol. 117, 2111–2117.
Rosenblum, M., Pikovsky, A., and Kurths, J. (2004). Synchronization approach to analysis of biological signals. Fluctuation Noise Lett. 4, L53–L62.
Russchen, F. T. (1982a). Amygdalopetal projections in the cat. I. Cortical afferent connections. A study with retrograde and anterograde tracing techniques. J. Comp. Neurol. 206, 159–179.
Russchen, F. T. (1982b). Amygdalopetal projections in the cat. II. Subcortical afferent connections. A study with retrograde tracing techniques. J. Comp. Neurol. 207, 157–176.
Schindler, K., Leung, H., Elger, C. E., and Lehnertz, K. (2007). Assessing seizure dynamics by analysing the correlation structure of multichannel intracranial EEG. Brain 130(Pt 1), 65–77.
Spencer, S. S. (2002). Neural networks in human epilepsy: evidence of and implications for treatment. Epilepsia 43, 219–227.
Stam, C. J., Breakspear, M., van Cappellen van Walsum, A. M., and van Dijk, B. W. (2003). Nonlinear synchronization in EEG and whole-head MEG recordings of healthy subjects. Hum. Brain Mapp. 19, 63–78.
Stam, C. J., van Cappellen van Walsum, A. M., Pijnenburg, Y. A., Berendse, H. W., de Munck, J. C., Scheltens, P., and van Dijk, B. W. (2002). Generalized synchronization of MEG recordings in Alzheimer’s Disease: evidence for involvement of the gamma band. J. Clin. Neurophysiol. 19, 562–574.
Stoop, R., and Pralong, E. (2000). Functional connections and epileptic spread between hippocampus, entorhinal cortex and amygdala in a modified horizontal slice preparation of the rat brain. Eur. J. Neurosci. 12, 3651–3663.
Suffczynski, P., Wendling, F., Bellanger, J., and Lopes Da Silva, F. (2006). Some insights into computational models of (patho)physiological brain activity. Proc. IEEE 94, 784–804.
Thatcher, R. W., Krause, P. J., and Hrybyk, M. (1986). Cortico-cortical associations and EEG coherence: a two-compartmental model. Electroencephalogr. Clin. Neurophysiol. 64, 123–143.
Traub, R., Whittington, M., Buhl, E., LeBeau, F., Bibbig, A., Boyd, S., Cross, H., and Baldeweg, T. (2001). A possible role for gap junctions in generation of very fast EEG oscillations preceding the onset of, and perhaps initiating, seizures. Epilepsia 42, 153–170.
Uhlhaas, P. J., and Singer, W. (2006). Neural synchrony in brain disorders: relevance for cognitive dysfunctions and pathophysiology. Neuron 52, 155–168.
Ullah, G., and Schiff, S. J. (2009). Models of epilepsy. Scholarpedia (http://www.scholarpedia.org/article/Models_of_epilepsy) 4, 1409.
Uva, L., Librizzi, L., Wendling, F., and de Curtis, M. (2005). Propagation dynamics of epileptiform activity acutely induced by bicuculline in the hippocampal-parahippocampal region of the isolated Guinea pig brain. Epilepsia 46, 1914–1925.
Wendling, F., Ansari-Asl, K., Bartolomei, F., and Senhadji, L. (2009). From EEG signals to brain connectivity: a model-based evaluation of interdependence measures. J. Neurosci. Methods 183, 9–18.
Wendling, F., Badier, J., Chauvel, P., and Coatrieux, J. (1997). A method to quantify invariant information in depth-recorded epileptic seizures. Electroenceph. Clin. Neurophysiol. 102, 472–485.
Wendling, F., and Bartolomei, F. (2001). Modeling EEG signals and interpreting measures of relationship during temporal-lobe seizures: an approach to the study of epileptogenic networks. Epileptic Disord. 3, 67–78.
Wendling, F., Bartolomei, F., Bellanger, J. J., Bourien, J., and Chauvel, P. (2003). Epileptic fast intracerebral EEG activity: evidence for spatial decorrelation at seizure onset. Brain 126(Pt 6), 1449–1459.
Wendling, F., Bartolomei, F., Bellanger, J. J., and Chauvel, P. (2002). Epileptic fast activity can be explained by a model of impaired GABAergic dendritic inhibition. Eur. J. Neurosci. 15, 1499–1508.
Wendling, F., Bartolomei, F., Bellanger, J. J., and Chauvel, P. (2001a). [Identification of epileptogenic networks from modeling and nonlinear analysis of SEEG signals]. Neurophysiol. Clin. 31, 139–151.
Wendling, F., Bartolomei, F., Bellanger, J. J., and Chauvel, P. (2001b). Interpretation of interdependencies in epileptic signals using a macroscopic physiological model of the EEG. Clin. Neurophysiol. 112, 1201–1218.
Wendling, F., Bellanger, J. J., Badier, J. M., and Coatrieux, J. L. (1996). Extraction of spatio-temporal signatures from depth EEG seizure signals based on objective matching in warped vectorial observations. IEEE Trans. Biomed. Eng. 43, 990–1000.
Wendling, F., Bellanger, J. J., Bartolomei, F., and Chauvel, P. (2000). Relevance of nonlinear lumped-parameter models in the analysis of depth-EEG epileptic signals. Biol. Cybern. 83, 367–378.
Wendling, F., Hernandez, A., Bellanger, J. J., Chauvel, P., and Bartolomei, F. (2005). Interictal to ictal transition in human temporal lobe epilepsy: insights from a computational model of intracerebral EEG. J. Clin. Neurophysiol. 22, 343–356.
Wilson, C. L., Isokawa, M., Babb, T. L., and Crandall, P. H. (1990). Functional connections in the human temporal lobe. I. Analysis of limbic system pathways using neuronal responses evoked by electrical stimulation. Exp. Brain Res. 82, 279–292.
Wilson, C. L., Isokawa, M., Babb, T. L., Crandall, P. H., Levesque, M. F., and Engel, J. Jr. (1991). Functional connections in the human temporal lobe. II. Evidence for a loss of functional linkage between contralateral limbic structures. Exp. Brain Res. 85, 174–187.
Witter, M., and Wouterlood, F. (2002). The Parahippocampal Region: Organization and Role in Cognitive Function. Oxford: Oxford University Press.
Witter, M. P., and Groenewegen, H. J. (1986). Connections of the parahippocampal cortex in the cat. IV. Subcortical efferents. J. Comp. Neurol. 252, 51–77.
Keywords: connectivity, functional, effective, non-linear regression, neuronal population model, network, intracerebral EEG, epilepsy
Citation: Wendling F, Chauvel P, Biraben A and Bartolomei F (2010) From intracerebral EEG signals to brain connectivity: identification of epileptogenic networks in partial epilepsy. Front. Syst. Neurosci. 4:154. doi: 10.3389/fnsys.2010.00154
Received: 14 June 2010;
Accepted: 03 November 2010;
Published online: 25 November 2010.
Edited by:
Barry Horwitz, National Institutes of Health, USACopyright: © 2010 Wendling, Chauvel, Biraben and Bartolomei. This is an open-access article subject to an exclusive license agreement between the authors and the Frontiers Research Foundation, which permits unrestricted use, distribution, and reproduction in any medium, provided the original authors and source are credited.
*Correspondence: Fabrice Wendling, LTSI – Inserm U642, Université de Rennes 1, Campus de Beaulieu, Bat. 22, 35042 Rennes Cedex, France. e-mail: fabrice.wendling@univ-rennes1.fr