Sensory representation and learning-related plasticity in mushroom body extrinsic feedback neurons of the protocerebral tract
- Institut für Biologie-Neurobiologie, Freie Universitaet Berlin, Berlin, Germany
Gamma-aminobutyric acid immunoreactive feedback neurons of the protocerebral tract are a major component of the honeybee mushroom body. They have been shown to be subject to learning-related plasticity and provide putative inhibitory input to Kenyon cells and the pedunculus extrinsic neuron, PE1. We hypothesize, that learning-related modulation in these neurons is mediated by varying the amount of inhibition provided by feedback neurons. We performed Ca2+ imaging recordings of populations of neurons of the protocerebral-calycal tract (PCT) while the bees were conditioned in an appetitive olfactory paradigm and their behavioral responses were quantified using electromyographic recordings from M17, the muscle which controls the proboscis extension response. The results corroborate findings from electrophysiological studies showing that PCT neurons respond to sucrose and odor stimuli. The odor responses are concentration dependent. Odor and sucrose responses are modulated by repeated stimulus presentations. Furthermore, animals that learned to associate an odor with sucrose reward responded to the repeated presentations of the rewarded odor with less depression than they did to an unrewarded and a control odor.
Introduction
Learning leads to behavioral changes based on modified brain function and structure. The potential for such changes is referred to as neural plasticity (Squire, 1987; Kandel, 2001) and appears to follow rather general rules across multiple levels of neural organization (Davis, 2004; Menzel, 2008). Insects are excellent models for the study of learning-related plasticity, because their nervous system is accessible for physiological recordings and the relevant behavior can be observed directly, as in the case of odor learning in the honeybee. For example, the proboscis extension response (PER; Kuwabara, 1957) can be conditioned when an odor is forward-paired with a sucrose reward (Menzel et al., 1974; Bitterman et al., 1983). To understand how olfactory stimuli become associated with a reward stimulus, such as sucrose, it is important to study the representation of these stimuli in the brain, and the changes these representations undergo in the process of learning.
In the insect brain the mushroom bodies (MB) are paired, higher order multisensory integrating brain structures. They are involved in learning and memory formation (Menzel et al., 1974; Erber et al., 1980; Heisenberg, 1989; DeBelle and Heisenberg, 1994), multisensory coding and evaluation (Liu et al., 1999; Strausfeld et al., 2000) and the control of motor patterns (Huber, 1962; Martin et al., 1998). The MB receives olfactory input from projection neurons ascending from the first-order olfactory neuropile, the antennal lobe (AL), via the MB calyces (Mobbs, 1982; Kirschner et al., 2006). The input from different sensory modalities diverges in the calyces onto a high number of MB intrinsic neurons, the Kenyon cells (KC), which project to the lobes and synapse onto MB extrinsic neurons (EN) providing the main MB output to different brain regions, such as the lateral protocerebrum or the contralateral brain hemisphere (Mobbs, 1982; Gronenberg, 1986; Rybak and Menzel, 1993; Strausfeld, 2002).
Among the ENs, one individual identified neuron, the pedunculus extrinsic PE1, has attracted the attention of several studies, which revealed its unique structure, multisensory integration properties, and associative plasticity in the context of olfactory learning (Mauelshagen, 1993; Iwama and Shibuya, 1998; Rybak and Menzel, 1998; Menzel and Manz, 2005; Okada et al., 2007). Conditioned odors lead to a response decrease of the PE1, an associative plasticity that appears to be mediated by inhibitory connections from gamma-aminobutyric acid (GABA) immunoreactive neurons (Okada et al., 2007). The putative inhibitory connections can be traced to a group of EN, the GABA-immunoreactive feedback (or recurrent) neurons also referred to as A3 EN (Rybak and Menzel, 1993) or protocerebral-calycal tract (PCT) neurons (Mobbs, 1982; Bicker et al. 1985; Grünewald, 1999a). About 50 feedback neurons connect the dorsal and median alpha lobe (αL), the beta lobe (βL), and the pedunculus with all ipsilateral calycal subcompartments (Grünewald, 1999a). They respond to different sensory modalities (Gronenberg, 1987) and change their response properties during olfactory learning (Grünewald, 1999b). In the study by Grünewald (1999b) some variability in PCT neuron responses was observed, e.g., variable levels of spontaneous firing frequency and responsiveness to odors and sucrose. Regarding learning-related plasticity, some variability in among the response changes was observed, some increased and others decreased. However, when the data was pooled a decrease in relative response strength after a single odor-reward pairing (classical conditioning) was found. The study employed single conditioning or sensitization trials in a semi-in vivo preparation, which allowed stable electrophysiological recordings of individual neurons; behavior however could not be simultaneously observed (Grünewald, 1999b).
In the present study we address the question how PCT neuron activity in the intact animal changes during and after differential conditioning. Recent studies suggest that PCT neurons provide modulatory input to PE1 in the αL (Okada et al., 2007) and to KC in the lip region of the calyx (Ganeshina and Menzel, 2001). We used Ca2+ imaging recordings of populations of PCT neurons. Although, this technique does not allow tracing activity to individual neurons, it offers the possibility to record physiological responses from multiple PCT neurons together with the behavioral response changes of the animal during learning and retention. The paradigm in this study was designed to compare response characteristics before, during and after conditioning of a rewarded, an unrewarded and a control odor in each individual animal. The results show that PCT neuron responses to sucrose and odor stimuli during Ca2+ imaging resemble those reported from intracellular recordings and that odor responses are concentration dependent. Repeated stimulation leads to response reduction, but the responses to the rewarded odor are less depressed than responses to the unrewarded and control odors. On the level of the individual animal response plasticity varies and may also depend on the actual learning success and motivational state of the respective animal.
Materials and Methods
Preparation and Back-Fill
Honeybee foragers were caught at the entrance of outdoor hives during summer or from hives located in a flight room during winter. Bees were immobilized by chilling and fixed into recording chambers as described earlier (Joerges et al., 1997; Galizia and Vetter, 2004). The antennae were reversibly immobilized with n-icosane and the head capsule was opened by removing a piece of cuticle above the brain. The trachea and glands were pushed gently to the side to access the MB. PCT neurons were backfilled with a 10:1 mixture of FURA-2 dextran (potassium salt, 10,000 MW, Molecular Probes, Eugene, OR, USA) and fixable tetramethylrhodamine dextran (10,000 MW, Molecular Probes, Eugene, OR, USA) by pushing a glass capillary of approximately 10 μm tip diameter into the brain region where the EN axons leave the MB at the alpha exit. We targeted PCT neurons that branch ventrally of the MB calyces penetrating the αL at the α-exit point (Mobbs, 1982) and arborize within the dorsal and median αL layers. After staining, the piece of cuticle dissected from the head capsule was placed back in position and sealed with n-icosan; the bees were fed until satiation and stored overnight at 20°C. Next morning, the antennae and abdomen of the bees were immobilized with low melting point wax. To prevent movements of the brain, the esophagus and its surrounding solid structures were pulled through an incision above the labrum without damaging it (Mauelshagen, 1993). The head capsule was reopened by removing the piece of cuticle, glands, and trachea covering the brain, whereby care was taken to ensure that all muscles inside the head capsule and the neurolemma were left intact. The brain surface and the incision above the labrum were covered with a layer of a two-component silicone (KWIKSIL, WPI, Sarasota, FL, USA). Fixed to its recording chamber, the animal was placed on a microscope stage in front of an exhaust. A water immersion objective was lowered into a drop of water on the silicone layer above the brain. The in vivo Ca2+ imaging preparation of the honeybee was recently described in detail (Haehnel et al., 2009).
Stimulus Delivery and Imaging
Images were recorded at room temperature through a 60×, 0.9 W Olympus water immersion objective with a sampling rate of 5 Hz using a TILL photonics imaging setup with an Imago CCD camera (640 × 480 pixels, binned on chip to 160 × 120 pixels). The spatial resolution was 1.47 μm × 1.47 μm per pixel. The camera was mounted on a fluorescence microscope (Axioskop, Zeiss, Germany). Fura-2 was excited with an illumination of 340 and 380 nm for ratiometric measurements. Fluorescence was detected through a 410 nm dichroic mirror and a 440 nm long pass filter. All measurements started 3 s before stimulus onset and lasted for 10 s. Odors were delivered by injecting the head space above a 20-μl droplet of odor solution on a 2 cm × 1 cm piece of filter paper into a constant air stream directed toward the antennae using a computer controlled custom built “olfactometer” (Galizia et al., 1997). Odor stimuli were three second odor pulses ejecting about 0.2 ml head space air. The odors used were: 1-hexanol (6ol), 1-octanol (8ol), 1-nonanol (9ol), heptanal (7al), linalool (lio), eugenol (clove), benzaldehyde (bal), cineol (cin), and citral (cit). All these chemicals are components of naturally occurring plant odors. One odor consisted of compound odor stimuli (rose). Odors were diluted to 10−2 in paraffin oil for all experiments except for the dose–response experiment, where 8ol was used at five concentrations (pure and to 10, 1, 0.1, and 0.01% diluted in paraffin oil). Sucrose solution (1 M) was used as an appetitive gustatory stimulus delivered to the antennae on a toothpick.
Electromyograms
The animals were exposed to an appetitive classical conditioning paradigm in which an odor (CS+) was forward-paired with sucrose reward. The behavioral changes during learning and in response to the odors during retention tests were monitored by electromyograms recorded from the protractor muscle of the labium, M17, involved in all phases of the underlying motor program of the PER: extension, licking, and retraction (Rehder, 1987). A silver wire electrode was inserted into the dorsal tendon of M17 through a hole in the cuticle. A second wire was inserted into the head capsule through the compound eye as a ground electrode. The muscle potentials were amplified using a custom built pre-amplifier and digitalized with a CED 1401 interface (Cambridge Electronic Design Limited, Cambridge, UK) to be visualized and stored on a computer using Spike2 software (Version 6, Cambridge Electronic Design Limited, Cambridge, UK). M17 responses were quantified as number of spikes during stimulus.
Behavioral Procedures
The differential conditioning paradigm consisted of a pretest phase in which three odors were presented to the bee in a pseudo-randomized sequence. Ten minutes after pretest the acquisition phase started in which two of the odors from the pretest were presented alternately, one odor was forward-paired with sucrose (CS+) and the other was presented alone (CS−). The odors used for the conditioning were 1-hexanol, 1-octanol, and linalool, balanced for their use as CS+, CS−, and control odor, respectively. Each odor stimulus lasted for 3 s, sucrose stimulation during conditioning overlapped with the CS+ by one second in the forward trials. CS− trials were given in between the forward trials (inter-trial interval was 1 min). Ten minutes after acquisition the odors from the pretest (CS+, CS−, control) were presented in six extinction trials each in a pseudo-randomized sequence (retention test). The inter-trial interval was again 1 min.
Confocal Microscopy
Following Ca2+ imaging the brains were dissected and fixated in 4% formaldehyde overnight, then rinsed in PBS and dehydrated in rising ethanol steps. The brains were cleared in methylsalicylate and scanned with a Leica TCS SP2 confocal laser-scanning microscope (Wetzlar, Germany) using a 20× 0.4 NA oil-immersion objective. An excitation wavelength of 534 nm was used. Optical stacks were stored on a computer.
Data Analysis
Every recording where odor responses in PCT neurons during the pretest could be acquired entered the data set. An experiment was stopped when the bee died or its condition got significantly worse. Processing of Ca2+ imaging data was performed with custom written programs in IDL (IDL Version 6.2, RSI Boulder, CO, USA). The ratio of the 340 and 380 nm Ca2+ signals were calculated for each pixel and background fluorescence was determined by averaging over frames t4–t13 and subtracting from the ratiometric signal yielding deltaF (dF). For the inspection of the spatial distribution of the signal the mean of the 14 frames (t16–t29) during stimulation was calculated and a spatial low pass filter of 3 × 3 pixels was applied. Gray scale values of the Ca2+ signal were transformed into false color scale. The active regions were determined as regions of interest (ROI) and temporal dynamics were calculated by averaging the gray scale values of the pixels inside the ROI without spatial filtering. Quantitative data analysis and statistical tests were done in Excel (Microsoft) and Matlab (Version R2007a, The Mathworks, Natick, MA, USA).
Results
Stimulus Representation in MB Extrinsic Feedback Neurons
Hungry honeybees learn to associate an odor with reward when the odor (CS+) is presented shortly before the sucrose reward (US). We analyzed Ca2+ signals of MB extrinsic feedback neurons in response to odor and sucrose stimulation, as well as during training and retention. The Ca2+ indicator (Fura-2) was injected together with a fixable fluorescing dye (“Miniruby”) into a lateral–median position of the MB αL targeting A3 EN whose axons form the PCT and which provide putative inhibitory feedback from the MB output region (lobe and peduncle) to its input region (calyx; Figure 1A). These neurons ramify in the MB calyces, their axon branches meet ventral to the calyces and dendritic axon collaterals penetrate the MB αL at the alpha exit point, where they form densely packed, band-shaped layers. Their somata are arranged in a cluster in the protocerebrum at the median border of the lobula. To verify the identity of the neurons imaged with the Ca2+ indicator dye, brains were dissected after the experiments and the structures stained with fixable fluorescent dye were scanned using a confocal microscope (see Materials and Methods). Figure 1B shows such a scan of PCT neurons. When no vertical band-shaped structures were observed, the preparations were excluded from the analysis. Prior to the dissection of the brain and confocal scanning, Ca2+ signals were recorded simultaneously in the soma cluster and in the dendritic layers in the median part of the αL (Figure 2A). Responses to the odor and to sucrose stimulation of the ipsi- and contralateral antennae of the stained neurons can be observed both in the dendritic layers in the αL (Figure 1C1) and in the somata in the lateral protocerebrum (Figure 1C2). The Ca2+ signals in the somata and in the dendrites had similar temporal kinetics during the stimulus; however decay was slower in the somata response. Responses in the dendrites and somata to the same odor are more correlated than responses to different odors and/or sucrose (Table 1). From these observations we conclude that the signals in the somata region and in the dendritic region originated from the same neuron population.
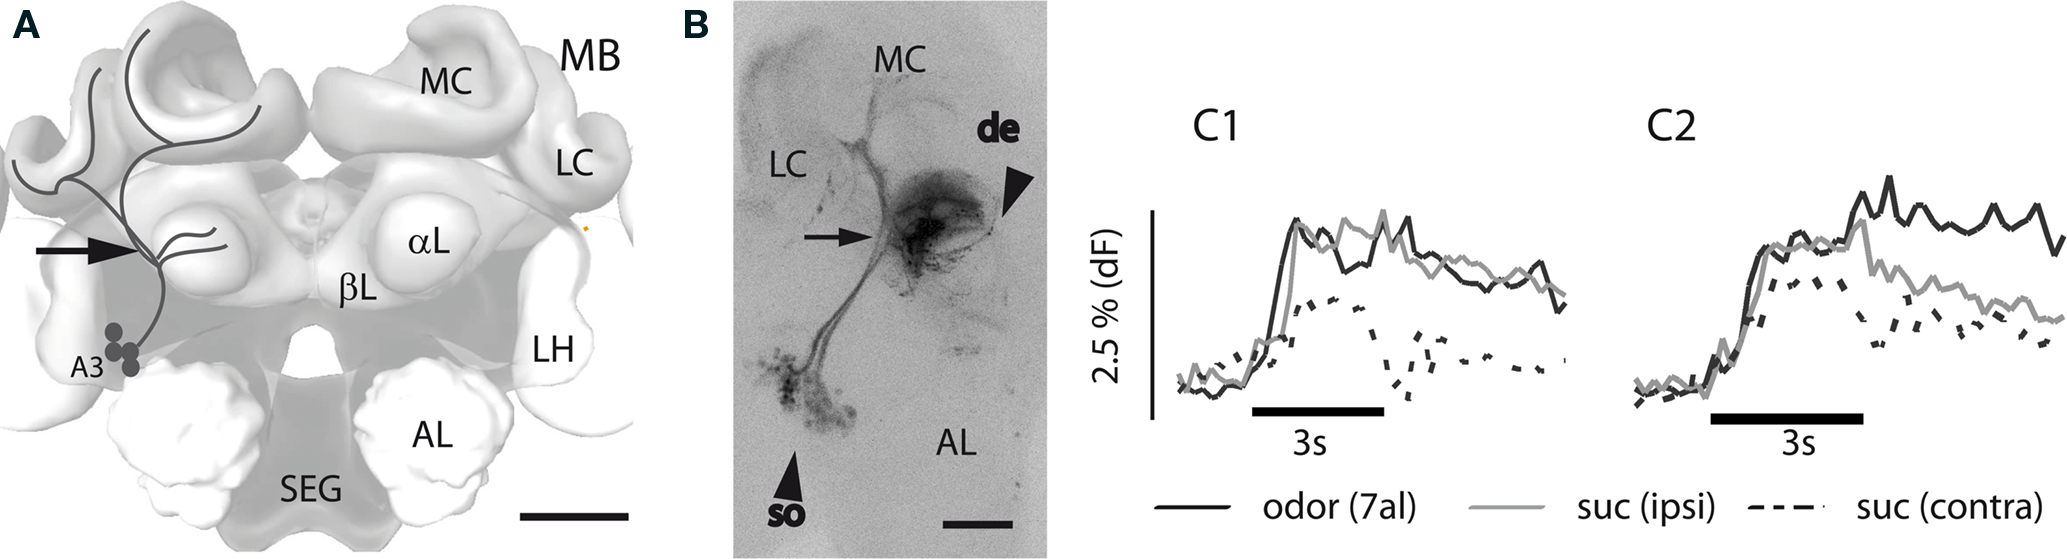
Figure 1. A3-extrinsic feedback neurons in the honeybee brain forming the PCT. (A) Scheme of the honeybee central brain with the PCT neurons outlines in the left side of the brain (black lines). Indicated structures: antennal lobe (AL), alpha lobe (αL), beta lobe (βL), lateral calyx (LC), lateral horn (LH), median calyx (MC), mushroom body (MB), subesophagial ganglion (SEG). Somata of the PCT neurons (A3); scale bar: 200 μm, arrow: dye injection site. (B) Confocal scan of PCT neurons in the left brain hemisphere; arrow (de): dendrites within the αL, arrow (so): somata; scale bar: 100 μm. (C1) Temporal dynamics of Ca2+ signals evoked in the dendrite region within the αL upon stimulation with odor and sucrose solution of the antenna. (C2) Ca2+ signals observed during the respective stimulations in the somata region. 7al: heptanal, suc: sucrose solution presented to the ipsi or contra lateral antennae.
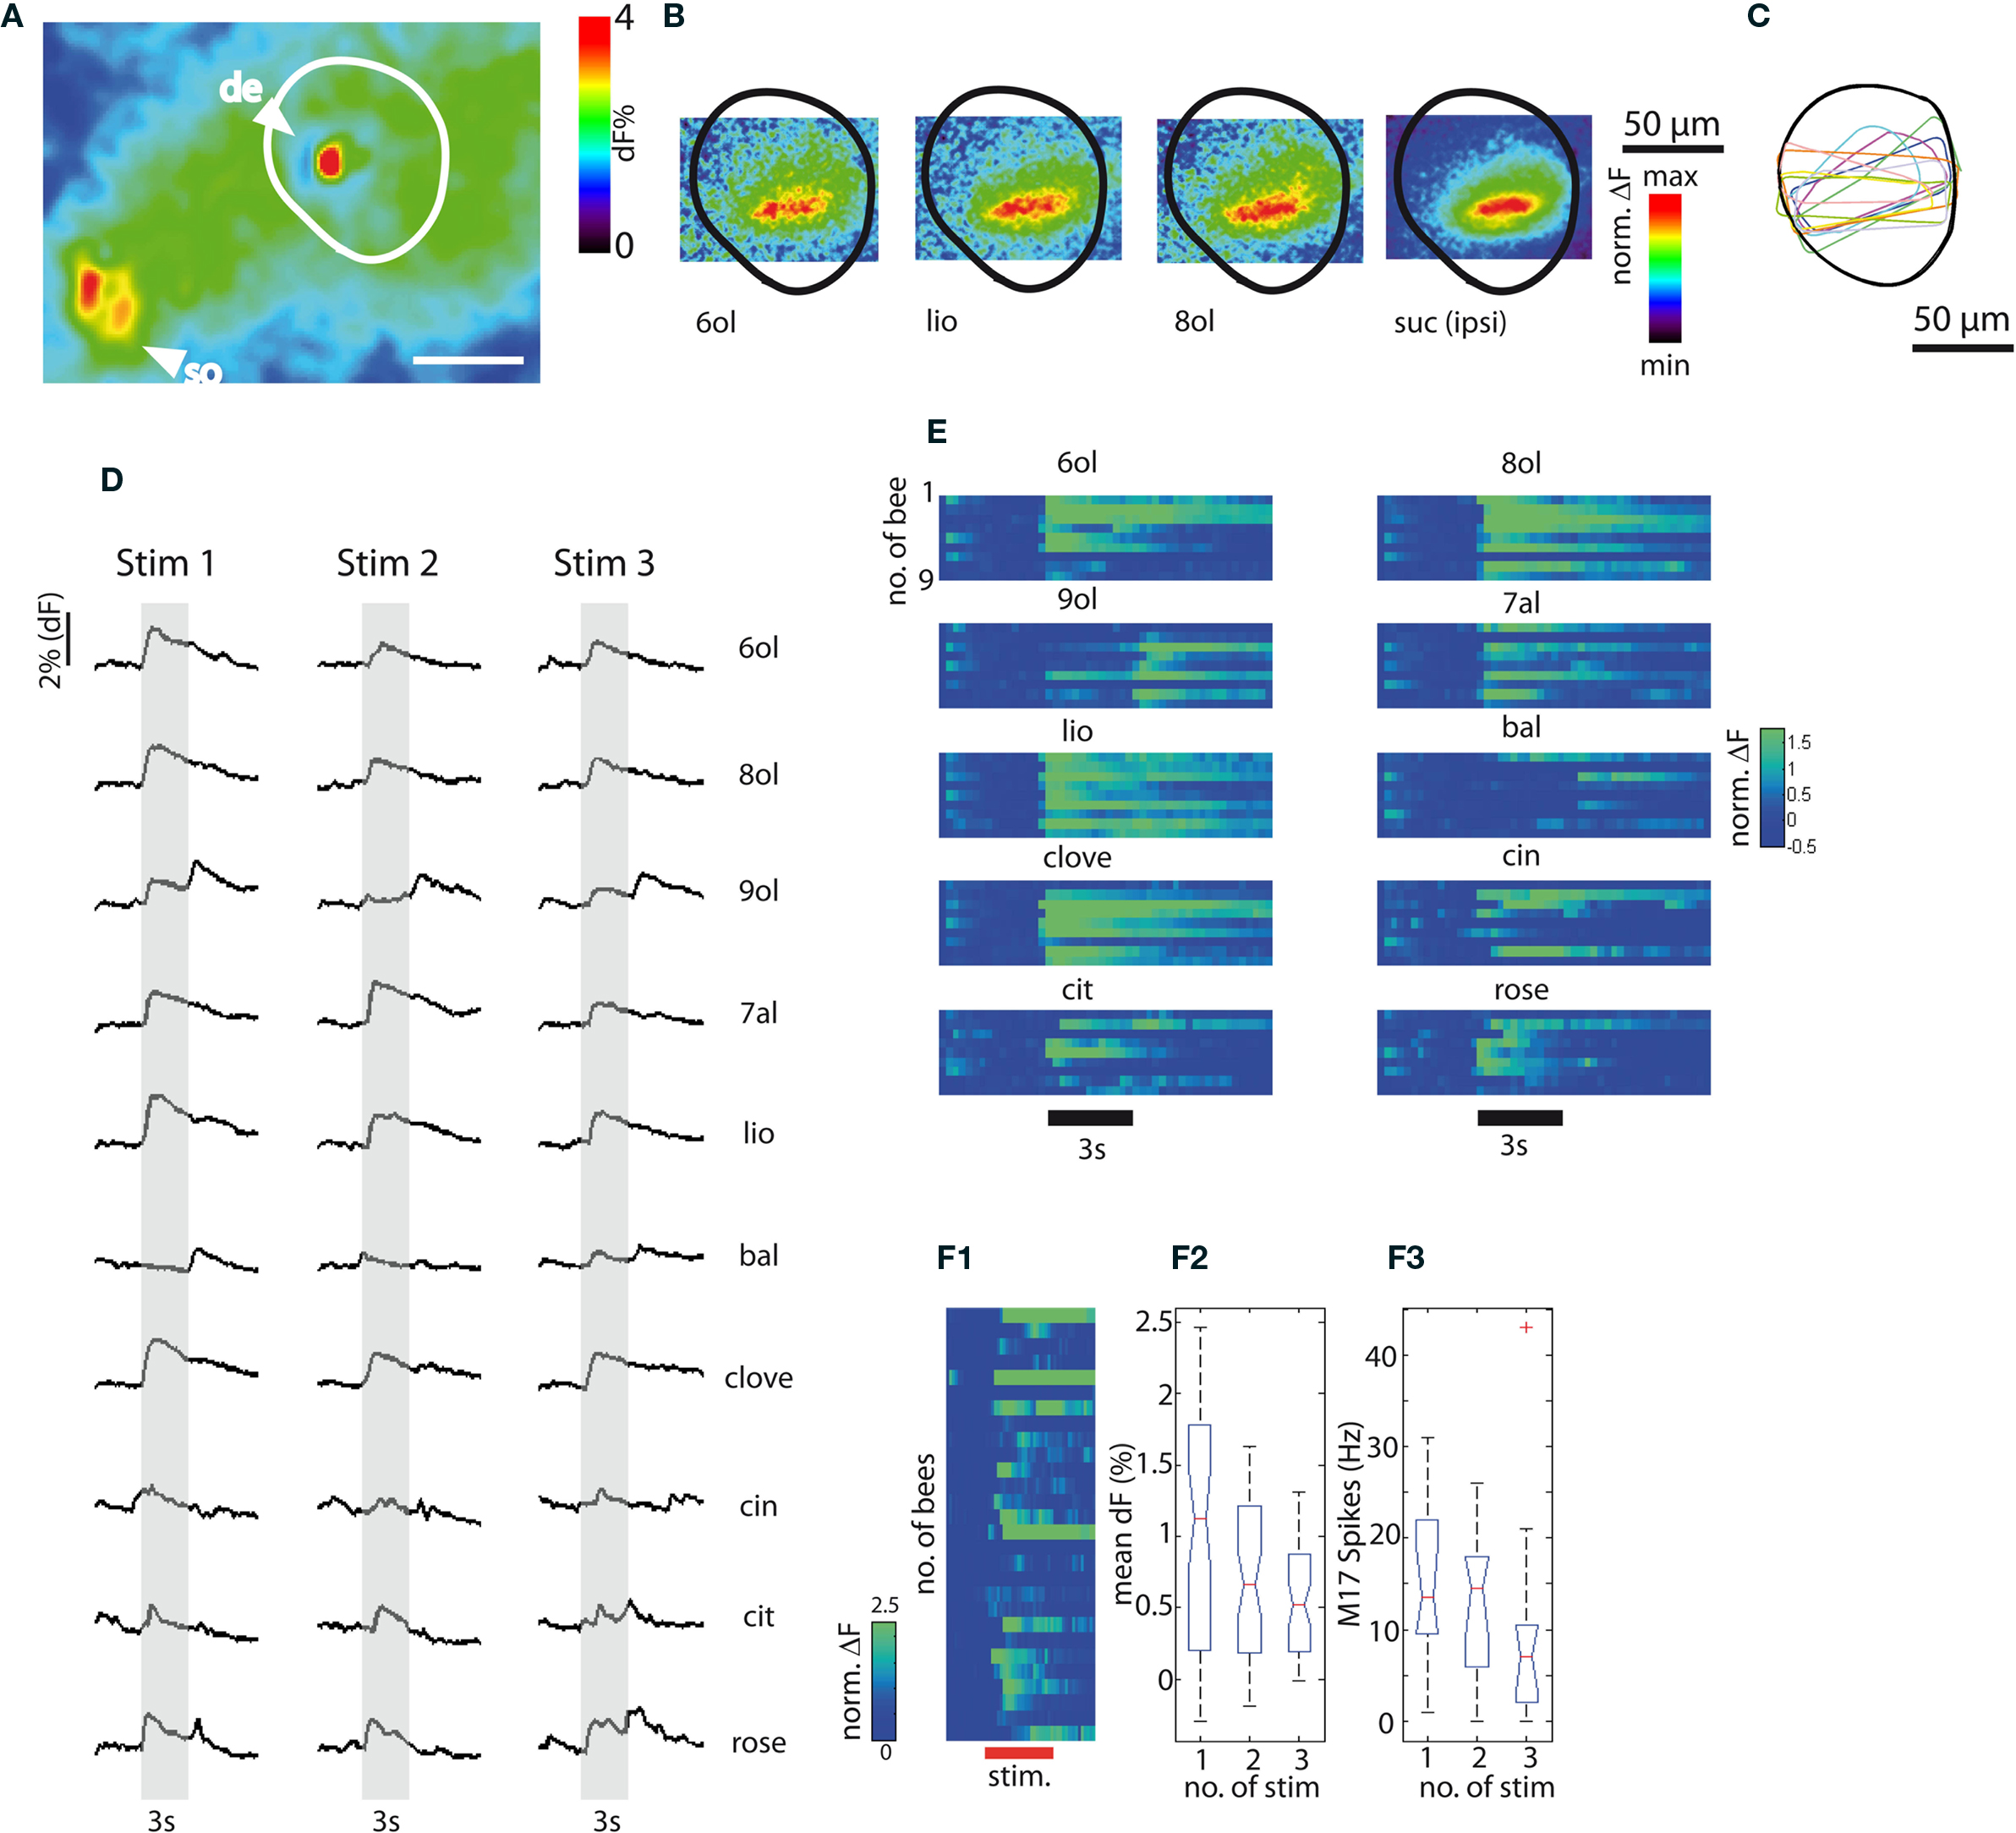
Figure 2. Calcium signals recorded in PCT neurons. (A) Spatial distribution of the Ca2+ signal in response to heptanal (7al) in the somata (so) and dendrites (de) of PCT neurons, scale bar: 100 μm. (B) Spatial distribution of Ca2+ signals in the dendrites of the median αL recorded with a 60× objective in response to stimulation with odors and sucrose. 6ol: hexanal, lio: linalool. 8ol: octanal, suc (ipsi): sucrose stimulation of the ipsilateral antenna. (C) Regions of interest (ROI) of nine representative preparations. (D) Representative examples of the temporal dynamics of Ca2+ signals in response to three repeated stimulations with 10 odors (6ol: hexanol, 8ol: octanol, 9ol: nonanol, 7al: heptanal, lio: linalool, bal: benzaldehyde, clove oil, cin: cineol, cit: citral, rose oil). (E) Temporal dynamics of Ca2+ signals in response to ten odors in nine bees (responses in the first column of (D) correspond to the sixth row for each odor. (F1) Sucrose responses recorded in PCT neurons in the median αL of 28 bees. (F2) Mean response amplitudes during repetitive stimulation (three times) with sucrose solution. A significant decrease is found between trials (n = 28, One-Way ANOVA: df = 2, F = 10.06, p ≤ 0.001). (F3) Quantification of behavioral responses to sucrose stimulation by M17 electromyographic recordings: mean spike frequencies during stimulus presentation for three repeated trials. The trend for decreased number of spikes is not significant (n = 11, One-Way ANOVA, df = 2, F = 1.78, p = 0.32).
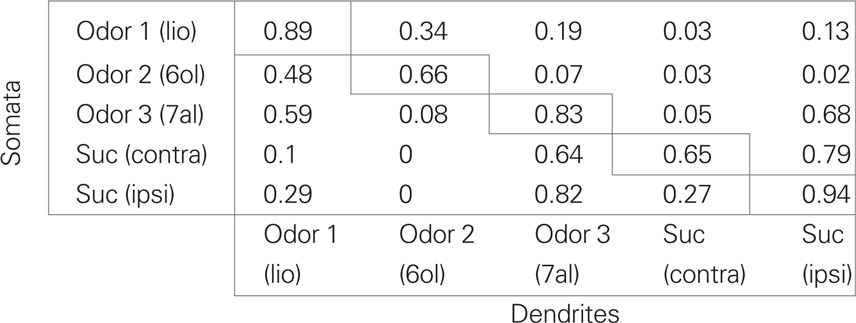
Table 1. Correlation between odor responses in dendrites and somata (R2).
In following sections we focus on the dendritic layers in the median αL, because using a 60× magnification, which yielded the best signal-to-noise ratio, Ca2+ signals could be most reliably recorded in the αL (Figure 2B). Selected overlapping ROI from the median αL were used, such that overlapping sets of neurons were imaged (Figure 2C). Ten different odor compounds were used to characterize odor representation in PCT neurons in nine bees. Among these odors were primary alcohols of different chain lengths, aldehydes, and aromats. Rose oil is a mixture of several compounds. Each odor was presented three times to each subject in a pseudo-randomized sequence. In Figure 2D, Ca2+ signals in response to the 10 odors are shown for a representative preparation. All 10 odors are responded to with excitation (Ca2+activity increase) in a rather similar way. The majority of these odors elicit a phasic-tonic response during the stimulus and a phasic-tonic off-response at stimulus offset. In two cases [responses to nonanol (9ol) and benzaldehyde (bal)] the signal amplitude of the off-response exceeded the response during stimulus presentation in all tested animals. This was found to be a consistent phenomenon across all nine bees tested with these odors (Figure 2E, rows represent different animals). Also, the response dynamics for the odors cin, cit and rose differed consistently from the phasic-tonic pattern characteristic of the other odors. The onset of the responses to these three odors was less pronounced, and the signals followed a rather tonic time course.
Stimulating the antennae of 28 bees with 1 M sucrose solution three times at intervals of approximately 1 min evoked less reliable responses than the responses to odors (Figure 2F1). In some cases the responses were much stronger (above 10% increase in dF in two animals) than in others. Given repeated sucrose stimulation the amplitude of the Ca2+ signals decreased significantly (Figure 2F2). When honeybees were stimulated with sucrose solution delivered to the antennae, they responded immediately by extending their mouthparts (PER). This behavior can be monitored and quantified using electromyographic recordings from the protractor muscle of the labium (M17), which is involved in the PER motor program (see Materials and Methods and section below). We recorded M17 responses during repeated sucrose stimulation in a subset of nine bees and found a trend (albeit not a significant one) toward a decreased number of M17 spikes being elicited with repeated sucrose stimulations (Figure 2F3). It is known that the PER response to sucrose habituates, but only after many more stimulations (Braun and Bicker, 1992). These results confirm that stimuli of different sensory modalities (i.e., olfactory and gustatory) are represented in PCT neurons.
Representation of Odor Intensity
To investigate whether different odor intensities are represented in the signals of feedback neurons we chose one odor (8ol) that reliably elicits typical phasic-tonic responses and tested odor concentrations ranging in five steps from pure odor to a 10−5 dilution in paraffin oil. The test series started with the lowest concentration; the highest concentration was pure odor. All tested odor concentrations elicited excitatory responses in all five tested bees (Figure 3A). A distinct off-response appeared even at a concentration of 10−4. Thus, concentration affected all phases of the response, as seen in the dose–response curves for the mean response amplitude, the maximum response amplitude and the mean off-response amplitude (Figure 3B). Responses to the lowest concentration were still odor-specific and were not a response to the solvent, since the constant air stream at all dilutions was directed through a vial containing a piece of solvent-soaked filter paper. An odor dilution of 10% yielded the highest responses exceeding the responses to undiluted odor at all response phases. Thus our test concentrations ranged over the entire sigmoid dose–response curve. A dilution of 1% pure odor was used in the conditioning experiments presented in the following sections; this concentration lies well within the dynamic range of the dose–response curve.
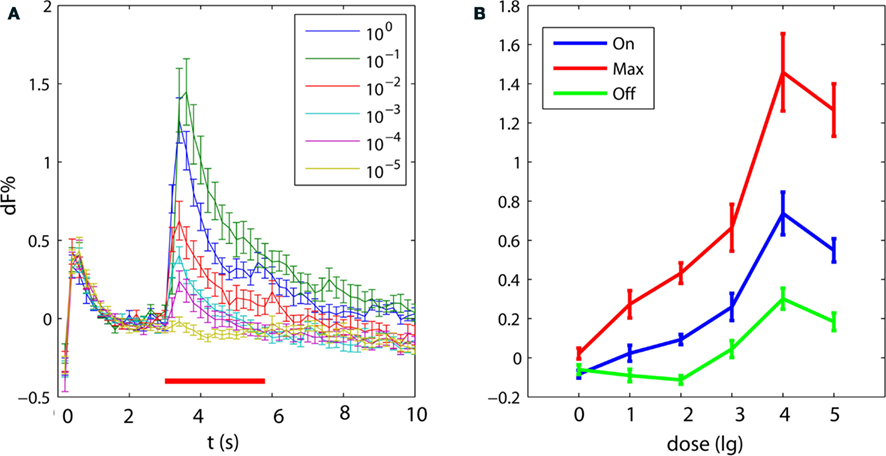
Figure 3. Response strength of PCT neurons depends on odor concentration. (A) Temporal dynamics of averaged odor responses to stimulations with six odor concentrations of octanal (8ol, black bar: 3 s stimulus, error: SEM, n = 5). (B) Dose–response curves for mean responses to 8ol during the first second of stimulus (On), during the maximal response (Max), and during the first second after stimulus offset (Off; error: SEM, n = 5).
Associative Conditioning and Electromyographic Recordings During Ca2+ Imaging
Three odors (at 1% dilution) were selected for differential conditioning of the PER: lio, 8ol, and 6ol. These odors elicited Ca2+ responses with typical shapes. We recorded electromyograms during Ca2+ imaging in 29 bees from the protractor muscle of the labium (M17), which is involved in all phases of the PER. These electromyograms allow us to quantify differences in response strength, and also give access to stimulus-induced activity of M17 that is not sufficient to release the complete PER motor program. During Ca2+ imaging M17 recordings were especially advantageous, because experiments were performed in darkness or under dim red illumination, which renders the observation of the PER very difficult. Earlier studies abstained from monitoring and quantifying PER probability during Ca2+ imaging because of these difficulties, and because parts of the muscles involved in the PER program were removed. We were able to overcome these problems by covering the brain with the silicone gel KWIKSIL for stabilization. This allowed stable imaging recordings while leaving all the muscles that are necessary for the bee to perform the PER intact.
Figure 4A1 shows the M17 responses recorded during repeated odor stimulation in pretest trials, to odor stimulation and pairing of odor and sucrose stimulation during acquisition trials (Figure 4A2), and to odor stimulation during extinction trials (Figure 4A3). The gray shaded areas in Figure 4A indicate the time windows during which odor stimuli were presented. The black box in Figure 4A2 indicates the stimulation with sucrose (US). During these time windows M17 responses were quantified by counting the spike numbers. In Figure 4B the quantification of the electromyograms from Figure 4A is shown. Spike frequencies in Hz during the odor stimulus in the pretest are plotted for each trial (Figure 4B1). Absolute responses were quantified rather than increase over baseline, because baseline activity was variable and unstable due to spontaneous movement of the mouthparts. We differentiated between responses to the CS+ during the first second of odor stimulation and responses to the US stimulation during acquisition (Figure 4B2). During extinction trials M17 responses were quantified during odor stimuli. Training-induced changes in M17 response strength to the CS+ can be observed in Figure 4B3. In all bees M17 responses to the CS+ increase significantly after training (Figures 4C,D). A lasting sensitizing effect caused by the sucrose stimulation during training can be excluded, since the responses to CS− and control are significantly lower (Figure 4D).
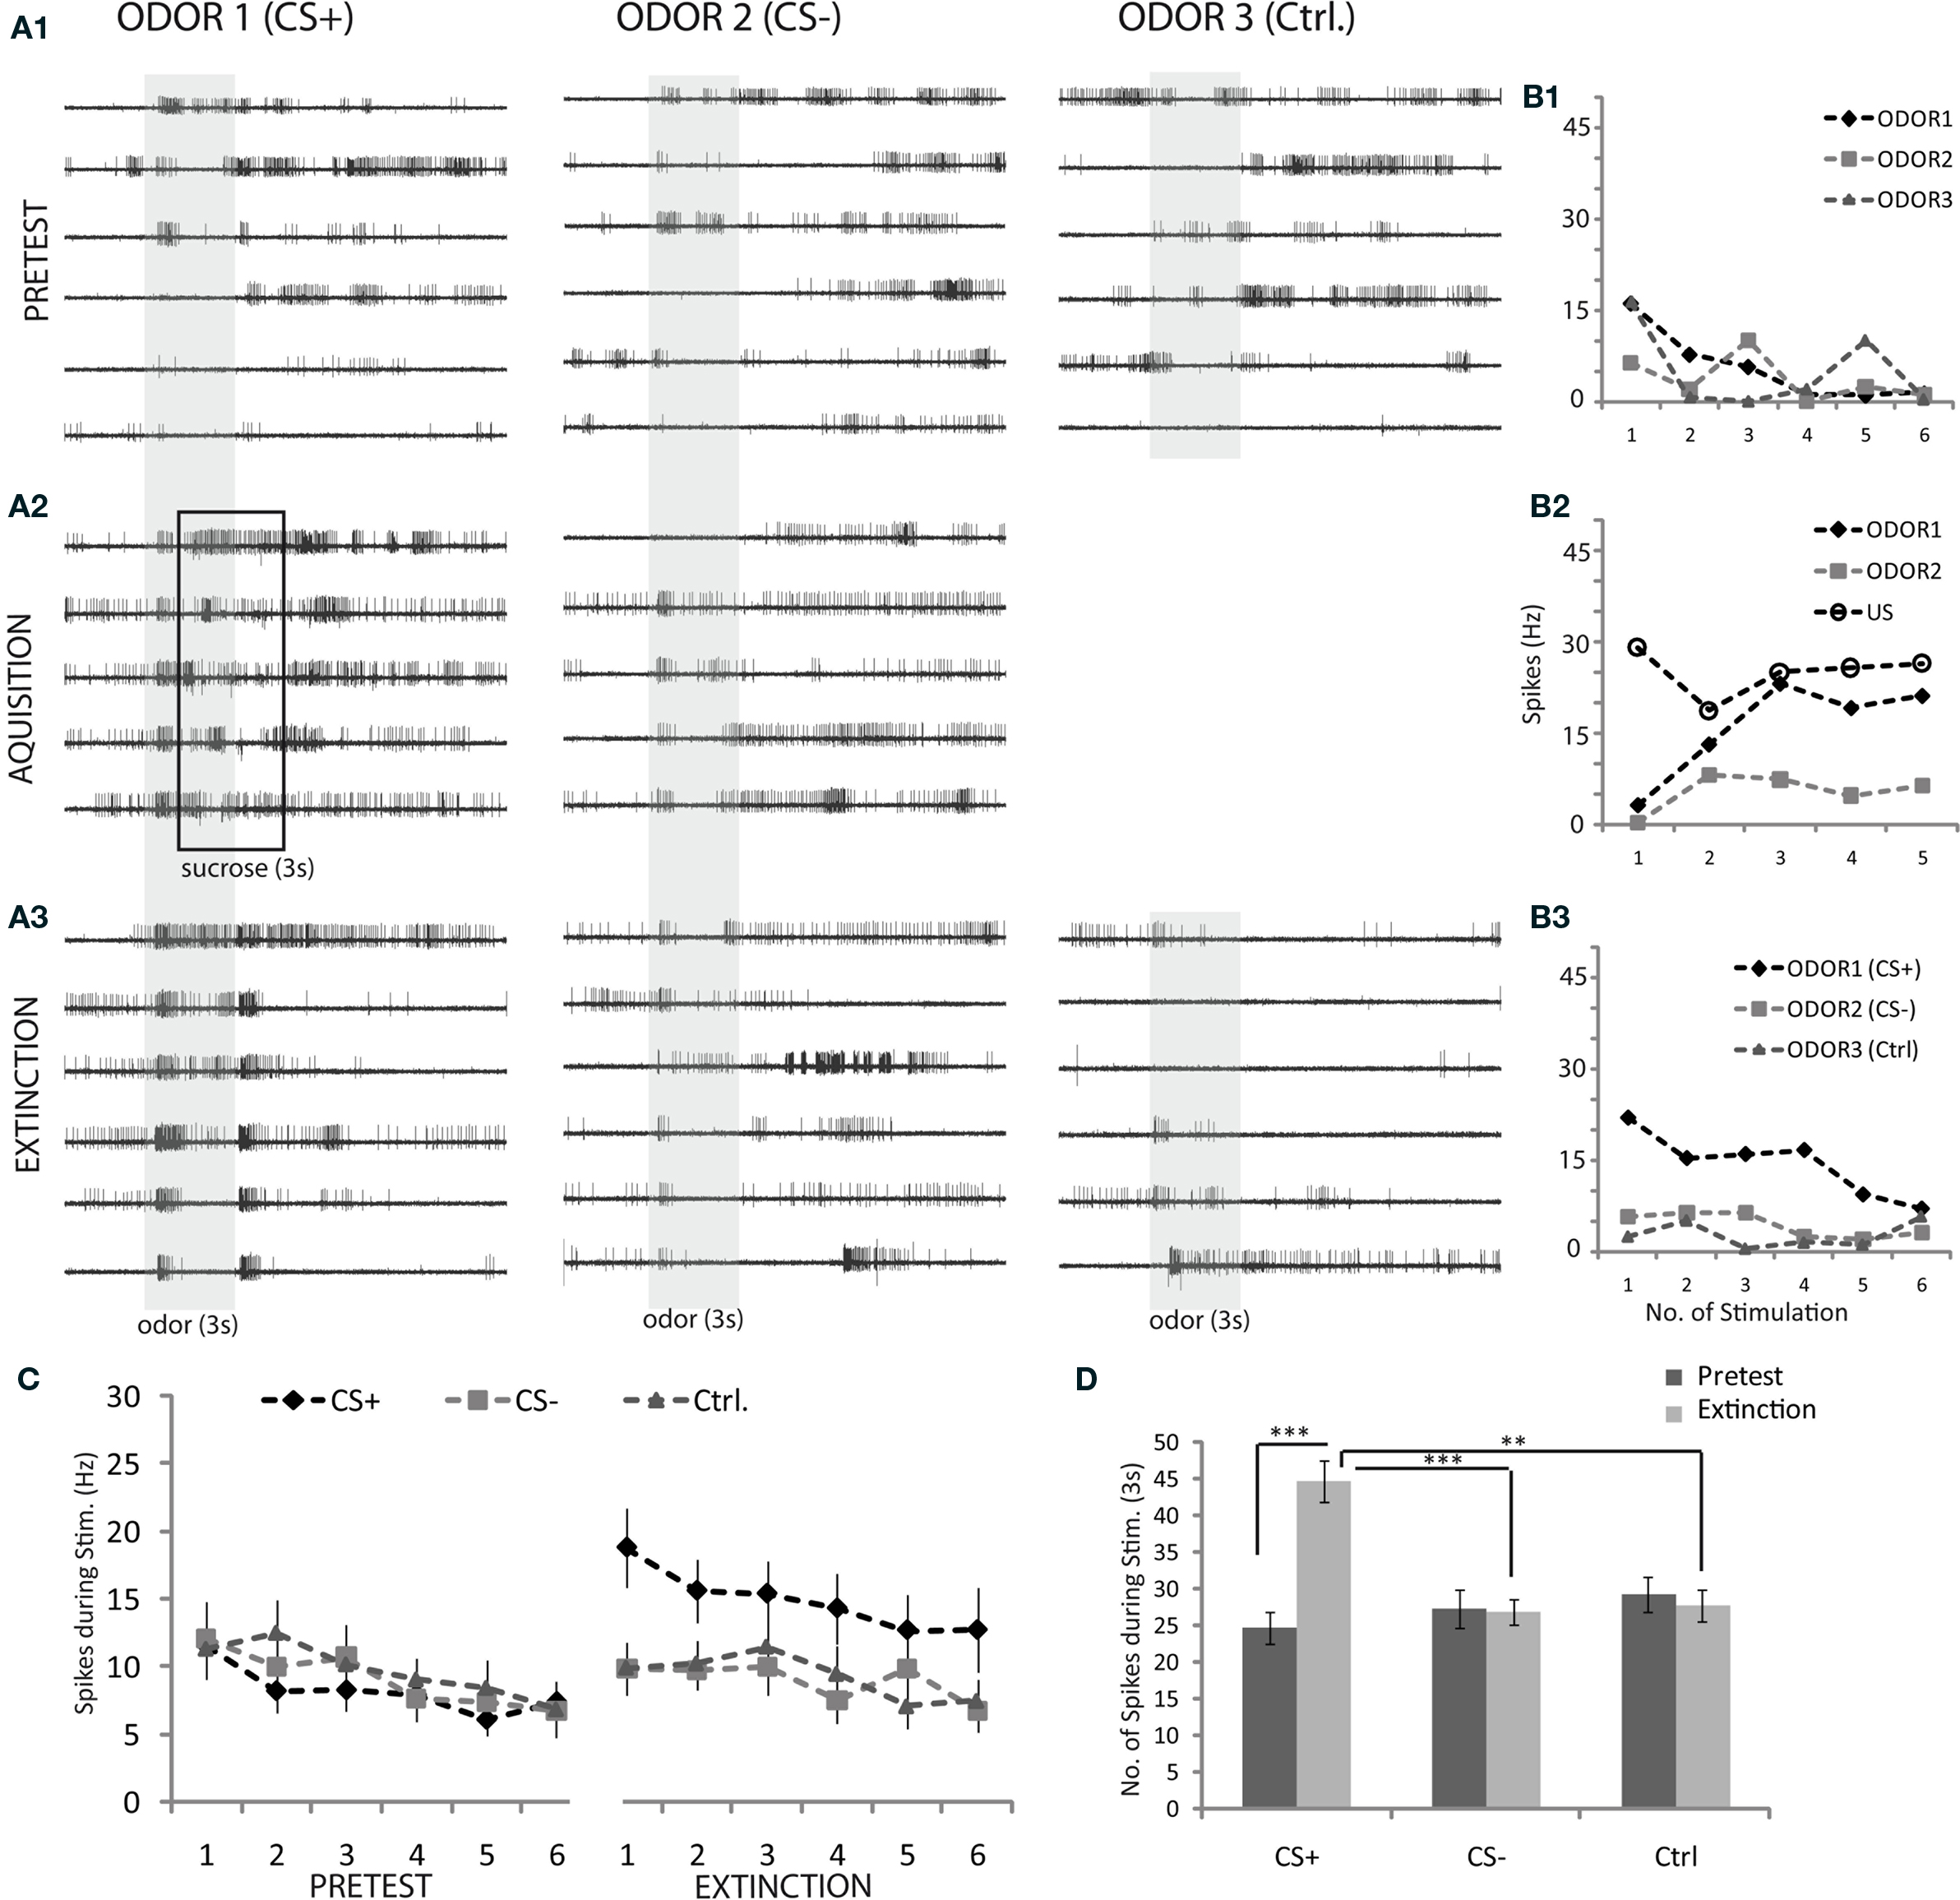
Figure 4. Electromyographic recordings from M17. (A1–3) Representative examples of electromyograms recorded during a conditioning experiment: (six trials pretest, five acquisition trials, and six extinction trials for two odors used as CS+ (linalool: lio) and CS− (hexanol: 6ol), respectively; a third odor (octanol: 8ol) was used as control odor and presented six times during pretest and extinction tests. The sequence of odors was pseudo-randomized; ITI: 1 min., interval between pretest and acquisition and likewise between acquisition and extinction was 10 min). (B1–3) Example of quantification method (electromyograms): A measure of response strength is the frequency of spikes during odor stimulation. Responses to odor1 (CS+) during the acquisition phase (B2) are composed of spike frequencies to both the odor and the sucrose stimulation. (C) Average responses of M17 across all trained animals during conditioning experiments, quantified as shown in (B1–3). Odors were linalool (lio), hexanal (6ol) and octanal (8ol) randomized for their use as CS+, CS− and control, respectively (error bar: SEM, n = 29; statistics: One-Way ANOVA between groups of the pretests, show no significant differences. Significant differences were found between extinction trials: df = 2, F = 19.87, p ≤ 0.001, where CS+ is significantly different from CS− and control: Tukey–Kramer post hoc test, p ≤ 0.05) (D) Average M17 responses across pretests and extinction trials for CS+, CS− and control (significance levels: ***p ≤ 0.001, **p ≤ 0.01, *p ≤ 0.05; paired t-tests for within group comparison between pretest and extinction, unpaired t-tests with Bonferroni correction for between group comparison of CS+, CS− and control group, n = 29 bees, errors: SEM).
Associative Plasticity in PCT Neurons Induced by Differential Conditioning
We imaged a total of 31 bees during and after odor conditioning. In all but two bees, the M17 electromyograms were recorded and quantified as described above (Figures 4C,D). Ca2+ signals reliably appeared in the median layer of the αL (as described above and shown in Figure 2B); this region was chosen as a ROI and signals were quantified by averaging the pixels in this region during the stimulus. The selected ROIs overlap across all animals (Figure 5A).
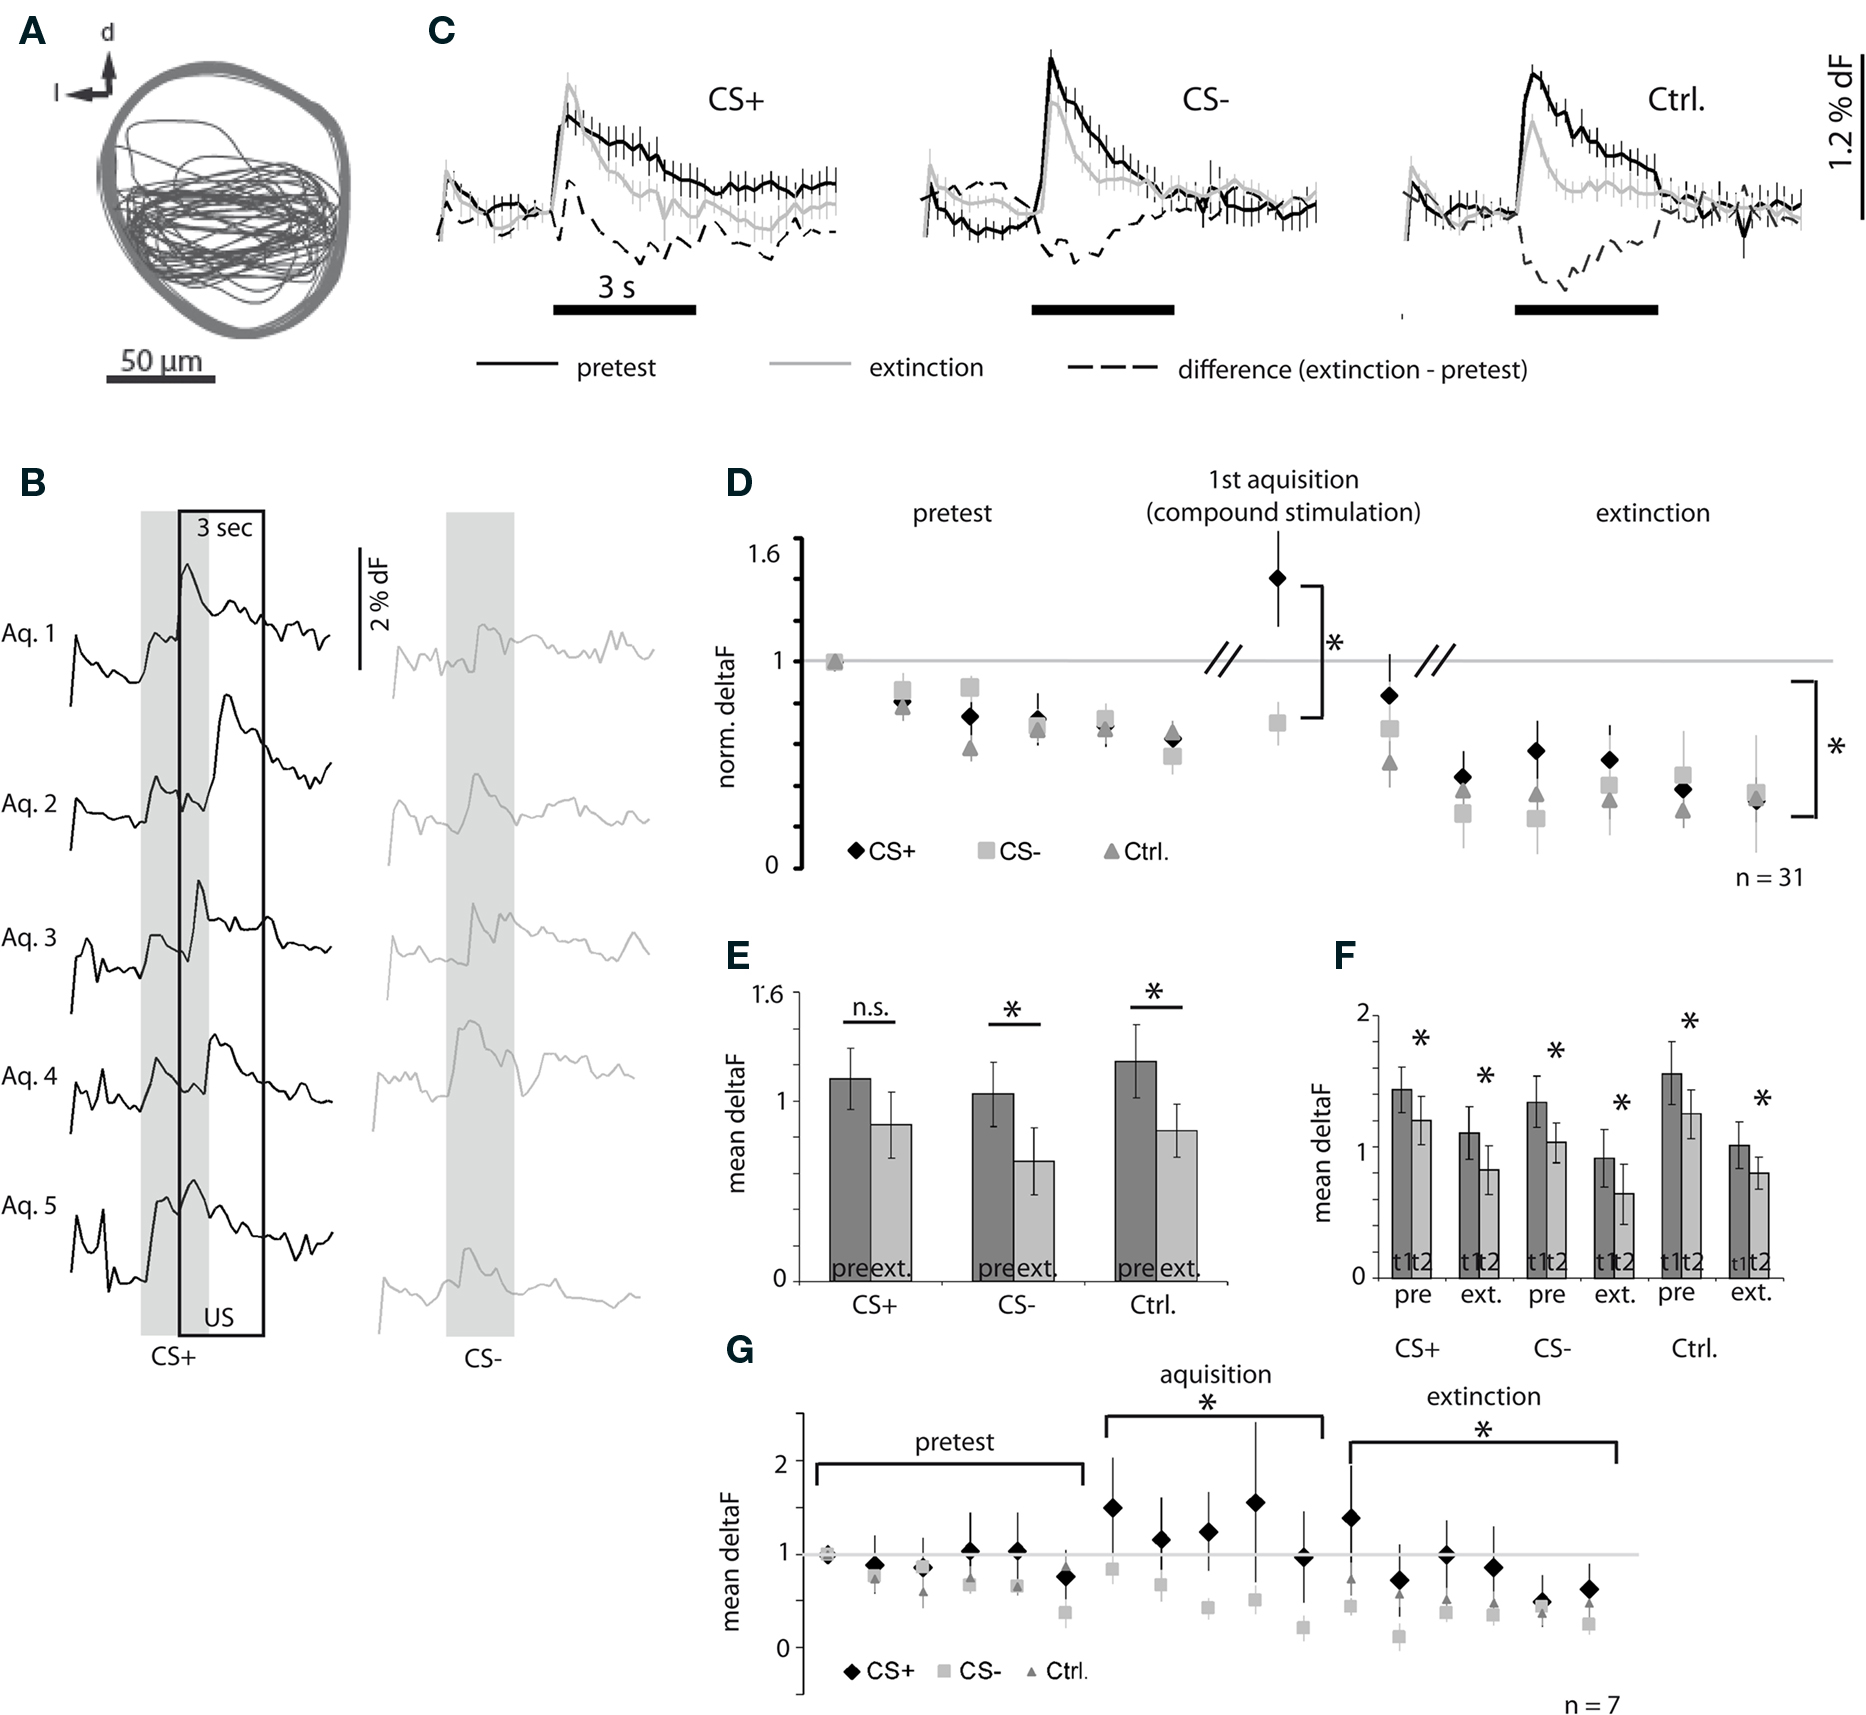
Figure 5. Ca2+ signals of PCT neurons recorded during differential conditioning. (A) ROIs in the α-lobe from which the signals were quantified. (B) Representative Ca2+ dynamics recorded from one bee during acquisition trials. Notice the shift to larger responses to CS+ in the course of acquisition. (C) Representative Ca2+ dynamics recorded in one bee during pretest and extinction trials, and the difference between pretest and extinction for the three conditions: CS+, CS− and control odor [n = 6 trials, error: SEM, same subject as in (B)]. (D) Mean responses during pretest, first acquisition trial and extinction trials scaled for each bee and each odor to the first response (gray line). Statistics: a one-way ANOVA reveals that the response strengths differ significantly between the CS+ (compound stimulation with odor and sucrose) and CS− group during the first acquisition trial (df = 1, F = 8.03, p ≤ 0.01). There is also a significant difference between the CS+ and the CS− and control group during extinction (one-way ANOVA for repeated measures, df = 2, F = 5.44, p ≤ 0.01, Tukey–Kramer post hoc test: p ≤ 0.05, n = 31, error bars: SEM). (E) Mean response across all trials for each bee, the responses to CS− and control are significantly weaker after training compared to the response strength before training (paired t-test: *p ≤ 0.05, n = 31, error bars: SEM). (F) Mean responses for the first and the second trial during pretest and acquisition for each condition, respectively. In all cases the second trial yields significantly weaker responses than the first trial (paired t-test: *p ≤ 0.05, n = 31, error bars: SEM). (G) A subset of bees was also imaged during acquisition (responses scaled for each bee and each odor to the first response). The figure shows the mean responses during stimulation for each trial. Responses to CS+ and CS− are significantly different during acquisition (one-way ANOVA for repeated measures, df = 1, F = 19.06, p ≤ 0.001), The CS+ responses during extinction trials are significantly different from CS− and control odor (one-way ANOVA for repeated measures, df = 2, F = 25.60, p ≤ 0.001, Tukey–Kramer post hoc test: p ≤ 0.05, n = 7, error: SEM).
Figure 5B shows an example of Ca2+ signals recorded during acquisition. CS+ forward-paired with the US (left column), and CS− (right column) was presented in an alternating fashion in five trials each. In this example we see that responses to the CS+ during conditioning consisted of a two-peaked Ca2+ signal in the early phase of acquisition, the first peak representing the odor response and the second the response to sucrose stimulation (Figure 5B, top). In subsequent acquisition trials the second peak approached the first peak until they finally merged (Figure 5B, bottom). Responses to the CS− are not affected (Figure 5B, right column).
Figure 5C shows an example of the averaged Ca2+ signals recorded in one bee during the six pretest trials (black graph), six extinction trials (gray graph), and their difference (dashed graph) for the CS+, CS−, and control odor, respectively. All signals followed a phasic-tonic time course. In this example, the mean response to the CS− and control odor was weaker in extinction trials than in the pretest trials. The mean response to repetitive CS+ stimulation did not decrease after training as it did for CS− and control odor.
To compare training-induced response plasticity across all bees we measured the response strength by taking the mean amplitude of the responses during the three second odor stimulus. The average response strengths across all bees for each CS+, CS−, and control odor trials are plotted in Figure 5D. The three odors used were randomized as CS+, CS−, and control odor (Table 2). Because the response strength in individual preparations also depends on the amount of dye and probably on the number of stained neurons, the responses were scaled by dividing each odor response by the first response to the respective odor for each animal, such that the response strength in the first pretest trial for all odors equals one. The acquisition responses were only recorded during the first acquisition trial for CS+ and CS−, because we anticipated that light exposure during imaging recordings would induce additional stress in the bees and prevent proper acquisition. We found that repeated odor presentations led to a response decrease during pretest for CS+, CS−, and control odor with the same dynamic. No difference was detected between the three groups before training. During the first acquisition trial the combined response to odor and sucrose (CS+, US) was significantly stronger than the response to the CS−. Repeated odor stimulation also induced a response decrease during extinction trials. This decrement was significantly different for CS+, compared to CS− and the control odor. While the amplitude of responses to CS− and control odor decreased further from the level of the last pretest trial, the CS+ responses after acquisition were significantly stronger, at about the level of the second pretest trial. Only after five extinction trials the CS+ responses are at the level of the CS− and control odor responses. This result indicates that the effect induced by the repeated odor exposure is rescued to some degree by the associative effect induced by the conditioning procedure, specifically for the CS+. A consequence of this property is that the averaged responses across all trials during pretest and acquisition for the CS+ show no significant difference, while the average responses across trials for the CS− and control odor have significantly decreased as shown in Figure 5E. However, regardless of this putative associative effect, for all odors we observe a significant repetition-induced effect. In Figure 5F we make a pair wise comparison of the responses to the first and the second odor exposure during pretest and extinction and find on average significantly lower responses to the second odor exposure compared to the first odor exposure.
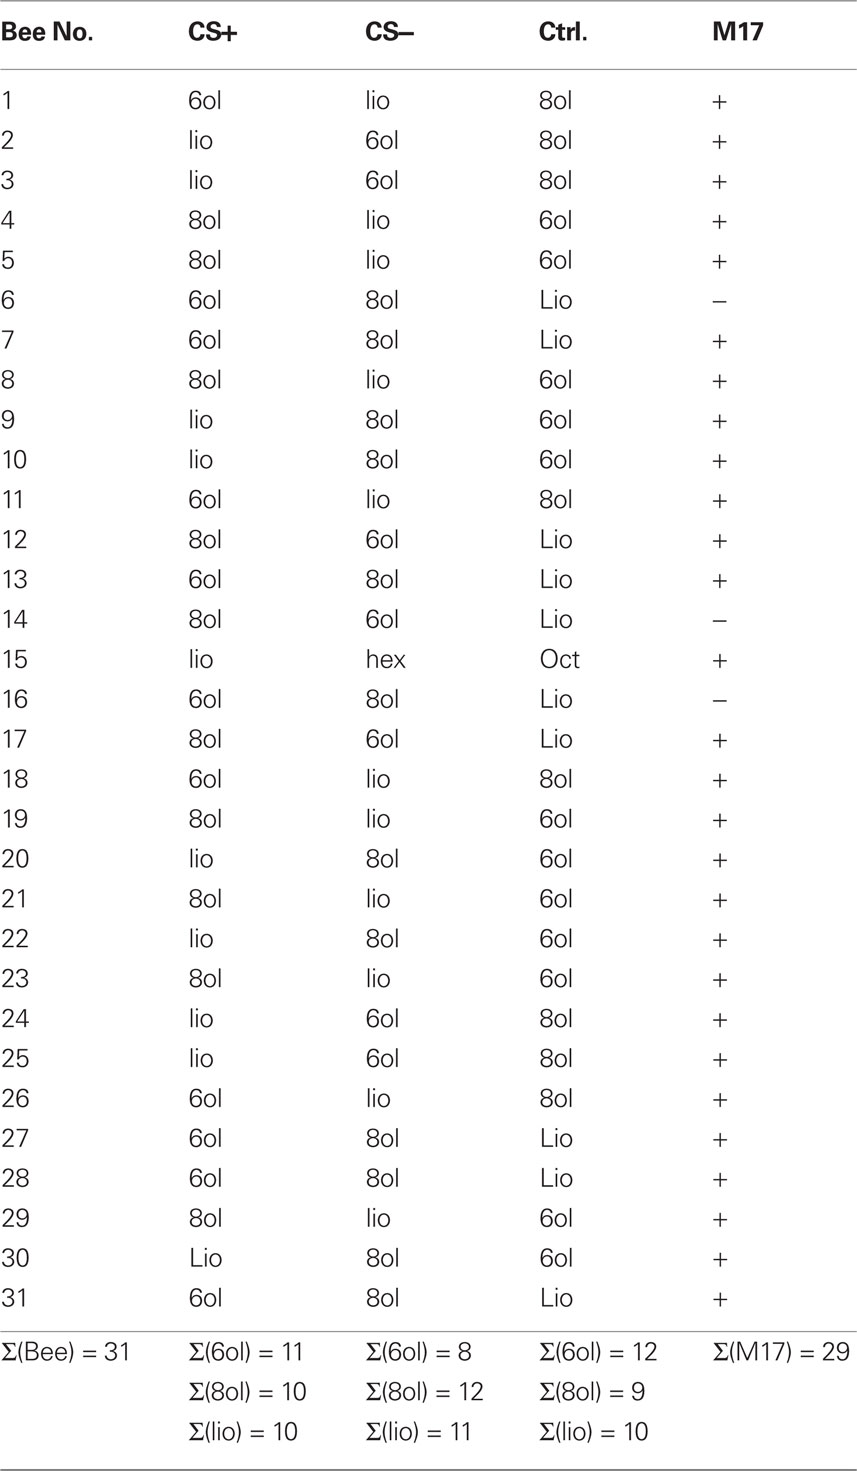
Table 2. Differential conditioning.
In a sample of seven bees we also recorded Ca2+ signals during acquisition and quantified responses in the same way as for the larger sample (described above). Figure 5G gives the responses for each trial of the pretest, acquisition phase and extinction trials. The repetition effect during pretest is less pronounced in this group. During acquisition we find, that while responses to the CS− decrease further from the level of the pretest responses, those to CS+ (paired with the US) did not. Hence, we find a significant difference between CS+ and CS− responses during acquisition. During extinction trials we again find that the repetition-induced decrement in response strength is rescued in the CS+ group while the CS− and control odor responses undergo a further depression and are significantly lower.
Neuronal and Behavioral Plasticity
When we pooled the data from all animals we found a repetition-induced depression of response which can be considered as a non-associative effect. This repetition effect is specifically compensated for, as the CS+ becomes associated with reward. Since we recorded behavior and neuronal responses for 28 animals we wondered whether there would be a link between M17 response and calcium response. However, we did not find an obvious correlation between behavioral performance and neuronal response plasticity on the level of the individual animal (data not shown), that would allow a distinction into “learner” and “non-learner.” Therefore, it cannot be excluded that an association was made although the bees did not show a behavioral change.
In Figure 6 we subtracted the pretest responses of each bee from its responses during the extinction test to the CS+ and CS−, respectively. There is a trend for the CS+ calcium responses to exceed the CS− responses across the set of tested bees, however given that for each bee there are only six data points we find this to be significant only in a few bees when applying a pair wise comparison test (Wilcoxon signed-rank Test). The same is the case for the M17 responses. We observe some bees in which the calcium response to the CS− exceeds the response to the CS+; however these bees tend to show poor learning performances. In bee no. 3, as shown in Figure 6, the M17 response to the CS− is significantly higher than the response to the CS+.
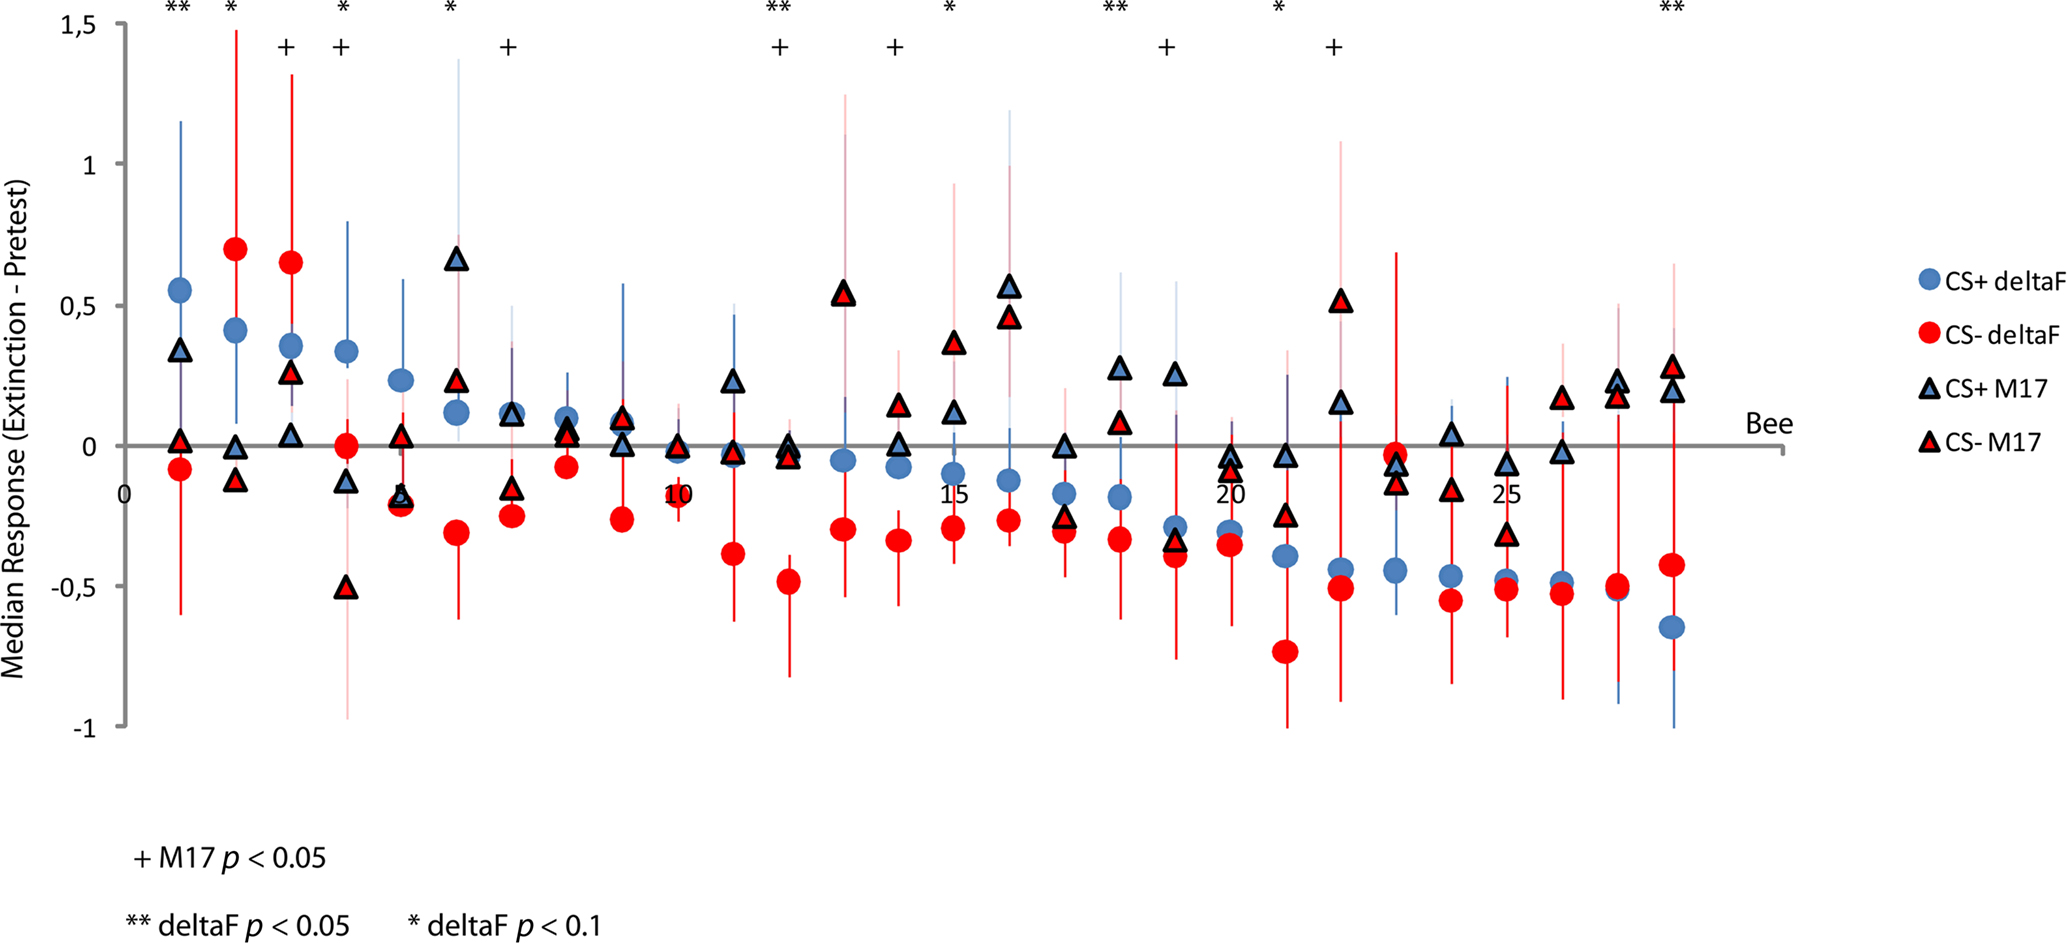
Figure 6. Calcium responses and M17 responses of individual bees. Signals were normalized to the maximum response in each odor and bee. For each bee the pretest responses were subtracted from the responses during the extinction test. Plotted are the medians of the six resulting values for each bee for the CS+ and CS−. Error bars represent the 25% quartile range. Data was sorted according to response strength to the CS+, starting at the left side of the panel. We tested for differences between CS+ and CS− using a Wilcoxon signed-rank test. Given the small number of data points for each bee we chose to also report p values below the 10% level for the calcium responses.
Discussion
Methodological Considerations
We have measured odor and sucrose responses in MB EN of the A3 cluster. The neurons were stained by injecting calcium sensitive Fura-2 and fixable rhodamine into the PCT. The identity of the neurons could that way be checked under the confocal microscope. Our analysis focused on the dendrites of PCT neurons in the αL. In about one third of the preparations, we also found somata from different EN clusters (A6 and A1/2) stained. These EN send dendrites around the MB lobe and were therefore difficult to avoid when aiming for the PCT. However, signals from PCT neurons which were analyzed in the median part of the α-lobe should not overlap with A6 and A1/2 neurons since their dendrites are confined to the ventral αL (Mobbs, 1982; Rybak and Menzel, 1993). We did not observe responses in the somata of A6 or A1/2 EN. In about 10% of the preparations KC were stained in the αL, appearing as vertical bands, but we did not observe Ca2+ signals overlapping with these vertical staining patterns. Attempts to target KC in the αL with dye injection for Ca2+ imaging purposes have so far remained unsuccessful.
The kinetic of the odor responses we observed in the αL during calcium imaging resemble those described earlier for PCT neurons recorded with sharp electrodes (Grünewald, 1999b). In one preparation we could simultaneously record signals of the dendritic region in the αL and the somata region of the PCT neurons. The responses in both respective regions have similar temporal kinetics and were more correlated within the same odor among the different brain regions, than in between odors within the same or different regions; we therefore conclude the signals emerged from the same population of neurons. The response decay in the somata region was found to be somewhat slower, which is consistent with observations from simultaneous imaging of somata and dendritic regions of olfactory projection neurons (Galizia and Kimmerle, 2003) and KC (Szyszka et al., 2005).
Stimulus Coding
While in the ALs of honeybees a spatial code for odor similarity (Sachse et al., 1999) is observed, MB EN do not code odors in such a combinatorial way. The PE1 neuron, a unique and identified MB extrinsic neuron, was found to respond to many odors quite similarly (Rybak and Menzel, 1998). Other αL EN also have a very broad chemical response profile (Strube-Bloss et al., 2008). PCT neurons exhibit rather similar response patterns (Figure 1), although odors can be grouped into three broad categories eliciting (1) phasic-tonic responses dominated by the on-response, (2) off-response, and (3) responses lacking the phasic response component. The response types do not seem to reflect a chemical property of the odor molecules. Perhaps these neurons code a particular meaning of the odor. Such a view may be supported by the following observations: Citral is responded to with a rather tonic activity pattern, whereas nonanol elicits a dominant off-response. Citral is a component of the Nasanov gland, which bee workers use as an appetitive marker, (Martin, 1964), whereas nonanol is a component of the alarm pheromone produced during attacking behavior (Blum et al., 1978). The increase in response strength with rising concentration without a change in response type, as found here for octanol, may support the view that the category of meaning as expressed in the response type is kept constant over a large range of concentrations.
protocerebral-calycal tract neurons, as other MB EN, have been described to respond to stimuli of different sensory modalities (Homberg, 1984; Grünewald, 1999b). We found responses to olfactory and gustatory stimuli delivered to the antenna. However, we did not test tactile stimuli alone, but since responses observed during sucrose stimulation overlap with the PER, they are very likely elicited by the appetitive sucrose stimulus.
Both the CS and US pathway converges onto PCT neurons. Therefore it is a candidate site of associative plasticity. PCT neurons receive input from projection neurons in the lip region of the MB calyx (Ganeshina and Menzel, 2001), and from KC in the lobe regions of the MB (Rybak and Menzel, 1993). They are presynaptic in both the MB lip region (to both projection neurons and KC, (Ganeshina and Menzel, 2001) and in the lobe region, to, e.g., PE1 (Okada et al., 2007). It is believed, but not yet proven, that the PCT neurons transmit spike activity as an inhibitory recurrent feedback loop (from the MB lobe to the MB calyx). The terminals in the MB lip region are thought to be predominately inhibitory outputs to KC and to presynaptic boutons of projection neurons. Therefore it has been hypothesized, that the input from projection neurons to PCT neurons in the lip mediates a fast inhibitory feedback loop via a local microcircuit and does not induce spike transmission via PCT neurons from the MB calyx to the MB lobes. Also, PCT neurons appear to receive input in the lip region from the octopamine immunoreactive VUMmx1 neuron (Sinakevitch et al., 2009) which is an important finding in our context because the VUMmx1 neuron represents an essential component in the reward pathway of the honeybee (Hammer, 1993).
Training Procedure
Monitoring behavior during imaging experiments revealed that bees learn to associate the rewarded odor. Our preparation for Ca2+ imaging was modified in an important way compared to previous studies (e.g., Faber et al., 1999; Szyszka et al., 2008), to allow bees to freely move their mouth parts while restrained for the experiment. Movement of the brain was reduced by the application of a two-component silicone gel that was filled into the head capsule – a technique adapted from electrophysiological studies on honeybees (Okada et al., 2007). Under these conditions bees reach higher acquisition values and form a robust odor memory when conditioned during imaging experiments. This way, we were able to monitor the learning success of individual bees during the experiment. As in behavioral experiments of PER conditioning alone (Bitterman et al., 1983) not all bees learned the odor during the five acquisition trials and some bees already responded to the test odors during the pre-training phase. The latter has been related to bees generalizing from earlier learning under natural conditions (Gerber et al., 1996).
The statistical analysis of our data required multiple tests during pretest, and the extinction phase (three odors, each tested six times in both phases). Repeated stimulations before training can induce latent inhibition and may have slowed down acquisition, although earlier studies have shown that inhibition usually requires a larger number of odor pre-exposures to have an effect on subsequent learning (Abramson and Bitterman, 1986; Chandra et al., 2000, 2001).
The extinction process is a learning phase in itself (Stollhoff et al., 2005), and we have to expect a loss of learned responses, both at the behavioral and at the physiological level in the course of extinction. Indeed, extinction trials are quite efficient in reducing learned responses on the behavioral level (Bitterman et al., 1983; Stollhoff et al., 2005). As Figures 5E–G show extinction trials lead to a reduction of Ca2+ responses. However, the decrement of Ca2+ responses as seen in repeated stimulations during the pre-test phase and during extinction trials is rather similar and it is therefore difficult to distinguish between an extinction effect and a decrement induced by stimulus repetition on the level of the Ca2+ responses.
Non-Associative Plasticity
Decrements of Ca2+ signals induced by stimulus repetition have been reported earlier by Szyszka et al. (2008) who measured Ca2+ signals of KC dendrites. Since no such repetition effects were seen in olfactory projection neurons, neither in their Ca2+ signals (Peele et al., 2006), nor in their intracellularly recorded spike activity (Abel et al., 2001; Müller et al., 2002), it was concluded that the decay in response strength reflects a form of non-associative learning at the level of the MB input rather than sensory adaptation. This may be a specific property of the honeybee olfactory system because in locusts, repetition-induced response decay has been described for olfactory projection neurons and was ascribed to non-associative plasticity at the level of the AL (Stopfer and Laurent, 1999; Bazhenov et al., 2005). Stimulus-specific response decrease as a correlate of non-associative learning (i.e., stimulus familiarity) has been described at the level of neurons of the inferior temporal cortex in the visual pathway of primates (Miller et al., 1991; Li et al., 1993; Sobotka and Ringo, 1994). There, the majority of neurons decrease their responses as novel stimuli become familiar, while a small fraction increases their responses. It has been proposed that inferior temporal cortex neurons act as a filter that preferentially passes on information about novel, not previously experienced stimuli (Miller et al., 1991), and that a feedback induced by these neurons may serve to focus peripheral systems on certain stimuli or stimulus traits (Li et al., 1993; Sobotka and Ringo, 1994). Specific response reduction to familiar stimuli has also been described in the auditory system of songbirds in neurons of the neocaudal striatum (Chew et al., 1996a,b; Phan et al., 2006), where a decreased neuronal response is interpreted as recognition of a stimulus such as a conspecific male song (Stripling et al., 2001), and expression of immediate early genes is induced by familiar auditory stimuli in these neurons (Chew et al., 1995). Our results support the idea that the MB is involved in sensory filtering in insects. An up-regulation of inhibitory feedback onto neurons presynaptic to PCT neurons in the course of familiarization of a stimulus may serve to focus on recognized traits of complex stimuli.
Associative Plasticity
Associative plasticity in the olfactory pathway of the honeybee brain has been described at several processing stages. In the AL responses increase and sharpen to a previously rewarded odor (Faber et al., 1999). So far, this phenomenon could not be related to a specific neuronal type; however olfactory projection neurons may not be uniformly affected by this type of plasticity (Peele et al., 2006). Recently, work from our lab has shown that projection neurons change their response properties to CS+ and CS− during differential conditioning in different ways. About half of the neurons increase their responses more strongly to the CS+ than to the CS−, and the other half reduce their responses more strongly to CS+ than to CS− (Denker et al., 2010). Also, a signature of synchrony of the sustained response of projection neurons was found, the power of the local field potential in the 40–50 Hz region increases whereas that of the phasic on-response decreases. At the level of the MB input region, (KC in the calyces) associative plasticity leads to a response increase to the rewarded odor (Faber and Menzel, 2001; Szyszka et al., 2008) and a compensation of the depression effect induced by stimulus repetition (Szyszka et al., 2008). In addition, preparations were found in which KC were recruited to responses to the CS+, and other KC dropped out from CS+ responses. The recruitment effects were more dominant for the CS+ than for the CS−, whereas the drop-out effects were more dominant for the CS−.
Previous studies in PCT and other EN, mainly PE1 which might be a target for inhibition from PCT feedback neurons, have led to seemingly contradictory results. (Okada et al., 2007) showed that PE1 reduces its response to CS+ after differential conditioning. These authors interpret their data as indicating an increased inhibition from PCT neurons as a possible source for this response reduction. However, in intracellular electrophysiological recordings of individual PCT neurons Grünewald (1999b) found in average a decrease of responses to an odor that had been paired once with sucrose. However, also in this study different response changes were observed in different preparations. In our present study, we find in the pooled dataset, besides the effect of response decrement upon repeated stimulus presentation discussed above, an increase in response strength to the previously rewarded odor as compared to a non-rewarded odor (CS−) or an odor not presented during training (control odor). When we looked at individual bees, we find that there is an overall trend for the calcium responses to the CS+ to exceed the responses to the CS−, although in some cases the trend seems to be reversed. The bees with CS− responses that exceeded the CS+ responses, in all cases showed a poor learning performance as shown by the M17 responses. In one case M17 responses to the CS− during extinction were significantly higher than to the CS+, indicating that the bee has not learned to associate the odor with reward. This result pronounces the significance of monitoring behavioral performance when looking at physiological activity linked the respective behavior and may contribute to understanding seemingly contradictory results between different studies.
Implications for the MB Network
The analysis of the individual neuronal and behavioral changes induced by associative conditioning revealed several forms of plasticity in PCT neurons. We found increased neuronal responses to CS+ after training, response decrease which was compensated for specifically for the CS+ and response decrease which was strongest for the CS+. The observed neuronal changes were positively or negatively linked to the behavioral change.
In Drosophila GABAergic anterior lateral paired neurons involved in the MB circuitry have been described to inhibit olfactory learning (Liu et al., 2007). Expression of the GABAA receptor RDL suppresses the conditioned stimulus pathway in the MB (Liu et al., 2009). In future work with the honeybee, it will be important to combine physiological and behavioral studies with the identification of the receptors involved in inhibitory feedback. PCT neurons are subject to associative and non-associative plasticity. Moreover, the neuronal plasticity may be linked to the behavioral change induced by associative conditioning. In the future, it would be very interesting to address individually identifiable EN, possibly by iontophoretically injecting functional dyes into a single neuron, or a few neurons, and performing subsequent imaging.
Conflict of Interest Statement
The authors declare that the research was conducted in the absence of any commercial or financial relationships that could be constructed as a potential conflict of interest. This work was supported by the DFG.
Acknowledgments
We thank Dr. P. Szyzska, for help with the Ca2+ Imaging, Dr. M. Strube-Bloss and Dr. A. Hussaini for help with M17 recordings and Dr. M. Schmuker for comments on an early version of the manuscript.
References
Abel, R., Rybak, J., and Menzel, R. (2001). Structure and response patterns of olfactory interneurons in the honeybee, Apis mellifera. J. Comp. Neurol. 437, 363–383.
Abramson, C. I., and Bitterman, M. E. (1986). Latent inhibition in honeybees. Anim. Learn. Behav. 14, 184–189.
Bazhenov, M., Stopfer, M., Sejnowski, T. J., and Laurent, G. (2005). Fast odor learning improves reliability of odor responses in the locust antennal lobe. Neuron 46, 483–492.
Bicker, G., Schäfer, S., and Kingan, T. G. (1985). Mushroom body feedback interneurones in the honeybee show GABA-like immunoreactivity. Brain Res. 360, 394–397.
Bitterman, M. E., Menzel, R., Fietz, A., and Schäfer, S. (1983). Classical conditioning of proboscis extension in honeybees (Apis mellifera). J. Comp. Psychol. 97, 107–119.
Blum, M. S., Collins, A. M., Fales, H. S. W., and Tucker, K. (1978). Chemistry of the sting apparatus of the worker honeybee. J. Apic. Res. 17, 218–221.
Braun, G., and Bicker, G. (1992). Habituation of an appetitive reflex in the honeybee. J. Neurophysiol. 67, 588–598.
Chandra, S. B., Hosler, J. S., and Smith, B. H. (2000). Heritable variation for latent inhibition and its correlation with reversal learning in honeybees (Apis mellifera). J. Comp. Psychol. 114, 86–97.
Chandra, S. B., Hunt, G. J., Cobey, S., and Smith, B. H. (2001). Quantitative trait loci associated with reversal learning and latent inhibition in honeybees (Apis mellifera). Behav. Genet. 31, 275–285.
Chew, S. J., Mello, C., Nottebohm, F., Jarvis, E., and Vicario, D. S. (1995). Decrements in auditory responses to a repeated conspecific song are long-lasting and require two periods of protein synthesis in the songbird forebrain. Proc. Natl. Acad. Sci. U.S.A. 92, 3406–3410.
Chew, S. J., Vicario, D. S., and Nottebohm, F. (1996a). A large-capacity memory system that recognizes the calls and songs of individual birds. Proc. Natl. Acad. Sci. U.S.A. 93, 1950–1955.
Chew, S. J., Vicario, D. S., and Nottebohm, F. (1996b). Quantal duration of auditory memories. Science 274, 1909–1914.
DeBelle, J. S., and Heisenberg, M. (1994). Associative odor learning in drosophila abolished by chemical ablation of mushroom bodies. Science 263, 692–695.
Denker, M., Finke, R., Schaupp, F., Grün, S., and Menzel, R. (2010). Neural correlates of odor learning in the honeybee antennal lobe. Eur. J. Neurosci. 31, 119–133.
Erber, J., Masuhr, T. H., and Menzel, R. (1980). Localization of short-term memory in the brain of the bee. Physiol. Entomol. 5, 343–358.
Faber, T., Joerges, J., and Menzel, R. (1999). Associative learning modifies neural representations of odors in the insect brain. Nat. Neurosci. 2, 74–78.
Faber, T., and Menzel, R. (2001). Visualizing mushroom body response to a conditioned odor in honeybees. Naturwissenschaften 88, 472–476.
Galizia, C. G., Joerges, J., Küttner, A., Faber, T., and Menzel, R. (1997). A semi-in-vivo preparation for optical recording of the insect brain. J. Neurosci. Methods 76, 61–69.
Galizia, C. G., and Kimmerle, B. (2003). Physiological and morphological characterization of honeybee olfactory neurons combining electrophysiology, calcium imaging and confocal microscopy. J. Comp. Physiol. A Neuroethol. Sens. Neural. Behav. Physiol. 190, 21–38.
Galizia, C. G., and Vetter, R. S. (2004). “Optical methods,” in Methods in Insect Sensory Neuroscience, ed. T. A. Christensen (Boca Raton: CRC Press), 345–388.
Ganeshina, O., and Menzel, R. (2001). GABA-immunoreactive neurons in the mushroom bodies of the honeybee: an electron microscopic study. J. Comp. Neurol. 437, 335–349.
Gerber, B., Geberzahn, N., Hellstern, F., Klein, J., Kowalsky, O., Wüstenberg, D. G., and Menzel, R. (1996). Honey bees transfer olfactory memories established during flower visits to a proboscis extension paradigm in the laboratory. Anim. Behav. 52, 1079–1085.
Gronenberg, W. (1986). Physiological and anatomical properties of optical input-fibres to the mushroom body in the bee brain. J. Insect Physiol. 32, 695–704.
Gronenberg, W. (1987). Anatomical and physiological properties of feedback neurons of the mushroom bodies in the bee brain. Exp. Biol. 46, 115–125.
Grünewald, B. (1999a). Physiological properties and response modulations of mushroom body feedback neurons during olfactory learning in the honeybee, Apis mellifera. J. Comp. Physiol. A 185, 565–576.
Grünewald, B. (1999b). Morphology of feedback neurons in the mushroom body of the honeybee, Apis mellifera. J. Comp. Neurol. 404, 114–126.
Haehnel, M., Froese, A., and Menzel, R. (2009). In vivo Ca2+-imaging of mushroom body neurons during olfactory learning in the honey bee. J. Vis. Exp. doi: 10.3791/1353. [Epub ahead of print].
Hammer, M. (1993). An identified neuron mediates the unconditioned stimulus in associative olfactory learning in honeybees. Nature 366, 59–63.
Heisenberg, M. (1989). Genetic approach to learning and memory (mnemogenetics) in Drosophila melanogaster. Fortschr. Zool. 37, 3–45.
Homberg, U. (1984). Processing of antennal information in extrinsic mushroom body neurons of the bee brain. J. Comp. Physiol. A 154, 825–836.
Huber, F. (1962). Central nervous control of sound production in crickets and some speculations on its evolution. Evolution 16, 429–442.
Iwama, A., and Shibuya, T. (1998). Physiology and morphology of olfactory neurons associating with the protocerebral lobe of the honeybee brain. J. Insect Physiol. 44, 1191–1204.
Joerges, J., Küttner, A., Galizia, C. G., and Menzel, R. (1997). Representations of odors and odor mixtures visualized in the honeybee brain. Nature 387, 285–288.
Kandel, E. R. (2001). The molecular biology of memory storage: a dialog between genes and synapses. Biosci. Rep. 21, 565–611.
Kirschner, S., Kleineidam, C. J., Zube, C., Rybak, J., Grünewald, B., and Rössler, W. (2006). Dual olfactory pathway in the honeybee, Apis mellifera. J. Comp. Neurol. 499, 933–952.
Kuwabara, M. (1957). Bildung des bedingten reflexes von pavlovs typus bei der honigbiene Apis mellifica. Hokaido Univ. Zool. J. Sci. 13, 458–464.
Li, L., Miller, E. K., and Desimone, R. (1993). The representation of stimulus familiarity in anterior inferior temporal cortex. J. Neurophysiol. 69, 1918–1929.
Liu, L., Heisenberg, M., Wolf, R., and Ernst, R. (1999). Context generalization in drosophila visual learning requires the mushroom bodies. Nature 400, 753–756.
Liu, X., Buchananan, M. E., Han, K.-A., and Davis, R. L. (2009). The GABAA receptor RDL suppresses the conditioned stimulus pathway for olfactory learning. J. Neurosci. 12, 1573–1579.
Liu, X., Krause, W. C., and Davis, R. L. (2007). GABAA receptor RDL inhibits drosophila olfactory associative learning. Neuron 56, 1090–1102.
Martin, H. (1964). Zur Nahorientierung der Biene im Duftfeld zugleich ein Nachweis für die osmotropotaxis bei insekten. Z. Vgl. Physiol. 48, 481–553.
Martin, J.-R., Ernst, R., and Heisenberg, M. (1998). Mushroom bodies suppress locomotor activity in drosophila melanogaster. Learn. Mem. 5, 179–191.
Mauelshagen, J. (1993). Neural correlates of olfactory learning paradigms in an identified neuron in the honeybee brain. J. Neurophysiol. 69, 609–625.
Menzel, R. (2008). “Insect minds for human minds,” in Human Learning, eds A. S. Benjamin, J. Steven de Belle, and T. A. Plok (London: Elsevier), 271–285.
Menzel, R., and Manz, G. (2005). Neural plasticity of mushroom body-extrinsic neurons in the honeybee brain. J. Exp. Biol. 208, 4317–4332.
Menzel, R., Masuhr, H. T., and Erber, J. (1974). “Experimental analysis of insect behaviour,” in Learning and Memory, ed. L. B. Brown (Berlin: Springer-Verlag), 195–218.
Miller, E. K., Li, L., and Desimone, R. (1991). A neural mechanism for working and recognition memory in inferior temporal cortex. Science 254, 1377–1379.
Mobbs, P. G. (1982). The brain of the honeybee Apis Mellifera. I. The connections and spatial organization of the mushroom bodies. Philos. Trans. R. Soc. Lond., B, Biol. Sci. 298, 309–354.
Müller, D., Abel, R., Brandt, R., Zoeckler, M., and Menzel, R. (2002). Differential parallel processing of olfactory information in the honeybee, Apis mellifera L. Journal of Comparative Physiology A 188, 359–370.
Okada, R., Rybak, J., Manz, G., and Menzel, R. (2007). Learning-related plasticity in PE1 and other mushroom body-extrinsic neurons in the honeybee brain. J. Neurosci. 27, 11736–11747.
Peele, P., Ditzen, M., Menzel, R., and Galizia, C. G. (2006). Appetitive odor learning does not change olfactory coding in a subpopulation of honeybee antennal lobe neurons. J. Comp. Physiol. A 192, 1083–1103.
Phan, M. L., Pytte, C. L., and Vicario, D. S. (2006). Early auditory experience generates long-lasting memories that may subserve vocal learning in songbirds. Proc. Natl. Acad. Sci. U.S.A. 103, 1088–1093.
Rehder, V. (1987). Quantification of the honeybee’s proboscis reflex by electromyographic recordings. J. Insect Physiol. 33, 501–507.
Rybak, J., and Menzel, R. (1993). Anatomy of the mushroom bodies in the honey bee brain: the neuronal connections of the alpha-lobe. J. Comp. Neurol. 334, 444–465.
Rybak, J., and Menzel, R. (1998). Integrative properties of the pe1 neuron, a unique mushroom body output neuron. Learn. Mem. 5, 133–145.
Sachse, S., Rappert, A., and Galizia, C. G. (1999). The spatial representation of chemical structures in the antennal lobe of honeybees: steps towards the olfactory code. Eur. J. Neurosci. 11, 3970–3982.
Sinakevitch, I., Birman, S., and Smith, B. H. (2009). “An octopamine receptor (AmOA1/OAMB) is expressed in inhibitory neurons in olfactory learning and memory centers in the honeybee and the fruit fly,” in Neuroscience 2009 (Chicago: Society for Neuroscience), Abstract No.: 350.6/V31.
Sobotka, S., and Ringo, J. L. (1994). Stimulus specific adaptation in excited but not in inhibited cells in inferotemporal cortex of macaque. Brain Res. 646, 95–99.
Stollhoff, N., Menzel, R., and Eisenhardt, D. (2005). Spontaneous recovery from extinction depends on the reconsolidation of the acquisition memory in an appetitive learning paradigm in the honeybee (Apis mellifera). J. Neurosci. 25, 4485–4492.
Stopfer, M., and Laurent, G. (1999). Short-term memory in olfactory network dynamics. Nature 402, 664–668.
Strausfeld, N., Homburg, U., and Kloppenberg, P. (2000). Parallel organization in honey bee mushroom bodies by peptidergic kenyon cells. J. Comp. Neurol. 424, 179–195.
Strausfeld, N. J. (2002). Organization of the honey bee mushroom body: representation of the calyx within the vertical and gamma lobes. J. Comp. Neurol. 450, 4–33.
Stripling, R., Kruse, A. A., and Clayton, D. F. (2001). Development of song responses in the zebra finch caudomedial neostriatum: role of genomic and electrophysiological activities. J. Neurobiol. 48, 163–180.
Strube-Bloss, M. F., Nawrot, M. P., and Menzel, R. (2008). “Odor learning leads to the recruitment of previously non-responding alpha-lobe extrinsic neurons in the honeybee,” in Annual Meeting of the Society of Neuroscience (Washington, DC: SFN), Abstract No.: 792.17/TT65.
Szyszka, P., Ditzen, M., Galkin, A., Galizia, C. G., and Menzel, R. (2005). Sparsening and temporal sharpening of olfactory representations in the honeybee mushroom bodies. J. Neurophysiol. 94, 3303–3313.
Keywords: mushroom body, GABA, plasticity, calcium imaging, feedback neurons
Citation: Haehnel M and Menzel R (2010) Sensory representation and learning-related plasticity in mushroom body extrinsic feedback neurons of the protocerebral tract. Front. Syst. Neurosci. 4:161. doi:10.3389/fnsys.2010.00161
Received: 14 February 2010;
Accepted: 08 December 2010;
Published online: 23 December 2010.
Edited by:
Zachary F. Mainen, Cold Spring Harbor Laboratory, USAReviewed by:
Glenn Turner, Cold Spring Harbor Laboratory, USAVivek Jayaraman, Howard Hughes Medical Institute, USA
Copyright: © 2010 Haehnel and Menzel. This is an open-access article subject to an exclusive license agreement between the authors and the Frontiers Research Foundation, which permits unrestricted use, distribution, and reproduction in any medium, provided the original authors and source are credited.
*Correspondence: Melanie Haehnel, Whitney Laboratory of Marine Bioscience, University of Florida, 9505 Oceanshore Boulevard, St. Augustine, Gainesville, FL 32080, USA. e-mail: haehnel@neurobiologie.fu-berlin.de