In search of the structure of human olfactory space
- 1 Cold Spring Harbor Laboratory, Neuroscience Program, Cold Spring Harbor, NY, USA
- 2 Department of Biological Sciences, Columbia University, New York, NY, USA
- 3 Howard Hughes Medical Institute Janelia Farm Research Campus, Howard Hughes Medical Institute, Ashburn, VA, USA
We analyze the responses of human observers to an ensemble of monomolecular odorants. Each odorant is characterized by a set of 146 perceptual descriptors obtained from a database of odor character profiles. Each odorant is therefore represented by a point in a highly multidimensional sensory space. In this work we study the arrangement of odorants in this perceptual space. We argue that odorants densely sample a two-dimensional curved surface embedded in the multidimensional sensory space. This surface can account for more than half of the variance of the perceptual data. We also show that only 12% of experimental variance cannot be explained by curved surfaces of substantially small dimensionality (<10). We suggest that these curved manifolds represent the relevant spaces sampled by the human olfactory system, thereby providing surrogates for olfactory sensory space. For the case of 2D approximation, we relate the two parameters on the curved surface to the physico-chemical parameters of odorant molecules. We show that one of the dimensions is related to eigenvalues of molecules’ connectivity matrix, while the other is correlated with measures of molecules’ polarity. We discuss the behavioral significance of these findings.
Introduction
Our current understanding of many sensory modalities is based on knowledge of the underlying sensory spaces. For example, visual stimuli are well described by their position and the spectral content of the light emitted/scattered by them. The somatosensory system represents positions of stimuli relative to the body surface, which leads to the body-centric somatosensory world. Our understanding of the sense of smell is hindered by the lack of a well-defined perceptual space and knowledge of how this space is related to the properties of odorant molecules (Wise et al., 2000; Gottfried, 2010). These questions have been the topics of several recent studies (Mamlouk and Martinetz, 2004; Khan et al., 2007; Haddad et al., 2008a; Zarzo and Stanton, 2009).
Here we investigate the structure of olfactory space defined by the responses of human observers. We base our analyses on the Atlas of Odor Character Profiles, (AOCP; Dravnieks, 1985), a database of sensory responses of human observers to an array of odorants. We show that odorants in human olfactory space accumulate near a 2D curved manifold (a curved surface that can be locally approximated by a plane). The 2D manifold accounted for 51% of the variability in the experimental data. This finding prompted us to seek an approximation to the sensory space in the form of curved continuous surfaces of higher dimension. Below we show that an approximation of these responses with continuous spaces of sufficiently low dimensionality higher than two could account for 81% of the variability in experimental data. We also found that the intrinsic statistical variability in the data is at least 7%. Thus, only the remaining variance of 12% or less can be attributed to discontinuous features in the sensory space. We therefore argue that a curved continuous manifold of sufficiently low dimension carries most of the information about known features of human olfactory perception.
Materials and Methods
Responses to Odorants
Responses to 144 odorants were obtained from Dravnieks (1985) and represented in a set of 146D vectors  (i = 1…144). We used the percent used (PU) set of responses from Dravnieks (1985). PU describes the fraction of about 150 observers that thought that a given descriptor applies to an odorant. We verified that our conclusions do not change substantially if other parameters are used instead of PU. We performed principle component analysis (PCA) on the vectors using the single value decomposition (SVD) procedure. All computations were performed using MATLAB (Mathworks, Inc.). Before applying PCA we normalized response vectors to have unit length in terms of the L2 measure. This implies that the vectors resided on a unit sphere in 146D. This reduced somewhat the dimensionality of the dataset to 145D. The normalization step was intended to equalize the odorants in their perceived intensity or concentration. We verified that our conclusions do not change qualitatively if other measures (L2 through L9) are used for normalization. We noticed some deterioration of the fits beyond this range.
Approximating Odorant Response with Curved Spaces
Each odorant vector  was approximated with the “projected” vector
  . Here index i enumerates the odorants while each vector contains 146 components corresponding to semantic descriptors. The projected vectors were sought in the form

Here  ,
,  , and
, and  are odorant-independent parameters of the surface. Parameters specify the curvature of the manifold. Parameters xαi define positions of odorants on the surface. D is the number of parameters per odorant which is the dimensionality of the surface. The manifold defined by this equation is D-dimensional. In Figure 2 we used D = 2, while in Figure 4 the dimensionality was varied. To find
  , ,
, ,  , and xαi we minimized
  using the conjugate gradient algorithm. The set of parameters xαi was determined therefore as the nearest points on the curved manifold. The nearest points define “projections” onto the curved manifold.
Jackknife Procedure
Approximating human sensory responses with higher dimensional curved manifolds is confounded by a dramatic increase in the number of parameters of fit. Because the number of parameters increases as a second power of the number of dimensions in our quadratic regression, for a moderately low-dimensional manifold we find that we can perfectly fit all of the experimental data (Figure 4A, dashed line). To avoid this overfitting problem we employed the jackknife technique, in which we remove a single odorant from the perceptual database, obtain a high-dimensional fit for the responses to the remaining compounds, and calculate the distance between the fitted manifold and the removed odorant. By applying this procedure for all odorants in the database sequentially we evaluated a variance of the approximation with curved manifolds. The variance does not vanish for spaces of high dimensionality due to overfitting (Figure 4A, solid line).
Estimating the Variability due to a Finite Number of Observers
The perceptual variable used here PU is convenient for estimating the experimental variability. We resampled the data for every entry in the database independently using 149 observers as specified in Dravnieks (1985). We estimated the variance of the resulting ensemble to be equal to 7% of the experimental variance present in Dravnieks (1985).
The Coordinates on the Surface
The natural system of coordinates of the 2D surface was used to equilibrate the density of odorants (grid in Figure 3). The odorants were projected onto the 2D plane and the Delaunay triangulation (Berg, 2008) was calculated. The edges of triangulation were replaced with elastic strings of unit equilibrium length and a coordinate transformation was found that minimizes the elastic energy of the strings. The coordinate transformation was constrained to the form used above (Eq. 1) with the mapping of 2D to 2D space. The results are shown in Figure S2 in Supplementary Material.
Physico-Chemical Parameters
The values of 72 parameters were calculated using the program Molecular Modeling Pro™ (ChemSW, Failfield, CA, USA). We verified that the use of 1999 parameters generated by E-Dragon (VCCLAB.org) did not improve the result suggesting a redundancy in the data. We used z-scores for the parameters as detailed in the Supplementary Materials online (see Materials and Methods).
Results
Approximation of Olfactory Perceptual Data by a 2D Curved Space
The AOCP database contains information about responses of human observers to 144 monomolecular odorants. Each odorant is characterized by a set of 146 semantic descriptors, such as “fruity,” “floral,” “sickening,” “warm,” etc. (see Supplementary Material for complete list of odorants and descriptors.) The database was constructed by having ∼150 participants rate applicability of each of the 146 semantic descriptors to each of 144 monomolecular odorants. The parameter used in our analysis reflects the percentage of observers that recognized the semantic descriptor as applying to a given odorant (Dravnieks, 1985). The database can therefore be viewed as a set of 144 points representing individual odorants positioned in a 146-dimensional space of semantic descriptors. The resultant cloud of 144 points placed into the multidimensional space of descriptors contains vast information about human perception of monomolecular odorants.
To visualize the multidimensional cluster of odorants, we projected the 146D descriptor space onto the first three principal components (PCs), which were defined as the most informative directions about the data set (Figures 1A,B). Only 52% of the data variance is included in the low-dimensional representation by the first three PCs (Figure 1E). We use PCA only for visualization of the correlations present within the dataset. To account for these correlations, we analyze the full, 146D set of data rather than the PCA projection, as detailed below.
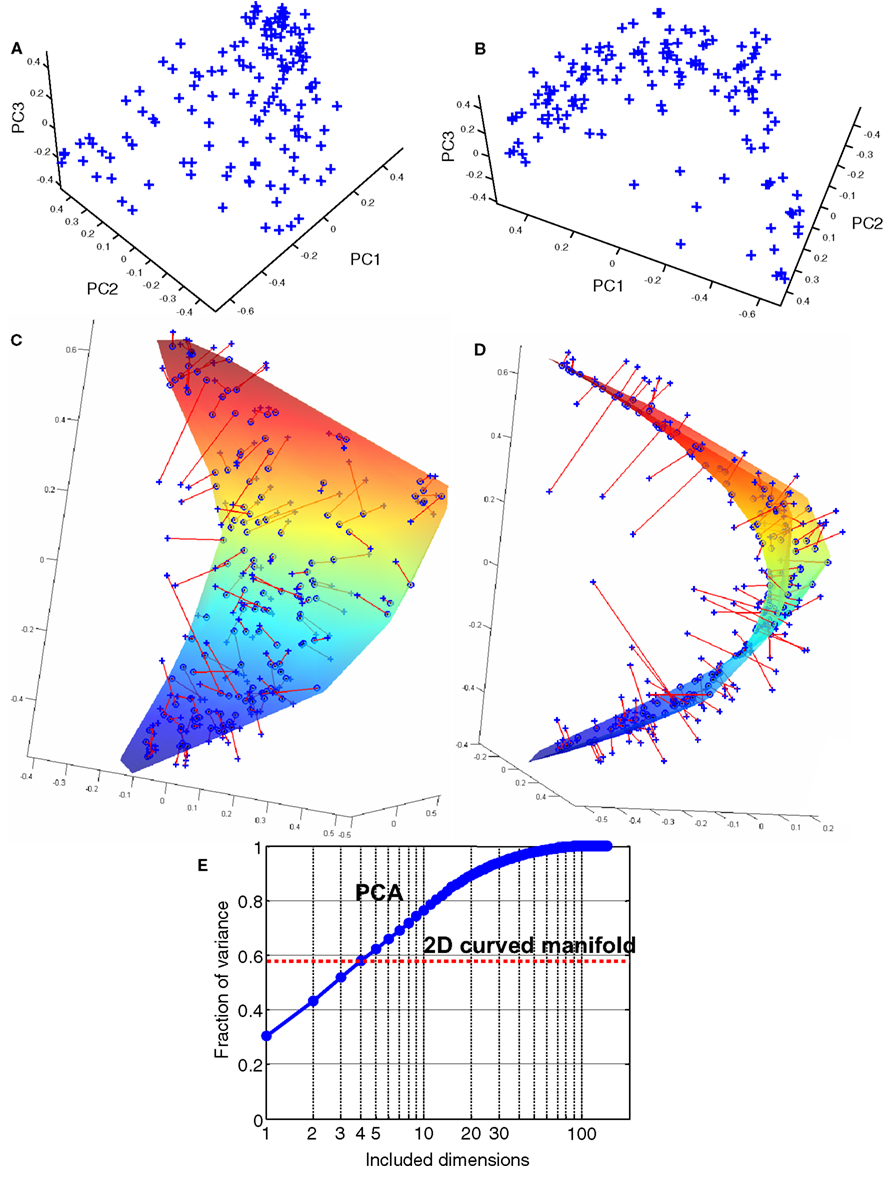
Figure 1. Odorants in the PCA space. (A) Each of the 144 odorants can be represented as a point in the 146D space of perceptual descriptors. The odorants are shown by blue crosses placed in the 3D space of principal components. (B) When viewed from a certain direction, the odorants clustered near a C-shaped 1D curve, suggesting that in 3D the odorants are distributed close to a 2D curved surface. (C,D) The 2D surface representing the best fit to the data. The odorants (blue crosses) are connected to the nearest points on the surface by the red lines representing the residual errors. The 2D surface minimizes the total squared length of the residuals computed in 146D. The total squared length of residuals can be viewed as the remaining variance in the data not accounted for by the projection onto the 2D curved manifold. (E) The fraction of included variance as a function of the number of PCA dimensions. The fraction of variance accounted by the 2D curved manifold in (C) and (D) is 56% (red dotted line).
Odorants projected to 3D PC space when viewed from a certain direction clustered near a C-shaped curve, suggesting that the data points reside close to a 2D surface (Figure 1B). We therefore fitted the set of points with the smooth curved surface shown in Figures 1C,D. The best fit was obtained in the full 146D space of responses by minimizing the distances from the data points to the nearest points on the surface. To capture the curvature of the surface, it was defined by a second-order polynomial function of two parameters: the first PC and a linear combination of the second and the third PCs. After fitting, the 2D curved surface (manifold) accounted for 94% of the data variance projected to the three PCs (Figures 1A,B) and 56% of the data variance contained in the entire data set containing 146 dimensions. The approximation of data by a 2D curved manifold accounted for more data variance (56%) than the space of first three PCs (52%). This is because the curved manifold was not limited to the 3D PCA space and extended into the entire 146D dataset.
How well does a 2D curved manifold in 146D space predict the responses of human observers? To answer this question we compared the original data and their projection onto a 2D curved surface (Figure 2). The projection was defined as the nearest point on the 2D surface to a given odorant, as illustrated in Figures 1C,D. The comparison of the two sets of points yielded a correlation coefficient of 87%. Because some correlation is introduced by the average responses to a given descriptor (horizontal bands in Figure 2), we also obtained the correlation coefficient when the averages along the rows are excluded from the matrices. This procedure resulted in a correlation coefficient of 75% between the original data and the 2D projection. We conclude that the 2D curved space yields an accurate approximation to the responses of human observers and therefore forms a reliable surrogate for human olfactory sensory space.
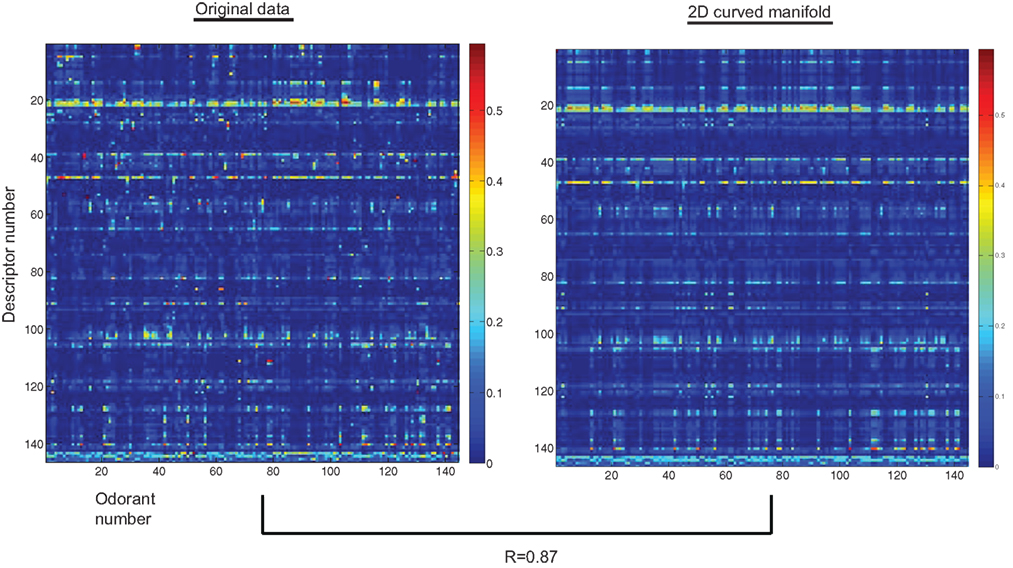
Figure 2. Comparison between original perceptual data and its their projection on to a 2D curved manifold. Images represent the coordinates (color coded) of 144 odorants in 146D space of descriptors for (A) the original data, (blue crosses in Figure 1 C,D) and (B) their projections onto a 2D curved manifold (circles in Figure 1 C,D).
We next determined what descriptors contribute to the two parameters on the surface. The first parameter (elevation) is associated with the first PC of the data. As has previously been suggested, this parameter could be correlated with the pleasantness or perceptual valence of odorants (Berglund et al., 1973; Jones et al., 1978; Khan et al., 2007). Consistent with this observation, we find that the perceptual descriptors that contribute to the first coordinate with large positive/negative coefficients are associated with repulsive/attractive odorant properties (see top and bottom of Figure 3 for the 10 descriptors with the largest positive/negative coefficients, respectively). The second coordinate on the 2D manifold (azimuth) was obtained as a linear combination of the second and the third PCs. The descriptors contributing with large coefficients to this coordinate are listed in Figure 3 too (left and right). A possible significance of the second coordinate is discussed below.
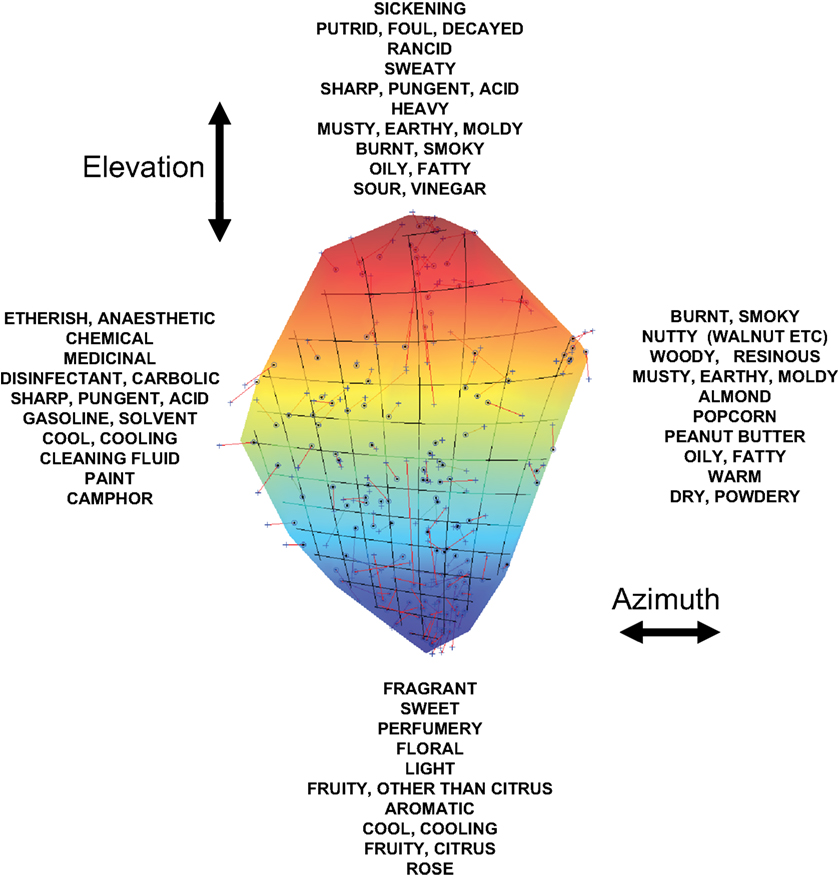
Figure 3. The descriptors that contribute with large positive/negative coefficients to the coordinates on the 2D surface. The two coordinates are defined as elevation and azimuth as indicated.
Higher Dimensional Curved Manifolds
Could a curved manifold of dimensionality higher than two characterize human olfactory space more fully? Because we use second-order polynomials in our approximation, the number of parameters of the regression is proportional to the square of the number of dimensions [see Eq. (1) in Materials and Methods]. To avoid overfitting, we used the jackknife procedure (Saito et al., 2009; see Materials and Methods for details). In this procedure, a single odorant is removed from the database, an approximation is calculated based on the remaining odorants in the database, and the result is compared with the odorant that is left out. Our results show that a space of sufficiently small dimensionality (≤ 10) can account for a substantial fraction of the variance in the experimental data (up to 81%, Figure 4A). Similarly to the analysis for 2D manifolds, we projected the experimental data onto smooth curved surfaces of varying dimensionality and estimated the correlation between experimental and projected coordinates with (and without) subtraction of average responses (Figure 4B). The correlation coefficient can reach 90% (94%) for 10D spaces. The jackknife analysis shows that low-dimensional curved spaces are predictive of responses to odorants, which were excluded from the evaluation of the parameters of the surface.
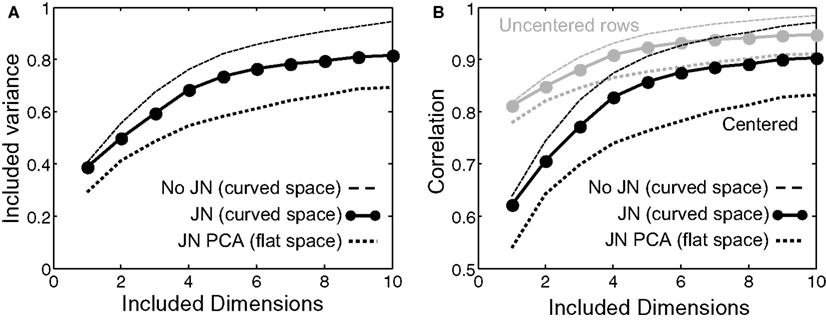
Figure 4. Approximation of perceptual responses with spaces of small dimensionality. To avoid overfitting we applied the jackknife (JN) technique. Results for the best curved/flat spaces are shown by solid/dotted lines as a function of the number of dimensions included. The flat space technique is equivalent to PCA and is shown for comparison. (A) Variance of the dataset accounted for by the low-dimensional representation. The 2D curved manifold accounted for 51% of experimental variance. (B) Pearson correlation as a function of surface dimensionality.
We found therefore that about 81% of the variance in the dataset is captured by the smooth curved manifolds. We also estimated the errors present in the data due to a finite number of human subjects contributing to the dataset to be about 7% (see Materials and Methods). We conclude that only about 12% of the variance in the experimental data cannot be captured by continuous curved manifolds of dimensionality ≤ 10. Most (51%) of the experimental variance is reproduced by the 2D curved surface considered above.
Monomolecular Curved Manifolds Approximate the Space of Mixtures
In addition to monomolecular odorants, the AOCP database contains perceptual data for 15 mixtures (listed in Supplementary Materials). Here we attempted to verify whether the same curved low-dimensional spaces that approximated the responses to the monomolecular odorants can describe the responses to mixtures. A positive answer to this question would suggest that low-dimensional approximation applies to a broader set of odorants than previously discussed. To test this hypothesis we first obtained the curved monomolecular spaces of various dimensionalities (one through 10) as described above. These spaces were calculated on the basis of responses to 144 monomolecular odorants only. We then obtained the responses to 15 mixtures from the AOCP database. Next we calculated the fraction of variance in the mixture data that can be explained by the monomolecular spaces of varying dimensionality by finding the nearest points on the monomolecular curved surfaces for all 15 mixtures. The results are presented in Figure 5.
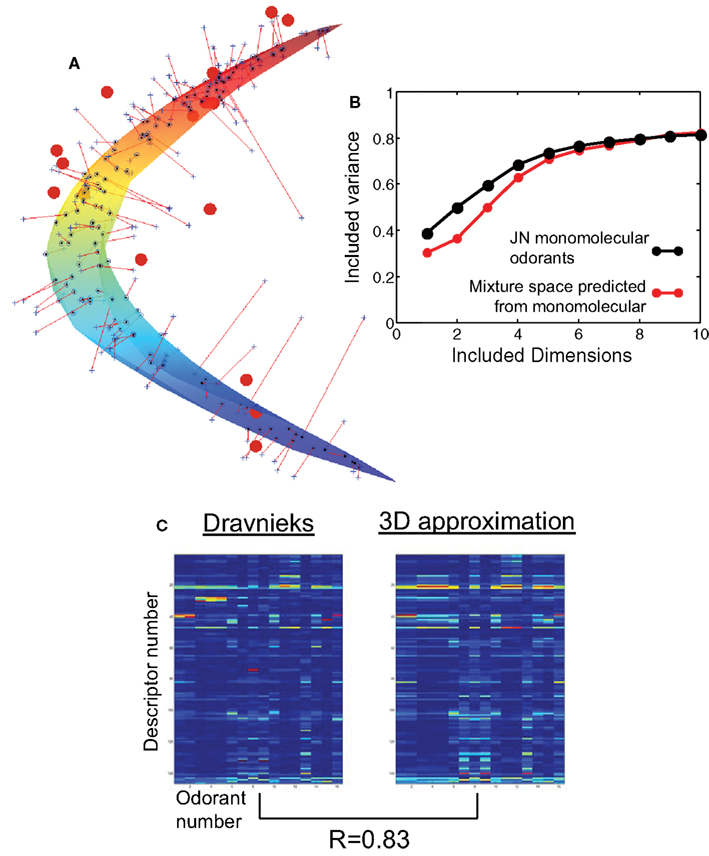
Figure 5. Perceptual space of mixtures. (A) The percepts of 15 mixtures (red circles) placed in the 3D PCA space of monomolecular odorants. The 2D curved manifold of monomolecular odorants is also shown (colored surface). (B) Remaining variance after projection onto the curved space as a function of dimensionality of this space. Black/red lines show results for monomolecular odorants and mixtures respectively. The curved space was the same in both cases and was obtained by optimizing the surface for monomolecular odorants only. JN stands for jackknife analysis. The 2D curved space explains 51% of the variance in the monomolecular dataset. 3D surface explains about 50% of the variance for mixtures. Therefore the 3D space obtained from monomolecular smells is as predictive of mixture data as 2D space for monomolecular data. (C) The original mixture data (left, 146 descriptors, vertical axis, by 15 mixtures, horizontal axis) and the results after projecting onto 3D monomolecular space. The point-by-point Pearson correlation is about 0.83 indicating that 3D monomolecular curved space contains major information about the responses to mixtures.
Three observations are evident from this figure. First, 3D monomolecular space can explain the same amount of variance for mixtures as 2D space for monomolecular odorants (about 50%, Figure 5B). Therefore 3D monomolecular space is about the same for mixtures as 2D space for monomolecular odorants. At the level of 50% variance, mixture space acquires an extra dimension compared to the space of monomolecular odorants. Second, to obtain the 3D space we only used information about responses to monomolecular odorants. This 3D space accurately approximates percepts of a novel class of smells, i.e., mixtures that did not take part in the calculation of the surface. Fluctuations of monomolecular odorant percepts around the 2D surface therefore contain information about the percepts of mixtures. Lastly, by about six included dimensions, the difference between monomolecular odorant space and the space of mixtures disappears almost completely. This observation implies that 6D curved space contains both the percepts of mixtures and monomolecular odorants. Overall, these results suggest that curved low-dimensional manifolds obtained for monomolecular odorants as described above are predictive of the responses to a novel class of odorants, i.e., mixtures.
Relationship of the Perceptual Dimensions with the Properties of Odorant Molecules
We then attempted to establish the relationship between the two perceptual dimensions (elevation and azimuth) and the physico-chemical properties of odorants. To this end it is necessary to refine the definition of perceptual coordinates on the surface. As seen in Figure 3, the odorants tend to accumulate near the poles of the 2D surface (large positive and negative values of elevation). To remove this singularity we found a non-linear (quadratic) transformation that makes the density of odorants approximately uniform throughout the surface (see Materials and Methods). The new coordinate grid is displayed in Figure 3 on the 2D manifold. The resulting two coordinates on the surface, elevation and azimuth, were then compared to various physico-chemical and structural properties of odorants. Seventy two physico-chemical properties were obtained from the computer package Molecular Modeling Pro (Burden, 1997). The structural descriptors included seven atom counts, 16 pair counts, and 31 triples counts obtained from structural formulas of odorants. The total physico-chemical/structural space included 126 properties for each molecule. We then applied a greedy algorithm developed by Saito et al. (2009)andHaddad et al. (2008b) to find which properties correlate best with the two perceptual dimensions. The greedy algorithm is an iterative procedure that increases the number of included properties one by one. On each step a new property is added if it results in a maximum increase of the Pearson correlation coefficient with a given perceptual dimension. The results of this analysis, physico-chemical properties that yield the best correlation with both azimuth and elevation, are presented in Table 1 as a function of the number of included physico-chemical properties (iteration steps).
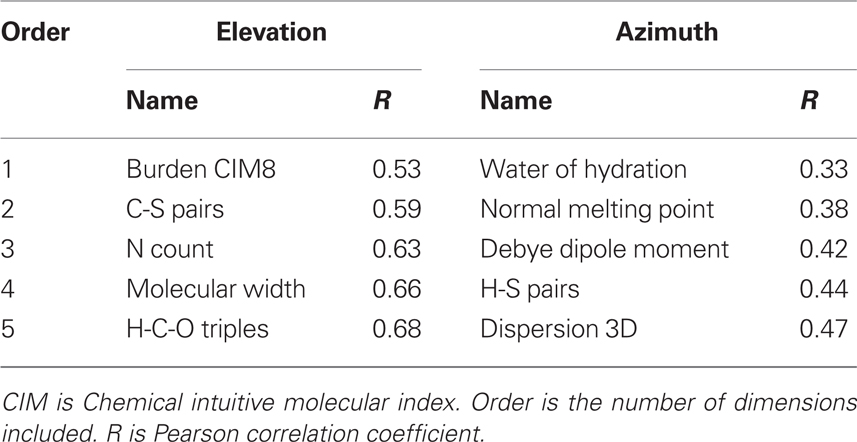
Table 1. Physico-chemical and structural properties of odorant molecules that contribute most strongly to the two perceptual dimensions.
The elevation coordinate on the surface is correlated with Burden chemical intuitive molecular indices (CIMs), which represent eigenvalues of the connectivity matrix (Burden, 1997). These eigenvalues represent simple surrogates for the solution of the quantum-mechanical Hamiltonian equation. We found that all CIMs (1 through 10) are generally well correlated with the elevation coordinate. We also found that simple number of carbon atoms per molecule yields almost the same correlation as CIMs (R = 0.50, see Figure S3 in Supplementary Material for more detail). For the azimuth coordinate we find that the correlated variables are descriptive of molecules’ polarity or hydrophobicity. Thus, four of the five best correlated properties in Table 1 for azimuth depend on molecules’ polarity, including the melting point temperature. We conclude that the azimuth on the 2D curved manifold is correlated with the hydrophobicity or polarity of odorant molecules.
Discussion
In this study we showed that a smooth curved surface of substantially small dimensionality can successfully approximate the responses of human observers to a variety of monomolecular odorants. A 2D curved surface can account for most of the variance in behavioral data. In agreement with previous studies (Berglund et al., 1973; Jones et al., 1978; Belkin et al., 1997; Khan et al., 2007), we suggest that one of the dimensions on the 2D surface is the pleasantness or perceptual valence of the odorants. This dimension is correlated with physico-chemical properties of the molecules, such as the count of the carbon atom count or eigenvalues of the connectivity matrix associated with the structural formula (CIMs; Burden, 1997). The second perceptual dimension is correlated with the measures of polarity or hydrophobicity, such as water of hydration, normal melting point temperature, etc (Table 1). Because mammalian Class I olfactory receptors (ORs) are related to fish ORs that are expected to bind water-soluble compounds (Zhang and Firestein, 2002), the second dimension may be detected by the difference in responses of the two classes of ORs: class I and II (Tsuboi et al., 2006; Bozza et al., 2009). The perceptual significance of this second coordinate (dimension) is less straightforward.
An intriguing possibility for the second perceptual coordinate is suggested by studies of cross-modal correlations between smells and sounds. For example, it was found that human subjects can adjust the loudness-equalized pitch of an auditory tone to match a stimulus odor (Belkin et al., 1997). Most importantly, the arrangement of odorants on the auditory frequency axis by the study’s subjects was shown to be independent of the pleasantness of odorants (Belkin et al., 1997). The latter observation suggests an interpretation of the second olfactory dimension (azimuth) as related to the auditory pitch of sounds synesthetically associated with the odorants. The motivation for this is that the azimuth dimension is perpendicular (decorrelated) to pleasantness (elevation) similarly to the decorrelation between auditory pitch and pleasantness shown in (Belkin et al., 1997). The perceptual link between auditory and olfactory stimuli is supported by the cross-modal modulation of neuronal responses recently observed in olfactory tubercle (Wesson and Wilson, 2010).
The low dimensionality of the olfactory space reported here does not eliminate the complexity of olfactory percepts. Indeed, if one adopts a 2D approximation to olfactory space, odorant percept depends only on two parameters. But the surface buckles into all 146 dimensions due to its curvature. Our findings indicate that the use of six to 10 parameters (six to 10D curved manifolds) can essentially exhaust the variability contained in the 146-dimensional perceptual database (Figure 4). Thus, although a correlation is present in the data that allows us to reduce the dimensionality of the dataset, olfactory percepts remain complex and varying in all 146 dimensions, due to the curved geometry of the underlying perceptual space.
We report here that the human perceptual space of monomolecular odorants can be viewed as continuous, curved, and low-dimensional. Most of the variance in the perceptual data is captured by a 2D curved surface. The two dimensions of the surface can be related to physico-chemical properties of odorant molecules such as an eigenvalue of the odorant molecule connectivity matrix and the polarity of the molecules respectively.
Conflict of Interest Statement
The authors declare that the research was conducted in the absence of any commercial or financial relationships that could be construed as a potential conflict of interest.
Acknowledgments
This work was supported by the Swartz Foundation, Margaret and Herman Sokol Postdoctoral Fellowship, and National Institute of Health (R01EY018068).
Supplementary Material
The Supplementary Material for this article can be found online at http://www.frontiersin.org/Systems_Neuroscience/10.3389/fnsys.2011.00065/abstract
References
Belkin, K., Martin, R., Kemp, S. E., and Gilbert, A. N. (1997). Auditory pitch as a perceptual analogue to odor quality. Psychol. Sci. 8, 340–342.
Berg, M. D. (2008). Computational Geometry: Algorithms and Applications. 3rd Edn, Berlin: Springer xii, 386.
Berglund, B., Berglund, U., Engen, T., and Ekman, G. (1973). Multidimensional analysis of twenty-one odors. Scand. J. Psychol. 14, 131–137.
Bozza, T., Vassalli, A., Fuss, S., Zhang, J. J., Weiland, B., Pacifico, R., Feinstein, P., and Mombaerts, P. (2009). Mapping of class I and class II odorant receptors to glomerular domains by two distinct types of olfactory sensory neurons in the mouse. Neuron 61, 220–233.
Burden, F. R. (1997). A chemically intuitive molecular index based on the eigenvalues of a modified adjacency matrix. Quan. Struct. Act. Relat. 16, 309–314.
Dravnieks, A. (1985). Atlas of Odor Character Profiles. ASTM data series, ed. ASTM Committee E-18 on Sensory Evaluation of Materials and Products. Section E-18.04.12 on Odor Profiling. Philadelphia, PA: ASTM, 354.
Gottfried, J. A. (2010). Central mechanisms of odour object perception. Nat. Rev. Neurosci. 11, 628–641.
Haddad, R., Khan, R., Takahashi, Y. K., Mori, K., Harel, D., and Sobel, N. (2008a). A metric for odorant comparison. Nat. Methods 5, 425–429.
Haddad, R., Carmel, L., Sobel, N., and Harel, D. (2008b). Predicting the receptive range of olfactory receptors. PLoS Comput. Biol. 4, e18. doi: 10.1371/journal.pcbi.0040018
Jones, F.N., Roberts, K., and Holman, E. W. (1978). Similarity judgments and recognition memory for some common spices. Percept. Psychophys. 24, 2–6.
Khan, R. M., Luk, C. H., Flinker, A., Aggarwal, A., Lapid, H., Haddad, R., and Sobel, N. (2007). Predicting odor pleasantness from odorant structure: pleasantness as a reflection of the physical world. J. Neurosci. 27, 10015–10023.
Mamlouk, A. M., and Martinetz, T. (2004). On the dimensions of the olfactory perception space. Neurocomputing 58–60, 1019–1025.
Saito, H., Chi, Q., Zhuang, H., Matsunami, H., and Mainland, J. D. (2009). Odor coding by a mammalian receptor repertoire. Sci. Signal. 2, ra9.
Tsuboi, A., Miyazaki, T., Imai, T., and Sakano, H. (2006). Olfactory sensory neurons expressing class I odorant receptors converge their axons on an antero-dorsal domain of the olfactory bulb in the mouse. Eur. J. Neurosci. 23, 1436–1444.
Wesson, D. W., and Wilson, D. A. (2010). Smelling sounds: olfactory-auditory sensory convergence in the olfactory tubercle. J. Neurosci. 30, 3013–3021.
Wise, P. M., Olsson, M. J., and Cain, W. S. (2000). Quantification of odor quality. Chem. Senses 25, 429–443.
Zarzo, M., and Stanton, D. T. (2009). Understanding the underlying dimensions in perfumers’ odor perception space as a basis for developing meaningful odor maps. Atten. Percept. Psychophys. 71, 225–247.
Keywords: olfaction, profiling, sensory space, perception
Citation: Koulakov AA, Kolterman BE, Enikolopov AG and Rinberg D (2011) In search of the structure of human olfactory space. Front. Syst. Neurosci. 5:65. doi: 10.3389/fnsys.2011.00065
Received: 16 December 2010;
Paper pending published: 02 June 2011;
Accepted: 22 July 2011;
Published online: 15 September 2011.
Edited by:
Steven S. Hsiao, Johns Hopkins University, USAReviewed by:
Stefano Panzeri, Italian Institute of Technology, ItalyMaxim Bazhenov, University of California, USA
Copyright: © 2011 Koulakov, Kolterman, Enikolopov and Rinberg. This is an open-access article subject to a non-exclusive license between the authors and Frontiers Media SA, which permits use, distribution and reproduction in other forums, provided the original authors and source are credited and other Frontiers conditions are complied with.
*Correspondence: Alexei A. Koulakov, Cold Spring Harbor Laboratory, 1 Bungtown Road, Cold Spring Harbor, NY 11724, USA. e-mail: akula@cshl.edu