Topological isomorphisms of human brain and financial market networks
- 1 Behavioural and Clinical Neuroscience Institute, University of Cambridge, Cambridge, UK
- 2 Centre for Fusion, Space and Astrophysics, Department of Physics, University of Warwick, Coventry, UK
- 3 British Antarctic Survey, Cambridge, UK
- 4 University of East Anglia London, London, UK
- 5 St Catherine’s College, University of Oxford, Oxford, UK
- 6 GlaxoSmithKline Clinical Unit Cambridge, Addenbrooke’s Hospital, Cambridge, UK
Although metaphorical and conceptual connections between the human brain and the financial markets have often been drawn, rigorous physical or mathematical underpinnings of this analogy remain largely unexplored. Here, we apply a statistical and graph theoretic approach to the study of two datasets – the time series of 90 stocks from the New York stock exchange over a 3-year period, and the fMRI-derived time series acquired from 90 brain regions over the course of a 10-min-long functional MRI scan of resting brain function in healthy volunteers. Despite the many obvious substantive differences between these two datasets, graphical analysis demonstrated striking commonalities in terms of global network topological properties. Both the human brain and the market networks were non-random, small-world, modular, hierarchical systems with fat-tailed degree distributions indicating the presence of highly connected hubs. These properties could not be trivially explained by the univariate time series statistics of stock price returns. This degree of topological isomorphism suggests that brains and markets can be regarded broadly as members of the same family of networks. The two systems, however, were not topologically identical. The financial market was more efficient and more modular – more highly optimized for information processing – than the brain networks; but also less robust to systemic disintegration as a result of hub deletion. We conclude that the conceptual connections between brains and markets are not merely metaphorical; rather these two information processing systems can be rigorously compared in the same mathematical language and turn out often to share important topological properties in common to some degree. There will be interesting scientific arbitrage opportunities in further work at the graph-theoretically mediated interface between systems neuroscience and the statistical physics of financial markets.
Introduction
Over the last two decades, graphical modeling of networks has been used successfully to describe a plethora of complex systems – from metabolic pathways (Jeong et al., 2000) to the world wide web (Barabási and Albert, 1999). A shared conceptual and mathematical framework has emerged for describing these diverse networks, each considered as a set of nodes and edges, in a quantitative lingua franca, often focusing on their topological properties. This approach has led to the discovery that many complex systems, including human brain networks, demonstrate a number of important organizational features in common. For example, the so-called “small-world” property of high clustering and high efficiency (or short path length) has proved to be almost ubiquitous in real-life complex systems (Watts and Strogatz, 1998).
Despite these deeply interdisciplinary insights, graph theory has also often been used as a tool independently by different disciplines, with relatively few efforts to translate new discoveries or methodological advances between traditionally disparate fields that nevertheless share an interest in topological analysis of complex networks. In this paper, we will apply graph theoretic methods to explore the topological parallels or isomorphisms in network organization between two somewhat different systems: the human brain and a financial market. Our focus on these two systems in particular is motivated by several parallels immediately apparent between the two systems, that are perhaps made most obvious by the anthropomorphic language commonly used in the financial press, describing markets in terms of their “moods,” “beliefs,” and “decisions.”
A more abstract framing of the analogy is to define both brain and market systems as large networks of interacting elements which propagate and share information while undergoing complex dynamics. Prior studies focusing on the nature of these dynamics have shown that both financial and neurophysiological time series exhibit long-range temporal correlations, which manifest themselves as 1/f spectral power on long timescales (Baillic, 1996; Maxim et al., 2005). In addition, the multivariate long memory properties displayed by both types of data were shown to lead to scale-invariant correlation structure over a broad range of frequency scales (Achard et al., 2008). In this study, we seek to push such rigorous expressions of the brain/market analogy further by using graph theory to describe and compare the topological organization of both brain and market networks.
Firstly, we begin by studying the minimum spanning tree (MST) of the systems, an approach which has already proved valuable in the study of financial markets (Mantegna, 1999; Onnela et al., 2002; Bonanno et al., 2003; Coelho et al., 2007; Jung et al., 2008) but has not yet been widely applied to brain functional networks. Secondly, we report the evolution of a set of network measures – including modularity, clustering, small-worldness, and cost-efficiency – as the topological cost, or connection density of edges, is smoothly varied. Here, our starting point remains the MST of each system and we then gradually add links in order of decreasing correlation strength to generate networks with arbitrary connection density. Finally, we identify the connection density at which the networks have maximum cost-efficiency and, at that topological cost specifically, we examine a further set of more detailed topological characteristics, such as the degree distribution, hierarchy, and robustness, of both brain and market networks.
Materials and Methods
fMRI Data Acquisition and Preprocessing
The functional MRI data were acquired from 18 healthy volunteers recruited from the GlaxoSmithKline (GSK) Clinical Unit Cambridge, in Addenbrooke’s Hospital, Cambridge, UK. The volunteers provided written informed consent, had a satisfactory medical examination prior to study enrollment and were screened for normal radiological appearance of structural MRI scans. The study was reviewed and approved by the Cambridge Local Research Ethics Committee (REC06/Q0108/130; PI: TW Robbins).
The images were acquired using a Siemens Magnetom Tim Trio whole body scanner operating at 3T, at the Wolfson Brain Imaging Centre, University of Cambridge, UK. Gradient-echo, EPI data depicting BOLD contrast were acquired for the whole brain while the subject was lying quietly in the scanner for about 9 min 50 s with eyes closed. The following parameters were used: repetition time = 2000 ms; echo time = 30 ms; flip angle = 78°; slice thickness = 3 mm plus 0.75 mm interslice gap; 32 slices parallel to the inter-commissural (AC–PC) line; image matrix size = 64 × 64; within-plane voxel dimensions = 3.0 mm × 3.0 mm. The first four EPI images were discarded to account for T1 equilibration effects, resulting in a series of 296 images, the first 256 of which were used to estimate wavelet correlations. The data were motion-corrected and registered to the standard stereotactic space of the Montreal Neurological Institute EPI template image using an affine transform (Suckling et al., 2006).
Regional time series were estimated by averaging voxel time series within each of the 90 anatomically defined regions (excluding the cerebellum) comprising the automated anatomical labeling (AAL) template image (the regions are defined and listed in Tzourio-Mazoyer et al., 2002). The maximal overlap discrete wavelet transform (Percival and Walden, 2000) was used to band-pass filter the time series to a frequency interval of 0.03–0.06 Hz. This frequency scale was chosen to allow measurement of network properties at the low frequencies (<0.1 Hz) which have been the focus of most prior resting-state fMRI studies, while retaining sufficient wavelet coefficients for reasonably precise estimation of time series statistics and correlations (Meunier et al., 2009).
Financial Data Sources, Preprocessing, and Modeling
Daily closing prices for 116 stocks from the New York stock exchange (NYSE) were obtained from the website http://jponnela.com/. The time period of this dataset extends from the beginning of 1982 to the end of 2000 but, as in previous studies (Onnela et al., 2002; Heimo, 2009), only the last 1000 daily price quotes per stock were used, ensuring that we excluded time-periods with unusual market activity such as “Black Monday” in October 1987. For each stock, we used the logarithmic daily returns as our time series. For easy comparison to the brain functional network, we sampled 90 stocks at random so that both networks would contain N = 90 nodes. We verified that all results presented here held equally for the full set of 116 stocks as well as for several instances of random sampling. In order to construct a simple statistical model of the financial network, we generated 90 time series simulating the evolution of 90 stock prices, Yi(t), according to the Black–Scholes model. This common stochastic model of stock price dynamics assumes that the price follows a geometric Brownian motion with constant drift and volatility:

where Yi(t) is the price of the ith stock at time t, Y0 = 30, μ = 0.0006 is the drift rate, σ = 0.024 is the volatility of the stock’s returns, and B(t) follows Brownian motion. The values of these parameters were chosen based on their means in the 90 NYSE stocks in the real financial dataset.
Note that while volatility is known to depend on time in empirical financial data (Engle, 1982; Mantegna and Stanley, 2000), the Black–Scholes model provides a good first approximation to the observed behavior of stocks (Mantegna and Stanley, 2000). Indeed, we confirmed that the distribution of increments in lnYi(t) in our NYSE dataset is well-matched by a Gaussian, as expected from this model. In addition, we verified that the autocorrelational or memory properties of the data were also well-matched by the Black–Scholes model as we observed a Hurst exponent of H = 0.48 ± 0.04 in the NYSE data, which corresponds closely with H = 0.5 as theoretically expected for classical Brownian motion (the cumulative function of i.i.d Gaussian increments).
Congressional Roll-Call Data
In addition to fMRI and financial data, we constructed a social or political network (Portera et al., 2007; Mucha et al., 2010) based on correlations in voting patterns between US senators. Roll-call data from the United States Senate of the 100th Congress were downloaded from the website http://www.voteview.com/dwnl.htm. These time series describe for each senator whether they voted for or against each bill over the duration of the 100th Congress (1987–1988). The correlation between pairs of senators was calculated by taking the mean value of their “voting agreement” over all bills. Voting agreement between two senators was defined as 1 for the bills where they voted the same, and 0 for the bills where they did not. We excluded senators who missed more than 30% of votes as well as bills where voting was unanimous. Correlation between senators who never voted on the same bill was set to zero. Once again, we sampled 90 out of a total of 100 senators at random for easy comparison to the brain functional network.
The choice of this dataset as an example of other real-world systems was motivated by the fact that the construction of such political networks is directly analogous to that of financial and brain functional networks. In particular, all three networks are based on a “similarity matrix” of the correlations between the activity of each node (see next section). This is in contrast to many other real-world networks where connection strength is measured more directly such as, for example, the volume of traffic on different roads in a traffic network.
Network Construction
In the brain functional networks, each node corresponds to a different brain region, i, and edges or connections between nodes represent statistical associations, e.g., correlations, between the time series, Si(t), recorded by functional MRI at each of these regions. Similarly, the nodes of the political network are senators, and links represent pairwise correlations in their voting patterns. Finally, network representations are commonly used to understand the correlation structure of markets, which plays a crucial role in portfolio optimization (Onnela, 2006). The time series of interest is usually the logarithmic daily return on a set of stocks defined as Si(t) = ln[Yi(t + Δt)] − ln[Yi(t)], where Yi(t) is the price of the ith stock on day t.
The degree of similarity between the time evolution of a pair of stocks or a pair of brain regions can then be measured by the correlation coefficient:
Once the N × N association matrix of correlation coefficients has been evaluated (for N stocks, senators, or brain regions), it is possible to draw a network of the system where the weight of each link corresponds to the correlation strength ρi,j between each i,j pair of nodes. This fully connected, weighted network, however, is not easy to analyze and contains many spurious connections resulting from noise rather than genuine correlations. It is therefore usually replaced by a sparser, unweighted network where, following the application of some filtering technique, only the most important connections have been retained as edges in a binary adjacency matrix 𝒜 (Bullmore and Sporns, 2009). A simple filtering technique is to apply a continuously variable threshold, τ, to the association matrix so that 𝒜i,j = 1 if ρi,j > τ, and 𝒜i,j = 0 otherwise. Related filtering techniques will be discussed in the following sections. As τ is a continuous variable, it is possible to use this and related filtering techniques to construct binary graphs of arbitrary connection density or topological cost, 0 < κ < 1, where κ is the number of edges in the graph (each represented by two symmetric non-zero elements in the adjacency matrix) divided by the maximum possible number of edges; N × (N − 1)/2.
Graph Theoretical Analysis
Binary graphs thus constructed by filtering a continuous association matrix can be topologically analyzed using the following set of well-known graph theoretical network metrics:
The degree ki of a node i represents the number of edges connecting it to the rest of the network. Assortativity is a measure of degree correlation, indicating the propensity of high-degree nodes to connect preferentially to each other (Newman, 2002). The degrees of all the nodes of a network form the degree distribution.
The clustering coefficient Ci of a node i is defined as the ratio of the number of triangular connections between the node’s nearest neighbors to the maximal possible number of such triangular motifs. The overall clustering coefficient C(G) of a graph G is defined as the average clustering coefficient of its N nodes:
The path length Lij between a pair of nodes i and j is defined as the minimum number of edges that need to be traversed to get from i to j. More commonly, one measures the average inverse path length, or global efficiency, 0 < E(G) < 1, of a graph G which is defined as:
The cost-efficiency CE(G) is then defined as the global efficiency of a network minus its (arbitrary) topological cost or connection density, i.e., CE(G) = (E(G) − κ).
Small-worldness, σ, is a property of a network with high clustering, C, but low characteristic path length, L, compared to the clustering, CR, and path length, LR, of a comparable random graph with the same number of nodes and edges and the same degree distribution (Watts and Strogatz, 1998). It is calculated as:
Many complex networks have a modular structure, whereby they contain subsets of highly interconnected nodes called modules or communities. The modularity, Q(G), of a graph G quantifies the quality of a possible partition of the network into modules by measuring the fraction of the network’s edges that fall inside modules compared to the expected value of this fraction if edges were distributed at random (Newman, 2004). This can be written as:
where m is the total number of edges; 𝒜ij is one if an edge exists between i and j and 0 otherwise; δ(Mi,Mj) is 1 if i and j are in the same module and 0 otherwise; and Pij is the probability that there would be an edge between i and j in a random graph with the same degree distribution as G. The maximum value of the modularity found for any partition of a given graph G yields a measure of the degree of modularity of the network, as compared to random networks.
Robustness indicates the network’s resilience to attack, such as the progressive removal or deletion of nodes from the network. In a targeted attack, nodes are removed in order of decreasing degree so that hubs are attacked first, while in a random attack, nodes are removed in random order. Robustness has previously been studied in brain networks (Achard et al., 2006; Kaiser et al., 2007) and can be visualized by plotting the size of the largest connected component as a function of the number of nodes removed (Achard et al., 2006). The robustness parameter, R, is defined as the area under this curve. Highly resilient networks will retain a larger connected component after random or targeted attack than less robust or resilient networks.
Results
Minimum Spanning Trees
Asset trees, introduced in 1999 (Mantegna, 1999), are the first example of financial networks found in the literature. They rely on a drastic form of filtering which involves finding the MST of the distances between pairs of stocks. The MST is a simply connected acyclic graph that connects all N nodes with N − 1 edges such that the sum of the weights of included edges Σdij is minimum. The weights or “distances”  are inversely related to the correlations between nodes so that the MST includes the edges that maximize the total correlation strength.
Minimum spanning trees have since been routinely used to analyze the nature of correlations between stocks in various markets (USA Onnela et al., 2002; Bonanno et al., 2003, UK Coelho et al., 2007, and Japan Jung et al., 2008). One of the key observations resulting from these studies is that stocks generally tend to group on different branches of the market tree according to industrial sector, e.g., all healthcare or technology companies will tend to be located on the same branch of the MST. This is recognized as one representation of the modular structure of the markets. Here, we show that the MST of a brain network also concentrates brain regions belonging to the same functional modules, as previously defined by modularity analyses of fMRI data (Meunier et al., 2009), on the same branches of the tree; see Figure 1.
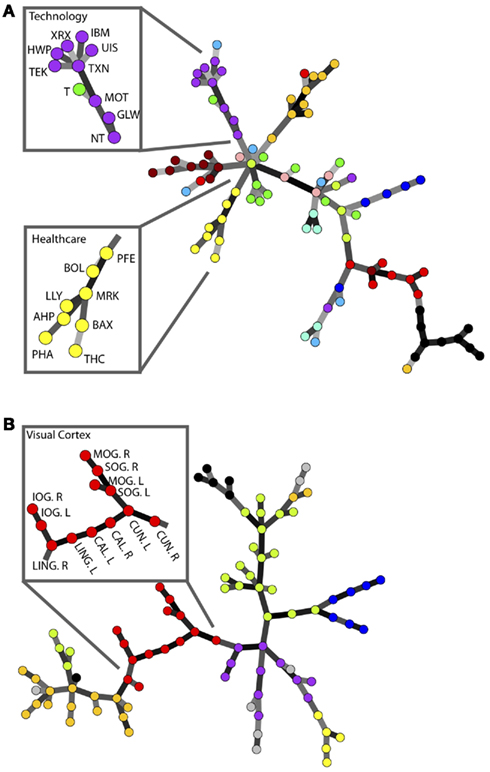
Figure 1. A comparison of the modular structure of financial and brain functional networks. (A) MST for the daily closing prices of N = 90 NYSE-traded stocks from the time period from January 13, 1997 to January 29, 2000. Different colors denote various business sectors as defined in Forbes. Insets show the stock symbols of each node on the branches corresponding to the healthcare and technology sectors (Heimo, 2009). (B) MST for an fMRI-derived brain network with N = 90 regions. Modules identified in Meunier et al. (2009) are represented in different colors. Inset shows the name of each brain region on the branch corresponding to the visual cortex.
The main advantage of MSTs over more complex network analyses is that the trees are guaranteed to have a fixed number of nodes and edges, without any disconnected islands – features which can be essential when comparing brain networks across different subjects or states (Alexander-Bloch et al., 2010). Despite this clear advantage and the widespread use of MSTs in the analysis of financial data, these techniques have not yet been widely adopted in the study of brain networks. The main reason for this is that the construction of MSTs involves an extreme form of filtering, leading to much higher loss of information than traditional thresholding methods such as the one used in the following section.
Graph Growth
One simple and widespread filtering technique is to retain a proportion κ of all edges, chosen in order of decreasing correlation strength. It is interesting to follow the evolution of a graph as it is constructed by incrementally adjusting the cost κ. The growth of financial networks under these conditions has previously been described in terms of the following three observations (Onnela et al., 2004):
1. Several loops, cyclic connections, or triangular motifs appear early on, when only a small fraction of all possible edges has been added.
2. As the graph is grown, new edges seem to be preferentially added to the small clusters already present, instead of forming a backbone that connects as many of the nodes as possible.
3. The network remains disconnected even after the addition of a very large number of edges.
As shown in Figure 2 these observations concerning the growth of financial networks also hold true for the fMRI-based brain network, although the tendency for new edges to remain confined to existing clusters is slightly diminished compared to financial networks. As we will see later, this greater tendency to form connections between clusters will be reflected in the brain network being more robust to targeted attacks than the market network at equivalent cost.
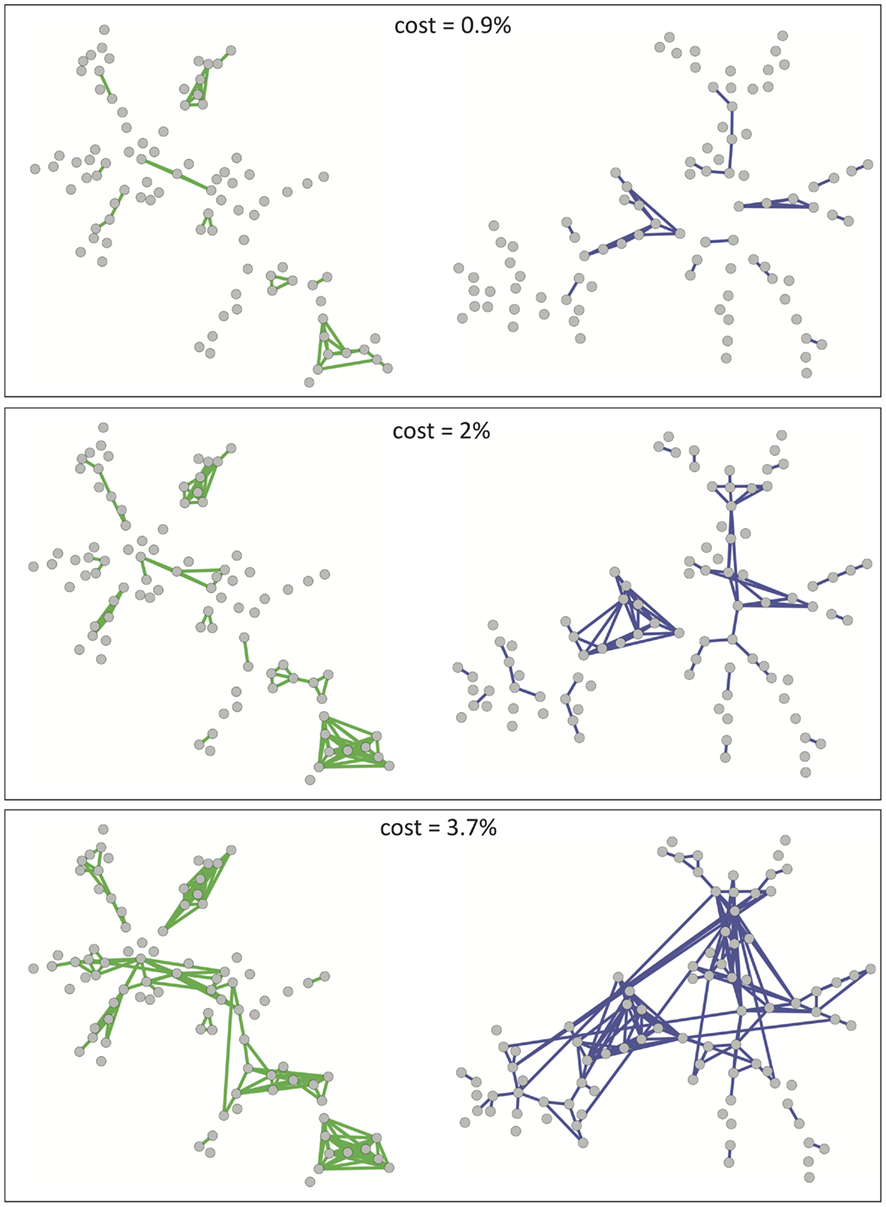
Figure 2. A visualization of the growth of financial and brain graphs as cost is increased. Financial networks are shown in green (left-hand column) and brain functional networks in blue (right-hand column). Top, middle, and bottom rows of plots correspond to cost κ = 0.9, 2, 3.7%).
In spite of this point, we observe that brain functional networks as well as financial markets begin by forming small, localized clusters of connections. Comparing Figures 1 and 2, we note that the clusters that first appear (in Figure 2) correspond to different branches of the MST (in Figure 1), so that the strongest connections arise inside rather than in between modules. With connections between modules being weaker, the networks remain disconnected over a large range of costs for both systems with this filtering technique. In contrast, MSTs ensure the connectedness of the whole network, enabling comparisons between networks originating from fMRI data for different subjects or market data at different points in time for example. While MSTs, by construction, discard a large amount of information available in the full correlation matrix, our results suggest that they can be used as a starting point before adding further edges in order of decreasing correlation strength to grow more complex networks of varying cost κ.
Tracking Network Topology as a Function of Connection Density
In order to better characterize the networks, it is useful to plot some of their key topological properties as a function of connection density or topological cost κ for each system. As suggested in the previous section, we start from the MST, which serves as a sparse backbone ensuring full connectedness of the networks at low cost, and we gradually add edges in order of decreasing correlation strength. Figure 3 shows the striking similarity between the curves thus obtained for financial and brain networks. Both brain and market networks demonstrate high clustering and high global efficiency (and therefore small-worldness). They both also have high modularity and positive cost-efficiency over a range of costs, with maximum cost-efficiency at a connection density of about 20%.
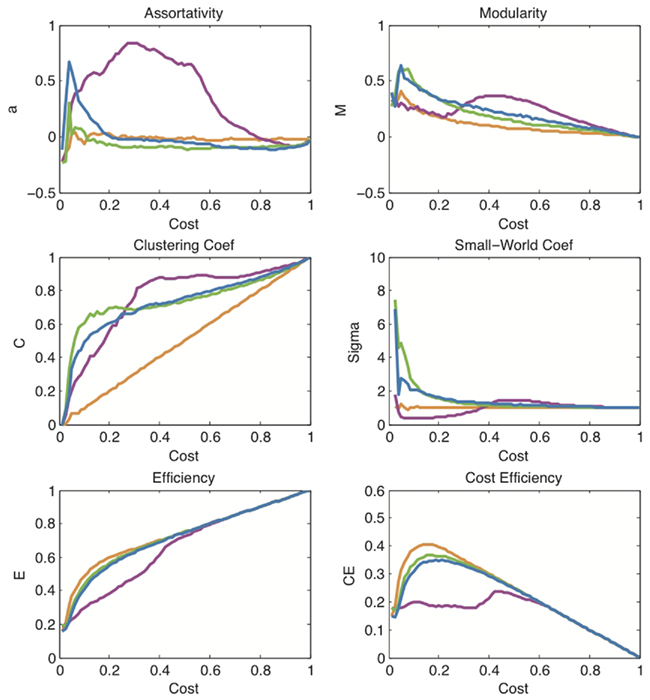
Figure 3. A comparison of topological measures as a function of connection density. These plots show the evolution of various network measures with increasing cost in the financial network (green), the brain functional network (blue), the political network (magenta), and the model network based on Black–Scholes (orange). Note that the orange curves also overlap exactly with the curves for random networks which are therefore not shown here. The measures displayed are: assortativity a, modularity M, clustering coefficient C, small-world coefficient σ, efficiency E, and cost-efficiency CE.
In addition, we show similar curves for two other comparable systems: the social network of voting patterns in the U.S. Senate based on roll-call data from the 100th Congress; and the simulated financial network generated by thresholding correlations between pairs of 90 log return time series based on price series generated by the Black–Scholes model.
The social network generated from senatorial voting patterns (magenta curves in Figure 3) illustrates that not all real-world complex networks conform to the pattern of network characteristics shared by financial and brain data. Indeed, the political network is significantly less efficient and less small-world over a large range of costs for sparse networks. In addition, it reaches its maximally clustered and modular state at much higher connection densities than the brain and financial networks.
The Black–Scholes network, on the other hand, highlights the fact that the correlation structure observed in a market system dynamically valuing and re-valuing many stock prices cannot be trivially reproduced by models designed to capture the univariate properties of the individual stock price time series. The 90 simulated time series generated by the Black–Scholes model are a close match to the real data for 90 NYSE stocks (see Figure A1 in Appendix). As the model contains a drift term affecting each time series, accidental, or spurious correlations do occur between different model stock prices. In fact, one can use a set of different drift values for different groups of model stocks to crudely simulate the strong intra-sector correlations observed. However, this correlation structure does not match the characteristic pattern displayed by real financial data. In particular, the Black–Scholes model networks lack small-worldness and are significantly less cost-efficient – all indications that the correlation structure simply reflects an overall drift or “inflation” term, rather than a complex organization as found in real data. The effect of uniform inflation is routinely filtered out from empirical financial data before networks are constructed by calculating log-returns of the price data. As expected, the application of log-returns destroys all correlation structure in the Black–Scholes model, yielding curves (orange lines in Figure 3) which overlap exactly with the curves expected for a random network with no structure. For this reason we do not show a separate set of benchmark curves for random networks in Figure 3. In contrast, the application of log-returns does not affect the results for either real market systems or brain functional networks derived from fMRI time series. Although there is no widely accepted model for brain functional data, fractional Gaussian noise (fGn) with a Hurst exponent H > 0.5 has been suggested as a potential, parsimonious model for the fMRI signal (Maxim et al., 2005). For this reason, we have confirmed that fGn processes with arbitrary Hurst exponents also lack the correlation structure characteristic of real-world data. The network measures for these fGn-based systems are not represented in Figure 3 as they coincide with the curves of random networks and those of the Black–Scholes model after log-returns (orange lines in Figure 3). In other words, like markets, the network structure of the fMRI data is not attributable to spurious correlations arising between time series with realistic univariate memory properties such as fGn with H > 0.5.
Network Topology at a Particular Connection Density
Although it is informative to consider network topology over the full range of possible connection densities, from the minimum (N − 1) edges of the MST to the maximum N × (N − 1)/2 edges of a fully connected network, it is also interesting to look at more detailed topological features of the networks, and for this purpose it is desirable to focus on a particular threshold. We can simply choose a threshold of interest – for example, in Figure 4, we have chosen to plot the congressional, Black–Scholes, financial and brain networks all thresholded at the same particular cost (3.7% of the fully connected network) allowing a quick visual comparison. While this low cost enables the visualization of the networks, it was chosen arbitrarily.
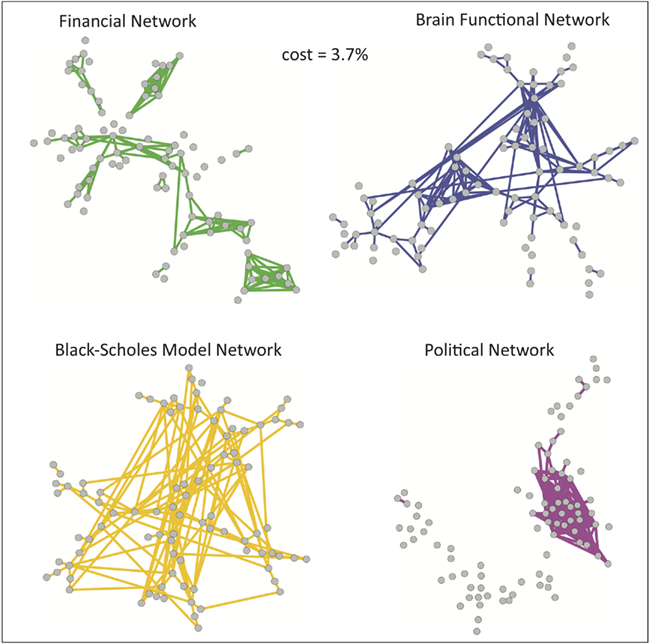
Figure 4. A visualization of sparse networks at a particular connection density. These plots show the network topology of each system (at cost = 0.037). The similarity previously highlighted between the financial network (green) and the brain functional network (blue) is not shared by the political network based on roll-call data (magenta) and the model network based on Black–Scholes (orange).
A more data-based way of defining a particular cost for detailed network analysis is to use the cost that maximizes the cost-efficiency function of each network. As shown in Figure 3, the cost-efficiency curve of each system peaks at a particular cost, typically around κ = 20%, allowing the data-driven choice of a characteristic cost at which to study topological properties of the networks in more detail. We measured the degree distribution, hierarchy, and robustness of each network at or close to its maximum cost-efficiency. To allow a fair comparison between the different networks, in Figure 5 we used the same cost for all systems. We chose this cost to be the one at which cost-efficiency is maximized in the brain functional network (κ = 21.2%), after confirming that these results were not affected by choosing instead the cost that maximizes cost-efficiency in financial networks (κ = 16.2%).
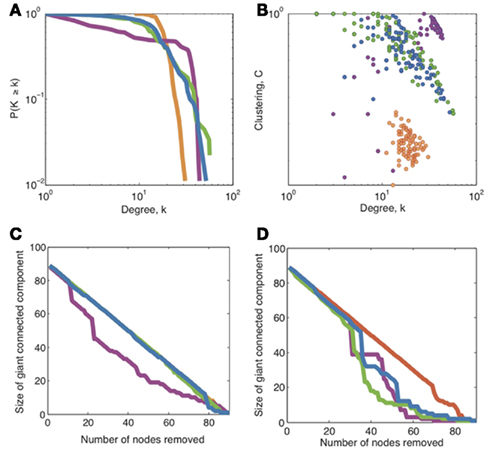
Figure 5. A comparison of topological properties of networks at the particular connection density approximately maximizing cost-efficiency (20%). These plots show a comparison of (A) the degree distribution, (B) hierarchy, and (C,D) robustness to random and targeted attacks respectively, for the financial network (green), brain functional network (blue), political network (magenta), and the Black–Scholes model network (orange). Note that for random attacks (C), the curves for financial networks, Black–Scholes models, and brain networks overlap almost exactly. The cost of each network is set to 0.21, which corresponds to the cost which maximizes cost-efficiency in the brain functional network.
Figure 5 shows that both financial and brain functional networks have a fat-tailed degree distribution. In both cases, the form of the degree distribution is not a simple power-law (these are not “purely” scale-free degree distributions), but is better approximated by an exponentially truncated power-law [AIC values (Burnham and Anderson, 2002) for fits to exponential, power-law, and exponentially truncated power-law forms of the degree distribution are shown in Table a1 in the Appendix]. We also show that both types of networks are hierarchical, displaying a negative correlation between degree and clustering coefficient over all nodes in each network. Similar hierarchical properties have been defined for simulated networks generated by a fractal growth process, and have been measured in human brain structural MRI networks (Ravasz and Barabási, 2003; Bassett et al., 2008). Finally, we show that both financial and brain functional networks have similar, but not identical, profiles of robustness to random and targeted attack.
Figures 3 and 5 together show that financial and brain functional networks are very closely matched in terms of all commonly used network measures, but it is also interesting to consider whether any differences observed are statistically significant. To address this question in a simple, preliminary way, we compared the observed topological properties of a single market (NYSE) network to the distribution of identical properties estimated in a group of 18 human brain functional networks. If the financial network measure lies outside its observed distribution in the fMRI datasets, we regard that as provisional evidence for significant difference between networks. In Figure 6, we show that many of the key network measures differ between systems: the financial market system is more highly clustered, more modular and more efficient than the human brain networks, but it is also less robust to targeted attacks than the brain networks. These measures were estimated at the same cost κ = 21.2% as that chosen in Figure 5 (maximizing cost-efficiency in the brain functional network). Again, we have verified that the results hold over a large range of costs including, for example, the cost that maximizes cost-efficiency in the financial network.
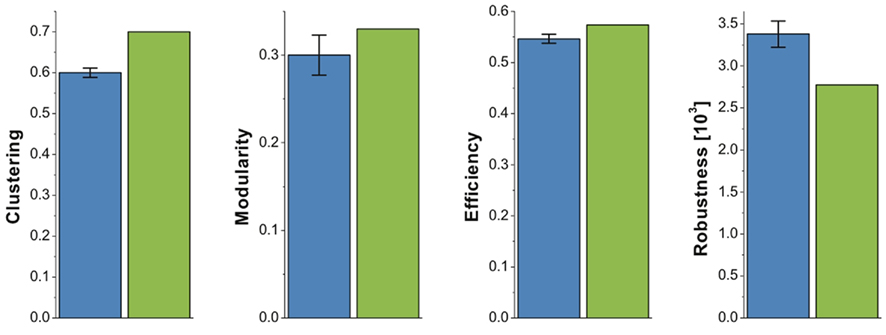
Figure 6. Differences in brain and market network organization at maximum cost-efficiency. Bar chart showing that the clustering, modularity, efficiency, and robustness of the financial network (green), fall outside the 95% confidence interval for these network measures in brain functional networks from 18 healthy volunteers (blue).
Discussion
Brains and Markets: Same or Different?
We have reported the first side-by-side comparison of the topological properties of human brain functional networks and financial markets. We find that both systems display striking similarities in their modular, hierarchical, and small-world organization distinguishing them from random graphs as well as from other real-world systems such as political networks. In addition, we find that these topological properties cannot be trivially reproduced by statistical models designed to capture the univariate properties of the individual (nodal) time series of financial networks. So the dominant impression at first glance is that brain and market systems are members of the same family of complex or non-random networks. In future work, it will be interesting to develop a rigorous taxonomy of networks, identifying topological similarities across a wide-range of network types. Our motivation for comparing brain and financial networks originally arose from the realization that both systems essentially evolved for a similar purpose: to process information by continually forming, storing, and updating a set of beliefs about the state of the world (Arthur, 1995; Wolpert and Ghahramani, 2005). Having found such a wide-range of similarities in the network topology as well as the function of the two systems, it is natural to wonder whether the organization of both systems may have been shaped by analogous selection pressures which could perhaps be universal to all information processing systems.
However, it is not simply the case that brain and market networks are identical. It is interesting to note that, at least for this dataset, the financial network did show subtle but significant differences from the fMRI data. In particular, the market was significantly more clustered, more modular, and more efficient than the brain networks; but the market was also significantly less robust than the brain networks to targeted attack on high-degree nodes or hubs. Bearing in mind the prior data and theory suggesting that modularity favors adaptivity of processing, clustering favors specialized segregation of processing, and efficiency favors integrated processing and is positively correlated with IQ and executive functions in human brain networks (Bassett et al., 2009; Li et al., 2009; van den Heuvel et al., 2009), the intuitive interpretation is that the market network is overall a more highly optimized information processing system than the human brain networks. It also seems intuitive, but will need further testing, that there may be a trade-off between informational optimization and robustness of these systems. The human brain may be less smart than the market but it is also less prone to systemic disintegration as a result of removing key nodes or hubs from the networks. It is imaginable that this hypothetical interplay between informational optimization and robustness to hub deletion could be useful in assessing or controlling a market’s risk of systemic collapse.
Another, more obvious difference between the two systems we studied is that brain functional networks are in fact a manifestation of dynamics taking place on an underlying anatomical substrate, which is itself a network. Our choice to study functional rather than anatomical networks was motivated by the more direct analogy to financial networks, which are likewise based on similarity measures of time series data. Previous studies have shown that functional networks based on long windows of observation (minutes) largely overlap with the underlying anatomical network (Honey et al., 2007). It will be interesting, in future work, to extend our study both to static anatomical networks and, at the other extreme, to the dynamic reconfiguration of both financial and brain networks based on higher frequency data such as intra-day financial time series and magnetoencephalography (MEG) brain functional data (Kitzbichler et al., 2011).
Methodological Parallels
At a practical level, the similarities between financial and brain functional networks highlight the potential for scientific arbitrage opportunities, solving methodological problems by direct analogy across disciplines. For instance, the similarity in the two systems’ network structure implies that both fields have to resolve the question of appropriate filtering of the adjacency matrices when constructing networks. While the aim is to reduce noise by including only those edges corresponding to the strongest correlations, the disconnected nature of the resulting networks is known to bias all topological measures and to complicate their use for comparison between subjects or across time (Alexander-Bloch et al., 2010).
In the financial literature, this problem has been circumvented by the introduction, over a decade ago, of MSTs. While these are, by construction, guaranteed to include all N nodes and a fixed number (N − 1) of edges, they are also severely limited in the amount of information they represent. In neuroscientific research, filtering methods have traditionally been more conservative in excluding information. Consequently, the associated problems in comparing two populations (health and disease) have only recently come to the community’s attention (Alexander-Bloch et al., 2010). However, our results in Figure 1 indicates that, in spite of their simplicity, MSTs do capture some important features of the underlying system. It would therefore be interesting to develop a set of useful measures which can characterize an MST, just as clustering coefficient, path length, and other measures are routinely used to characterize networks. At the other extreme, modularity analyses of brain data could potentially benefit from another technique that recently emerged in the field of financial networks, enabling the determination of modules without the need for filtering (Heimo et al., 2008). Finally, we note that the development of new filtering methods is an active area of research and that recent theoretical advances (Tumminello et al., 2005; Serrano et al., 2008; Radicchi et al., 2011) will likely prove useful in the analysis of both financial and neuroscientific data.
Conclusion
Our results suggest that financial and brain networks share a wide-range of structural properties distinguishing them from random graphs as well as from other real-world and model systems. Beyond the intrinsic interest of such an observation, we believe this analogy between two a priori very different systems will prove significant and useful in at least two different ways.
Firstly, our findings highlight the fact the many of the methodological and technical problems encountered in the study of brain functional networks are also likely to have emerged in the study of asset graphs. The two fields could therefore benefit from increased “crosstalk” when addressing such methodological issues.
Secondly, many of the most exciting open questions are remarkably similar in both fields, suggesting insights gained in one area may potentially be translated in a straight-forward manner to the other. We expect this approach to be particularly useful in better understanding temporal dynamics and perhaps anomalous activity in both markets and brain function.
Conflict of Interest Statement
The authors declare that the research was conducted in the absence of any commercial or financial relationships that could be construed as a potential conflict of interest.
Acknowledgments
We thank Drs Karen Ersche and Kevin Craig who conducted the fMRI experiments, as well as Prof. Trevor Robbins. We also thank Dr. Mervyn Freeman for useful comments on the manuscript. This work was supported by a grant from the Engineering and Physical Sciences Research Council and by the Behavioural and Clinical Neuroscience Institute, University of Cambridge, which is funded by the Medical Research Council and the Wellcome Trust. Complexity research at BAS is part of the Polar Science for Planet Earth Programme, funded by the Natural Environment Research Council.
References
Achard, S., Bassett, D. S., Meyer-Lindenberg, A., and Bullmore, E. (2008). Fractal connectivity of long-memory networks. Phys. Rev. E 77, 036104.
Achard, S., Salvador, R., Whitcher, B., Suckling, J., and Bullmore, E. (2006). A resilient, low-frequency, small-world human brain functional ntwork with highly connected association cortical hubs. J. Neurosci. 26, 63–72.
Alexander-Bloch, A. F., Gogtay, N., Meunier, D., Birn, R., Clasen, L., Lalonde, F., Lenroot, R., Giedd, J., and Bullmore, E. T. (2010). Disrupted modularity and local connectivity of brain functional networks in childhood-onset schizophrenia. Front. Syst. Neurosci. 4:147. doi: 10.3389/fnsys.2010.00147
Baillic, R. T. (1996). Long memory processes and fractional integration in econometrics. J. Econom. 73, 5–59.
Bassett, D., Bullmore, E., Meyer-Lindenberg, A., Apud, J., Weinberger, D., and Coppola, R. (2009). Cognitive fitness of cost-efficient brain functional networks. Proc. Natl. Acad. Sci. U.S.A. 106, 11747–11752.
Bassett, D., Bullmore, E., Verchinski, B., Mattay, V., Weinberger, D., and Meyer-Lindenberg, A. (2008). Hierarchical organization of human cortical networks in health and schizophrenia. J. Neurosci. 28, 9239–9248.
Bonanno, G., Caldarelli, G., Lillo, F., and Mantegna, R. (2003). Topology of correlation-based minimal spanning trees in real and model markets. Phys. Rev. E 68, 461301–461304.
Bullmore, E., and Sporns, O. (2009). Complex brain networks: graph theoretical analysis of structural and functional systems. Nat. Rev. Neurosci. 10, 186–198.
Burnham, K. P., and Anderson, D. R. (2002). Model Selection and Multimodel Inference: a Practical Information-Theoretic Approach, 2nd edn. Berlin: Springer-Verlag.
Coelho, R., Hutzler, S., Repetowicz, P., and Richmond, P. (2007). Sector analysis for a FTSE portfolio of stocks. Physica A 373, 615–626.
Engle, R. F. (1982). Autoregressive conditional heteroscedasticity with estimates of variance of United Kingdom inflation. Econometrica 50, 987–1008.
Heimo, T. (2009). Complex Networks and Spectral Methods: An Econophysics Approach to Equity Markets. Helsinki: Helsinki University of Technology.
Heimo, T., Kumpula, J., Kaski, K., and Saramaki, J. (2008). Detecting modules in dense weighted networks with the potts method. J. Stat. Mech. P08007. doi: 10.1088/1742-5468/2008/08/P08007
Honey, C., Kotter, R., Breakspear, M., and Sporns, O. (2007). Network structure of cerebral cortex shapes functional connectivity on multiple time scales. Proc. Natl. Acad. Sci. U.S.A. 104, 10240–10245.
Jeong, H., Tombor, B., Albert, R., Oltvai, Z., and Barabási, A.-L. (2000). The large-scale organization of metabolic networks. Nature 407, 651–655.
Jung, W.-S., Kwon, O., Wang, F., Kaizoji, T., Moon, H.-T., and Stanley, H. (2008). Group dynamics of the Japanese market. Physica A 387, 537–542.
Kaiser, M., Martin, R., Andras, P., and Young, M. P. (2007). Simulation of robustness against lesions of cortical networks. Eur. J. Neurosci. 25, 3185–3192.
Kitzbichler, M., Henson, R., Smith, M., Nathan, P., and Bullmore, E. (2011). Cognitive effort drives workspace configuration of human brain functional networks. J. Neurosci. 31, 8259–8270.
Li, Y., Liu, Y., Li, J., Qin, W., Li, K., Yu, C., and Jiang, T. (2009). Brain anatomical network and intelligence. PLoS Comput. Biol. 5, e1000395. doi: 10.1371/journal.pcbi.1000395
Mantegna, R., and Stanley, E. (2000). An Introduction to Econophysics – Correlations and Complexity in Finance. Cambridge: Cambridge University Press.
Maxim, V., Sendur, L., Fadili, J., Suckling, J., Gould, R., Howard, R., and Bullmore, E. (2005). Fractional Gaussian noise, functional MRI and Alzheimer’s disease. Neuroimage 25, 141–158.
Meunier, D., Lambiotte, R., Fornito, A., Ersche, K., and Bullmore, E. (2009). Hierarchical modularity in human brain networks. Front. Neuroinform. 3:37. doi: 10.3389/neuro.11.037.2009
Mucha, P., Richardson, T., Macon, K., Porter, M. A., and Onnela, J.-P. (2010). Community structure in time-dependent, multiscale, and multiplex networks. Science 328, 876.
Newman, M. E. J. (2004). Fast algorithm for detecting community structure in networks. Phys. Rev. E 69, 066133.
Onnela, J.-P. (2006). Complex Networks in the Study of Financial and Social Systems. Helsinki: Helsinki University of Technology.
Onnela, J.-P., Chakraborti, A., Kaski, K., and Kertész, J. (2002). Dynamic asset trees and portfolio analysis. Eur. Phys. J. B 30, 285.
Onnela, J.-P., Kaski, K., and Kertész, J. (2004). Clustering and information in correlation based financial networks. Eur. Phys. J. B 38, 353.
Percival, D., and Walden, A. (2000). Wavelet Methods for Time Series Analysis. Cambridge: Cambridge University Press.
Portera, M. A., Mucha, P. J., Newman, M. E. J., and Friend, A. J. (2007). Community structure in the United States house of representatives. Physica A 386, 414–438.
Radicchi, F., Ramasco, J., and Fortunato, S. (2011). Information filtering in complex weighted networks. Phys. Rev. E 83, 046101.
Ravasz, E., and Barabási, A.-L. (2003). Hierarchical organization in complex networks. Phys. Rev. E 67, 026112.
Serrano, M., Boguñá, M., and Vespignani, A. (2008). Extracting the multiscale backbone of complex weighted networks. Proc. Natl. Acad. Sci. U.S.A. 106, 6483–6488.
Suckling, J., Long, C., Triantafyllou, C., Brammer, M., and Bullmore, E. (2006). Variable precision registration via wavelets: optimal spatial scales for inter-subject registration of functional MRI. Neuroimage 31, 197–208.
Tumminello, M., Aste, T., Matteo, T. D., and Mantegna, R. N. (2005). A tool for filtering information in complex systems. Proc. Natl. Acad. Sci. U.S.A. 102, 10421–10426.
Tzourio-Mazoyer, N., Landeau, B., Papathanassiou, D., Crivello, F., Etard, O., Delcroix, N., Mazoyer, B., and Joliot, M. (2002). Automated anatomical labeling of activations in SPM using a macroscopic anatomical parcellation of the MNI MR single-subject brain. Neuroimage 15, 273–289.
van den Heuvel, M., Stam, C., Kahn, R., and Hulshoff Pol, H. (2009). Efficiency of functional brain networks and intellectual performance. J. Neurosci. 29, 7619–7624.
Watts, D., and Strogatz, S. (1998). Collective dynamics of “small-world” networks. Nature 393, 440–442.
Wolpert, D., and Ghahramani, Z. (2005). Bayes Rule in Perception, Action and Cognition. Oxford: Oxford University Press.
Appendix
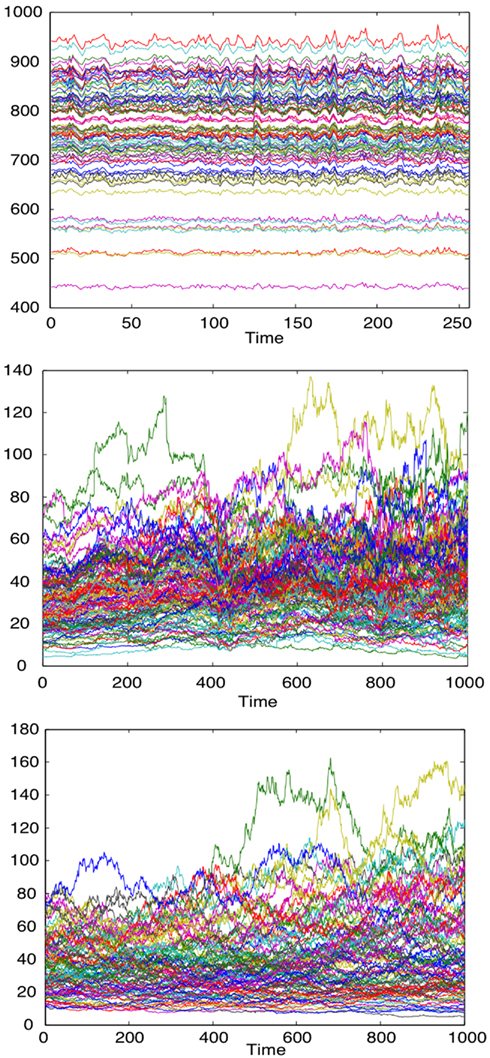
Figure A1. Time series of fMRI data from 90 brain regions (top), time series for the daily closure price of 90 NYSE stocks (middle), time series for the stock price evolution, according to the Black-Scholes model, of 90 model stocks (bottom).
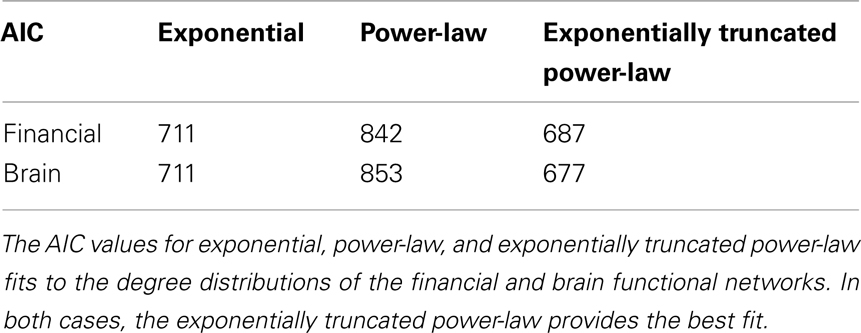
Table A1. Akaike information criterion (AIC).
Keywords: human brain, networks, financial markets, fMRI, topology
Citation: Vértes PE, Nicol RM, Chapman SC, Watkins NW, Robertson DA and Bullmore ET (2011) Topological isomorphisms of human brain and financial market networks. Front. Syst. Neurosci. 5:75. doi: 10.3389/fnsys.2011.00075
Received: 30 May 2011; Paper pending published: 25 June 2011;
Accepted: 14 August 2011; Published online: 15 September 2011.
Edited by:
Robert Turner, Max Planck Institute for Human Cognitive and Brain Sciences, GermanyReviewed by:
Marcus Kaiser, Seoul National University, South KoreaDaniel S. Margulies, Max Planck Institute, Germany
Copyright: © 2011 Vértes, Nicol, Chapman, Watkins, Robertson and Bullmore. This is an open-access article subject to a non-exclusive license between the authors and Frontiers Media SA, which permits use, distribution and reproduction in other forums, provided the original authors and source are credited and other Frontiers conditions are complied with.
*Correspondence: Edward T. Bullmore, Department of Psychiatry, Behavioural and Clinical Neuroscience Institute, University of Cambridge, Herchel Smith Building for Brain and Mind Sciences, Cambridge Biomedical Campus, Cambridge CB2 0SZ, UK. e-mail: etb23@cam.ac.uk