Cerebral low-molecular metabolites influenced by intestinal microbiota: a pilot study
- 1Dairy Science and Technology Institute, Kyodo Milk Industry Co. Ltd., Hinode-machi, Tokyo, Japan
- 2Benno Laboratory, RIKEN Innovation Center, Wako, Saitama, Japan
- 3Human Metabolome Technologies, Inc., Tsuruoka, Yamagata, Japan
- 4Department of Infectious Diseases, School of Medicine, Tokai University, Isehara, Kanagawa, Japan
Recent studies suggest that intestinal microbiota influences gut-brain communication. In this study, we aimed to clarify the influence of intestinal microbiota on cerebral metabolism. We analyzed the cerebral metabolome of germ-free (GF) mice and Ex-GF mice, which were inoculated with suspension of feces obtained from specific pathogen-free mice, using capillary electrophoresis with time-of-flight mass spectrometry (CE-TOFMS). CE-TOFMS identified 196 metabolites from the cerebral metabolome in both GF and Ex-GF mice. The concentrations of 38 metabolites differed significantly (p < 0.05) between GF and Ex-GF mice. Approximately 10 of these metabolites are known to be involved in brain function, whilst the functions of the remainder are unclear. Furthermore, we observed a novel association between cerebral glycolytic metabolism and intestinal microbiota. Our work shows that cerebral metabolites are influenced by normal intestinal microbiota through the microbiota-gut-brain axis, and indicates that normal intestinal microbiota closely connected with brain health and disease, development, attenuation, learning, memory, and behavior.
Introduction
Intestinal microbiota play a fundamentally important role in health and diseases (Backhed et al., 2005). Recently, the relationship between intestinal microbiota and systemic phenomena beyond the intestinal environment, such as obesity (Turnbaugh et al., 2006) and lifespan (Matsumoto et al., 2011), have been reported. The bidirectional signaling between the gastrointestinal tract and the brain, the gut-brain axis, is vital for maintaining homeostasis and is regulated at the neural, hormonal, and immunological levels. The importance of the gut-brain axis is further emphasized by the high incidence of co-morbidities between stress-related psychiatric disorders such as anxiety, and gastrointestinal disorders (Camara et al., 2009). Recent studies have investigated the effect of gut microbiota on brain and behavior. The results of these studies suggest that intestinal microbiota have a great impact on gut-brain communication, which led to the coining of the term “microbiota-gut-brain axis” (MGB axis) (Rhee et al., 2009; Cryan and Dinan, 2012). For example, intestinal microbiota modulates brain development and subsequent adult behavior, such as motor activity and anxiety (Heijtz et al., 2011; Neufeld et al., 2011). Studies on the MGB axis have focused on the central nervous system (CNS), including the hypothalamic-pituitary-adrenal axis (Sudo et al., 2004; Rhee et al., 2009), neurotransmitter, and synapse related factors (for example, PSD-95, synaptophysin; Heijtz et al., 2011), and brain-derived neurotrophic factor (Heijtz et al., 2011; Neufeld et al., 2011). However, to the best of our knowledge, other metabolites stimulated by the MGB axis have not been investigated. Furthermore, some metabolites may be synthesized independently in the brain and may be influenced by MGB axis, while some metabolites produced by intestinal bacteria may be transported from the colonic lumen to the brain in the bloodstream without filtration by blood-brain barrier (BBB).
Capillary electrophoresis with time-of-flight mass spectrometry (CE-TOFMS) is a novel strategy for analyzing and differentially displaying metabolic profiles (Monton and Soga, 2007). Here, using CE-TOFMS, we analyzed the cerebral metabolome obtained from germ-free (GF) mice and Ex-GF mice, harboring intestinal microbiota from specific pathogen-free mice and demonstrated the large effect of intestinal microbiota on the cerebral metabolome.
Materials and Methods
Mice
Germ-free BALB/c mice were purchased originally from Japan Clea Inc. (Tokyo, Japan), and were bred in the Department of Infectious Diseases, Tokai University School of Medicine, Kanagawa, Japan. We divided six male mice bred from mating into two groups, GF mice (GF 1–3) and Ex-GF mice (Ex-GF 1–3). Mice were housed in Trexler-Type flexible film plastic isolators with sterilized clean tip (CLEA Japan, Inc., Tokyo) as bedding. They were given sterilized water and sterilized commercial CL-2 pellets, which consisted of moisture (8.5%), crude protein (24.5%), crude fat (8.0%), crude fiber (4.4%), crude ash (8.5%), and nitrogen free extracts (48.2%), corresponding to 344.7 kcal/100 g (CLEA Japan, Inc.), ad libitum. The diet was sterilized with an autoclave (121°C, 30 min). Surveillance for bacterial contamination was performed by periodic bacteriological examination of feces throughout the experiments. Ex-GF mice were inoculated at 4 weeks of age into the stomach by a metal catheter with 0.5 mL of a 10−1 suspension of feces obtained from SPF BALB/c mice. The protocols approved by the Kyodo Milk Animal Use Committee (Permit Number: 2009-02) and all experimental procedures were performed according to the guidelines of the Animal Care Committee of Tokai University.
Specimen Preparation and CE-TOFMS
Mice (7-week-old mice) were sacrificed by cervical dislocation. The brain was resected on ice, and prefrontal cortex was sliced between 2.5 and 3.5 mm anterior to bregma within 5 min of sacrifice. Immediately after the sacrifaction, cardiac blood (approximately approximately 100 μl) was collected, and sodium ethylenediamine tetraacetate plasma (final concentration was 0.13%) was prepared by centrifugation for 20 min at 2,300 × g and 4°C. The samples were stored at −80°C until use.
Cardiac plasma (50 μl) and methanol (450 μl) with 50 μM intestinal standard were vortexed. The plasma homogenate served as crude metabolome and was added to chloroform (500 μl) and Milli-Q (200 μl), mixed, and centrifuged (2,300 × g, for 5 min at 4°C). The aqueous layer was centrifugally filtered through a 5-kDa cutoff filter Ultrafree-MC (Millipore). The filtrated solution was dried up and suspended in 25 μL Milli-Q water just before the measurement. The cerebrums were suspended in methanol (500 μl) with 50 μM intestinal standard and vortexed vigorously five times for 60 s with a MicroSmash MS-100R (Tomy Digital Biology Co., Ltd., Tokyo, Japan) at 4,000 rpm. The resulting cerebrum sample served as crude metabolome that subsequently underwent the same treatment as the plasma crude metabolome.
Metabolomics measurement and data processing were performed as described previously with an Agilent Capillary Electrophoresis System (Ooga et al., 2011). The CE-MS system is the Agilent G1600A Capillary Electrophoresis System connected with the Agilent G1969A LC/MSD TOF (Agilent Technologies, Palo Alto, CA, USA).
RNA Preparation and Quantitative Real-Time PCR of the Cerebrums
Frozen prefrontal cerebrums were processed for total RNA preparation with TaKaRa FastPure RNA Kits (Takara Bio Inc., Otsu, Japan). The quantity, purity, and integrity were confirmed initially by electrophoresis. cDNA for each sample was synthesized using 200 ng total RNA and PrimeScript RT reagent Kits (Takara Bio Inc.). Real-time PCR was performed with a StepOne Real-Time PCR System (Applied Biosystems) with TaqMan Fast Universal PCR Master Mix (Applied Biosystems) using TaqMan probes (hexokinase 1: Mm00439344_m1, phosphofructokinase: Mm00445461_m1, and β-actin: Mm02619580_g1). The comparative delta Ct method was used for normalizations to the housekeeping gene β-actin.
Intestinal Bacterial Compositions
Bacterial compositions were determined using pyrosequencing system. Bacterial DNA was isolated from colonic content samples of mice. The 16S rRNA was targeted to identify intestinal bacteria and a pair of universal primers; 27f (5 –AGA GTT TGA TCC TGG CTC AG–3) and 350r (5 –CTG CTG CCT CCC GTA G–3) were used for PCR. Amplicons were applied to GS titanium sequencing Kit (Roche Diagnostics) include emulsion PCR and analyzed by Genome sequencer FLX system (Roche Diagnostics). About 18,000–20,500 sequences in each sample were identified. Sequences data were compared with DDBJ database (Blast) and classified by taxonomic categories.
Data Analysis and Statistics
Clustering analysis in metabolome was processed by MATLAB 2008a (MathWorks, MA, USA). Differences in relative quantity between GF mice and Ex-GF mice were evaluated for individual metabolites by Welch’s t-test.
Results
The Difference in Cerebral Metabolome between GF and Ex-GF Mice
When the mice were sacrificed, the body weights of GF mice were between 22 and 24 g and those of Ex-GF mice were between 22 and 25 g. CE-TOFMS identified 196 (120 cations and 76 anions) metabolites from the cerebral metabolome in both of GF and Ex-GF mice. Hierarchical clustering of metabolite patterns is shown in Figure 1A. A remarkable difference was observed in the cerebral metabolome between GF and Ex-GF mice. Of the 196 metabolites in the cerebral metabolome, the concentrations of 23 metabolites were at least 1.6-fold, and/or significantly (p < 0.05) higher, in GF mice than Ex-GF mice (group GF > Ex-GF). A further 15 metabolites were at least 1.6-fold, and significantly (p < 0.05) higher, in Ex-GF mice than GF mice (group GF < Ex-GF), and/or 158 metabolites showed no difference in concentration or incidence between GF and Ex-GF mice (Figure 1B).
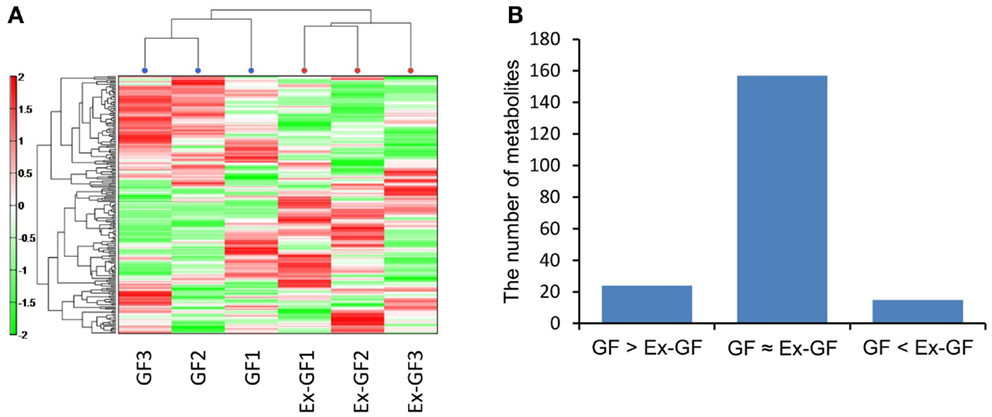
Figure 1. Difference in the cerebral metabolome between GF mice and Ex-GF mice. (A) Hierarchical clustering showing patterns of metabolites. Red and green indicate high and low concentrations of metabolites, respectively. (B) The number of cerebral metabolites in the group. GF > Ex-GF; GF ≈ Ex-GF; and GF < Ex-GF.
Identified metabolites were classified into eight categories and are listed in Table A1 in Appendix (anion) and Table A2 (cation) in Appendix. Metabolites, in which there are significant differences between GF and Ex-GF mice, are shown in Tables 1 and 2.
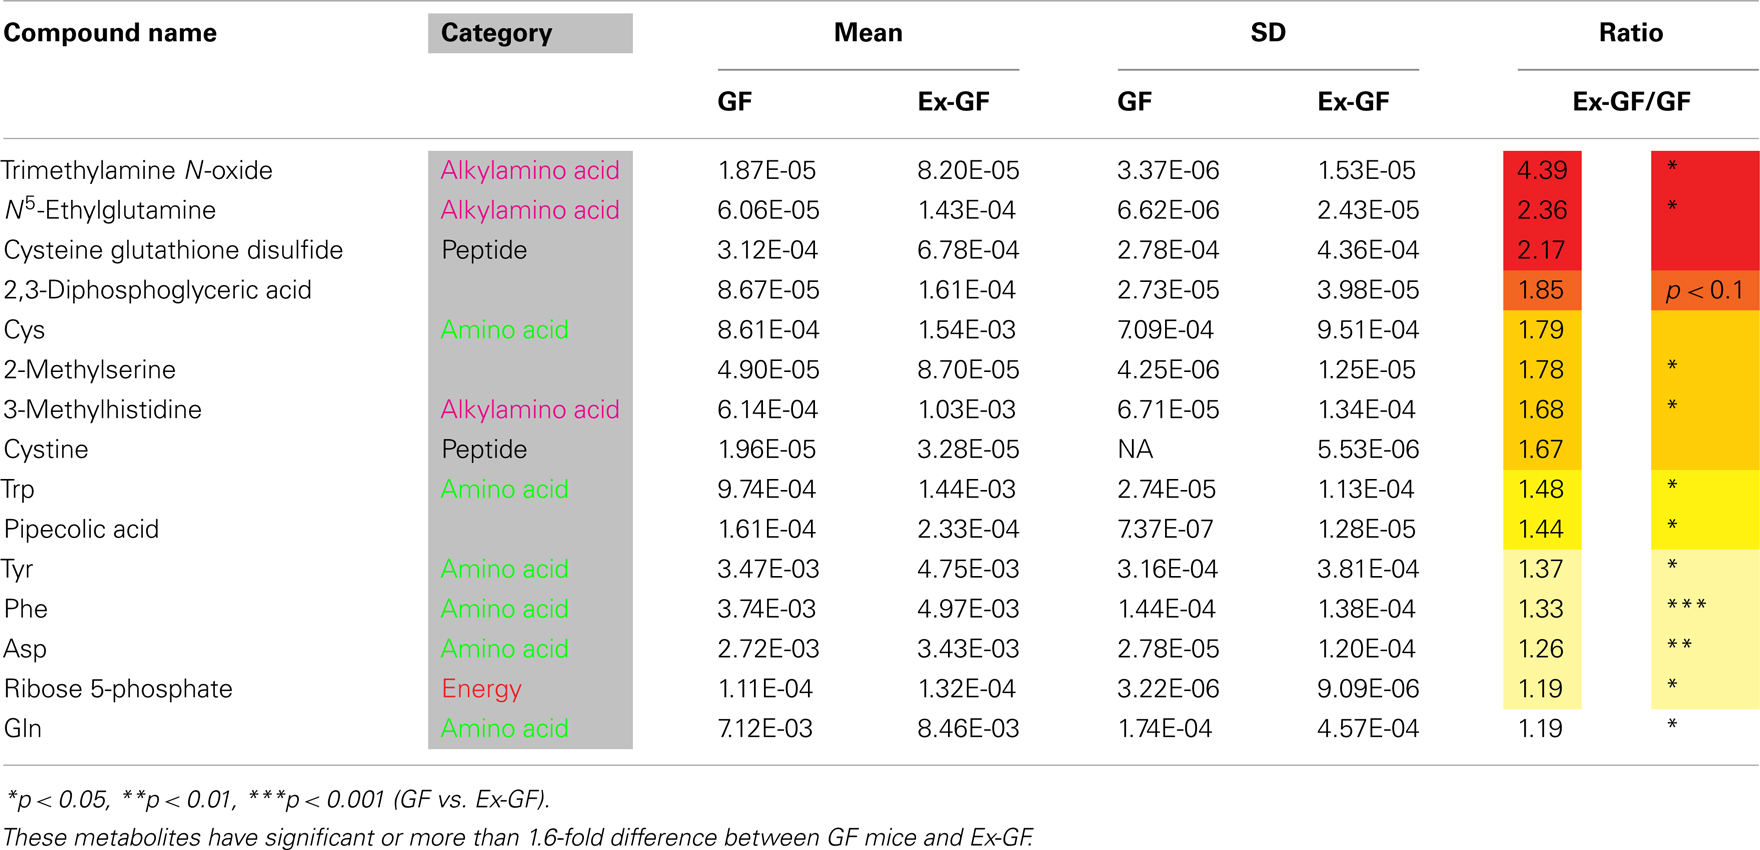
Table 1. Metabolites whose concentrations were higher in the cerebral metabolome of Ex-GF mice than in that of GF mice.
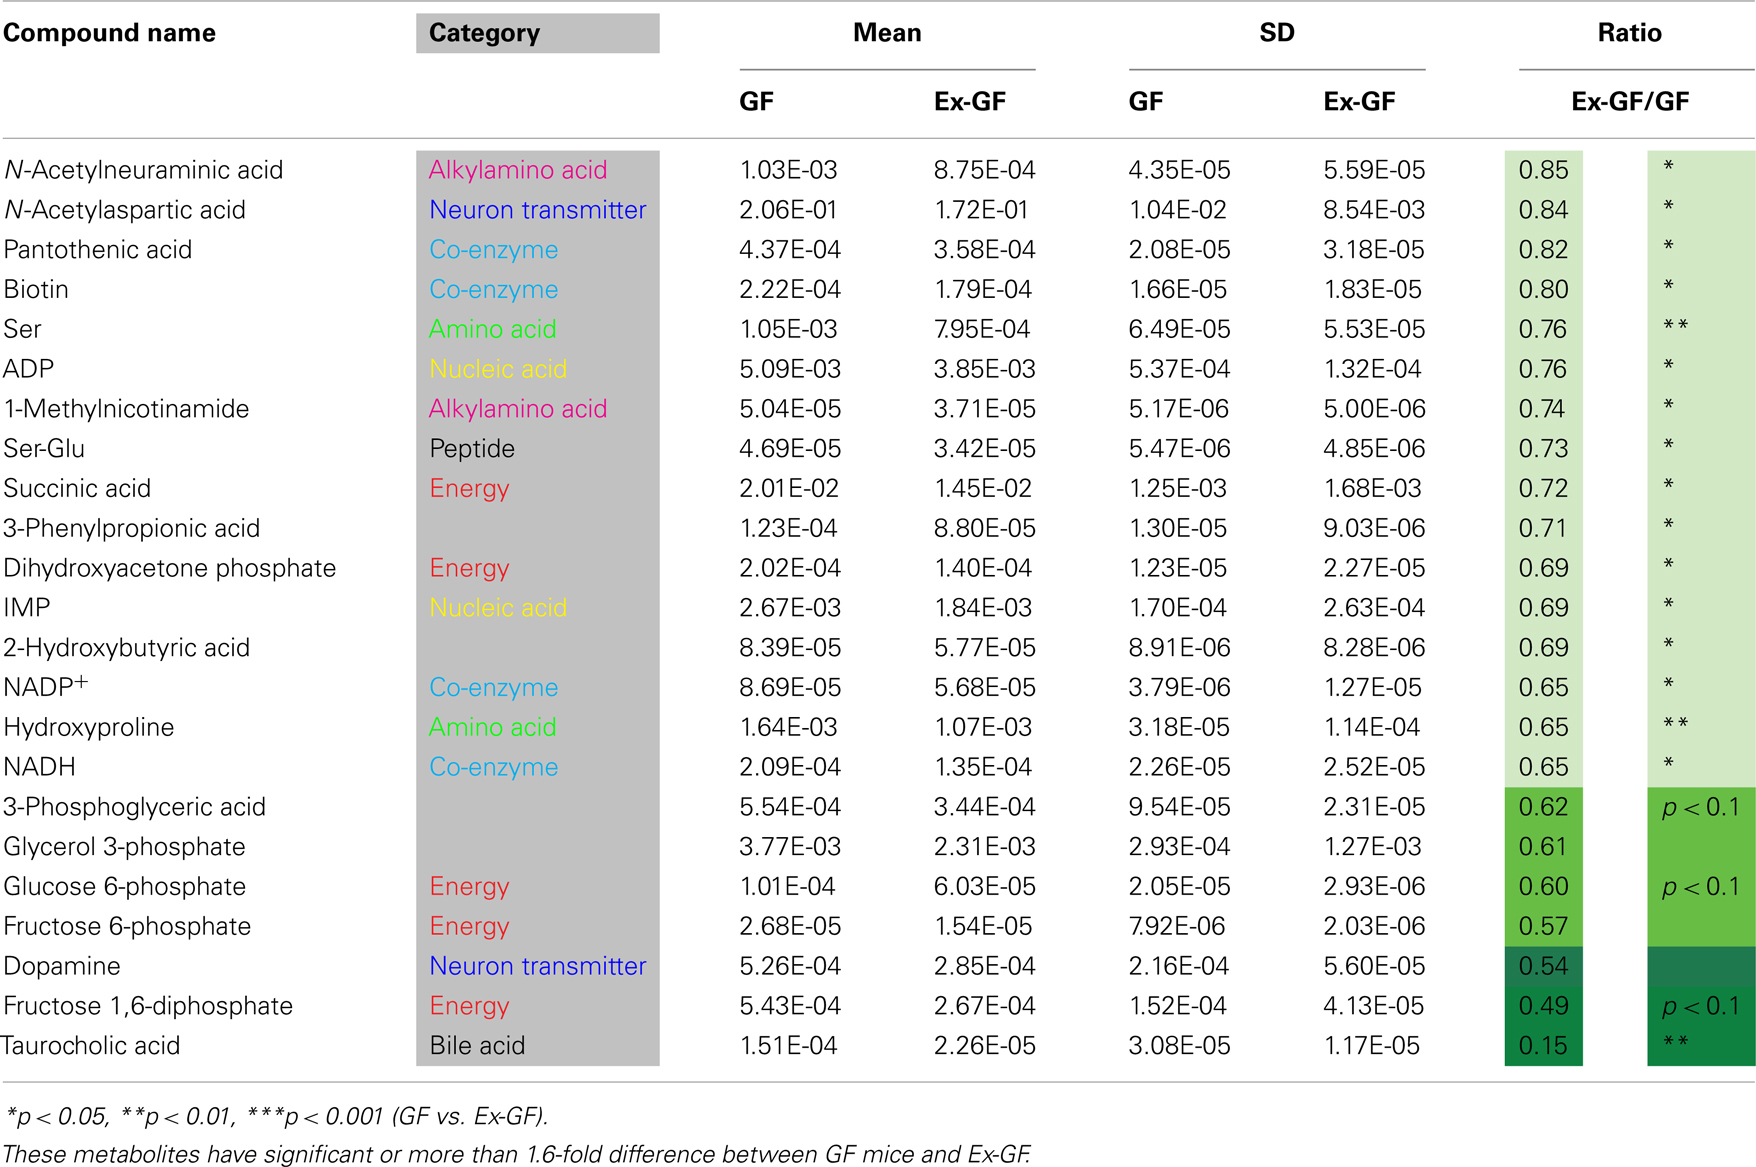
Table 2. Metabolites whose concentrations were lower in the cerebral metabolome of Ex-GF mice than in that of GF mice.
Influence of Intestinal Microbiota on Cerebral Glycolytic Metabolism
The relative quantities of the annotated metabolites in the principal metabolic pathways are represented as bar graphs (Figure 2). The concentrations of metabolites involved in glycolysis/gluconeogenesis pathways are characteristically higher in GF mice than in Ex-GF mice. Therefore, we focused our work on cerebral glycolytic metabolism (Figure 3A). The concentration of ADP and NADH were significantly (p < 0.05) higher, while there was a tendency for concentrations of ATP, AMP, and NAD+ to be higher in GF mice than Ex-GF mice. The NADH/NAD+ ratio tended to be lower in GF mice than in Ex-GF mice (Figure 3B). There was no difference in the expression of the hexokinase and phosphofructokinase genes, between GF mice and Ex-GF mice (Figure 3C).
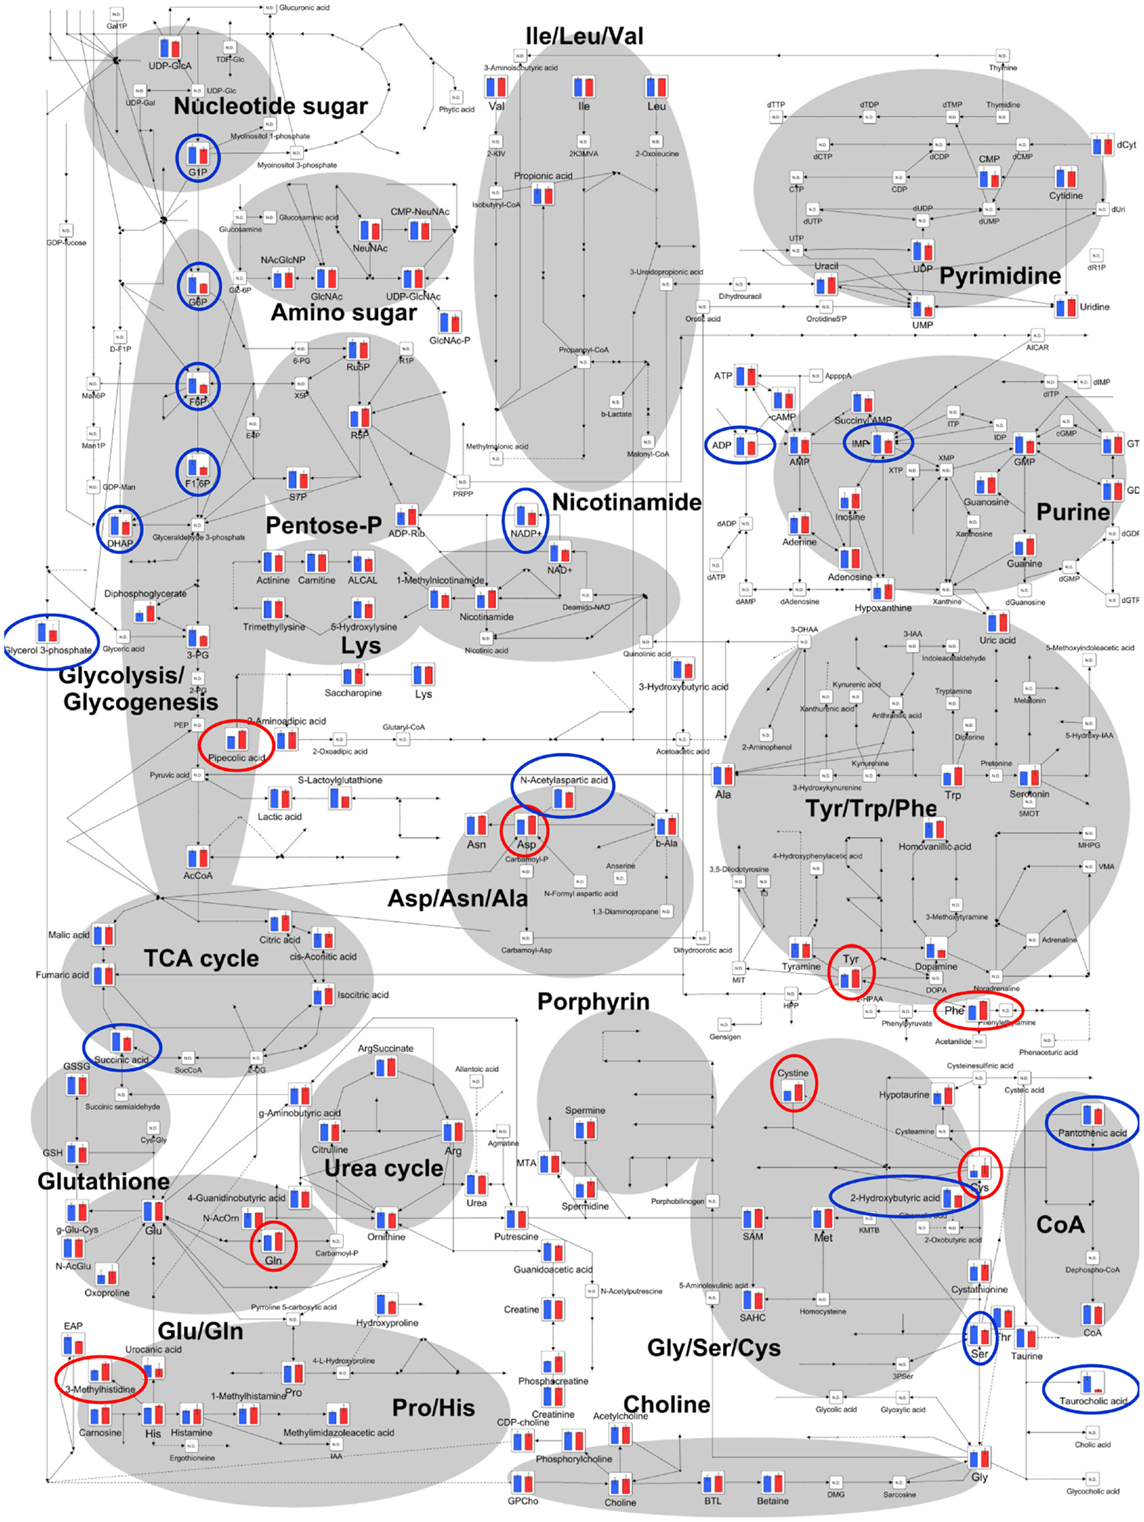
Figure 2. Differences of cerebral metabolites between GF mice and Ex-GF mice on the principal metabolic pathways. The relative quantities of the annotated metabolites are represented as bar graphs (blue, GF: red, Ex-GF). Metabolites surrounded by blue and red circles are of higher and lower concentrations, respectively, in GF mice than Ex-GF mice. ND, not detected.
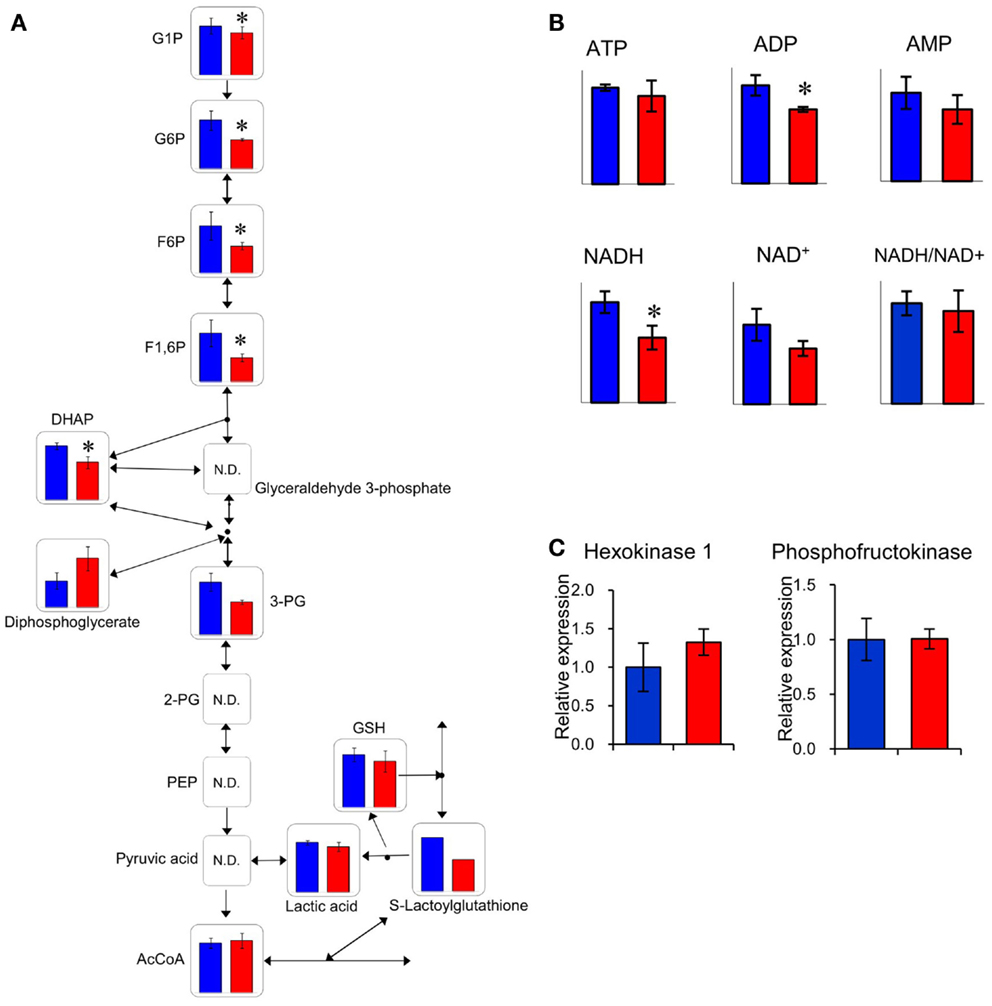
Figure 3. Comparison of glycolytic metabolic activity between GF mice and Ex-GF mice. (A) The relative quantities of the annotated metabolites are represented as bar graphs (blue, GF: red, Ex-GF). (B) Relative quantities of ATP, ADP, AMP, and nicotinamides (*p < 0.05). (C) Cerebral gene expression of hexokinase and phosphofructokinase. Data are represented as mean ± SD (A,B) and mean ± SEM (C).
Comparison of Individual Differences in Metabolome between Colonic Luminal Content, Cardiac Plasma, and the Cerebrum
Relative standard deviations (RSD% = value of standard deviation/value of mean × 100) of metabolites in the colonic luminal content, cardiac plasma, and the cerebrum of GF and Ex-GF mice are shown in Figure 4. The RSD value of metabolites in the cerebrum was similar between GF and Ex-GF mice. However, in Ex-GF mice, the RSD values in cardiac plasma (p = 0.10) and colonic luminal content (p < 0.001) were larger than in GF mice. In addition, in Ex-GF mice, the RSD values were the highest for colonic content (vs. cardiac plasma, p < 0.01), followed by cardiac plasma (vs. the cerebrum, p < 0.05) and the cerebrum. In contrast, in GF mice, the RSD value did not differ between colonic content and cardiac plasma, although that of cardiac plasma was greater than that of the cerebrum (p < 0.05).
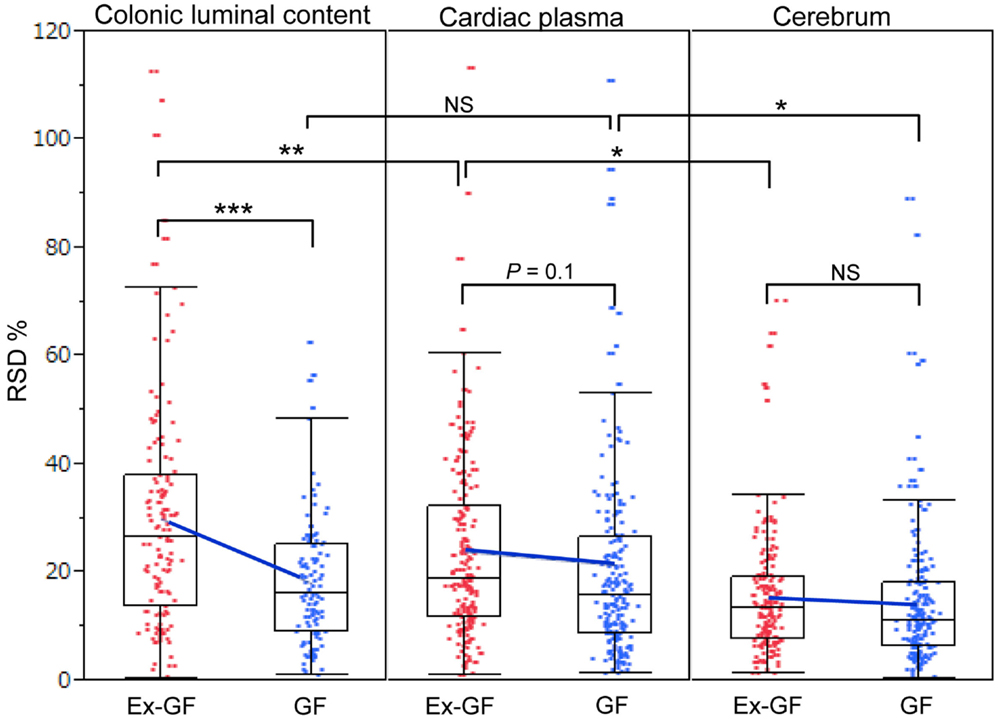
Figure 4. The boxplot of RSD% of all metabolites detected from colonic luminal content, cardiac plasma, and the cerebrum. Blue cross bars represent the comparison of means between Ex-GF mice and GF mice. *p < 0.05, **p < 0.01, ***p < 0.001 (GF vs. Ex-GF).
Comparisons of Metabolites between Colonic Luminal Content, Cardiac Plasma, and the Cerebrum
We compared the 38 metabolites, which were significantly altered between the cerebrum of GF and Ex-GF mice. The relative quantitative ratio (Ex-GF/GF value) for the expression of each metabolite in colonic luminal content, cardiac plasma, and the cerebrum are shown in Figure 5. Six metabolites, which are shown in red, had similar Ex-GF/GF ratios in all three sites. Although detected in the cerebrum, 12 metabolites, which are shown in blue, were below the detection limit in cardiac plasma. A total of 16 metabolites, which are marked by the “#” symbol, had different Ex-GF/GF ratios between the cerebrum and cardiac plasma. The Ex-GF/GF ratios of all other metabolites did not differ between the three specimens.
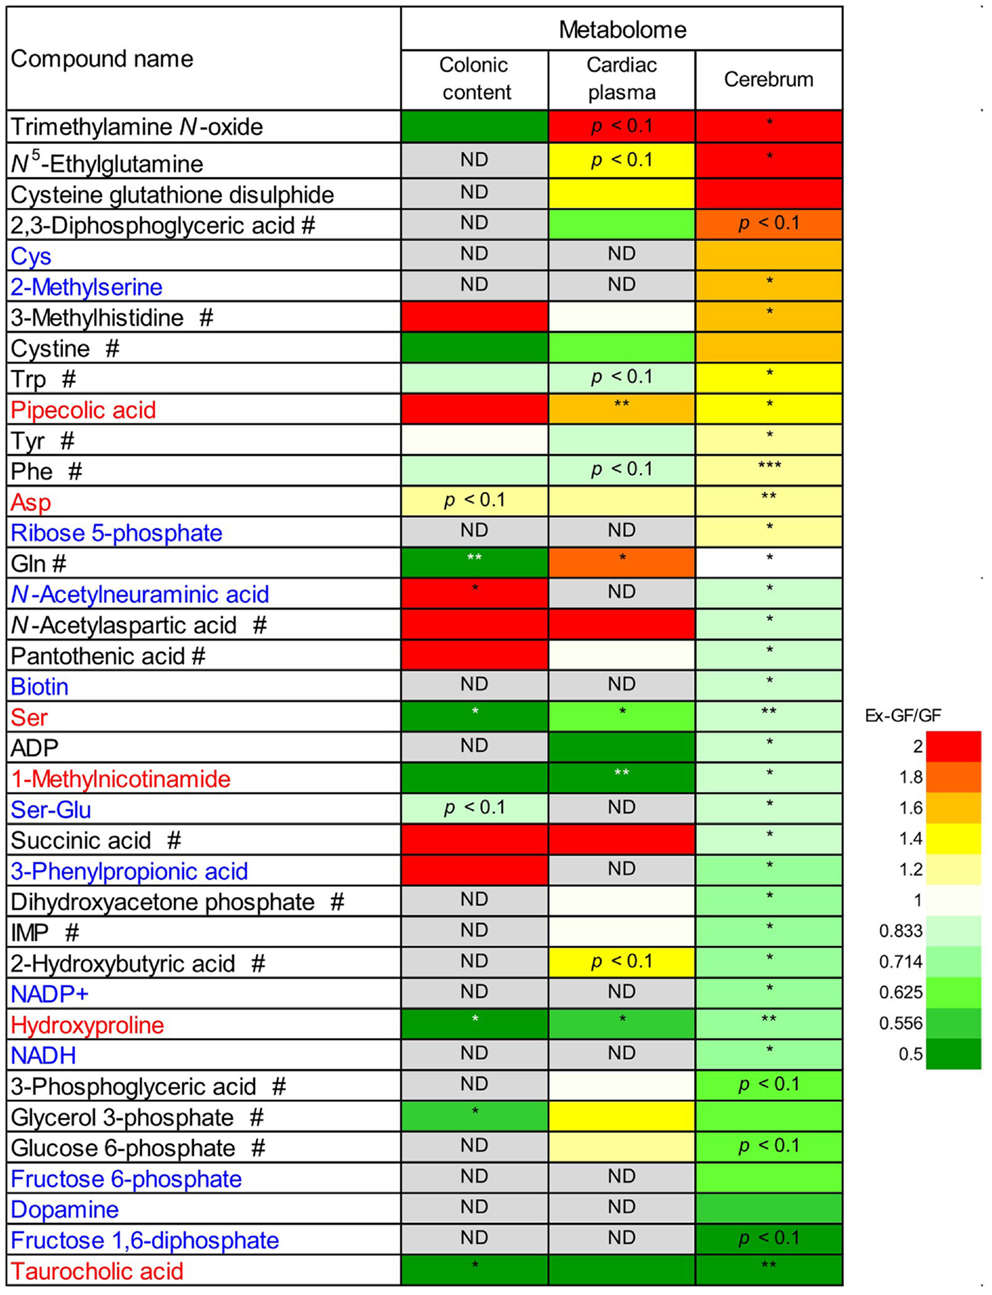
Figure 5. Relative quantitative ratio (Ex-GF/GF value) comparisons of 38 metabolites between GF mice and Ex-GF mice, colonic luminal content, cardiac plasma, and the cerebrum. Metabolites shown in red have similar Ex-GF/GF ratios between the colonic lumen, cardiac plasma, and the cerebrum. Metabolites shown in blue are below the detection limit in cardiac plasma, but were detected in the cerebrum. #These metabolites differed in Ex-GF/GF ratios between the cerebrum and cardiac plasma. *p < 0.05, **p < 0.01, ***p < 0.001 (GF vs. Ex-GF). ND, not detected.
Intestinal Bacterial Compositions
Bacterial compositions were analyzed using FLX systems and the results are shown in Figure 6. Phylum Firmicutes (80%) and phylum Bacteroidetes (about 6%) have been identified as dominant populations in all samples. Following detailed classification on the family level, the families Lactobacillaceae, Lachnospiraceae, Clostridiaceae, and Bacteroidaceae were commonly detected and constituted higher proportions in the population, i.e., 50–70, 3–10, 2–5, and 2–4% respectively, than other families. However, there were only small individual differences among the samples. These families accounted for up to 60–70% of the total bacterial population.
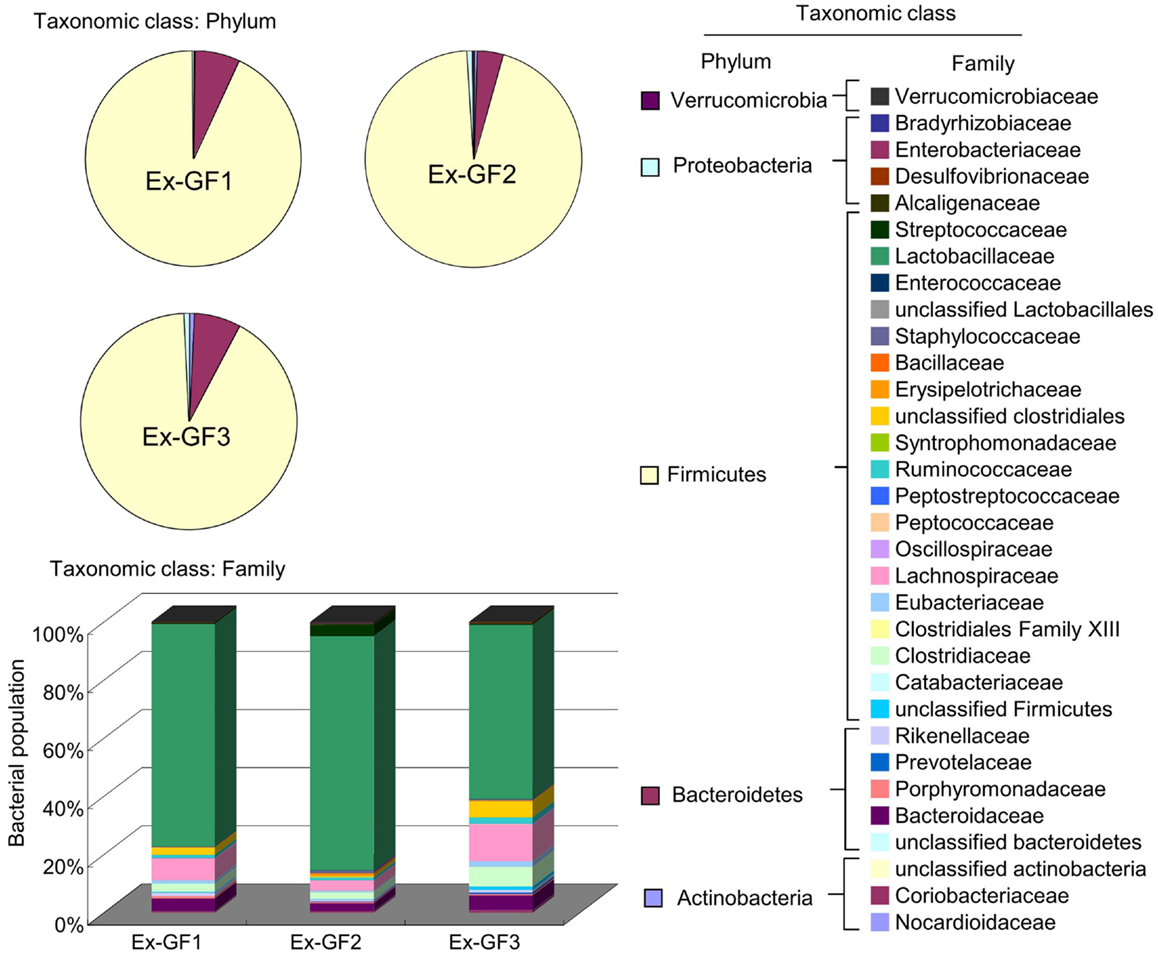
Figure 6. Aggregate microbiota composition at the phylum and family levels in the colonic content of Ex-GF mice.
Discussion
To the best of our knowledge, in a prior study by Fu et al. (2011), the highest numbers of metabolites from brain tissue to date were detected using GC-MS. In total, 118 metabolites were routinely detected in more than 80% of samples in one or more of three species (human, chimpanzee, or rhesus macaques), in at least one brain region (prefrontal or cerebellar cortex). However, only 61 metabolites were annotated. CE-TOFMS identified 196 metabolites from the cerebral metabolome, indicating that CE-TOFMS is more sensitive than GC-MS for comprehensive and large-scale metabolomic analysis in the brain.
Neurotransmitters and Several Metabolites Which are Involved in Brain Function
Concentration of dopamine (DA), a target for amphetamine stimulation of locomotor activity and stereotyped behaviors, was approximately twofold higher (p = 0.188) in GF mice than in Ex-GF mice. This is consistent with the findings that GF mice display increased motor activity and reduced anxiety compared with their Ex-CF counterparts (Heijtz et al., 2011; Neufeld et al., 2011). It is confusing that the concentration of Tyr in the cerebrum of Ex-GF mice was higher than that of GF mice, since Tyr is a precursor of DA. Tyr hydroxylase hydroxylates Tyr to L-DOPA, which was below the detection limit in this study. DOPA is further converted to DA by aromatic amino acid decarboxylase (Daubner et al., 2011). Therefore, this indicates that cerebral DA synthesis is induced by DA-producing enzymes, which are inhibited by stimulation of intestinal microbiota through the MGB axis (Figure 7A). Parkinson disease is characterized by a progressive loss of dopaminergic neurons in the substantia nigra. Since the activity level of Tyr hydroxylase is associated with Parkinson disease (Haavik and Toska, 1998), it is possible that the intestinal microbiota is involved in the development of Parkinson disease.
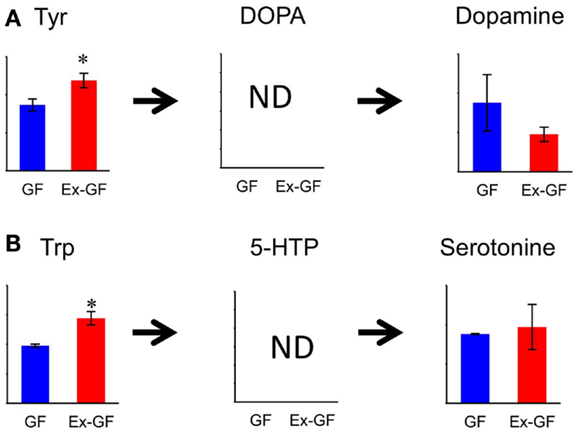
Figure 7. Relative quantitative comparisons of metabolites in the biosynthetic pathway for dopamine (A) and serotonin (B), in the cerebrum of GF mice and Ex-GF mice. Data are represented as mean ± SD. *p < 0.05, ***p < 0.001 (GF vs. Ex-GF).
We were also surprised to find that the concentrations of Trp, precursors of serotonin (5-HT), in the cerebrum of Ex-GF mice were higher than that of GF mice. This was despite the fact that cerebral 5-HT concentration did not differ between GF mice and Ex-GF mice (Figure 7B). It is believed that brain 5-HT concentration is dependent on the brain Trp level (Fernstrom, 2005). Plasma Trp are transported into the brain by a transporter, located at BBB on CNS capillary endothelial cells (Pardridge, 1998), and converted to 5-HT in neurons containing Trp hydroxylase, the rate-limiting enzyme in 5-HT synthesis (Jequier et al., 1967). Therefore, we suppose that cerebral 5-HT synthesis is regulated by Trp hydroxylase in neurons without the influence of the cerebral Trp pool and/or intestinal microbiota under the non-stressed condition and in non-neonates, as in our present study.
Several metabolites, which are known to be involved in brain function, are also influenced by normal intestinal microbiota. N-acetylaspartic acid (NAA), which is in group GF > Ex-GF, is an amino acid present in the vertebrate brain that is synthesized and stored primarily in neurons and considered a marker for neuronal health and attenuation (Simmons et al., 1991; Jenkins et al., 2000). Pipecolic acid, which is in the GF < Ex-GF group, is known as a neuromodulator or neurotransmitter with the gamma-aminobutyric acid (GABA)ergic transmission. Pipecolic acid was shown to be region- and site-specific in the CNS (Kase et al., 1980), which causes hepatic encephalopathy by inducing neuronal cell death, or apoptosis, rather than by depressing neurotransmissions (Matsumoto et al., 2003). Ser was in the GF > Ex-GF group; D-Ser is synthesized from L-Ser by serine racemase (CE-TOFMS could not separate D-Ser and L-Ser) in the human brain. It functions as an obligatory co-agonist at the glycine modulatory site of N-methyl-D-aspartate (NMDA)-selective glutamate receptors. Thus, depletion of D-Ser levels has been implicated in NMDA receptor hypofunction, which is thought to occur in schizophrenia (Yang et al., 2010). N-acetylneuraminic acid (NANA), which was in group GF > Ex-GF, increased learning and memory performance (Wang et al., 2007). These findings indicate that intestinal microbiota are closely related to brain health, disease development, attenuation, learning, and memory.
Cerebral Energy Metabolism
The concentration of several cerebral glycolysis intermediates was higher in GF mice than in Ex-GF mice (Figure 3A). This raises the following two possibilities: first, the cerebral energy consumption of Ex-GF mice is higher than that of GF mice, and second, that cerebral energy production by glycolysis in Ex-GF mice is lower than in GF mice. However, these phenomena presumably indicate an accelerated molecular flux of the glycolysis pathway to compensate for ATP and NADH depletion in the cerebrum of Ex-GF mice. This assumption is based on our finding that the cerebral ATP (Ex-GF/GF ratio = 0.91) and NADH (Ex-GF/GF ratio = 0.65) levels were lower in Ex-GF mice than GF mice (Figure 3B) and there was no difference in cerebral hexokinase and phosphofructokinase gene expression between mice (Figure 3C). In fact, levels of acetyl CoA, which is produced by oxidation from pyruvic acid, was similar in the cerebrum of GF and Ex-GF mice. Furthermore, a significant difference in lactic acid was not observed, suggesting that the normal intestinal microbiota do not influence anaerobic respiration and the compensated molecular components (ATP or NADH) of the glycolysis pathway in Ex-GF mice was then transferred into the TCA cycle for further aerobic respiration via acetyl CoA in the cerebral mitochondria. To support the presence of an active TCA cycle, we also report changes in NADH and NAD+. The ratio between NADH and NAD+ affects mitochondrial TCA cycle activity (LaNoue et al., 1972). NADH and NADH/NAD+ ratio in Ex-GF mice were reduced to 65 and 92% of those in GF mice, respectively. Since both values are known to increase when the TCA cycle is blocked (Sugiura et al., 2011), the observed reductions in NADH and NADH/NAD+ ratio suggest normal intestinal microbiota induces active oxidative phosphorylation via the TCA cycle. From these findings, we suggest that, in the cerebrum, Ex-GF mice consume energy and accelerate energy production through glycolysis and TCA cycle more highly than GF mice. In other word, the cerebrum of Ex-GF mice is more active than that of GF mice.
Bacterial Potential Influence on Cerebrum Metabolic Changes
Of 38 metabolites influenced by intestinal microbiota, 12 metabolites detected from the cerebrum but not cardiac plasma, are synthesized independently in the cerebrum and are influenced by MGB axis (Figure 5, metabolites shown in blue). Sixteen metabolites whose Ex-GF/GF ratio differed between the cerebrum and cardiac plasma are influenced by MGB axis and/or BBB (Figure 5, metabolites marked by #). The fact that NANA is in this group is in conflict existing literature. In animal infant models, exogenous administration of NANA increased learning and memory performance as well as the concentration of NANA in the frontal cortex (Carlson and House, 1986; Wang et al., 2007). However, in the present study, NANA produced by intestinal microbiota was not transported to the blood. Therefore, it is doubtful whether dietary NANA influences the brain and behavior directly. We suppose that improvement of learning and memory performance by oral administration of NANA depends on the stimulation of intestinal microbiota, which is altered by supplements containing NANA through the MBG axis. Cerebral GABA concentration did not differ between GF mice and Ex-GF mice, although remarkable differences were observed in GABA cardiac plasma concentrations between GF mice and Ex-GF mice (Figure 8). This indicates that GABA is controlled by BBB and tightly regulated in the cerebrum. This questions the suitability of oral GABA supplementation studies to provide GABA to the brain.
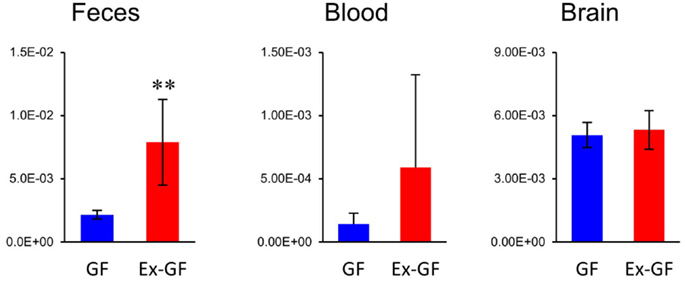
Figure 8. Relative quantitative comparisons of GABA in colonic lumen content, cardiac plasma, and the cerebrum. Data are represented as mean ± SD. **p < 0.01.
Differences in RSD values between GF mice and Ex-GF mice (Figure 4) implies that individual differences in the metabolites found in the colonic content and cardiac plasma of Ex-GF mice is influenced by the diversity of intestinal microbiota (Matsumoto et al., 2012). Furthermore, these findings indicate that many metabolites produced by intestinal bacteria are filtrated and transported to brain via the blood through the BBB. However, six cerebral metabolites (Figure 5, metabolites shown in red) had similar Ex-GF/GF ratios between colonic luminal content, cardiac plasma, and the cerebrum. This may suggest that these metabolites may be transported from the colonic lumen to the cerebrum in the bloodstream without filtration by BBB. Further studies are required to fully understand how these metabolites are transported from the gut lumen to blood and from blood to the brain. Furthermore, the relationship between intestinal bacterial composition and brain metabolome is an area that clearly merits further study in the future.
These discussions center on a comparison between general knowledge and the data obtained in the present study. However, the neuronal effects of almost detected metabolites in the cerebrum are unclear. In future studies, researchers in various fields may find evidence that some of the newly identified metabolites are important for neuronal activities and diseases. Indeed, there is a possibility of detecting site-specific metabolome profiles when using CE-TOFMS. Further studies are required to analyze other parts of the brain.
In this study, many metabolites including neurotransmitters showed differences in the concentrations between GF mice and Ex-GF mice, indicating that normal intestinal microbiota closely connected with brain health and disease, development, attenuation, learning, memory, and behavior. We propose that through proper control of intestinal microbiota, cerebral nerve disorders may be prevented or alleviated in the future.
Conflict of Interest Statement
This work was supported by the BRAIN, Japan. This work was also funded by Kyodo Milk Industry Co. Ltd and Human Metabolome Technologies, Inc. The funders had no role in study design, data collection and analysis, decision to publish, or preparation of the manuscript. Mitsuharu Matsumoto and Emiko Sawaki are employes of Kyodo Milk Industry Co. Ltd. and had a role in study design, data analysis, preparation of the manuscript, and decision to publish the manuscript. Takushi Ooga is employe of Human Metabolome Technologies, Inc. and had a role in data analysis and decision to publish the manuscript. All of the other authors declare that they have no conflict of interest.
Author Contributions
Mitsuharu Matsumoto wrote the paper. Mitsuharu Matsumoto, Yasuhiro Koga, and Yoshimi Benno designed this study. Yuji Aiba performed animal experiments. Takushi Ooga analyzed the metabolome. Mitsuharu Matsumoto, Ryoko Kibe, Takushi Ooga, and Emiko Sawaki analyzed the data, discussed findings, and helped draft the manuscript.
Acknowledgments
This study was supported by the Program for Promotion of Basic and Applied Researches for Innovations in Bio-oriented Industry by the Bio-oriented Technology Research Advancement Institution (BRAIN), Japan. We thank Dr. Ayano Yamashita for analyses of gene expression of cerebral glycolytic metabolism.
Abbreviations
BBB, blood-brain barrier; CE-TOFMS, capillary electrophoresis with time-of-flight mass spectrometry; CNS, central nervous system; DA, dopamine; Ex-GF, ex-germ-free; GF, germ-free; MGB axis, microbiota-gut-brain axis; RSD, relative standard deviations.
References
Backhed, F., Ley, R. E., Sonnenburg, J. L., Peterson, D. A., and Gordon, J. I. (2005). Host-bacterial mutualism in the human intestine. Science 307, 1915–1920.
Camara, R. J., Ziegler, R., Begre, S., Schoepfer, A. M., and von Kanel, R. (2009). The role of psychological stress in inflammatory bowel disease: quality assessment of methods of 18 prospective studies and suggestions for future research. Digestion 80, 129–139.
Carlson, S. E., and House, S. G. (1986). Oral and intraperitoneal administration of N-acetylneuraminic acid: effect on rat cerebral and cerebellar N-acetylneuraminic acid. J. Nutr. 116, 881–886.
Cryan, J. F., and Dinan, T. G. (2012). Mind-altering microorganisms: the impact of the gut microbiota on brain and behaviour. Nat. Rev. Neurosci. 13, 701–712.
Daubner, S. C., Le, T., and Wang, S. (2011). Tyrosine hydroxylase and regulation of dopamine synthesis. Arch. Biochem. Biophys. 508, 1–12.
Fu, X., Giavalisco, P., Liu, X., Catchpole, G., Fu, N., Ning, Z. B., et al. (2011). Rapid metabolic evolution in human prefrontal cortex. Proc. Natl. Acad. Sci. U.S.A. 108, 6181–6186.
Haavik, J., and Toska, K. (1998). Tyrosine hydroxylase and Parkinson’s disease. Mol. Neurobiol. 16, 285–309.
Heijtz, R. D., Wang, S., Anuar, F., Qian, Y., Bjorkholm, B., Samuelsson, A., et al. (2011). Normal gut microbiota modulates brain development and behavior. Proc. Natl. Acad. Sci. U.S.A. 108, 3047–3052.
Jenkins, B. G., Klivenyi, P., Kustermann, E., Andreassen, O. A., Ferrante, R. J., Rosen, B. R., et al. (2000). Nonlinear decrease over time in N-acetyl aspartate levels in the absence of neuronal loss and increases in glutamine and glucose in transgenic Huntington’s disease mice. J. Neurochem. 74, 2108–2119.
Jequier, E., Lovenberg, W., and Sjoerdsma, A. (1967). Tryptophan hydroxylase inhibition: the mechanism by which p-chlorophenylalanine depletes rat brain serotonin. Mol. Pharmacol. 3, 274–278.
Kase, Y., Takahama, K., Hashimoto, T., Kaisaku, J., Okano, Y., and Miyata, T. (1980). Electrophoretic study of pipecolic acid, a biogenic imino acid, in the mammalian brain. Brain Res. 193, 608–613.
LaNoue, K. F., Bryla, J., and Williamson, J. R. (1972). Feedback interactions in the control of citric acid cycle activity in rat heart mitochondria. J. Biol. Chem. 247, 667–679.
Matsumoto, M., Kibe, R., Ooga, T., Aiba, Y., Kurihara, S., Sawaki, E., et al. (2012). Impact of intestinal microbiota on intestinal luminal metabolome. Sci. Rep. 2, 233.
Matsumoto, M., Kurihara, S., Kibe, R., Ashida, H., and Benno, Y. (2011). Longevity in mice is promoted by probiotic-induced suppression of colonic senescence dependent on upregulation of gut bacterial polyamine production. PLoS ONE 6:e23652. doi:10.1371/journal.pone.0023652
Matsumoto, S., Yamamoto, S., Sai, K., Maruo, K., Adachi, M., Saitoh, M., et al. (2003). Pipecolic acid induces apoptosis in neuronal cells. Brain Res. 980, 179–184.
Monton, M. R., and Soga, T. (2007). Metabolome analysis by capillary electrophoresis-mass spectrometry. J. Chromatogr. A 1168, 237–246; discussion 236.
Neufeld, K. M., Kang, N., Bienenstock, J., and Foster, J. A. (2011). Reduced anxiety-like behavior and central neurochemical change in germ-free mice. Neurogastroenterol. Motil. 23, 255–264, e119.
Ooga, T., Sato, H., Nagashima, A., Sasaki, K., Tomita, M., Soga, T., et al. (2011). Metabolomic anatomy of an animal model revealing homeostatic imbalances in dyslipidemia. Mol. Biosyst. 7, 1217–1223.
Pardridge, W. M. (1998). Blood-brain barrier carrier-mediated transport and brain metabolism of amino acids. Neurochem. Res. 23, 635–644.
Rhee, S. H., Pothoulakis, C., and Mayer, E. A. (2009). Principles and clinical implications of the brain-gut-enteric microbiota axis. Nat. Rev. Gastroenterol. Hepatol. 6, 306–314.
Simmons, M. L., Frondoza, C. G., and Coyle, J. T. (1991). Immunocytochemical localization of N-acetyl-aspartate with monoclonal antibodies. Neuroscience 45, 37–45.
Sudo, N., Chida, Y., Aiba, Y., Sonoda, J., Oyama, N., Yu, X. N., et al. (2004). Postnatal microbial colonization programs the hypothalamic-pituitary-adrenal system for stress response in mice. J. Physiol. (Lond.) 558, 263–275.
Sugiura, Y., Taguchi, R., and Setou, M. (2011). Visualization of spatiotemporal energy dynamics of hippocampal neurons by mass spectrometry during a kainate-induced seizure. PLoS ONE 6:e17952. doi:10.1371/journal.pone.0017952
Turnbaugh, P. J., Ley, R. E., Mahowald, M. A., Magrini, V., Mardis, E. R., and Gordon, J. I. (2006). An obesity-associated gut microbiome with increased capacity for energy harvest. Nature 444, 1027–1031.
Wang, B., Yu, B., Karim, M., Hu, H., Sun, Y., McGreevy, P., et al. (2007). Dietary sialic acid supplementation improves learning and memory in piglets. Am. J. Clin. Nutr. 85, 561–569.
Yang, J. H., Wada, A., Yoshida, K., Miyoshi, Y., Sayano, T., Esaki, K., et al. (2010). Brain-specific Phgdh deletion reveals a pivotal role for L-serine biosynthesis in controlling the level of D-serine, an N-methyl-D-aspartate receptor co-agonist, in adult brain. J. Biol. Chem. 285, 41380–41390.
Appendix

Table A1. Anionic metabolites detected from cerebrum in GF mice and Ex-GF mice.
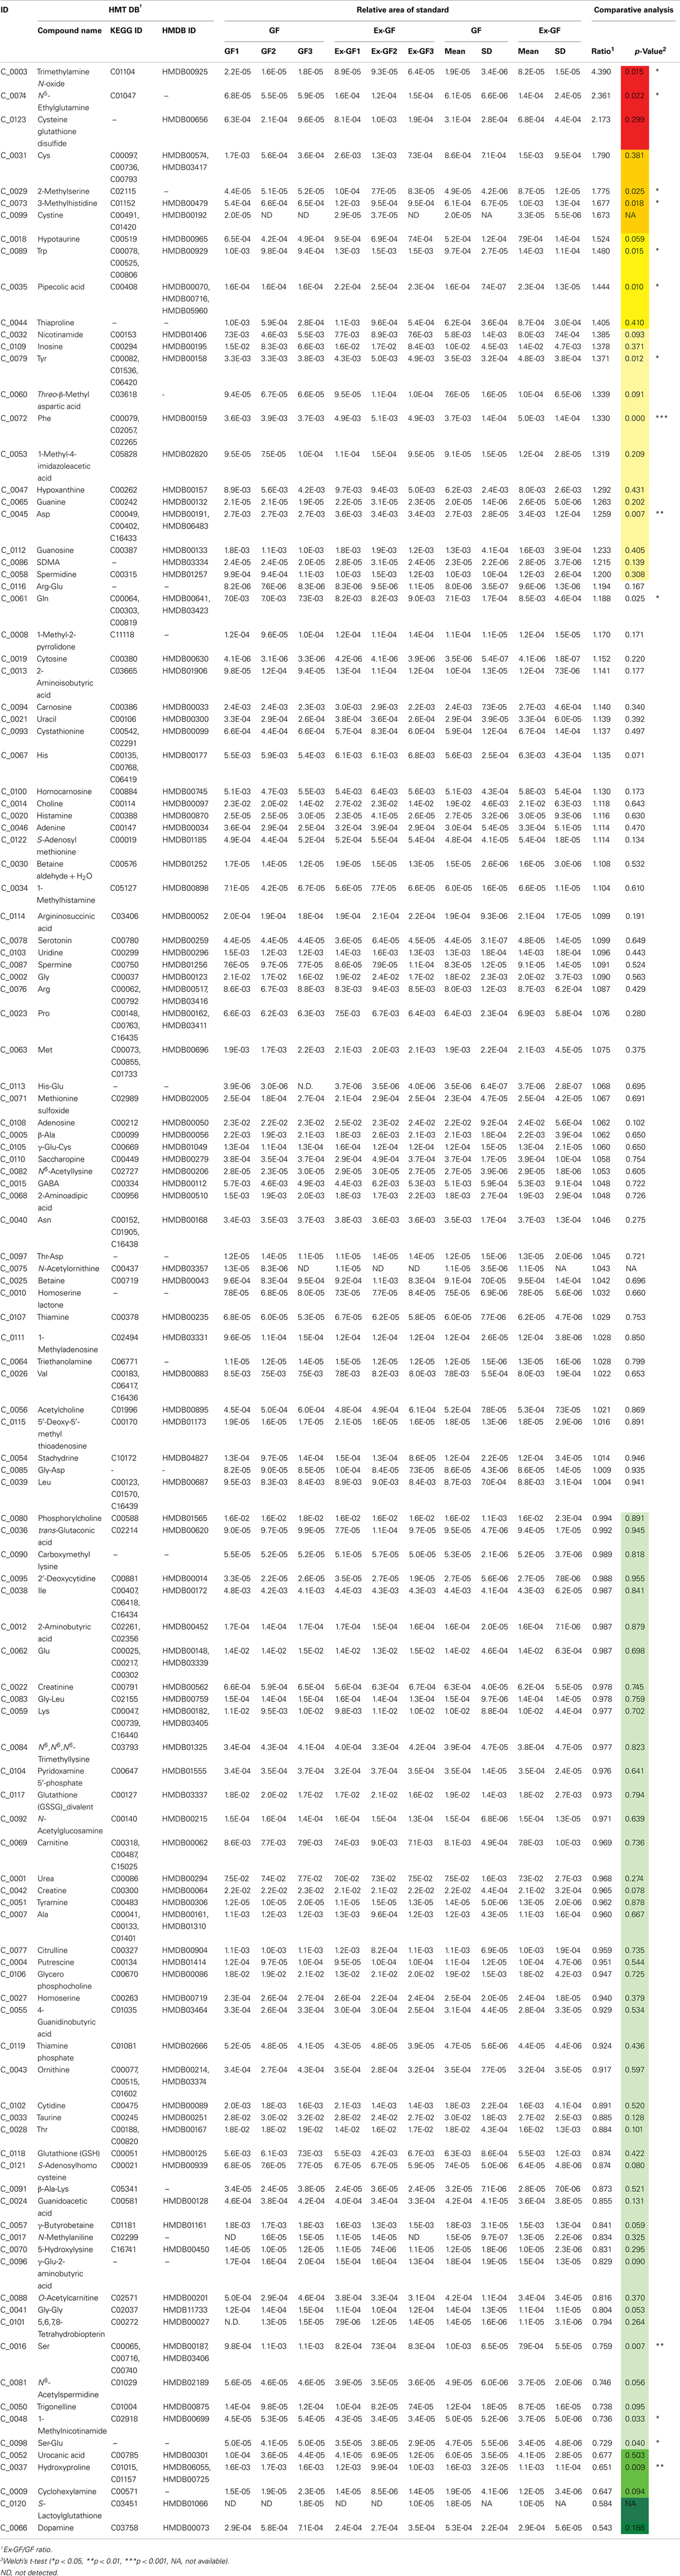
Table A2. Cationic metabolites detected from cerebrum in GF mice and Ex-GF mice.
Keywords: intestinal microbiota, cerebrum, metabolome, gut-brain axis, neurotransmitter
Citation: Matsumoto M, Kibe R, Ooga T, Aiba Y, Sawaki E, Koga Y and Benno Y (2013) Cerebral low-molecular metabolites influenced by intestinal microbiota: a pilot study. Front. Syst. Neurosci. 7:9. doi: 10.3389/fnsys.2013.00009
Received: 17 January 2013; Accepted: 01 April 2013;
Published online: 23 April 2013.
Edited by:
Federico Bermudez-Rattoni, Universidad Nacional Autónoma de México, MexicoReviewed by:
Takashi Yamamoto, Osaka University Graduate School of Dentistry, JapanGustavo Pacheco-Lopez, Universidad Autonoma Metropolitana, Mexico
Copyright: © 2013 Matsumoto, Kibe, Ooga, Aiba, Sawaki, Koga and Benno. This is an open-access article distributed under the terms of the Creative Commons Attribution License, which permits use, distribution and reproduction in other forums, provided the original authors and source are credited and subject to any copyright notices concerning any third-party graphics etc.
*Correspondence: Mitsuharu Matsumoto, Dairy Science and Technology Institute, Kyodo Milk Industry Co. Ltd., 20-1 Hirai, Hinode-machi, Tokyo 190-0182, Japan. e-mail: m-matumoto@meito.co.jp