Diversity of Evoked Astrocyte Ca2+ Dynamics Quantified through Experimental Measurements and Mathematical Modeling
 Marsa Taheri
 Gregory Handy
 Alla Borisyuk
 John A. White
- 1Department of Bioengineering, University of Utah, Salt Lake City, UT, United States
- 2Department of Mathematics, University of Utah, Salt Lake City, UT, United States
- 3Department of Biomedical Engineering, Boston University, Boston, MA, United States
Astrocytes are a major cell type in the mammalian brain. They are not electrically excitable, but generate prominent Ca2+ signals related to a wide variety of critical functions. The mechanisms driving these Ca2+ events remain incompletely understood. In this study, we integrate Ca2+ imaging, quantitative data analysis, and mechanistic computational modeling to study the spatial and temporal heterogeneity of cortical astrocyte Ca2+ transients evoked by focal application of ATP in mouse brain slices. Based on experimental results, we tune a single-compartment mathematical model of IP3-dependent Ca2+ responses in astrocytes and use that model to study response heterogeneity. Using information from the experimental data and the underlying bifurcation structure of our mathematical model, we categorize all astrocyte Ca2+ responses into four general types based on their temporal characteristics: Single-Peak, Multi-Peak, Plateau, and Long-Lasting responses. We find that the distribution of experimentally-recorded response types depends on the location within an astrocyte, with somatic responses dominated by Single-Peak (SP) responses and large and small processes generating more Multi-Peak responses. On the other hand, response kinetics differ more between cells and trials than with location within a given astrocyte. We use the computational model to elucidate possible sources of Ca2+ response variability: (1) temporal dynamics of IP3, and (2) relative flux rates through Ca2+ channels and pumps. Our model also predicts the effects of blocking Ca2+ channels/pumps; for example, blocking store-operated Ca2+ (SOC) channels in the model eliminates Plateau and Long-Lasting responses (consistent with previous experimental observations). Finally, we propose that observed differences in response type distributions between astrocyte somas and processes can be attributed to systematic differences in IP3 rise durations and Ca2+ flux rates.
Introduction
Astrocytes are a major glial cell type (Verkhratsky et al., 2012b), playing many key roles in the mammalian brain. Astrocytes are involved in the uptake of neurotransmitters (e.g., glutamate and GABA; Anderson and Swanson, 2000; Zhou and Danbolt, 2013); the release of neuroactive compounds including glutamate, D-Serine, and adenosine 5′-triphosphate (ATP) (Bezzi et al., 1998; Anderson and Swanson, 2000; Haydon, 2001; Newman, 2003; Liu et al., 2004; Wang et al., 2013); regulation of blood flow (Verkhratsky et al., 2012b; Seidel et al., 2015); and K+ buffering (Wallraf et al., 2006; Wang et al., 2013; Larsen et al., 2014). Many of these functions are regulated in a Ca2+-dependent manner (Kang et al., 1998; Anderson and Swanson, 2000; Haydon, 2001; Wang et al., 2012, 2013; Khakh and Sofroniew, 2015), though the exact mechanisms are still being investigated.
Astrocytes express a variety of functional receptors, mostly metabotropic G-protein-coupled receptors (GPCRs), enabling major communication avenues between neurons and astrocytes. Activation of GPCRs leads to increases in intracellular Ca2+ in astrocytes, primarily through the release of inositol (1, 4, 5)-trisphosphate (IP3) into the cytosol, which subsequently opens intracellular Ca2+ stores (Haydon, 2001). Ca2+ increase, in turn, has many effects including, directly or indirectly, driving other transporters and exchangers (e.g., the Na+/Ca2+ exchanger and Na+/K+ ATPase pump) (Anderson and Swanson, 2000; Wang et al., 2012) and, possibly, releasing biologically active compounds called gliotransmitters (Bezzi et al., 1998; Haydon, 2001; Liu et al., 2004; Wang et al., 2013). Furthermore, astrocyte Ca2+ elevations can propagate through multiple astrocyte subcompartments or multiple astrocytes (Haydon, 2001), enabling inter- and intra-cellular communication. While Ca2+ activity is a major method of astrocyte signaling, there is little consensus on its downstream effects and how it may encode information (Pasti et al., 1995; Nedergaard and Verkhratsky, 2012; Evans and Blackwell, 2015). Moreover, the extent of Ca2+ response heterogeneity in astrocytes is not well-characterized, though temporal and spatial heterogeneity of Ca2+ responses have been addressed by some groups (Verkhratsky and Kettenmann, 1996; Xie et al., 2012; Bonder and McCarthy, 2014; Tang et al., 2015; Jiang et al., 2016).
Computational models of IP3-mediated Ca2+ responses in astrocytes have been used to investigate Ca2+ oscillations (Politi et al., 2006; Ullah et al., 2006; Lavrentovich and Hemkin, 2008; De Pittà et al., 2009; Skupin et al., 2010), influences of astrocytes on neuronal activity (Di Garbo et al., 2007), and the role of intrinsic and extrinsic stochastic events in creating Ca2+ response heterogeneity (Toivari et al., 2011). However, many such Ca2+ models are closed-cell: they disregard fluctuations in total intracellular Ca2+ levels resulting from the activity of plasma membrane channels and pumps. Others models were created based on data from either cell types other than astrocytes or from cultured astrocytes (which are thought to be astrocyte-like cells and not represent in vivo astrocytes, Cahoy et al., 2008). Moreover, many models are based on experiments in which agonists were bath-applied to cultured astrocytes, which is far from a physiological stimulation.
Here, we present an integrated, experimental and computational study of ATP-evoked Ca2+ transients in astrocytes, with several novel aspects. First, rather than fitting data from bath application of ATP, we use brief focal ATP pulses to astrocytes in acute brain slices that better mimic physiological conditions (Pasti et al., 1995). Second, we use an open-cell mathematical model, accounting for the exchange of Ca2+ between the cell and the extracellular space (ECS), to fit the evoked responses. This approach is more realistic (Dupont and Croisier, 2010) and leads to important modeling results. Third, we examine astrocyte response heterogeneity across trials, cells, and subcompartments (i.e., soma and processes) within each cell, and propose a new classification of responses into four types directly motivated by our bifurcation analysis of our mathematical model (Handy et al., 2017): Single-Peak, Multi-Peak, Plateau, and Long-Lasting responses. Experimentally, we find that SP Ca2+ response kinetics do not vary consistently between different subcompartments of one astrocyte, but rather vary between cells and trials. In contrast, the frequency of occurrences of observed Ca2+ response types varies between astrocyte subcompartments. Using our mathematical model, we explore underlying mechanisms of Ca2+ responses and their heterogeneity by varying IP3 temporal dynamics and Ca2+ channel/pump flux rates. We predict the IP3 time course and composition of flux rates that can reproduce the response type distributions observed experimentally for each astrocyte subcompartment, without requiring feedback-induced oscillations in the IP3 waveform (Politi et al., 2006). Our model provides a tool to study mechanisms and generate predictions that can be applied to other experimental data.
Materials and Methods
Ca2+ Imaging
All procedures were in accordance with the NIH Guide for the Care and Use of Laboratory Animals and approved by the University of Utah Institutional Animal Care and Use Committee. The data were obtained from targeted reporter mice (PC::G5-tdT) crossed with the GFAP-CreER mouse line, and thus express the GCaMP5G genetically-encoded Ca2+ indicator in astrocytes (Gee et al., 2014). Cre recombination in GFAP-CreER crosses was induced by a single intraperitoneal injection of tamoxifen in peanut oil (225 mg/kg). All mice were female and were 5–8 weeks old. To extract the brain, the mice were anesthetized in a closed chamber with isoflurane (1.5%) and decapitated. The brains were then rapidly removed and immersed in ice-cold cutting solution that contained 230 mM sucrose, 1 mM KCl, 0.5 mM CaCl2, 10 mM MgSO4, 26 mM NaHCO3, 1.25 mM NaH2PO4, 0.04 mM Na-Ascorbate, and 10 mM glucose (pH = 7.2–7.4). Coronal slices (400 μm-thick) were cut using a VT1200 Vibratome (Leica Microsystems, Wetzlar, Germany) and transferred to oxygenated artificial cerebrospinal fluid (aCSF) that contained 124 mM NaCl, 2.5 mM KCl, 2 mM CaCl2, 2 mM MgSO4, 26 mM NaHCO3, 1.25 mM NaH2PO4, 0.004 mM Na-Ascorbate, and 10 mM glucose (pH = 7.27.4; osmolarity = 310 mOsm). Slices were allowed to recover in oxygenated aCSF at room temperature for 1 h before experiments. During the recordings, the slices were placed in a perfusion chamber and superfused with aCSF gassed with 95% O2 and 5% CO2 at room temperature for the duration of the experiment. To evoke Ca2+ responses, 500 μM ATP (Tocris Bioscience, Bristol, UK, catalog no. 3245; similar concentration used by Otsu et al., 2015; Kim et al., 2016) dissolved in aCSF was delivered locally via a glass pipette (10 psi; ranging between 16 and 250 ms with exact values specified in each section or figure) using a Picospritzer III (Parker Instrumentation, Chicago, IL) (see Figure 1A). The pipette also included 5 μM Alexa Fluor 594 so that it could be visualized more readily.
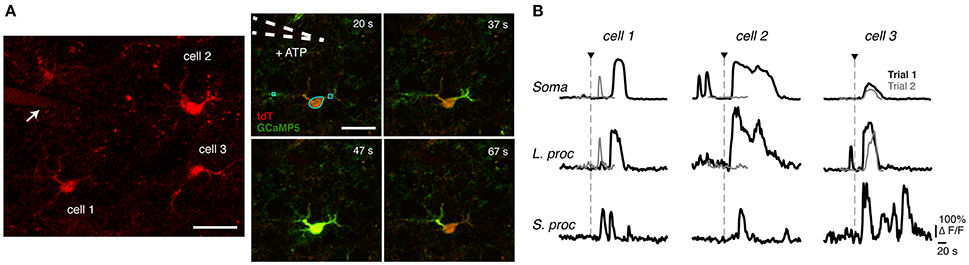
Figure 1. Astrocyte Ca2+ imaging and observed response variability. (A) (Left) A 12 μm z-stack (centered around the imaging plane) of tdTomato indicating the location of three recorded astrocytes relative to the pipette (shown with arrow), which is also visible since it contains Alexa Fluor 594. The cell numbers correspond to those in (B). (Right) Time series of intracellular Ca2+ responses to focal application of ATP (application duration, 63 ms) from a glass pipette (white dotted line) in a mouse acute brain slice. Examples of selected ROIs are shown for the soma, large processes, and small processes (cyan lines in the 20 s frame). These ROIs correspond to the traces of cell 1, trial 1 in (B). Scale bars, 20 μm. (B) Example traces of simultaneous responses from different subcompartments of three cells (same cells shown in A), in two different ATP application trials.
Two-photon imaging was performed using a Prairie two-photon microscope with a mode-locked Ti:Sapphire laser source emitting 140 fs pulses at an 80 MHz repetition rate with a wavelength adjustable from 690 to 1,040 nm (Chameleon Ultra I; Coherent, Santa Clara, CA). We used laser emission wavelengths of 920 nm to excite GCaMP5G or 1,040 nm to excite tdTomato. A 20 × 0.95 NA water-immersion objective was used for all the Ca2+ images (Olympus, Tokyo, Japan). Astrocyte Ca2+ signaling was recorded at a frame rate of 1 Hz. All imaging was done on cortical astrocytes in the primary somatosensory cortex.
Data Analysis
The two-photon images were processed and analyzed using custom-written MATLAB (2014a, 2015b; MathWorks, Natick, MA) scripts. Each time-lapse image was first processed with a 3 × 3 median filter (using MATLAB's medfilt2 command). For each pixel, the median fluorescence of 20 frames preceding the agonist application was used to calculate the baseline fluorescence (F0). Using this baseline, the percent change in fluorescence (100 * ΔF/F0) of each pixel was calculated throughout the time-lapse image. Upon displaying the maximum ΔF/F0 projections, ROIs were manually selected for the soma, large processes, and small processes. Large processes (also known as branches, defined in Khakh and Sofroniew, 2015) were chosen at a distance of ~3–7 μm from the soma perimeter (surrounded with a 2 × 2 μm box). Small processes (also known as branchlets, defined in Khakh and Sofroniew, 2015) were chosen at about 12–20 μm from the soma perimeter (1 × 1 μm box). Finally, the ΔF/F0 trace for each selected ROI was filtered with an order-3 one-dimensional median filter (using medfilt1 in MATLAB). The Ca2+ response peaks were found using the findpeaks command in MATLAB and were defined as a ΔF/F0 exceeding n standard deviations above the baseline value (where n was 7 for the soma and 6 for the processes) and having a value of at least 40%. Only those ROI traces were included in our analyses that responded to the agonist and that had minimal or no spontaneous activity before the agonist application, in order to avoid mistaking spontaneous Ca2+ activity for evoked activity.
To calculate Ca2+ response durations, the trough before (Trough1) the first response peak and after (Trough2) the last peak were automatically detected. Trough1 (or Trough2) was defined as the last (or first) data point, before (or after) the peak that had a value <3.3 standard deviations above the baseline. The time between the two troughs determined the duration of the experimental Ca2+ response. Due to the absence of noise in the mathematical model (described below in section Mathematical Model), simulated responses were determined as the first or last points where the Ca2+ concentration reached a value >40% of the baseline. In Figure 2A, the circles on the traces mark the first and last troughs found using this algorithm for both experimentally recorded and simulated traces. The rise and decay times were calculated from the 10–90% points of the rising and falling phases, respectively, of the Ca2+ responses.
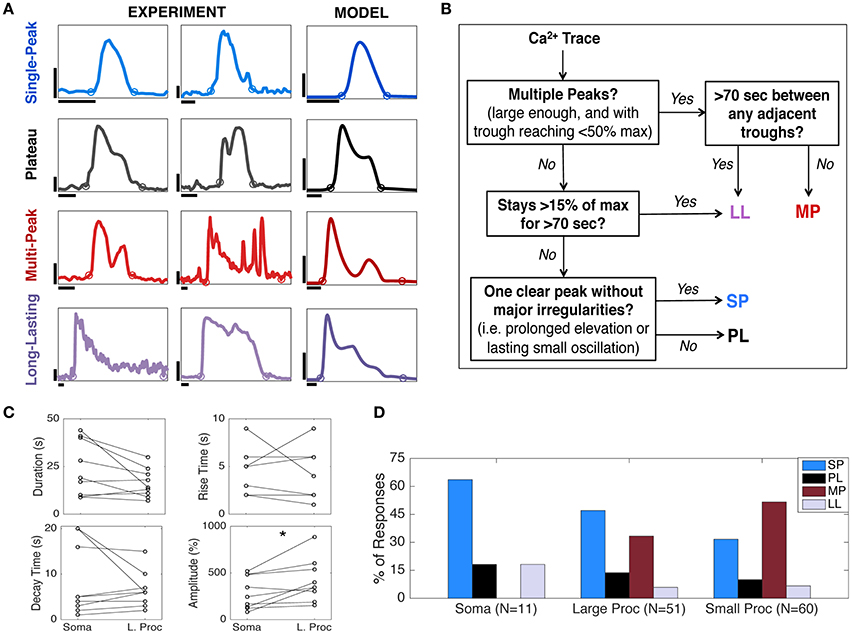
Figure 2. Astrocyte Ca2+ response types and kinetics. (A) Four categories of astrocyte Ca2+ responses observed experimentally (first and second columns) and in the model (third column). Experimental data show astrocyte Ca2+ responses to a focal application of ATP. Each of the two experimental columns contain one example of each response type to show the variability within each response category. The model traces are chosen to reproduce responses similar to the first column. For parameter values, see Figure 4A. The circles for each trace show the response onset and offset (calculation described in section Materials and Methods). Horizontal scale bars, 10 s; vertical scale bars, 100% ΔF/F for the experiment and 0.5 μM [Ca2+]cyt for the model. (B) Flow chart summarizing the algorithm for Ca2+ response type categorization (details in section Materials and Methods). (C) The rise times, decay times, durations, and amplitudes of SP responses in the soma and a large process of the same astrocyte (N = 9, stimulus durations 16–250 ms), paired with one another. Only amplitude results were significantly different (*p < 0.05; see text), suggesting that there is more variability in SP kinetics between cells and trials than between astrocyte subcompartments. (D) The distribution of observed Ca2+ response types varies between the somas, large processes, and small processes (N = 3 mice, 3 trials per mouse, 3–5 cells per trial, up to 10 ROIs per cell; only responsive cells with minimal spontaneous activity were included here; stimulus durations 30–63 ms).
To calculate the experimental normalized average Ca2+ trace (Figure 3A), only those SP Ca2+ responses were selected that had a short-duration (<25 s) and were from ROIs which had not responded to an agonist application for at least 3 min. The ΔF/F0 was then normalized such that the maximum peak value for each trace was 1 and the peaks of all traces were aligned (hence, removing any variability in latency from the stimulus time). Finally, the average and standard deviation of the traces were calculated. Similar to ΔF/F0 traces, the model Ca2+ trace (Figure 3B) was normalized and its baseline adjusted such that the trace has a range of 0–1. We used the same duration calculation method for the normalized traces of the experiments and model: the response onset and offset are the first and last points, respectively, that are >20% the baseline value.
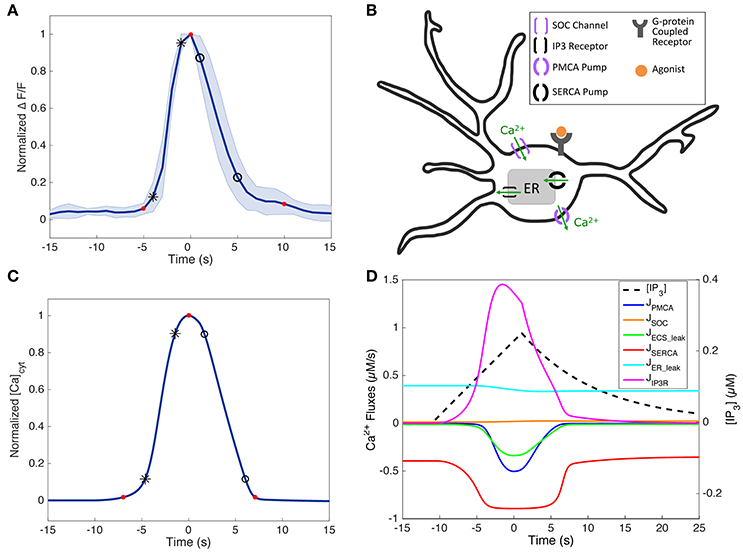
Figure 3. Short-duration SP Ca2+ traces in experiments and the model. (A) Normalized average short-duration (< 25 s) SP Ca2+ traces of the soma (N = 8, mean ± standard deviation, stimulus durations 16–250 ms). The response amplitude and latency were ignored by normalizing the amplitudes and aligning the response peaks. (B) Simplified schematic of an astrocyte and its major Ca2+ components incorporated in the model (except for GPCR dynamics, which is replaced with IP3 as the input). Additionally, leak terms between the cytosol and extracellular space (JECS_add) and between the cytosol and the ER (JER_leak) are included in the model. Arrows show the direction of Ca2+ flux. The model has only one compartment, tuned to represent data from different astrocyte subcompartments (see section Variability between Astrocyte Subcompartments: Model). (C) Normalized SP response in the model, fitted to match the experimental trace in (A). IP3 parameters (A, drise, rrise, ddec): 0.25, 12, 0.002, 40. The experimental and model Ca2+ rise times (calculated between the black star markers), decay times (between the black circles), and durations (between the first and last red circles) are as follows: 2.90, 3.90, and 14.7 s (for experiments), and 3.19, 4.38, and 14.05 s (for the model). (D) Simulated IP3 dynamics and Ca2+ fluxes corresponding to (C).
Mathematical Model
Because fluorescent signals from GCaMP5G in this animal model are both linear and very fast compared with evoked Ca2+ transients (Gee et al., 2014), model results are directly comparable with experimental data, particularly if we compare them independent of response amplitude and latency.
For this comparison, we model astrocyte Ca2+ activity in a single compartment, which may represent any one functional subcompartment of an astrocyte. Its parameters can be adjusted to a specific dataset (e.g., the soma or large processes, as we do in Figure 7A).
Figure 3B shows a simplified schematic of the Ca2+ activity components in our model: activation of a metabotropic G-protein-coupled receptor (GPCR; e.g., P2Y receptors, commonly found on astrocytes) leads to IP3 production (We ignore the P2X ionotropic receptor, not found in cortical astrocytes from mice). IP3 then binds to IP3 receptors (IP3Rs) on the endoplasmic reticulum (ER) membrane, which consequently opens IP3R channels and allows Ca2+ to exit the ER and enter the cytosol. When there is significant depletion of Ca2+ from the ER, store-operated Ca2+ (SOC) channels are activated, and allow for additional Ca2+ to flow from the ECS into the cytosol. Sustained, elevated levels of cytosolic Ca2+ inactivate IP3Rs, and activate sarco/endoplasmic reticulum Ca2+ ATPase (SERCA) pumps and plasma membrane Ca2+ ATPase (PMCA) pumps, which then transfer the cytosolic Ca2+ back to the ER and ECS, respectively. After the degradation of IP3, these pumps and channels return the system to steady state.
Unlike many previous studies on astrocyte Ca2+ dynamics (Ullah et al., 2006; De Pittà et al., 2009), our model is an open-cell model in which the total intracellular Ca2+ levels can change. Additionally, in this work, we directly control the time course of IP3 dynamics, treating IP3 as the effective representation of the agonist influence on the cell. This allows us to make predictions as to how the IP3 time course affects the resulting Ca2+ responses. The general shape of IP3 time course is based on previous experimental and modeling work (described below).
Our resulting model consists of a system of three differential equations. Two of those equations model the changes in cytosolic Ca2+ concentration, c, and total intracellular Ca2+ concentration, ctot, as follows:
and the concentration in the ER is given by cER = (ctot – c)γ. We will also denote IP3 concentration as p. The Ji's in these equations represent fluxes through the pumps and channels that are shown schematically in Figure 3B. JIP3R represents the flux from the ER to the cytosol through the IP3R channel, JER_leak is the leak between the ER and the cytosol, JSERCA captures the flux due to the SERCA pump, JECS_add is the leak between the ECS and the cytosol as well as additional plasma membrane fluxes not explicitly modeled, JPMCA represents the PMCA pump, and JSOC is the flux through the SOC channels. Further, γ is ratio of the volume of the cytosol to the volume of the ER, and δ is the ratio of membrane transport to ER transport. The remaining differential equation tracks the deactivation rate of the IP3R,
where h∞ is the equilibrium binding probability and τh is the time constant. We define these quantities more specifically in the following subsections.
IP3 Receptor Model
We use the Li-Rinzel IP3 receptor (IP3R) model to capture the Ca2+ dynamics through the IP3R channel (Li and Rinzel, 1996). Their model accounts for three binding sites on the receptor: a binding site for activating Ca2+, n(c), deactivating Ca2+, h(c,p), and IP3, m(p). They take the fast variables, the binding of activating Ca2+ and IP3, to be in quasi-steady state, and they model the slow variable, the binding of deactivating Ca2+, explicitly. When open, the flux through the channel is determined by the concentration gradient of Ca2+ between the cytosol and the ER. In total, the equations governing this model are
where
and the dynamics of h are governed by Equation (3).
The values for the constants can be found in Table 1. This model from Li and Rinzel is a simplification of the one by De Young and Keizer (1992), which was based on data collected on Purkinje neurons. While the structure of the IP3 receptor found in astrocytes is most likely very similar to ones found here, the rate constants determining the open probability of receptor are likely to be different. However, little experimental data is available for comparison, and current astrocyte models use constants provided by Li and Rinzel (Ullah et al., 2006; Lavrentovich and Hemkin, 2008; De Pittà et al., 2009). The fast and slow components of this receptor result in excitable behavior. When enough IP3 enters the system, Ca2+ is released from ER and has a positive feedback onto the receptor, allowing for additional Ca2+ release, before the deactivating components of the receptor are bound with Ca2+.
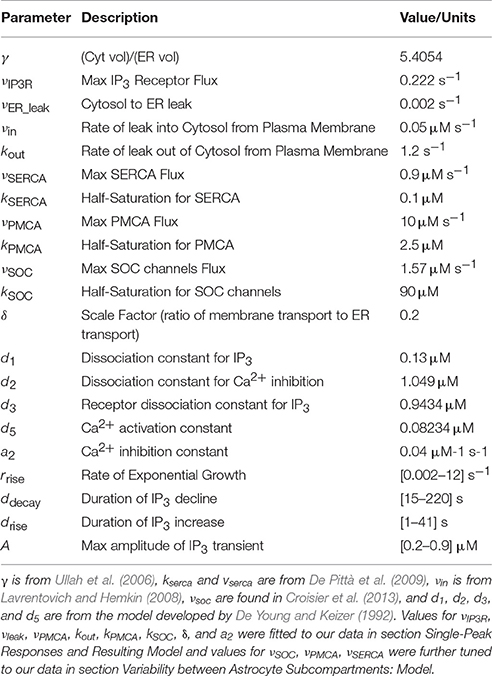
Table 1. Model parameters.
SERCA and PMCA Pumps
In the paper by MacLennan et al. (1997), Ca2+ flow associated with the SERCA pump was shown to depend sigmoidally on the intracellular Ca2+ concentration. We assume that the dependence on Ca2+ concentration has a similar form in astrocytes and can be modeled with the following Hill function,
We fixed the Hill coefficient for this model to be 1.75, as used in Cao et al. (2014), and the default max flow rate (vSERCA) and the dissociation constant (kSERCA) were used in De Pittà et al. (2009), and listed in Table 1.
While the SERCA pump is found on the ER, the PMCA pump is found on the plasma membrane and has the ability to pump Ca2+ from the cytosol into the ECS. Both pumps require ATP to function, and are believed to have similar dynamics. As a result, we chose to use the following equation for the PMCA pump, as used in Croisier et al. (2013):
SOC Channels
Although the molecular mechanism of SOC channels in astrocytes is actively debated, it has been shown that they open when ER Ca2+ is depleted, letting Ca2+ flow from the ECS into the cytosol (Verkhratsky et al., 2012b). To model this mathematically, we follow Croisier et al. (2013) and set
Additional Membrane Fluxes
The model also accounts for an IP3R-independent Ca2+ leak term between the cytosol and the ER. This term is driven by the concentration gradient between the pools of Ca2+ and are a linear approximation of various channels and pumps not modeled explicitly, and is given by the following equation
We also account for additional fluxes across the plasma membrane with the equation
where the first term represents the constant leak of Ca2+ into the cytosol from the ECS and second term captures additional Ca2+ extrusion not explicitly modeled, such as Ca2+ extrusion from the Na+/Ca2+ exchanger (Höfer et al., 2002; Ullah et al., 2006; Keener and Sneyd, 2009; Verkhratsky et al., 2012a).
IP3 Dynamics
As discussed earlier, IP3 is produced as a result of GPCR activation. After diffusing in the cytosol and reacting with IP3Rs, it diffuses through intercellular gap junctions and/or degrades (Höfer et al., 2002). This biochemical pathway has been studied in astrocytes (Fiacco and McCarthy, 2004; Haydon and Carmignoto, 2006; Petravicz et al., 2008) and included in complex biophysical models (Di Garbo et al., 2007; De Pittà et al., 2009). However, rather than including the production and degradation of IP3 explicitly, we opted to treat IP3 waveforms as inputs to our model, generated by a simple equation and ignoring possible feedback of Ca2+ on IP3 (Höfer et al., 2002; Politi et al., 2006), for two reasons. First, this simpler approach made it easier for us to explore how IP3 kinetics affect the shape of Ca2+ events in the absence of feedback. Second, because IP3 production and degradation have not been measured in astrocytes, treating IP3 as an input reduces the number of free parameters in the model substantially. Our simple model makes the following assumptions: following a pulse of ATP, IP3 exponentially saturates to a level denoted as s∞, and then exponentially decays back to steady state:
where
t* is the time of stimulus, A is the max amplitude, rrise and rdec are the rate of rise and decay respectively, and drise and ddec are the durations (0–100% and vice-versa) of the rising and decaying phases, respectively.
To determine a reasonable range of the IP3 parameters A, rrise, ddec, and drise for use in our simulations, we examined and compared data from previous experimental (Pasti et al., 1995; Tanimura et al., 2009; Nezu et al., 2010) and modeling (De Pittà et al., 2009) studies. Tanimura et al. (2009) and Nezu et al. (2010) had imaged IP3 dynamics during ATP-induced (bath applied) Ca2+ responses of COS-7 and HSY-EA1 cells. While they found differences in peak IP3 concentrations within one cell type, between the two cell types, and with different ATP concentrations (Tanimura et al., 2009; Nezu et al., 2010), we used their results and IP3 traces to estimate a range of IP3 amplitudes, rise durations, and decay durations. We also ran simulations using the detailed GPCR model developed by De Pittà et al. (2009) to generate IP3 dynamics and Ca2+ responses to different glutamate concentrations applied for short durations (<5 s). We compared these results with results from local, brief (<100 ms) glutamate applications in cultured astrocytes by Pasti et al. (1995) and accounted for the observed discrepancies by adjusting model parameters, to obtain a reasonable range of IP3 amplitudes, total durations, rise durations, and decay durations. The complete set of IP3 parameters we chose to use in our model is as follows: A = (0.2, 0.375, 0.55, 0.725, 0.9), rrise = (0.002, 0.04, 0.07, 0.09, 0.12, 0.15, 0.3, 0.44, 0.8, 1, 1.6, 12), ddec = (15, 56, 97, 138, 179, 220), and drise = (1, 11, 21, 31, 41) (resulting in a total of 600 IP3 traces; only a subset of rrise value were used for each drise-value, in order to avoid creating repetitions in the IP3 time courses). All 600 IP3 traces were used throughout this paper, unless otherwise noted in the figure captions and text.
Parameter Fitting
While the mechanisms behind the Ca2+ fluxes, and hence the mathematical form of these fluxes, are similar between cell types, it is known that the specific dynamics and time scales of these channels can vary. Further, many of these channels and pumps have not been investigated in astrocytes with sufficient detail to capture specific parameter values. As a result, we fitted several parameters (vip3r, vleak, vpmca, kout, kpmca, ksoc, δ, a2) of our model in order to match the kinetics of an average, short-duration (<25 s) experimental Ca2+ transient (Figure 3A). We first established a reasonable IP3 transient to act as a driving force for short-duration Ca2+ transients, and then fitted parameters accordingly by hand. In addition to fitting the experimental data, we also required the model to have a realistic resting astrocyte Ca2+ concentration in the cytosol (~0.1 μM) and the ER (~200 μM) (Verkhratsky and Butt, 2007). All fitted parameters are similar in magnitudes as those found in the literature and the complete list of parameter values can be found in Table 1. The fitted, normalized model simulation can be seen in Figure 3B.
Monte Carlo Simulations
To account for experimental variability between astrocyte subcompartments (soma, small, and large processes; Figure 2D), we considered a broader parameter space than what is found in Table 1. We ran 30 simulations for each IP3 transient (each IP3 parameter set in Table 1), choosing vpmca, vserca, and vsoc from a uniform distribution centered at the default value found in Table 1, with a maximum set at 150% of this value and minimum set at 50%. The system was first allowed to equilibrate to steady state with these new parameters, and then the IP3 stimulus was applied and Ca2+ response recorded. Once this data set was created, we separated the three dimensional parameter space into 27 subspaces (based on the values of vpmca, vserca, and vsoc), and examined the distribution of Ca2+ response types in each subspace. We also examined these distributions while limiting the ranges of IP3 drise parameters, which were divided into increasingly larger ranges: drise-values from 1 to 11, 1 to 21, 1 to 31, and 1 to 41 s (the full range of drise, as listed in Table 1). After examining the response type distributions, Figure 7 was created by choosing the parameter subspace, or subspaces, that best matched the experimental data in Figure 2D.
Categorization of Ca2+ Response Types
After examining the astrocyte literature, our experimental data, and the model simulations, we categorized all Ca2+ responses into four major categories based on their duration and shape: Single-Peak (SP), Plateau (PL), Multi-Peak (MP), and Long-Lasting (LL). A general definition for each response type is as follows (with corresponding examples and flowchart in Figures 2A,B):
Multi-Peak
A signal that has more than one peak in succession (for experimental data, ≤16 s gap between each consecutive response), with at least one trough reaching <50% of the maximum adjacent peak height. Only those peaks are considered that have heights >5% of the adjacent peak height.
Long-Lasting
A signal that stays elevated continuously, without returning close to baseline (i.e., <15% of the maximum adjacent height) or having additional peaks (with troughs reaching <50% of the maximum adjacent height) for more than 70 s. When there are multiple peaks, if the signal remains elevated for >70 s between any two adjacent troughs, it will be considered a LL response; otherwise, it will be a MP response.
Single-Peak
A signal with one clear peak, without any subsequent major oscillations or bumps. A major oscillation/bump is one with a sufficiently large height (>5% of the adjacent peak height) or sufficiently long duration (lasting >50% of the main peak's duration).
Plateau
A signal with one main peak and subsequent bump or oscillation that either has a sufficiently long duration (>50% of the main peak's duration) or is elevated with its troughs >50% of the peak heights.
In our mathematical model, when changing the IP3 time course, the simulated Ca2+ responses transition between response types as a continuum. As a result, to automatically determine the cytosolic Ca2+ response types of the mathematical model simulations, we developed an extensive MATLAB script to implement the classification procedure described above (more details and the MATLAB scripts can be found in the ModelDB database; Hines et al., 2004; http://senselab.med.yale.edu/modeldb/default.asp; Model no. 189344). It is also worth noting that Ca2+ responses that had amplitudes too small to be detected experimentally (<0.4 μM) or had amplitudes too high to be biologically reasonable (>3.5 μM) were not included in our analyses.
For experimental traces, Ca2+ response types were determined using a similar algorithm; however, due to inherent noise in experimental signals, the algorithm was manually implemented rather than using the MATLAB script. Moreover, the following step was modified to avoid mistaking inherent experimental noise for additional peaks in the Ca2+ traces: in the case of a second peak or oscillation, to determine if the peak was large enough to be a MP response, we checked if its height was >15% of the adjacent peak height (rather than >5% as for the model traces).
Statistics
The paired sample t-test was used to compare SP kinetics between the soma and large processes. Pearson's chi-square test was used to compare the distributions of experimental Ca2+ response types recorded from the soma, large processes, and small processes. Fisher's exact 2-tail test was used to compare the frequencies of specific Ca2+ response types recorded in these subcompartments. The Kolmogorov-Smirnov test was used to compare the distribution of Ca2+ durations observed experimentally and generated in the model using different subsets of IP3 transient parameters.
Results
Experimentally-Observed Variability in Evoked Ca2+ Responses
We applied brief (16–250 ms) local pulses of ATP and examined Ca2+ responses in three subcompartments of each imaged astrocyte: the soma, large processes, and small processes (Figure 1A; regions of interest are marked for one cell at t = 20 s). In Figure 1B, we plot Ca2+ traces vs. time for the three cells, with cell 1 being the astrocyte from the time-lapse image in Figure 1A. In such data, we observed variability among simultaneously recorded responses of different cells, simultaneous responses of different subcompartments within a given cell, and between trials in a given subcompartment. In the first trial (black traces), simultaneous responses of three cells differed substantially, and they each displayed differences among their subcompartments (soma, large processes, and small processes). In the second trial (gray traces; with 5 min of rest between trials and the same agonist concentration, agonist application duration, and pipette location as in trial 1), cell 1's soma and large process (same process as in trial 1) responded with a smaller amplitude, duration, and latency. On the other hand, the soma and the same large process of cell 2 failed to respond to the second stimulus. In contrast, cell 3 responded consistently between the two trials. Such variability between trials, subcompartments, and cells was not uncommon in our experiments. Even when agonists are bath applied and the spatial variability of the agonist concentration is smaller than with our ATP pulse experiments, responses in different cells or astrocyte subcompartments vary greatly in their shapes and durations (e.g., Xie et al., 2012). Our goal in this paper is to characterize these different forms of response variability (summarized in Table 2) in more detail, to develop a mathematical model that generates the variety of observed Ca2+ responses (i.e., with a variety of temporal features, similar to those seen experimentally), and to use the model to examine the sources of these forms of response variability (Table 2), particularly the spatial variability among different astrocyte subcompartments.
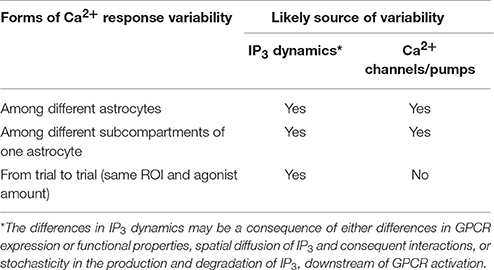
Table 2. Experimentally observed variability in Ca2+ dynamics.
In order to quantify diversity in astrocyte Ca2+ signaling, we divided all Ca2+ responses into four main categories according to their shape and duration: Single-Peak (SP), Plateau (PL), Multi-Peak (MP), and Long-Lasting (LL). This response type categorization is based on our observed experimental data, the astrocyte literature (Verkhratsky and Kettenmann, 1996; Xie et al., 2012; Bonder and McCarthy, 2014), and the mathematical structures underlying our model dynamics, described in section Model Verification and in Handy et al. (2017). In Figure 2A (first and second columns), we show example traces of cytosolic Ca2+ elevations elicited by 30–63 ms applications of ATP. For each response type, two examples of experimental recordings are shown in order to illustrate the variability of observed Ca2+ responses within each response category. In the third column of Figure 2A, we show a stereotypical response for each class, generated by our model, chosen to match the experimental responses in the first column (for model details see section Model Verification).
Figure 2B shows a flow chart summarizing the categorization algorithm (see section Materials and Methods for additional details on response type definitions). A similar classification of responses was proposed by Xie et al. (2012), where astrocyte Ca2+ responses to agonist-bath applications (with durations of tens of seconds) were categorized into three classes based only on the response shape. We also categorized responses based on duration, particularly separating those responses that lasted 70 s or more (described in Khakh and Sofroniew, 2015) into a separate category. We altered some definitions of the three response types proposed by Xie et al. (2012) in order to incorporate this fourth response type, as well as to describe the variability not only in our experimental data, but also in our model simulations using the same algorithm.
Forms of Ca2+ Response Variability and their Sources
Having established the presence of a variety of responses in the data, we next sought mechanisms that underlie the observed evoked Ca2+ response variability under different contexts (summarized in Table 2). In subsequent sections, these mechanisms will be explored in detail in our mathematical model.
Trial to Trial and Cell to Cell Variability
Our results show that the same recording site (region of interest, ROI) can respond differently to identical agonist pulses in different trials (cf. the black and gray traces in Figure 1B). For two reasons, we believe that variability in the spatiotemporal synthesis and degradation of IP3 are the main contributors to trial to trial variability. First, it seems unlikely that GPCR and Ca2+ channel/pump properties change on the short time scale of our experiments (<20 min). Second, IP3 uncaging experiments provide direct evidence that IP3 is the sole source of trial to trial variability. Fiacco and McCarthy (2004) found that astrocyte Ca2+ response kinetics to multiple IP3 uncaging trials were consistent in any one cell, suggesting that trial to trial variability in agonist application experiments stems mainly from factors upstream of the IP3 waveform.
Interestingly, Fiacco and McCarthy (2004) did observe variability in response duration from cell to cell in their IP3 uncaging experiments. This finding supports the hypothesis that different cells are likely to have inherently diverse properties downstream of IP3 dynamics. Compatible with this hypothesis, cell to cell variability is also seen in our data (Figure 1B) and in response to bath-applied agonists (e.g., Xie et al., 2012). We speculate that cell to cell variability is dominated by different distributions and properties of Ca2+ channels and pumps, in addition to differences in GPCR expression levels (and subsequent differences in IP3 kinetics). We explore this idea in the simulations described later.
Variability between Astrocyte Subcompartments
Previous studies (e.g., Tang et al., 2015) have reported differences in Ca2+ kinetics between the astrocyte soma and processes in response to neural stimulation. Using ATP application, we investigated whether the kinetics of SP responses (the most commonly observed response type in our experiments, as described below) varied between the soma and large processes of individual astrocytes. To control for trial to trial and cell to cell variability, we examined pairs of somas and large processes of the same astrocyte that responded to the same trial of ATP application with a SP response (N = 9). While we found that the Ca2+ amplitude is greater in large processes than in somas (paired t-test, p = 0.023), we found no significant differences between the SP durations (p = 0.059), rise times (p = 0.586), or decay times (p = 0.367) (Figure 2C). The difference in amplitudes could be a result of differences in ROI sizes and consequent ΔF/F0 calculations, which involve averaging over the ROI area, as opposed to intrinsic differences in response kinetics.
While we did not find significant differences between the paired SP response kinetics of the somas and large processes, we did note differences in the likelihood of observing certain types of responses in each of these subcompartments. In Figure 2D, we plotted the distribution of response types observed in the somas, large processes, and small processes in our experiments over nine trials (three mice). Our results indicate that SP responses are the most common response type in the soma, while MP responses are rarest. However, the finer the astrocyte processes, the more likely they are to exhibit MP responses instead of SP transients (Fisher's exact 2-tail test, between the MP responses of somas and large processes p = 0.026, and of the somas and small processes p = 0.0016). Further, PL and LL responses were observed at a lower rate in all three subcompartments. The following are the percentages of observed response types (in order, SP, PL, MP, LL) in each astrocyte subcompartment: 63.64, 18.18, 0.0, 18.18% (somas); 47.06, 13.73, 33.33, 5.88% (large processes); 31.67, 10.0, 51.67, 6.67% (small processes). In comparing the overall response type distributions, we found the largest differences to be between the distributions of the somas and small processes (Pearson's chi-squared test, p = 0.016).
The variability in response type distributions between subcompartments could be the result of differences in both the IP3 dynamics and the functional properties of Ca2+ channels and pumps. As above, the differences in IP3 dynamics within different astrocyte subcompartments could arise from differences in GPCR expression levels or functional properties, differences in agonist binding probability or IP3 diffusion within or between cells (due to differences in subcompartment size and shape), or differences in regulatory mechanisms downstream of GPCR activation. Moreover, differences in functional properties of Ca2+ channels and pumps in different astrocyte subcompartments could also arise from differences in subcompartment size and shape, differences in expression levels and spatial distributions of these Ca2+ components, or simply different activity levels of these components.
To summarize, we suggest that the mechanisms behind the observed variability in all three cases (Table 2) stem mainly from differences in one or both of the following: (1) IP3 dynamics, (2) Ca2+ fluxes through various Ca2+ handling mechanisms (e.g., SOC channels). We will next examine the plausibility and consequences of each of these mechanisms in our mathematical model (some other potential sources of variability, e.g., the volume ratio of the cytosol to the ER, have also been examined in our model (Handy et al., 2017) but were found to not have a major effect on Ca2+ responses).
Model Verification
Our single-compartment model includes the Ca2+ handling mechanisms shown in Figure 3B, with IP3 (rather than the GPCR agonist) as the direct input. It consists of three ordinary differential equations describing changes in cytosolic Ca2+ levels, total intracellular Ca2+ levels, and the inactivation variable of the IP3 receptor (IP3R). See section Materials and Methods for details and Handy et al. (2017) for a general bifurcation analysis. Here, we fit the model to experimental data in order to understand the factors that contribute to response variability in response to brief pulses of ATP.
Single-Peak Responses and Resulting Model
To verify our model of astrocyte Ca2+ dynamics, we first ensured that our model matches experimentally observed Ca2+ kinetics during a typical SP Ca2+ response, which is the most common astrocyte Ca2+ response type when stimulated with a brief agonist pulse (Figure 2D). We examined experimental short-duration (<25 s) SP Ca2+ responses and found that the average of such a response for the somas (N = 8; Figure 3A) was similar in kinetics to that of the processes (N = 13, data not shown), in agreement with the results discussed in Figure 2C. Given this similarity, and the fact that the somatic responses were less variable and noisy, we chose to fit our model parameters to the average trace from the soma (Figure 3A).
Because short-duration SP responses are the briefest observed astrocyte Ca2+ responses, we used an IP3 input within the lower end of the parameter range in Table 1 (specific values in Figure 3 caption) to generate a SP response in the model. The fitted SP simulation, along with the corresponding IP3 dynamics and Ca2+ fluxes driving this response, is shown in Figures 3C,D. Before the IP3 stimulus, the simulated system is at steady-state, with the Ca2+ fluxes governed by the ER leak and SERCA pump balanced. When IP3 is released into the cytosol, the IP3R becomes activated and Ca2+ flows from the ER into the cytosol. Depletion of ER Ca2+ causes SOC channel activation, though this flux remains small for the duration of this response. The increase in cytosolic Ca2+ also quickly activates the SERCA pumps, allowing for Ca2+ to be pumped back into the ER. As the cytosolic Ca2+ concentration continues to rise, the PMCA pumps also become activated and some Ca2+ is lost to the ECS. Additional Ca2+ is also released into the ECS due to the ECS_add term. Moreover, before cytosolic IP3 begins to degrade, the Ca2+ flux through the IP3R decreases as a result of negative feedback from elevated levels of cytosolic Ca2+. Together, the SERCA pump, PMCA pump, ECS_add, and the deactivation of the IP3R are able to slow the net change of Ca2+ in the cytosol. As IP3 is degraded and removed from the system, the IP3R begins to deactivate more rapidly, and the pumps are able to return the system to equilibrium. Even when the Ca2+ response measured in the cytosol has returned to baseline levels, the pumps and channels continue to work at a low level to restore the system back to pre-stimulus equilibrium. In the model, the process of refilling the ER to pre-stimulus levels is on the order of ~10 min.
Heterogeneity of Model Ca2+ Responses
As discussed in section Forms of Ca2+ Response Variability and their Sources, IP3 stochasticity is likely a major source of all three forms of variability in evoked Ca2+ responses considered in this manuscript (see Table 2). To explore this issue, we changed IP3 parameters (A, drise, rrise, and rdec; linear spacing) over a biologically plausible range of values (see section Materials and Methods and Table 1 for details), while other model parameters were fixed at the default values. We found that this range of IP3 kinetics was sufficient to reproduce our experimentally-observed Ca2+ responses, compatible with our bifurcation-based classification scheme (for details on how each response type arises from a given IP3 waveform, refer to Handy et al., 2017). Examples of the response types are shown in Figure 4A on the right (solid lines, repeated from Figure 2A), along with the underlying IP3 waveforms (dashed lines).
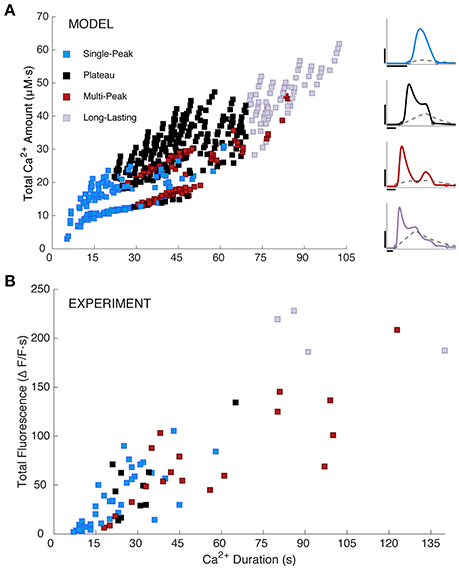
Figure 4. Simulated and measured Ca2+ responses. (A) Simulated total Ca2+ amount (the area under the [Ca2+]cyt curve) vs. Ca2+ duration as defined in section Materials and Methods. Model responses were generated by choosing IP3 parameter sets as specified in section Materials and Methods and Table 1. Response types are indicated as shown. The right panel repeats example Ca2+ traces from Figure 2A, column 3 with their respective IP3 time courses added. The IP3 parameters are as follows (in order, A, drise, rrise, ddec): 0.2, 10, 0.2, 90 (SP); 0.375, 34, 0.002, 110 (PL); 0.26, 41, 0.15, 200 (MP); 0.6, 39, 0.002, 220 (LL). Horizontal scale bars, 10 s; vertical scale bars, 0.5 μM. (B) Experimentally measured Ca2+ responses (y-axis shows area under the ΔF/F trace; N = 19 somas and 52 large processes from a total of 3 mice, 3–6 trials per mouse, 2–5 cells per trial; 16–250 ms stimulus durations) are similar to modeled responses, but more sparsely and non-uniformly distributed. One outlier point was omitted from (B), at a duration and total fluorescence of about 363.
Furthermore, Figure 4A shows a color-coded scatter plot of the four response types generated by this parameter search, plotted vs. response duration and the total area under the simulated Ca2+ response curve (i.e., the total Ca2+ amount). For comparison, in Figure 4B we show a similar scatter plot for the experimental data (N = 71). Model and experimental responses are qualitatively similar, dominated by SP responses for durations <22 s; MP or LL responses for durations >70 s; and a mix of SP, MP, and PL responses for intermediate durations. For both the model and experiments, duration and total area under the curve (i.e., total Ca2+ amount for model, and total fluorescence for experiments) are positively correlated. Additionally, the range of Ca2+ response durations between simulations and experiments are similar. These similarities suggest that the range of our model parameters and selected IP3 kinetics are biologically plausible for evoked, IP3-dependent astrocyte Ca2+ activity. However, experimental Ca2+ responses are more sparsely and non-uniformly distributed than model Ca2+ responses, which we explore next.
IP3 Dynamics as a Source of Response Variability in the Model
Although the range of Ca2+ response durations is similar in both model and data (Figure 4), the distributions of response durations are significantly different (Supplementary Figure 1, Kolmogorov-Smirnov test, p = 8e-6), with longer PL and LL responses overrepresented in simulations. Hypothesizing that IP3 kinetics may influence the distributions of model response durations, we explored the effects of restricting the IP3 waveform, with the goal of matching the distribution of experimental response durations without eliminating altogether the long-duration responses of Figure 4A. Of the many manipulations we attempted (i.e., limiting IP3 total duration, decay duration, rise duration, and amplitude), we only succeeded in this goal by limiting the IP3 rise duration (drise) from Equation (4) to <22 s (Kolmogorov-Smirnov test, p = 0.2, max duration = 83 s, Supplementary Figure 1). Thus, the model suggests that shorter IP3 rise durations are more common in the experimental data set than the full range of model IP3 parameters originally considered.
Because response durations and types are clearly correlated (Figure 4), we might expect that restricting drise will alter the distributions of response types as well. Figure 5A shows the distribution of modeled response types for the default range of IP3 parameters (left panel) and for restricted values of rise durations (right panel, drise < 22 s). As expected, the short-drise histogram exhibits many more SP responses and substantially fewer longer, more complex responses. This effect is compared with experimental data in section Variability between Astrocyte Subcompartments: Model.
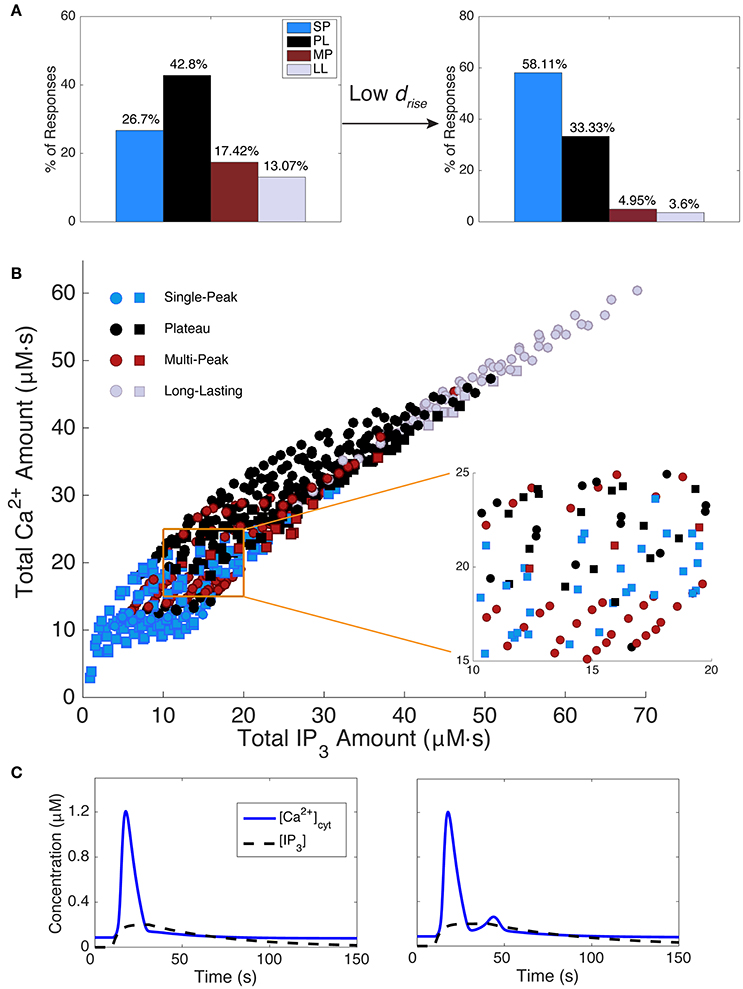
Figure 5. Effect of IP3 kinetics on Ca2+ responses. (A) The left histogram shows the distribution of model response types while scanning IP3 kinetics over the full parameter range from Table 1. The right histogram plots the response type distribution for shorter IP3 rise durations (drise < 22 s). Shorter IP3 rise durations tend to decrease the occurrence of mostly MP and LL responses, with SP being the major response type, while longer IP3 rise durations decrease the percentage of SP responses, but increase other response types. (B) The total IP3 amount correlates with the total Ca2+ amount. However, in most regimes, within a small range of IP3 (and Ca2+) amounts, a mixture of Ca2+ response types are generated. An example of such a regime is shown in the zoomed section. Squares indicate responses generated with drise < 22 s (corresponding to data set in the right histogram in (A) and circles indicate responses generated with all other drise values from Table 1. (C) Two example Ca2+ responses are shown with their underlying IP3 dynamics. As seen, a small change in IP3 kinetics is sufficient to change the Ca2+ response type from SP to MP, while the total IP3 amount remains roughly the same (15.28 and 15.17 μM, respectively; Ca2+ amounts are 13.86 and 15.56 μM, respectively). IP3 parameters (A, drise, rrise, ddec): 0.2, 21, 0.3, 220 (SP), 0.2, 31, 0.3, 179 (MP).
Modeled Response Types are Sensitive to the IP3 Waveform
Figure 5B shows the total Ca2+ amount vs. the total IP3 amount (i.e., the areas under the Ca2+ and IP3 traces, respectively). Data points are color-coded by response type, and the symbol type denotes the IP3 rise durations (squares: drise < 22 s; circles: drise > 22 s, as described in section Materials and Methods). We draw several conclusions from Figure 5B and associated results. First, the total amounts of IP3 and Ca2+ are strongly positively correlated. In contrast, we found no correlation between other features of the IP3 and Ca2+ waveforms: IP3 rise duration, total duration, decay duration, amplitude, or the ratio of amplitude over duration did not correlate with Ca2+ total amount, duration, or amplitude. Second, although there is some correlation between total IP3 amount and Ca2+ response type, no two features or parameters of the IP3 waveform strictly predict the response type. Third, for intermediate values of total IP3 and Ca2+ amounts, the response type is particularly sensitive to small changes in the IP3 waveform (see the Figure 5B inset and example waveforms in Figure 5C; for more details on the model's sensitivity to various parameters, refer to Handy et al., 2017). This finding suggests that experimental trial to trial variability discussed earlier could be caused by small trial to trial changes in the IP3 waveform.
Ca2+ Fluxes as a Source of Response Variability
In addition to differences in IP3 dynamics, cell to cell and subcompartment to subcompartment response variabilities may also be due to different expression levels or functional properties of channels and pumps (e.g., SOC channels, PMCA pumps, and SERCA pumps) involved in Ca2+ responses (section Forms of Ca2+ Response Variability and their Sources). Therefore, we examined the individual contribution of each of these channels and pumps to Ca2+ responses (Figure 6). We also studied the effects of modifying Ca2+ leak fluxes between the cytosol and ER or ECS, and the volume ratio of the cytosol to the ER (γ), and found no major effects (Handy et al., 2017). In unpublished work, we have examined the effects of IP3R parameters including d1, the IP3 dissocation constant. Increasing d1 shifts to the right the bifurcation that gives rise to the complex transition to more complex and long-lasting responses in Figure 5B (data not shown), but does not lead to qualitative changes in behavior, and can be replicated by scaling IP3 and the parameter d3. Effects of the more complete set of parameters are considered in the context of bifurcation analysis (Handy et al., 2017).
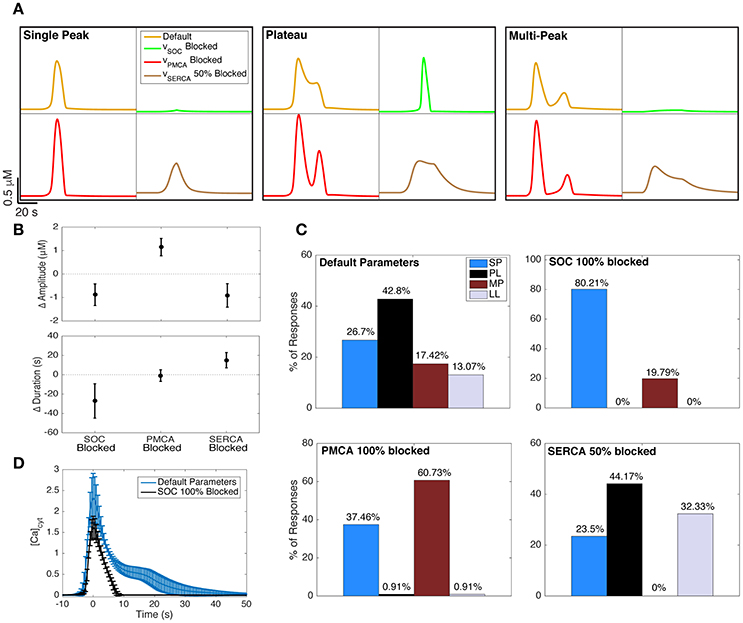
Figure 6. Effect of blocking Ca2+ channels and pumps on Ca2+ responses. (A) The effects of blocking SOC channels (green traces), PMCA pumps (red traces), and SERCA pumps (brown traces) on example SP, PL, and MP responses generated with the default model parameters (yellow traces). The underlying IP3 dynamics for each panel are, from left to right (in order, A, drise, rrise, ddec): 0.2, 21, 0.002, 97 (SP), 0.375, 36, 0.002, 120 (PL), 0.2, 41, 0.15, 179 (MP). The IP3 input was applied 20 s after the start of the simulation. (B) The change in Ca2+ response amplitude and duration after blocking the three channels and pumps. For all 600 IP3 inputs, the mean change in response kinetics from the default Ca2+ response is shown, with its standard deviation. (C) The effects of blocking the channels and pumps on Ca2+ response type distributions. The upper left distribution (corresponding to default parameters) is repeated from the left panel of Figure 5A. (D) The average PL response with default model parameters (IP3 drise < 22 s, as in the right panel of Figure 5A) shown in blue. Using the same underlying IP3 dynamics as the input, we also generated the average Ca2+ response when SOC channels were fully blocked (black trace). As observed, the plateau phase of Ca2+ responses is eliminated when SOC channels are blocked in our model. To generate these average traces, the trace peaks were first aligned, ignoring latency. Error bars indicate standard deviations.
Blocking SOC Channels Results Mostly in SP Responses
The green traces in Figure 6A show how the example Ca2+ responses with default parameters (yellow traces) change when SOC channels are fully blocked. As seen, the durations and amplitudes of the Ca2+ responses to the same IP3 input decrease when SOC channels are blocked. This was true for nearly 99% of the full set of 600 IP3 traces (summarized for complete set of responses in Figure 6B, left). In fact, for 120 out of the 600 choices for IP3 parameters, blocking SOC channels suppresses the response up to the degree that the response would potentially become undetectable in experiments (amplitude <0.4 μM). In other words, our model predicts that blocking SOC channels decreases the likelihood that the astrocyte will respond to a brief application of agonist.
Figure 6C (upper right histogram) illustrates that blocking SOC channels in the model increases the likelihood of observing SP responses, and completely eliminates the incidence of PL and LL responses. These data show that without functional SOC channels, we would expect to only observe SP or MP responses, at least during short-duration agonist applications. The fact that SOC channels have such strong effects on Ca2+ responses is particularly surprising given that the SOC flux rates are low in our model (Figure 3D; examined in more detail in Handy et al., 2017).
In agreement with our model prediction, previous experimental studies have shown that blocking astrocyte SOC channels eliminates the plateau phase of astrocyte Ca2+ responses and transforms these PL responses to SP responses (Malarkey et al., 2008; Pivneva et al., 2008; Wang et al., 2012). Figure 6D (blue trace) shows the average (± standard deviation) PL trace from the same set of model parameters as in the right panel of Figure 5A. Simulating responses using the same IP3 parameters, but with SOC channels fully blocked, eliminates the plateau phase of the responses, transforming them into SP responses (Figure 6D, black trace).
Blocking PMCA Pumps Increases the Occurrence of MP Responses
The red traces in Figure 6A show how the example SP, MP, and PL traces transform when PMCA pumps are fully blocked. As seen, the amplitudes, but not durations, of Ca2+ responses to the same IP3 input increase when PMCA pumps are fully blocked. The change in Ca2+ amplitude and duration, for any given IP3 input, arising when PMCA pumps are blocked is shown in Figure 6B, center. The response type distribution (Figure 6C, lower left) illustrates that blocking PMCA pumps almost entirely eliminates PL and LL responses (as was the case when blocking SOC channels). However, in contrast to the effects of blocking SOC channels, blocking PMCA pumps considerably increases the occurrence of MP responses.
Partial Block of SERCA Pumps Eliminates MP Responses
SERCA pumps are a necessary mechanism to fill the ER with Ca2+, and completely blocking these pumps experimentally has been shown to lead to apoptosis (Luciani et al., 2009). In our model, completely blocking this term would lead to the ER being entirely emptied, and the system would be unable to evoke a response with IP3. Therefore, we only investigated a 50% block of this channel. As seen in Figure 6A (brown traces), the durations of Ca2+ responses increase when SERCA pumps are partially blocked, while the amplitudes decrease. This change in Ca2+ kinetics occurred for all 600 IP3 traces and is summarized in Figure 6B, right. Furthermore, the response type distribution (Figure 6C, lower right) shows that MP responses are entirely eliminated when SERCA pumps are 50% blocked, and mostly transform into additional LL responses.
Variability between Astrocyte Subcompartments: Model
Thus, far, we have examined the separate effects of IP3 dynamics and individual Ca2+ fluxes on resulting Ca2+ dynamics. We now consider the effects of simultaneously changing both IP3 parameters and Ca2+ channel/pump fluxes within a biologically plausible range (Table 1), in order to explore how these differences may shape the variety of response type distributions among the somas, large processes, and small processes (Figure 2D). To do this, we ran simulations with random combinations of the three flux parameters vSOC, vPMCA, and vSERCA, while drawing the IP3 drise parameter from different ranges (for details see section Materials and Methods). We then selected the subspace, or subspaces, that best matched each of the three experimentally-recorded distributions in Figure 2D. A more detailed examination of the response type distributions resulting from each of these subspaces is provided in Handy et al. (2017).
The rationale behind this parameter search is that Ca2+ response variability between astrocyte subcompartments stems from variability in both Ca2+ channel/pump properties and the underlying IP3 kinetics (see sections Variability between Astrocyte Subcompartments and Contribution of IP3 to Ca2+ Response Variability). It is noteworthy that the simulations for a given astrocyte subcompartment also include a range of Ca2+ channel/pump parameters and IP3 parameters. Since in the experiments multiple cells were used to generate the data for each astrocyte subcompartment, having a range of parameters in simulations reflects the variability in channel/pump properties and IP3 kinetics inherent to each cell (see section Trial to Trial and Cell to Cell Variability on cell to cell variability). The range of IP3 parameters in simulations for each subcompartment also reflects experimental IP3 stochasticity stemming from trial to trial variability (i.e., the same ROI in the same cell responding differently to identical agonist pulses; see sections Trial to Trial and Cell to Cell Variability and Contribution of IP3 to Ca2+ Response Variability) as well as experimental variability (e.g., pipette distance from the ROIs).
Using this parameter search, we found that the only subspace with a distribution that closely resembled the somatic distribution consisted of very short IP3 drise values (≤11 s) and the following parameter ranges: high vSOC (1.83–2.36), medium vPMCA (8.33–11.67), and low vSERCA (0.45–0.75). We did not find any one subspace that matched the distributions of the large and small processes. By looking at combinations of two adjacent subspaces, we found that IP3 drise values ≤21 s and the following parameter ranges provided a distribution similar to that of the large processes: high vSOC (1.83–2.36), low vPMCA (5.0–8.33), and medium and high vSERCA (0.75–1.35). Using this same parameter subspace of the large processes, but with the full range of IP3 drise values in Table 1 (≤41 s), we obtained a distribution similar to that of the small processes. The three Ca2+ response type distributions from the mathematical model are shown in Figure 7A. The following are the percentages of observed response types in these random simulations (in order, SP, PL, MP, LL) for each subcompartment: 68.42, 17.76, 0.0, 13.82% (soma); 57.44, 16.37, 22.02, 4.17% (large processes); 26.21, 15.46, 52.52, 5.81% (small processes).
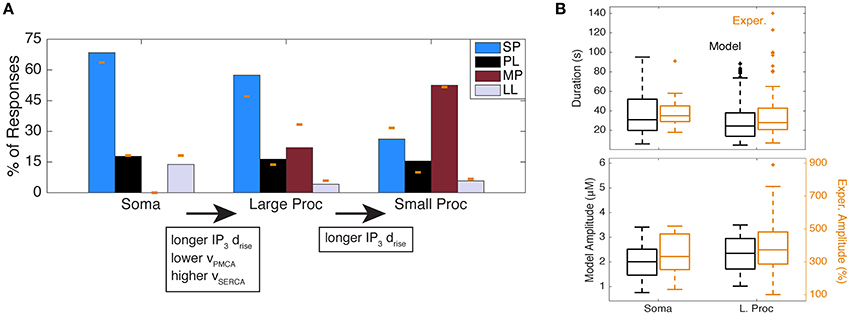
Figure 7. Simulation of response type distributions matching experimental distributions of astrocyte subcompartments. (A) Response type distributions in the model with parameters adjusted to the soma, large processes, and small processes. The yellow bars indicate the experimental data from Figure 2D. (B) Ca2+ durations and amplitudes of all response types in the model (from (A); in black) and experiments (from Figure 2D; in yellow) in the soma and large processes. One outlier was excluded from the experimental soma duration plot, with a duration of 363 s (same outlier omitted from Figure 4B).
To confirm that the Ca2+ response kinetics generated from these parameter subspaces are reasonable and comparable to the kinetics in the experimental data, we examined the ranges of Ca2+ kinetics for the soma and large processes of all response types in experiments (from the histogram in Figure 2D) and the random model simulations. We found that, similar to experiments, the model Ca2+ responses consist of a wide range of Ca2+ durations and amplitudes (Figure 7B), which is expected given the trial to trial and cell to cell variability we had discussed previously (Figure 2C). Moreover, while exact amplitude values between the model and experiments are not comparable (due to different measurement units), we see that response durations are very similar.
In summary, our results predict that the main differences between the astrocyte somas and large processes that are responsible for different response type distributions are as follows: (1) large processes include IP3 dynamics with slightly longer rise durations, and (2) the Ca2+ flux rates through the PMCA and SERCA pumps are, respectively, lower and higher in the large processes. Response type distributions associated with small processes can be generated by increasing IP3 rise durations even further, but using the same Ca2+ flux parameters as for large processes. This gradient in IP3 rise durations from somas to fine processes could be related to the influx of IP3 through spatial diffusion from other subcompartments, the constricted volume of the smaller subcompartments compared to the larger ones, and different probabilities of the agonist binding to receptors (due to the different subcompartment sizes and GPCR densities or expression levels).
Discussion
We analyzed astrocyte Ca2+ responses to brief focal ATP applications and, based on our results, developed a single-compartment model of astrocyte Ca2+ activity to investigate mechanisms of Ca2+ response variability. We categorized both experimentally-recorded and model Ca2+ responses into four types: Single-Peak (SP), Multi-Peak (MP), Plateau (PL), and Long-Lasting (LL). We found that, experimentally, SP response kinetics do not differ consistently between the soma, and processes, but we do see variability between cells and trials. However, the distributions of Ca2+ response types vary between different astrocyte subcompartments, with the likelihood of SP responses decreasing, and of MP responses increasing, in the large and small processes relative to the soma.
Our model responses were tuned to match the average experimental short-duration SP response kinetics. We then applied IP3 transients to the model with a range of biologically plausible kinetics, and found that this range of IP3 parameters was sufficient to reproduce all four Ca2+ response types in the model, without the need for feedback-induced oscillations in the IP3 waveform (Politi et al., 2006). The model was also used to predict how blocking astrocyte Ca2+ channels and pumps would affect the Ca2+ responses. In particular, blocking SOC channels resulted mostly in SP responses, and decreased the response duration and amplitude. Blocking PMCA pumps eliminated most PL and LL responses, and increased response amplitude. Finally, blocking SERCA pumps eliminated MP responses, decreased response amplitude, and increased the duration.
Lastly, we propose that the experimentally observed response variability between astrocyte subcompartments can be explained by the differences in their channel/pump flux rates and IP3 kinetics. Namely, our simulations suggest that: (1) astrocyte somas have higher PMCA flux rates and lower SERCA flux rates than the processes, and (2) when moving from the somas to the large and small processes, the underlying IP3 transients tend to include those with longer rise durations.
Our modeling results highlight two major advantages of relatively simple, biophysically based, mathematical models. First, they are experimentally falsifiable, and thus can be straightforwardly improved, or if necessary, discarded. Second, verified models of this type can be used as diagnostic tools. For example, because our model makes strong predictions about how specific biophysical mechanisms determine the types of Ca2+ transients evoked in astrocytes, it is potentially very useful in determining which mechanisms are altered in disease states, reactive astrocytosis, or other cases in which Ca2+ events are potentially altered.
Contribution of IP3 to Ca2+ Response Variability
We have presented three contexts in which astrocyte response variability has been observed (Table 2). Our results suggest that IP3 time course variability may be a key contributor to all forms of response variability. For a given agonist application, variability between cells, or subcompartments within a cell, may arise from the profile of agonist reaching the GPCRs (e.g., due to different subcompartment sizes/shapes, or distances from the pipette); the local expression level or properties of GPCRs in a given cell or subcompartment; and differences in the diffusion and degradation of IP3. Our experimental and computational results suggest that the net effect of such differences between the soma, large processes, and small processes is to increase the effective IP3 rise duration (drise) in the periphery relative to the soma (Figure 7A). In our model, further differences in PMCA and SERCA flux rates (vPMCA, vSERCA) are necessary to explain differences between the distributions of responses between somas and processes.
For a given ROI, we see much more trial to trial response variability than in IP3 uncaging experiments (Fiacco and McCarthy, 2004). In contrast with Toivari et al. (2011), we thus conclude that the dominant source of trial to trial variability lies in the factors that determine the IP3 waveform in response to repeated agonist applications. IP3 waveform variability and concomitant variability in Ca2+ responses has been observed directly in response to bath application of ATP in other cell types (Tanimura et al., 2009; Nezu et al., 2010).
What is the source of this hypothesized trial to trial variability in the IP3 waveform? Because we see no obvious trends in response to repeated stimuli, we speculate that the dominant factor is stochasticity from two sources. First, the number of activated GPCRs may vary stochastically between trials. Second, the mechanisms governing IP3 dynamics downstream of GPCRs are sensitive to varying molecule numbers known to assist with IP3 metabolism (Bartlett et al., 2015), and can lead to robust changes in Ca2+ signals. Another well-described source of stochasticity in Ca2+ responses is the inherent stochasticity of the IP3R (Falcke, 2003; Dupont and Sneyd, 2009; Dupont et al., 2016) and other Ca2+ channels (Skupin et al., 2008, 2010). However, we believe that stochastic gating of these channels is less dominant for ATP-pulse-evoked Ca2+ transients studied here than for the spontaneous events, due to the larger number of IP3 molecules involved. Our view is supported by Fiacco and McCarthy (2004), who uncaged IP3, thus presumably reducing variability in the IP3 waveform. They saw much less variability in evoked Ca2+ events compared with our ATP protocol, suggesting that the dominant sources of variability are upstream from the IP3 waveform for evoked transients. Taken together, the body of experimental and modeling results thus suggests that sources of variability are quite different for spontaneous and evoked events. We consider all the potential sources of stochasticity described here ripe for future study.
Ca2+ Oscillations and Plasma Membrane Fluxes
Our modeling results suggest that the presence of SOC channels allows for sustained Ca2+ oscillations without oscillations in IP3, despite the low SOC flux rates (Figure 3D). This result is consistent with experimental results from astrocytes (Sergeeva et al., 2000, 2003). We explore this issue in more detail in Handy et al. (2017). A similar role may be played by receptor-operated Ca2+ (ROC) channels, which are activated by GPCR agonists rather than by the depleted ER. ROC channels have been found in some astrocytes (Grimaldi et al., 2003; Beskina et al., 2007) and included in earlier models (Croisier et al., 2013). Regardless of the mechanism for plasma membrane Ca2+ fluxes, our model suggests the importance of considering an open-cell model in which total intracellular Ca2+ levels are allowed to fluctuate.
Comparison of Experimental and Model Ca2+ Response Kinetics
Although our model accounts very well for the variety of measured Ca2+ transients (Figures 4, 7B), it appears unable to account for a handful of very long (duration >120 s), often oscillatory events. Like nearly any tractable mathematical model, our model was not designed to account for all possibilities that may have been encountered in the experiments. Several factors, not accounted for in the model but possible in the experiments, could contribute positive feedback to extend Ca2+ transients in rare cases. First, applied ATP may cause release of other GPCR agonists from nearby glia or neurons, thus extending the duration of GPCR activation (Anderson et al., 2004). Second, astrocytes produce spontaneous Ca2+ activity via mechanisms that are incompletely understood but distinguishable from those implicated in evoked transients (Aguado et al., 2002; Wang et al., 2006; Haustein et al., 2014; Srinivasan et al., 2015). ATP application or evoked transients may interact with this mechanism to prolong the Ca2+ response in rare cases. Lastly, although single IP3 pulses can drive Ca2+ oscillations in our model, it is not known whether astrocytes generate multiple pulses or oscillations in IP3 levels in response to ATP pulses, as is seen, e.g., in HYS-EA1 cells during agonist bath applications of ATP (Tanimura et al., 2009). Feedback from Ca2+ to IP3, which has not been demonstrated in astrocytes except in tissue cultures, can in principle generate IP3 oscillations that enhance Ca2+ oscillations and prolong their duration (Höfer et al., 2002; Politi et al., 2006).
Similar mechanisms may underlie rare, experimentally observed Ca2+ oscillations with progressively increasing peak heights (e.g., the second MP and PL examples in Figure 2A), which are only reproducible in our model with more than one IP3 pulse (data not shown). Consistent with the suggestion that oscillatory IP3 events underlie growing Ca2+ oscillations, increases in Ca2+ peaks have been observed in HSY-EA1 cells during IP3 oscillations (Tanimura et al., 2009, Figure 5). Moreover, in COS-7 cells where IP3 did not oscillate, Ca2+ oscillations were possible but the initial Ca2+ peak was the largest peak for any given agonist concentration (Tanimura et al., 2009).
Several known Ca2+ buffering and exchange mechanisms, including the Na+/Ca2+-exchanger and the effects of mitochondria, were not explicitly included in our model. We left these mechanisms out for three reasons. First, we simply lack adequate data from astrocytes to build such a model in good faith. Second, our minimal model was adequate to describe the experimental data sets quantitatively, with the exception of rare, long-lasting events. Third, our model is simple enough to allow formal mathematical analysis (Handy et al., 2017) that gives a significantly deeper understanding of the model's behavior. Development of a more mechanistically complex and detailed model awaits more detailed data, collected from astrocytes in the presence of appropriate blockers, so that the effects of each buffering component can be studied in isolation.
Role of Astrocyte Ca2+ Responses
Ca2+ transients have been hypothesized to have diverse downstream effects, including multiple forms of gliotransmission, modulation of transporters, and gene expression (reviewed by Bazargani and Attwell, 2016). It is likely that transients generated in different subcompartments generate different outcomes. For example, due to peripheral processes' proximity to neuronal synapses and blood vessels, small processes may be more involved in regulation of synaptic function and blood flow. The different response type distributions of each astrocyte subcompartment (Figure 2D), may be a reflection of their different roles.
Much of our analysis has focused on dividing Ca2+ responses into one of four types. This approach can be a useful tool for researchers, because the distribution of response types is clearly related to the underlying biophysics. However, it is unlikely that astrocytes encode information based solely on Ca2+ response type, since small changes in IP3 time course may change response types (Figure 5C). Instead, our results suggest that the most controllable way to reliably “encode” for different outcomes (Bazargani and Attwell, 2016) is via total Ca2+ amount (related to response type, duration, and amplitude), which varies more smoothly with small differences in the upstream triggering events (Figure 5B).
Author Contributions
MT collected and analyzed the experimental data under the guidance of JW. MT and GH built the mathematical model, ran the simulations, and analyzed the results under the guidance of AB. AB and JW oversaw the design and execution of project. MT, GH, AB, and JW wrote and reviewed the manuscript.
Funding
This work was supported by the National Science Foundation (DMS-1022945 to AB; DMS-1148230, to AB and GH) and the National Institutes of Health (R01 NS078331, to JW and K. S. Wilcox).
Conflict of Interest Statement
The authors declare that the research was conducted in the absence of any commercial or financial relationships that could be construed as a potential conflict of interest.
Acknowledgments
We thank Drs. Fernando R. Fernandez, Nathan A. Smith, and Karen A. Wilcox for helpful comments on this project and manuscript.
Supplementary Material
The Supplementary Material for this article can be found online at: https://www.frontiersin.org/articles/10.3389/fnsys.2017.00079/full#supplementary-material
References
Aguado, F., Espinosa-Parrilla, J. F., Carmona, M. A., and Soriano, E. (2002). Neuronal activity regulates correlated network properties of spontaneous calcium transients in astrocytes in situ. J. Neurosci. 22, 9430–9444.
Anderson, C. M., Bergher, J. P., and Swanson, R. A. (2004). ATP-induced ATP release from astrocytes. J. Neurochem. 88, 246–256. doi: 10.1111/j.1471-4159.2004.02204.x
Anderson, C., and Swanson, R. A. (2000). Astrocyte glutamate transport: review of properties, regulation, and physiological functions. Glia 5, 81–94. doi: 10.1002/1098-1136(200010)32:1<1::AID-GLIA10>3.0.CO;2-W
Bartlett, P., Metzger, W., Gaspers, L., and Thomas, A. (2015). Differential regulation of multiple steps in inositol 1,4,5 trisphosphate signaling by protein kinase c shapes hormone-stimulated Ca2+ oscillations. J. Biol. Chem. 290, 18519–18533. doi: 10.1074/jbc.M115.657767
Bazargani, N., and Attwell, D. (2016). Astrocyte calcium signaling: the third wave. Nat. Neurosci. 19, 182–189. doi: 10.1038/nn.4201
Beskina, O., Miller, A., Mazzocco-Spezzia, A., Pulina, M. V., and Golovina, V. A. (2007). Mechanisms of interleukin-1beta-induced Ca2+ signals in mouse cortical astrocytes: roles of store- and receptor-operated Ca2+ entry. Am. J. Physiol. Cell Physiol. 293, C1103–C1111. doi: 10.1152/ajpcell.00249.2007
Bezzi, P., Carmignoto, G., Pasti, L., Vesce, S., Rossi, D., Rizzini, B. L., et al. (1998). Prostanglandins stimulate calcium dependent glutamate release from astrocytes. Nature 391, 281–285. doi: 10.1038/34651
Bonder, D. E., and McCarthy, K. D. (2014). Astrocytic Gq-GPCR-linked IP3R-dependent Ca2+ signaling does not mediate neurovascular coupling in mouse visual cortex in vivo. J. Neurosci. 34, 13139–13150. doi: 10.1523/JNEUROSCI.2591-14.2014
Cahoy, J. D., Emery, B., Kaushal, A., Foo, L. C., Zamanian, J. L., Christopherson, K. S., et al. (2008). A transcriptome database for astrocytes, neurons, and oligodendrocytes: a new resource for understanding brain development and function. J. Neurosci. 28, 264–278. doi: 10.1523/JNEUROSCI.4178-07.2008
Cao, P., Tan, X., Donovan, G., Sanderson, M. J., and Sneyd, J. (2014). A deterministic model predicts the properties of stochastic calcium oscillations in airway smooth muscle cells. PLoS Comput. Biol. 10:3783. doi: 10.1371/journal.pcbi.1003783
Croisier, H., Tan, X., Perez-Zoghbi, J. F., Sanderson, M. J., Sneyd, J., and Brook, B. (2013). Activation of store-operated calcium entry in airway smooth muscle cells: insight from a mathematical model. PLoS ONE 8:69598. doi: 10.1371/journal.pone.0069598
De Pittà, M., Goldberg, M., Volman, V., Berry, H., and Ben-Jacob, E. (2009). Glutamate regulation of calcium and ip3 oscillating and pulsating dynamics in astrocytes. J. Biol. Phys. 35, 383–411. doi: 10.1007/s10867-009-9155-y
De Young, G., and Keizer, J. (1992). A single-pool inositol 1,4,5-trisphosphate-receptor-based model for agonist-stimulated oscillations in Ca2+ concentration. Proc. Natl. Acad. Sci. U.S.A. 89, 9895–9899. doi: 10.1073/pnas.89.20.9895
Di Garbo, A., Barbi, M., Chillemi, S., Alloisio, S., and Nobile, M. (2007). Calcium signalling in astrocytes and modulation of neural activity. BioSystems 89, 74–83. doi: 10.1016/j.biosystems.2006.05.013
Dupont, G., and Croisier, H. (2010). Spatiotemporal organization of Ca2+ dynamics: a modeling-based approach. HFSP J. 4, 43–51. doi: 10.2976/1.3385660
Dupont, G., and Sneyd, J. (2009). Recent developments in models of calcium signalling. Curr. Opin. Syst. Biol. 3, 15–22. doi: 10.1016/j.coisb.2017.03.002
Dupont, G., Falcke, M., Kirk, V., and Sneyd, J. (2016). “Hierarchical and stochastic modelling,” in Models of Calcium Signalling, eds S. S. Antman, L. Greengard, and P. J. Holmes (Basel: Springer International Publishing), 174–184.
Evans, R. C., and Blackwell, K. T. (2015). Calcium: amplitude, duration, or location? Biol. Bull. 228, 75–83. doi: 10.1086/BBLv228n1p75
Falcke, M. (2003). On the role of stochastic channel behavior in intracellular Ca2+ dynamics. Biophys. J. 84, 42–56. doi: 10.1016/S0006-3495(03)74831-0
Fiacco, T. A., and McCarthy, K. D. (2004). Intracellular astrocyte calcium waves in situ increase the frequency of spontaneous ampa receptor currents in ca1 pyramidal neurons. J. Neurosci. 24, 722–732. doi: 10.1523/JNEUROSCI.2859-03.2004
Gee, J. M., Smith, N., Fernandez, F. A., Economo, M. R., Brunert, D., Rothermel, M., et al. (2014). Imaging activity in neurons and glia with a polr2a-based and cre-dependent gcamp5g-ires-tdtomato reporter mouse. Neuron 83, 1058–1072. doi: 10.1016/j.neuron.2014.07.024
Grimaldi, M., Maratos, M., and Verma, A. (2003). Transient receptor potential channel activation causes a novel form of [Ca2+]i oscillations and is not involved in capacitative Ca2+ entry in glial cells. J. Neurosci. 23, 4737–4745. doi: 10.1016/j.neuint.2008.12.018
Handy, G., Taheri, M., White, J. A., and Borisyuk, A. (2017). Mathematical investigation of IP3-dependent calcium dynamics in astrocytes. J. Comput. Neurosci. 42, 257–273. doi: 10.1007/s10827-017-0640-1
Haustein, M. D., Kracun, S., Lu, X. H., Shih, T., Jackson-Weaver, O., Tong, X., et al. (2014). Conditions and constraints for astrocyte calcium signaling in the hippocampal mossy fiber pathway. Neuron 82, 413–429. doi: 10.1016/j.neuron.2014.02.041
Haydon, P. G. (2001). Glia: listening and talking to the synapse. Nat. Rev. 2, 185–193. doi: 10.1038/35058528
Haydon, P. G., and Carmignoto, G. (2006). Astrocyte control of synaptic transmission and neurovascular coupling. Physiol. Rev. 86, 1009–1031. doi: 10.1152/physrev.00049.2005
Hines, M. L., Morse, T., Migliore, M., Carnevale, N. T., and Shepherd, G. M. (2004). ModelDB: a database to support computational neuroscience. J. Comput. Neurosci. 17, 7–11. doi: 10.1023/B:JCNS.0000023869.22017.2e
Höfer, T., Venance, L., and Giaume, C. (2002). Control and plasticity of intercellular calcium waves in astrocytes: a modeling approach. J. Neurosci. 22, 4850–4859.
Jiang, R., Diaz-Castro, B., Looger, L. L., and Khakh, B. S. (2016). Dysfunctional astrocyte signaling in HD model mice. J. Neurosci. 36, 3453–3470. doi: 10.1523/JNEUROSCI.3693-15.2016
Kang, J., Jiang, L., Goldman, S., and Nedergaard, M. (1998). Astrocytes mediated potentiation of inhibitory synaptic transmission. Nat. Neuroci. 1, 683–692. doi: 10.1038/3684
Keener, J., and Sneyd, J. (2009). Mathematical Physiology. New York, NY: Springer Science+Business Media.
Khakh, B. S., and Sofroniew, M. V. (2015). Diversity of astrocyte functions and phenotypes in neural circuits. Nat. Neurosci. 18, 942–952. doi: 10.1038/nn.4043
Kim, S. K., Hayashi, H., Ishikawa, T., Shibata, K., Shigetomi, E., Shinozaki, Y., et al. (2016). Cortical astrocytes rewire somatosensory cortical circuits for peripheral neuropathic pain. J. Clin. Invest. 126, 1983–1997. doi: 10.1172/JCI82859
Larsen, B. R., Assentoft, M., Cotrina, M. L., Hua, S. Z., Nedergaard, M., Kaila, K., et al. (2014). Contributions of the Na+/K+-ATPase, NKCC1, and Kir4.1 to hippocampal K+ clearance and volume responses. Glia 62, 608–622. doi: 10.1002/glia.22629
Lavrentovich, M., and Hemkin, S. (2008). A mathematical model of spontaneous calcium(II) oscillations in astrocytes. J. Theor. Biol. 251, 553–560. doi: 10.1016/j.jtbi.2007.12.011
Li, Y. X., and Rinzel, J. (1996). Equations for insp3 receptor-mediated Ca2+ oscillations derived from a detailed kinetic model: a Hodgkin-Huxley like formalism. J. Theor. Biol. 166, 461–473. doi: 10.1006/jtbi.1994.1041
Liu, Q., Xum, Q., Kangm, J., and Nedergaard, M. (2004). Astrocyte activation of presynaptic metabotropic glutamate receptors modulates hippocampal inhibitory synaptic transmission. Neuron Glia Biol. 1, 307–316. doi: 10.1017/S1740925X05000190
Luciani, D., Gwiazda, K., Yang, T., Kalynyak, T., Bychkivska, Y., Frey, M., et al. (2009). Roles of IP3R and RyR Ca2+ channels in endoplasmic reticulum stress and β-cell death. Diabetes 58, 422–432. doi: 10.2337/db07-1762
MacLennan, D. H., Rice, W. J., and Green, N. M. (1997). The mechanism of Ca2+ transport by sarco(endo)plasmic reticulum Ca2+-ATPases. J. Biol. Chem. 272, 28815–28818. doi: 10.1074/jbc.272.46.28815
Malarkey, E., Ni, Y., and Parpura, V. (2008). Ca2+ entry through trpc1 channels contributes to intracellular Ca2+ dynamics and consequent glutamate release from rat astrocytes. Glia 56, 821–835. doi: 10.1002/glia.20656
Nedergaard, M., and Verkhratsky, A. (2012). Artifact versus reality–how astrocytes contribute to synaptic events. Glia 60, 1013–1023. doi: 10.1002/glia.22288
Nezu, A., Tanimura, A., Morita, T., and Tojyo, Y. (2010). Use of fluorescence resonance energy visualization of Ins(1,4,5)P3 dynamics in living cells: two distinct pathways for Ins(1,4,5)P3 generation following mechanical stimulation of HSY-EA1 cells. J. Cell Sci. 123, 2292–2298. doi: 10.1242/jcs.064410
Otsu, Y., Couchman, K., Lyons, D. G., Collot, M., Agarwal, A., Mallet, J. M., et al. (2015). Calcium dynamics in astrocyte processes during neurovascular coupling. Nat. Neurosci. 18, 210–218. doi: 10.1038/nn.3906
Pasti, L., Pozzan, T., and Carmignoto, G. (1995). Long-lasting changes of calcium oscillations in astrocytes. a new form of glutamate-mediated plasticity. J. Cell Sci. 270, 15203–15210.
Petravicz, J., Fiacco, T. A., and McCarthy, K. D. (2008). Loss of IP3R-dependent Ca2+ increases in hippocampal astrocytes does not affect baseline CA1 pyramidal neuron synaptic activity. J. Neurosci. 28, 4967–4973. doi: 10.1523/JNEUROSCI.5572-07.2008
Pivneva, T., Haas, B., Reyes-Haro, D., Laube, G., Veh, R. W., Nolte, C., et al. (2008). Store-operated Ca2+ entry in astrocytes: different spatial arrangement of endoplasmic reticulum explains functional diversity in vitro and in situ. Cell Calcium 43, 591–601. doi: 10.1016/j.ceca.2007.10.004
Politi, A., Gaspers, L. D., Thomas, A. P., and Höfer, T. (2006). Models of IP3 and Ca2+ Oscillations: frequency encoding and identification of underlying feedbacks. Biophys. J. 90, 3120–3133. doi: 10.1529/biophysj.105.072249
Seidel, J. L., Escartin, C., Ayata, C., Bonvento, G., and Shuttleworth, C. W. (2015). Multifaceted roles for astrocytes in spreading depolarization: a target for limiting spreading depolarization in acute brain injury? Glia 64, 5–20. doi: 10.1002/glia.22824
Sergeeva, M., Strokin, M., Wang, H., Ubl, J. J., and Reiser, G. (2003). Arachidonic acid in astrocytes blocks Ca2+ oscillations by inhibiting store-operated Ca2+ entry, and causes delayed Ca2+ influx. Cell Calcium 33, 283–292. doi: 10.1016/S0143-4160(03)00011-3
Sergeeva, M., Ubl, J. J., and Reiser, G. (2000). Disruption of actin cytoskeleton in cultured rat astrocytes suppresses ATP- and bradikinin-induced [Ca2+]i oscillations by reducing the coupling efficiency between Ca2+ release, capacitative Ca2+ entry, and store refilling. Neuroscience 97, 765–769. doi: 10.1016/S0306-4522(00)00062-2
Skupin, A., Kettenmann, H., and Falcke, M. (2010). Calcium signals driven by single channel noise. PLoS Comput. Biol. 6:1000870. doi: 10.1371/journal.pcbi.1000870
Skupin, A., Kettenmann, H., Winkler, U., Wartenberg, M., Sauer, H., Tovey, S. C., et al. (2008). How does intracellular Ca2+ oscillate: by chance or by the clock? Biophys. J. 94, 2404–2411. doi: 10.1529/biophysj.107.119495
Srinivasan, R., Huang, B., Venugopal, S., Johnston, A. D., Chai, H., Zeng, H., et al. (2015). Ca2+ signaling in astrocytes from IP3R2−−/−− mice in brain slices and during startle responses in vivo. Nat. Neurosci. 18, 708–717. doi: 10.1038/nn.4001
Tang, W., Szokol, K., Jensen, V., Enger, R., Trivedi, C. A., Hvalby, O., et al. (2015). Stimulation-evoked Ca2+ signals in astrocytic processes at hippocampal CA3/CA1 synapses of adult mice are modulated by glutamate and ATP. J. Neurosci. 7, 3016–3021. doi: 10.1523/JNEUROSCI.3319-14.2015
Tanimura, A., Morita, T., Nezu, A., Shitara, A., Hashimoto, N., and Tojyo, Y. (2009). Use of fluorescence resonance energy transfer-based biosensors for the quantitative analysis of inositol 1,4,5-trisphosphate dynamics in calcium oscillations. J. Biol. Chem. 284, 8910–8917. doi: 10.1074/jbc.M805865200
Toivari, E., Manninen, T., Nahata, A. K., Jalonen, T. O., and Linne, M. L. (2011). Effects of transmitters and amyloid-beta peptide on calcium signals in rat cortical astrocytes: Fura-2AM measurements and stochastic model simulations. PLoS ONE 6:e17914. doi: 10.1371/journal.pone.0017914
Ullah, G., Jung, P., and Cornell-Bell, A. H. (2006)., Anti-phase calcium oscillations in astrocytes via inositol (1,4,5)-trisphosphate regeneration. Cell Calcium 39, 197–208. doi: 10.1016/j.ceca.2005.10.009
Verkhratsky, A., and Butt, A. (2007). Glial Neurobiology: A Textbook, chapter General Physiology of Glial Cells. Chichester: John Wiley & Sons, Ltd.
Verkhratsky, A., and Kettenmann, H. (1996). Calcium signalling in glial cells. Trend Neurosci. 19, 346–352. doi: 10.1016/0166-2236(96)10048-5
Verkhratsky, A., Rodríguez, J., and Parpura, V. (2012a). Calcium signaling in astroglia. molecular and cellular endocrinology. Mol. Cell Endocrinol. 353, 45–56. doi: 10.1016/j.mce.2011.08.039
Verkhratsky, A., Sofroniew, M. V., Messing, A., deLanerolle, N. C., Rempe, D., Rodríguez, J. J., et al. (2012b). Neurological diseases as primary gliopathies: a reassessment of neurocentrism. ASN Neuro 4, e00082. doi: 10.1042/AN20120010
Wallraf, A., Kohling, R., Heinemann, U., Theis, M., Willecke, K., and Steinhauser, C. (2006). The impact of astrocytic gap junctional coupling on potassium buffering in the hippocampus. J. Neurosci. 26, 5438–5447. doi: 10.1523/JNEUROSCI.0037-06.2006
Wang, F., Smith, N. A., Xu, Q., Fujita, T., Baba, A., Matsuda, T., et al. (2012). Astrocytes modulate neural network activity by Ca2+ - dependent uptake. Sci. Signal. 5:ra26. doi: 10.1126/scisignal.2002334
Wang, F., Smith, N. A., Xu, Q., Goldman, S., Peng, W., Huang, J. H., et al. (2013). Photolysis of caged Ca2+ but not receptor-mediated Ca2+ signaling triggers astrocytic glutamate release. J. Neurosci. 33, 17404–17412. doi: 10.1523/JNEUROSCI.2178-13.2013
Wang, T. F., Zhou, C., Tang, A. H., Wang, S. Q., and Chai, Z. (2006). Cellular mechanism for spontaneous calcium oscillations in astrocytes. Acta Pharmacol. Sin. 27, 861–868. doi: 10.1111/j.1745-7254.2006.00397.x
Xie, A. X., Sun, M. Y., Murphy, T., Lauderdale, K., Tiglao, E., and Fiacco, T. A. (2012). Bidirectional scaling of astrocytic metabotropic glutamate receptor signaling following long-term changes in neuronal firing rates. PLoS ONE 7:49637. doi: 10.1371/journal.pone.0049637
Keywords: glia, calcium imaging, GPCR, IP3, computational neuroscience
Citation: Taheri M, Handy G, Borisyuk A and White JA (2017) Diversity of Evoked Astrocyte Ca2+ Dynamics Quantified through Experimental Measurements and Mathematical Modeling. Front. Syst. Neurosci. 11:79. doi: 10.3389/fnsys.2017.00079
Received: 01 August 2017; Accepted: 04 October 2017;
Published: 23 October 2017.
Edited by:
Charles J. Wilson, University of Texas at San Antonio, United StatesReviewed by:
James Sneyd, University of Auckland, New ZealandDavid Terman, Ohio State University Columbus, United States
Copyright © 2017 Taheri, Handy, Borisyuk and White. This is an open-access article distributed under the terms of the Creative Commons Attribution License (CC BY). The use, distribution or reproduction in other forums is permitted, provided the original author(s) or licensor are credited and that the original publication in this journal is cited, in accordance with accepted academic practice. No use, distribution or reproduction is permitted which does not comply with these terms.
*Correspondence: Alla Borisyuk, borisyuk@math.utah.edu
John A. White, jwhite@bu.edu
†Co-first authors.